The United States has long been the leading global military spender. America’s defense budget topped $997 billion in 2024 alone, more than three times China’s military budget, which is the second largest in the world. Much of the Pentagon’s nearly $1 trillion in annual spending goes toward weapons procurement and research and development of military technology. These investments are intended to better prepare the U.S. for any potential future conflict and to act as a deterrent against threats of aggression from geopolitical rivals.
They are also a boon for the U.S. economy. One of the largest employers in the world, the Department of Defense has nearly 2.9 million Americans on payroll, including 1.3 million active duty troops. Compensation alone for DOD personnel — whether civilians, reservists, or active duty — totaled $167.4 billion in fiscal 2023, the latest year of available data.
The bulk of American military spending — $431.4 billion in 2023 — goes to private sector contractors hired by the government to develop and manufacture weapons and materiel for the armed services. Each of the five largest military contractors in the world by arms sales revenue is an American company, and 41 of the world’s 100 largest military contractors are headquartered in the United States.
With millions of active duty service members and employees, along with hundreds of thousands of Americans working for military contractors, the defense industry is an economic pillar in the United States, accounting for 2.2% of annual gross domestic product. In some parts of the country, the military is even more important to the local economy.
Using data from the DOD report Defense Spending by State for the 2023 fiscal year, 24/7 Wall St. identified the states with the largest military economies. States are ranked on combined Pentagon spending as a share of the state’s GDP. Defense spending by state is the combined sum of expenditures on contractors, grants, and payroll for active duty troops, civilian employees, and reservists, including the National Guard. Supplemental DOD data on the number of military personnel stationed in each state is current as of June 2025. All other data in this story is from the Defense Spending by State report, and is current as of fiscal 2023.
Across the 50 states, annual DOD spending ranges from about $600 million to well over $60 billion. This level of investment represents anywhere from 0.5% to 9.7% of gross domestic product, depending on the state.
The relative importance of the U.S. military to state economies is a product of two factors: local military spending and the size of the local economy. As a result, high military spending in a given state is not necessarily indicative of the military’s economic importance.
California, for example, received $60.8 billion from the Pentagon in 2023, the third most of any state. However, because California also has the largest economy of the 50 states, defense spending accounts for only 1.6% of its GDP. In contrast, the DOD spent only $4.7 billion in Alaska in 2023 — less than one-twelfth of what California received — but those expenditures accounted for a near nation-leading 7.0% of Alaska’s GDP.
These are the states with the largest military economies.
Why It Matters
The United States has been the world’s preeminent military superpower for decades. To maintain military dominance, the U.S. spends more on defense than any other country in the world by a wide margin. While the size of the American defense budget is ostensibly justified by geopolitical concerns, it has also become a key component of the U.S. economy, funneling hundreds of billions of dollars into local communities each year.
50. Minnesota
- In-state Defense Dept. spending: 0.5% of state GDP ($2.4 billion)
- In-state Defense Dept. spending per capita: $415
- In-state Defense Dept. spending on military contractors: $1.5 billion
- In-state Defense Dept. spending on military payroll: $700 million
- In-state Defense Dept. spending on military grants: $208.9 million
- Military personnel stationed in state: 20,595 (3.1% active duty)
49. Oregon
- In-state Defense Dept. spending: 0.5% of state GDP ($1.6 billion)
- In-state Defense Dept. spending per capita: $389
- In-state Defense Dept. spending on military contractors: $1.0 billion
- In-state Defense Dept. spending on military payroll: $600 million
- In-state Defense Dept. spending on military grants: $67.8 million
- Military personnel stationed in state: 12,413 (12.1% active duty)
48. New York
- In-state Defense Dept. spending: 0.7% of state GDP ($15.2 billion)
- In-state Defense Dept. spending per capita: $777
- In-state Defense Dept. spending on military contractors: $11.7 billion
- In-state Defense Dept. spending on military payroll: $3.1 billion
- In-state Defense Dept. spending on military grants: $372.4 million
- Military personnel stationed in state: 58,132 (30.8% active duty)
47. Idaho

- In-state Defense Dept. spending: 0.7% of state GDP ($900 million)
- In-state Defense Dept. spending per capita: $449
- In-state Defense Dept. spending on military contractors: $300 million
- In-state Defense Dept. spending on military payroll: $500 million
- In-state Defense Dept. spending on military grants: $91.1 million
- Military personnel stationed in state: 10,283 (33.4% active duty)
46. Tennessee

- In-state Defense Dept. spending: 0.8% of state GDP ($4.0 billion)
- In-state Defense Dept. spending per capita: $557
- In-state Defense Dept. spending on military contractors: $2.6 billion
- In-state Defense Dept. spending on military payroll: $1.2 billion
- In-state Defense Dept. spending on military grants: $129.3 million
- Military personnel stationed in state: 27,485 (9.1% active duty)
45. Delaware

- In-state Defense Dept. spending: 0.8% of state GDP ($800 million)
- In-state Defense Dept. spending per capita: $741
- In-state Defense Dept. spending on military contractors: $200 million
- In-state Defense Dept. spending on military payroll: $500 million
- In-state Defense Dept. spending on military grants: $57.3 million
- Military personnel stationed in state: 9,662 (35.5% active duty)
44. Illinois
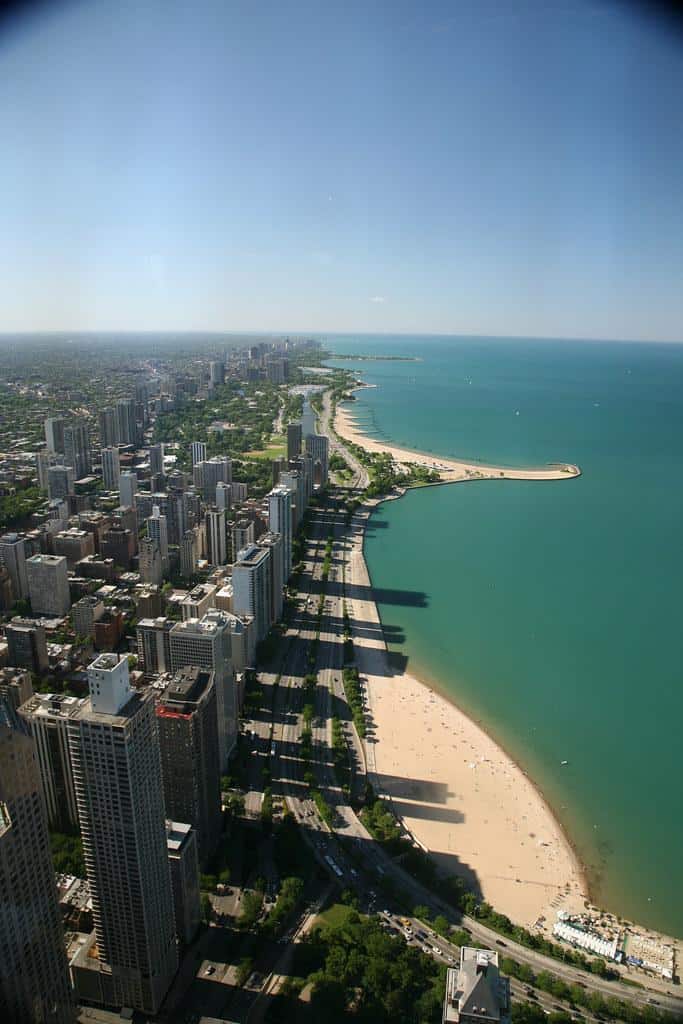
- In-state Defense Dept. spending: 1.0% of state GDP ($10.5 billion)
- In-state Defense Dept. spending per capita: $838
- In-state Defense Dept. spending on military contractors: $7.8 billion
- In-state Defense Dept. spending on military payroll: $2.5 billion
- In-state Defense Dept. spending on military grants: $182.7 million
- Military personnel stationed in state: 58,344 (39.9% active duty)
43. Arkansas
![Good morning [Image 6 of 8] by DVIDSHUB](https://live.staticflickr.com/6146/5988025296_a155c27ecf_b.jpg "Good morning [Image 6 of 8] by DVIDSHUB")
- In-state Defense Dept. spending: 1.0% of state GDP ($1.7 billion)
- In-state Defense Dept. spending per capita: $570
- In-state Defense Dept. spending on military contractors: $900 million
- In-state Defense Dept. spending on military payroll: $800 million
- In-state Defense Dept. spending on military grants: $84.5 million
- Military personnel stationed in state: 18,017 (20.5% active duty)
42. New Jersey

- In-state Defense Dept. spending: 1.1% of state GDP ($8.5 billion)
- In-state Defense Dept. spending per capita: $918
- In-state Defense Dept. spending on military contractors: $6.3 billion
- In-state Defense Dept. spending on military payroll: $2.1 billion
- In-state Defense Dept. spending on military grants: $91.7 million
- Military personnel stationed in state: 35,085 (22.4% active duty)
41. Montana
- In-state Defense Dept. spending: 1.1% of state GDP ($800 million)
- In-state Defense Dept. spending per capita: $714
- In-state Defense Dept. spending on military contractors: $300 million
- In-state Defense Dept. spending on military payroll: $400 million
- In-state Defense Dept. spending on military grants: $79.3 million
- Military personnel stationed in state: 8,841 (38.8% active duty)
40. Wisconsin

- In-state Defense Dept. spending: 1.2% of state GDP ($4.8 billion)
- In-state Defense Dept. spending per capita: $811
- In-state Defense Dept. spending on military contractors: $4.1 billion
- In-state Defense Dept. spending on military payroll: $600 million
- In-state Defense Dept. spending on military grants: $139.1 million
- Military personnel stationed in state: 16,148 (6.4% active duty)
39. Wyoming

- In-state Defense Dept. spending: 1.2% of state GDP ($600 million)
- In-state Defense Dept. spending per capita: $1,026
- In-state Defense Dept. spending on military contractors: $200 million
- In-state Defense Dept. spending on military payroll: $400 million
- In-state Defense Dept. spending on military grants: $73.2 million
- Military personnel stationed in state: 7,282 (43.8% active duty)
38. Michigan

- In-state Defense Dept. spending: 1.2% of state GDP ($8.1 billion)
- In-state Defense Dept. spending per capita: $808
- In-state Defense Dept. spending on military contractors: $5.9 billion
- In-state Defense Dept. spending on military payroll: $1.5 billion
- In-state Defense Dept. spending on military grants: $695.5 million
- Military personnel stationed in state: 25,417 (8.0% active duty)
37. Indiana
- In-state Defense Dept. spending: 1.3% of state GDP ($6.4 billion)
- In-state Defense Dept. spending per capita: $940
- In-state Defense Dept. spending on military contractors: $4.7 billion
- In-state Defense Dept. spending on military payroll: $1.6 billion
- In-state Defense Dept. spending on military grants: $212.1 million
- Military personnel stationed in state: 29,110 (3.7% active duty)
36. Louisiana
![u2018Weu2019re readyu2019 [Image 2 of 3] by DVIDSHUB](https://live.staticflickr.com/3234/5737098258_cbd75fef2b_b.jpg "u2018Weu2019re readyu2019 [Image 2 of 3] by DVIDSHUB")
- In-state Defense Dept. spending: 1.3% of state GDP ($4.0 billion)
- In-state Defense Dept. spending per capita: $883
- In-state Defense Dept. spending on military contractors: $2.1 billion
- In-state Defense Dept. spending on military payroll: $1.8 billion
- In-state Defense Dept. spending on military grants: $122.1 million
- Military personnel stationed in state: 36,375 (38.4% active duty)
35. Vermont

- In-state Defense Dept. spending: 1.3% of state GDP ($600 million)
- In-state Defense Dept. spending per capita: $891
- In-state Defense Dept. spending on military contractors: $400 million
- In-state Defense Dept. spending on military payroll: $200 million
- In-state Defense Dept. spending on military grants: $41.1 million
- Military personnel stationed in state: 3,554 (4.1% active duty)
34. Ohio

- In-state Defense Dept. spending: 1.3% of state GDP ($11.7 billion)
- In-state Defense Dept. spending per capita: $995
- In-state Defense Dept. spending on military contractors: $7.7 billion
- In-state Defense Dept. spending on military payroll: $3.8 billion
- In-state Defense Dept. spending on military grants: $232.7 million
- Military personnel stationed in state: 59,569 (11.7% active duty)
33. Iowa
- In-state Defense Dept. spending: 1.4% of state GDP ($3.4 billion)
- In-state Defense Dept. spending per capita: $1,055
- In-state Defense Dept. spending on military contractors: $2.9 billion
- In-state Defense Dept. spending on military payroll: $400 million
- In-state Defense Dept. spending on military grants: $90.0 million
- Military personnel stationed in state: 12,626 (1.7% active duty)
32. Nevada
- In-state Defense Dept. spending: 1.4% of state GDP ($3.3 billion)
- In-state Defense Dept. spending per capita: $1,031
- In-state Defense Dept. spending on military contractors: $1.8 billion
- In-state Defense Dept. spending on military payroll: $1.4 billion
- In-state Defense Dept. spending on military grants: $61.0 million
- Military personnel stationed in state: 22,572 (52.0% active duty)
31. South Dakota

- In-state Defense Dept. spending: 1.4% of state GDP ($1.0 billion)
- In-state Defense Dept. spending per capita: $1,093
- In-state Defense Dept. spending on military contractors: $500 million
- In-state Defense Dept. spending on military payroll: $400 million
- In-state Defense Dept. spending on military grants: $57.5 million
- Military personnel stationed in state: 9,128 (35.6% active duty)
30. Nebraska

- In-state Defense Dept. spending: 1.4% of state GDP ($2.5 billion)
- In-state Defense Dept. spending per capita: $1,264
- In-state Defense Dept. spending on military contractors: $1.4 billion
- In-state Defense Dept. spending on military payroll: $1.0 billion
- In-state Defense Dept. spending on military grants: $61.1 million
- Military personnel stationed in state: 16,315 (39.2% active duty)
29. North Dakota

- In-state Defense Dept. spending: 1.5% of state GDP ($1.1 billion)
- In-state Defense Dept. spending per capita: $1,418
- In-state Defense Dept. spending on military contractors: $400 million
- In-state Defense Dept. spending on military payroll: $700 million
- In-state Defense Dept. spending on military grants: $57.3 million
- Military personnel stationed in state: 13,417 (54.0% active duty)
28. California

- In-state Defense Dept. spending: 1.6% of state GDP ($60.8 billion)
- In-state Defense Dept. spending per capita: $1,561
- In-state Defense Dept. spending on military contractors: $41.2 billion
- In-state Defense Dept. spending on military payroll: $18.2 billion
- In-state Defense Dept. spending on military grants: $1,352.7 billion
- Military personnel stationed in state: 276,343 (57.9% active duty)
27. North Carolina
- In-state Defense Dept. spending: 1.6% of state GDP ($12.5 billion)
- In-state Defense Dept. spending per capita: $1,150
- In-state Defense Dept. spending on military contractors: $4.4 billion
- In-state Defense Dept. spending on military payroll: $7.8 billion
- In-state Defense Dept. spending on military grants: $281.4 million
- Military personnel stationed in state: 138,894 (68.7% active duty)
26. Kansas
- In-state Defense Dept. spending: 1.7% of state GDP ($3.9 billion)
- In-state Defense Dept. spending per capita: $1,328
- In-state Defense Dept. spending on military contractors: $1.6 billion
- In-state Defense Dept. spending on military payroll: $2.2 billion
- In-state Defense Dept. spending on military grants: $121.6 million
- Military personnel stationed in state: 35,522 (54.0% active duty)
25. West Virginia
![Top-level Marine instructors use martial arts workshop to renew, re-certify ethical warriors [Image 3 of 3] by DVIDSHUB](https://live.staticflickr.com/5266/5622935584_f1cb4ec6d4_b.jpg "Top-level Marine instructors use martial arts workshop to renew, re-certify ethical warriors [Image 3 of 3] by DVIDSHUB")
- In-state Defense Dept. spending: 1.8% of state GDP ($1.8 billion)
- In-state Defense Dept. spending per capita: $1,036
- In-state Defense Dept. spending on military contractors: $1.4 billion
- In-state Defense Dept. spending on military payroll: $400 million
- In-state Defense Dept. spending on military grants: $66.6 million
- Military personnel stationed in state: 9,122 (1.8% active duty)
24. Georgia
- In-state Defense Dept. spending: 1.9% of state GDP ($15.3 billion)
- In-state Defense Dept. spending per capita: $1,391
- In-state Defense Dept. spending on military contractors: $7.6 billion
- In-state Defense Dept. spending on military payroll: $7.5 billion
- In-state Defense Dept. spending on military grants: $178.8 million
- Military personnel stationed in state: 126,879 (51.4% active duty)
23. Washington

- In-state Defense Dept. spending: 1.9% of state GDP ($15.5 billion)
- In-state Defense Dept. spending per capita: $1,982
- In-state Defense Dept. spending on military contractors: $7.6 billion
- In-state Defense Dept. spending on military payroll: $7.7 billion
- In-state Defense Dept. spending on military grants: $223.0 million
- Military personnel stationed in state: 106,436 (54.0% active duty)
22. South Carolina
- In-state Defense Dept. spending: 2.0% of state GDP ($6.5 billion)
- In-state Defense Dept. spending per capita: $1,211
- In-state Defense Dept. spending on military contractors: $3.2 billion
- In-state Defense Dept. spending on military payroll: $3.3 billion
- In-state Defense Dept. spending on military grants: $76.5 million
- Military personnel stationed in state: 66,317 (56.3% active duty)
21. Florida
- In-state Defense Dept. spending: 2.0% of state GDP ($32.3 billion)
- In-state Defense Dept. spending per capita: $1,427
- In-state Defense Dept. spending on military contractors: $22.9 billion
- In-state Defense Dept. spending on military payroll: $8.9 billion
- In-state Defense Dept. spending on military grants: $373.5 million
- Military personnel stationed in state: 137,922 (48.3% active duty)
20. Pennsylvania
- In-state Defense Dept. spending: 2.3% of state GDP ($21.8 billion)
- In-state Defense Dept. spending per capita: $1,682
- In-state Defense Dept. spending on military contractors: $18.2 billion
- In-state Defense Dept. spending on military payroll: $3.2 billion
- In-state Defense Dept. spending on military grants: $416.4 million
- Military personnel stationed in state: 52,897 (4.4% active duty)
19. Rhode Island
- In-state Defense Dept. spending: 2.3% of state GDP ($1.8 billion)
- In-state Defense Dept. spending per capita: $1,600
- In-state Defense Dept. spending on military contractors: $600 million
- In-state Defense Dept. spending on military payroll: $1.0 billion
- In-state Defense Dept. spending on military grants: $117.9 million
- Military personnel stationed in state: 13,386 (28.2% active duty)
18. New Hampshire

- In-state Defense Dept. spending: 2.3% of state GDP ($2.5 billion)
- In-state Defense Dept. spending per capita: $1,799
- In-state Defense Dept. spending on military contractors: $2.1 billion
- In-state Defense Dept. spending on military payroll: $300 million
- In-state Defense Dept. spending on military grants: $60.8 million
- Military personnel stationed in state: 6,193 (20.3% active duty)
17. Massachusetts
- In-state Defense Dept. spending: 2.3% of state GDP ($16.8 billion)
- In-state Defense Dept. spending per capita: $2,400
- In-state Defense Dept. spending on military contractors: $15.0 billion
- In-state Defense Dept. spending on military payroll: $1.3 billion
- In-state Defense Dept. spending on military grants: $530.2 million
- Military personnel stationed in state: 24,247 (14.9% active duty)
16. Colorado

- In-state Defense Dept. spending: 2.4% of state GDP ($12.6 billion)
- In-state Defense Dept. spending per capita: $2,142
- In-state Defense Dept. spending on military contractors: $8.4 billion
- In-state Defense Dept. spending on military payroll: $4.0 billion
- In-state Defense Dept. spending on military grants: $206.6 million
- Military personnel stationed in state: 61,413 (58.5% active duty)
15. Texas
- In-state Defense Dept. spending: 2.8% of state GDP ($71.6 billion)
- In-state Defense Dept. spending per capita: $2,346
- In-state Defense Dept. spending on military contractors: $58.7 billion
- In-state Defense Dept. spending on military payroll: $12.5 billion
- In-state Defense Dept. spending on military grants: $393.2 million
- Military personnel stationed in state: 219,797 (52.5% active duty)
14. Oklahoma
- In-state Defense Dept. spending: 2.9% of state GDP ($7.3 billion)
- In-state Defense Dept. spending per capita: $1,808
- In-state Defense Dept. spending on military contractors: $3.7 billion
- In-state Defense Dept. spending on military payroll: $3.6 billion
- In-state Defense Dept. spending on military grants: $84.9 million
- Military personnel stationed in state: 59,247 (34.6% active duty)
13. Utah

- In-state Defense Dept. spending: 3.1% of state GDP ($8.6 billion)
- In-state Defense Dept. spending per capita: $2,510
- In-state Defense Dept. spending on military contractors: $6.5 billion
- In-state Defense Dept. spending on military payroll: $2.0 billion
- In-state Defense Dept. spending on military grants: $52.0 million
- Military personnel stationed in state: 32,532 (13.7% active duty)
12. Missouri
- In-state Defense Dept. spending: 3.2% of state GDP ($13.3 billion)
- In-state Defense Dept. spending per capita: $2,152
- In-state Defense Dept. spending on military contractors: $11.6 billion
- In-state Defense Dept. spending on military payroll: $1.7 billion
- In-state Defense Dept. spending on military grants: $61.7 million
- Military personnel stationed in state: 39,440 (38.5% active duty)
11. Arizona
- In-state Defense Dept. spending: 3.3% of state GDP ($17.0 billion)
- In-state Defense Dept. spending per capita: $2,285
- In-state Defense Dept. spending on military contractors: $14.5 billion
- In-state Defense Dept. spending on military payroll: $2.3 billion
- In-state Defense Dept. spending on military grants: $142.9 million
- Military personnel stationed in state: 39,083 (41.2% active duty)
10. New Mexico

- In-state Defense Dept. spending: 3.6% of state GDP ($4.6 billion)
- In-state Defense Dept. spending per capita: $2,198
- In-state Defense Dept. spending on military contractors: $2.9 billion
- In-state Defense Dept. spending on military payroll: $1.6 billion
- In-state Defense Dept. spending on military grants: $126.7 million
- Military personnel stationed in state: 24,526 (55.5% active duty)
9. Maine
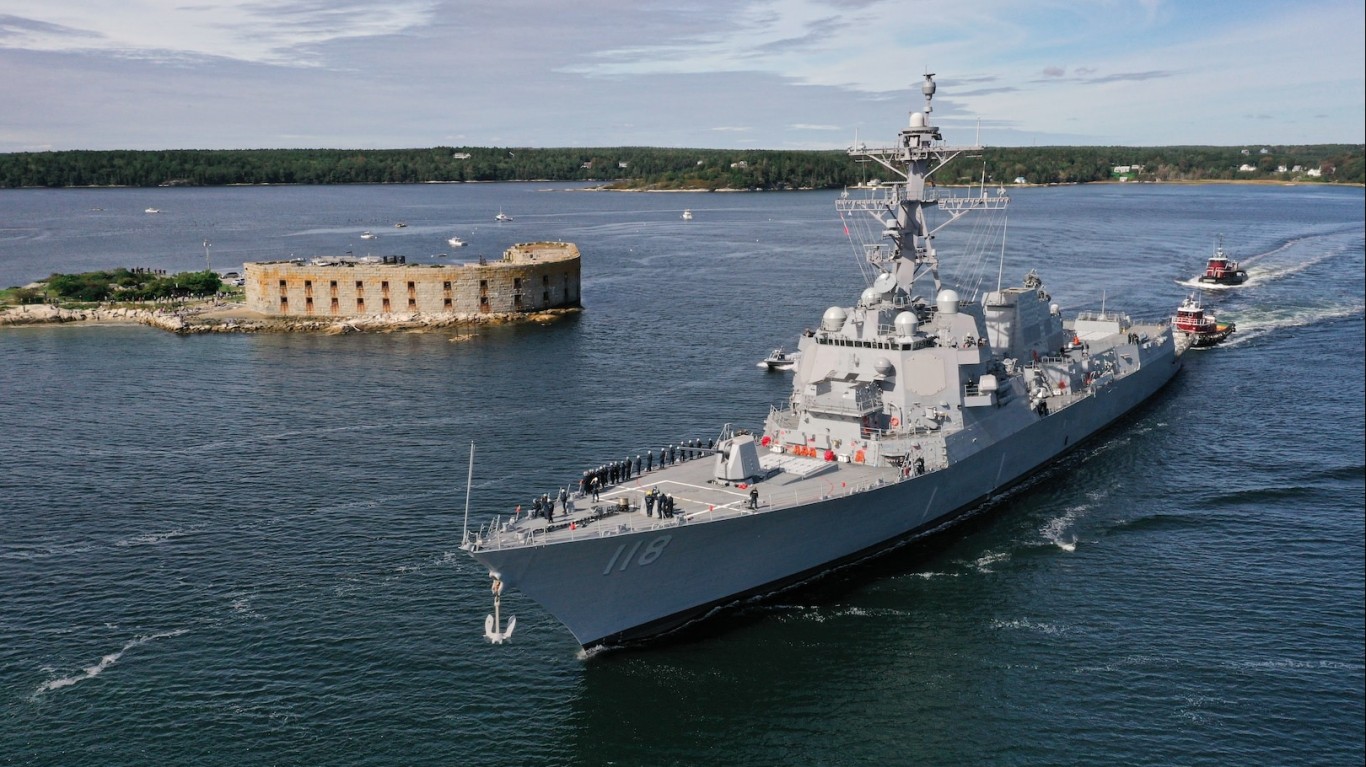
- In-state Defense Dept. spending: 4.6% of state GDP ($4.2 billion)
- In-state Defense Dept. spending per capita: $3,017
- In-state Defense Dept. spending on military contractors: $3.3 billion
- In-state Defense Dept. spending on military payroll: $900 million
- In-state Defense Dept. spending on military grants: $34.7 million
- Military personnel stationed in state: 13,007 (5.2% active duty)
8. Alabama

- In-state Defense Dept. spending: 4.8% of state GDP ($14.4 billion)
- In-state Defense Dept. spending per capita: $2,815
- In-state Defense Dept. spending on military contractors: $10.4 billion
- In-state Defense Dept. spending on military payroll: $3.6 billion
- In-state Defense Dept. spending on military grants: $345.3 million
- Military personnel stationed in state: 51,691 (16.4% active duty)
7. Kentucky

- In-state Defense Dept. spending: 5.2% of state GDP ($14.6 billion)
- In-state Defense Dept. spending per capita: $3,215
- In-state Defense Dept. spending on military contractors: $11.1 billion
- In-state Defense Dept. spending on military payroll: $3.3 billion
- In-state Defense Dept. spending on military grants: $176.6 million
- Military personnel stationed in state: 52,243 (59.4% active duty)
6. Maryland

- In-state Defense Dept. spending: 5.4% of state GDP ($27.8 billion)
- In-state Defense Dept. spending per capita: $4,491
- In-state Defense Dept. spending on military contractors: $18.3 billion
- In-state Defense Dept. spending on military payroll: $8.7 billion
- In-state Defense Dept. spending on military grants: $781.9 million
- Military personnel stationed in state: 95,595 (31.7% active duty)
5. Mississippi
- In-state Defense Dept. spending: 6.1% of state GDP ($8.9 billion)
- In-state Defense Dept. spending per capita: $3,043
- In-state Defense Dept. spending on military contractors: $7.0 billion
- In-state Defense Dept. spending on military payroll: $1.8 billion
- In-state Defense Dept. spending on military grants: $128.9 million
- Military personnel stationed in state: 36,118 (33.9% active duty)
4. Alaska

- In-state Defense Dept. spending: 7.0% of state GDP ($4.7 billion)
- In-state Defense Dept. spending per capita: $6,405
- In-state Defense Dept. spending on military contractors: $2.4 billion
- In-state Defense Dept. spending on military payroll: $2.2 billion
- In-state Defense Dept. spending on military grants: $105.3 million
- Military personnel stationed in state: 30,401 (68.0% active duty)
3. Connecticut
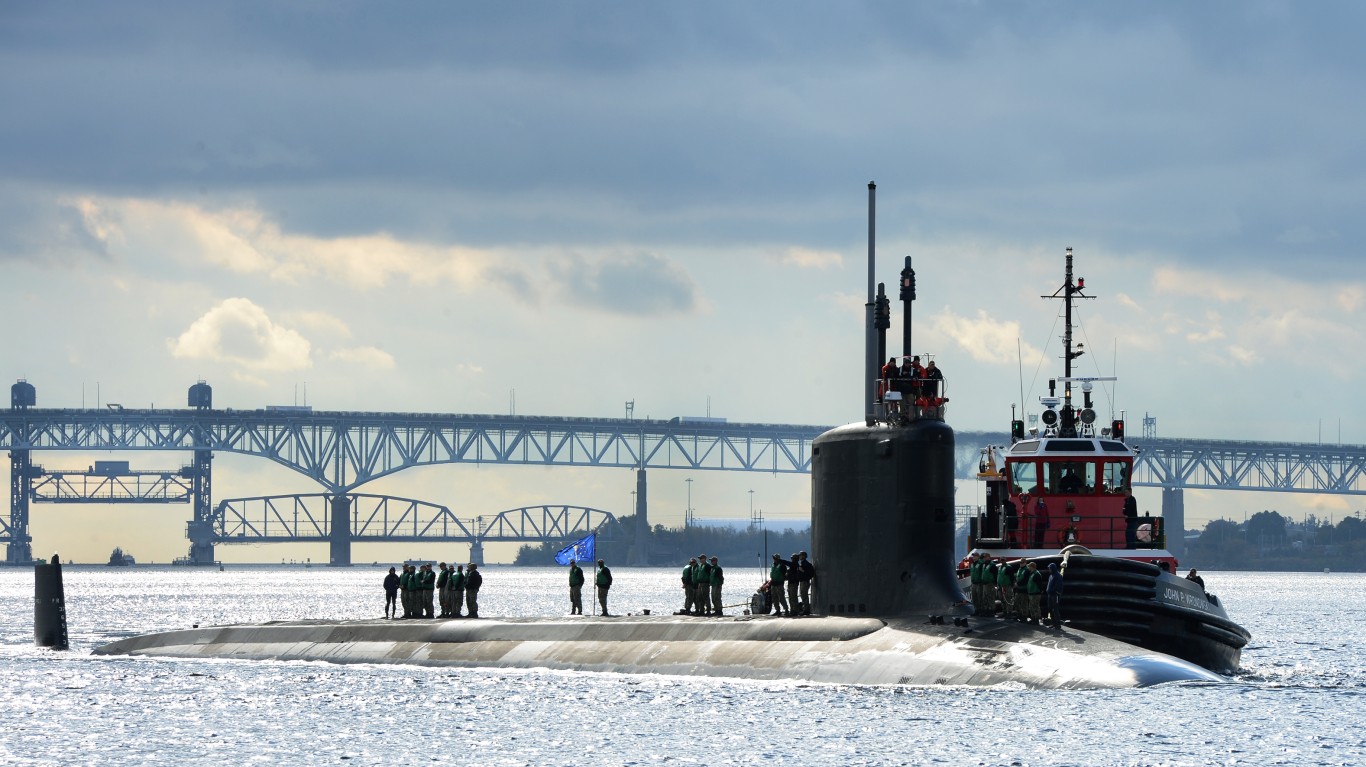
- In-state Defense Dept. spending: 7.4% of state GDP ($25.3 billion)
- In-state Defense Dept. spending per capita: $6,986
- In-state Defense Dept. spending on military contractors: $24.3 billion
- In-state Defense Dept. spending on military payroll: $800 million
- In-state Defense Dept. spending on military grants: $127.5 million
- Military personnel stationed in state: 15,750 (42.3% active duty)
2. Hawaii
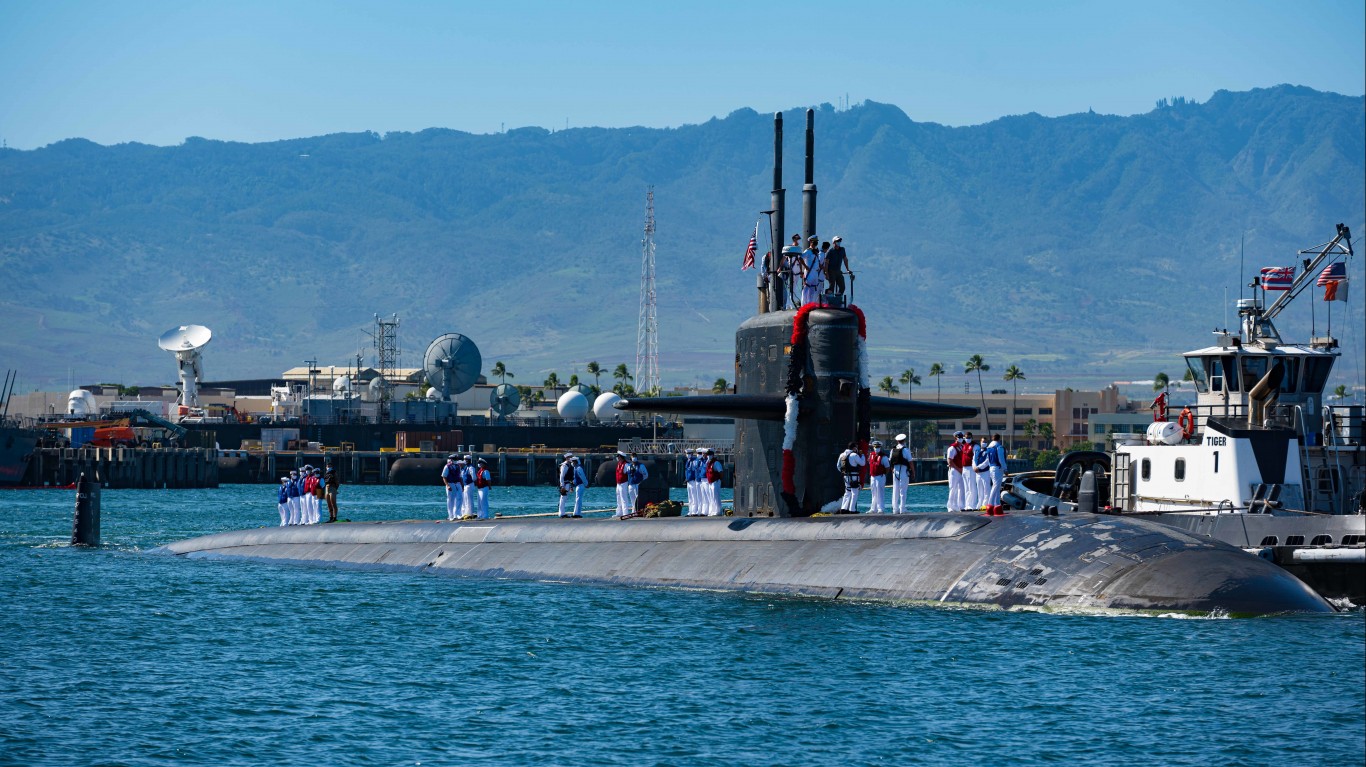
- In-state Defense Dept. spending: 9.2% of state GDP ($10.0 billion)
- In-state Defense Dept. spending per capita: $6,943
- In-state Defense Dept. spending on military contractors: $3.6 billion
- In-state Defense Dept. spending on military payroll: $6.2 billion
- In-state Defense Dept. spending on military grants: $143.7 million
- Military personnel stationed in state: 75,486 (60.2% active duty)
1. Virginia

- In-state Defense Dept. spending: 9.7% of state GDP ($68.5 billion)
- In-state Defense Dept. spending per capita: $7,862
- In-state Defense Dept. spending on military contractors: $46.8 billion
- In-state Defense Dept. spending on military payroll: $21.3 billion
- In-state Defense Dept. spending on military grants: $404.8 million
- Military personnel stationed in state: 249,011 (49.1% active duty)