In a December 2023 hearing before the Senate Judiciary Committee, FBI Director Christopher Wray identified violent domestic extremism as the top terrorism threat facing the United States. Between the Spring of 2020 and November 2023, the FBI’s domestic terrorism caseload more than doubled to 2,700 active investigations. Typically, these cases involve individuals or groups using violence to advance social or political agendas — agendas that are often rooted in anti-government sentiment or prejudicial bias toward certain races, ethnicities, sexual identities, or religions.
The ideologies that motivate hate crimes and certain acts of domestic terrorism are being propagated by extremist groups across the country — and the number of these groups has grown considerably in recent years. According to the nonprofit legal advocacy group Southern Poverty Law Center, there were 1,430 active hate and anti-government extremist groups nationwide in 2023, a 17% increase from 2022.
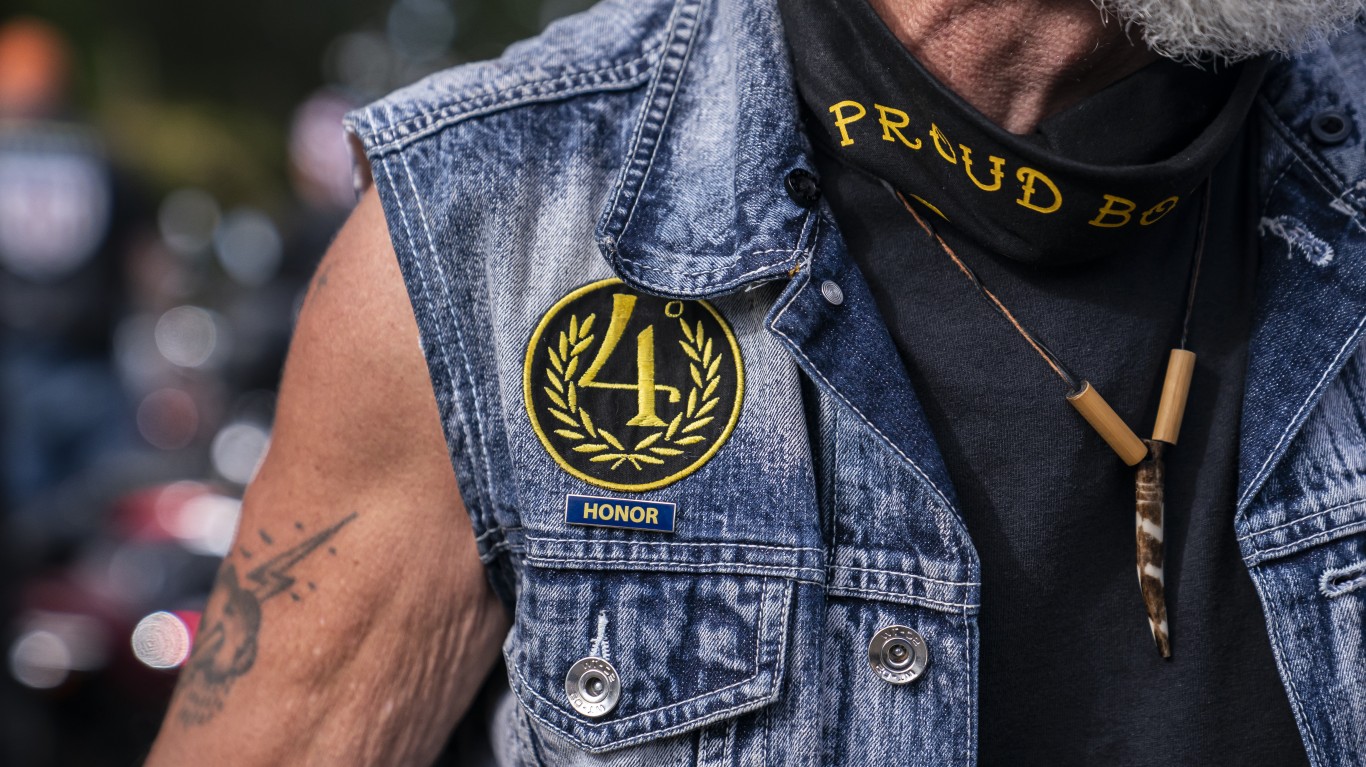
Active extremist groups include those with decades-long histories in the United States, like the Nation of Islam and the Ku Klux Klan, as well as newer organizations like Patriot Front and the Proud Boys. It is important to note that while the violence these and other similar groups can inspire are a leading national security threat, simply belonging to these organizations — or subscribing to their core beliefs — is not a crime.
Currently, each of the 50 states is home to multiple extremist organizations. But in some parts of the country, hate and anti-government groups are far more common than in others.
Using data from the SPLC report The Year in Hate & Extremism 2023, 24/7 Wall St. identified the states with the most hate groups. We ranked each of the 50 states by the total number of hate and anti-government groups for every million residents. State-level data on population and demographics are from the U.S. Census Bureau’s 2022 American Community Survey.
Nationwide, there are 4.3 extremist groups for every 1 million Americans. Across the 50 states, the concentration of these groups ranges from 1.4 to 15.5 for every 1 million people. Like the country as a whole, most states — 36 out of 50 — reported an increase in the number of known anti-government and hate groups in the last year. These states include Kentucky and Georgia, where the number of extremist groups doubled in 2023. Of the remaining 14 states, nine reported a year-over-year decline, and in five, the number of hate groups was unchanged.
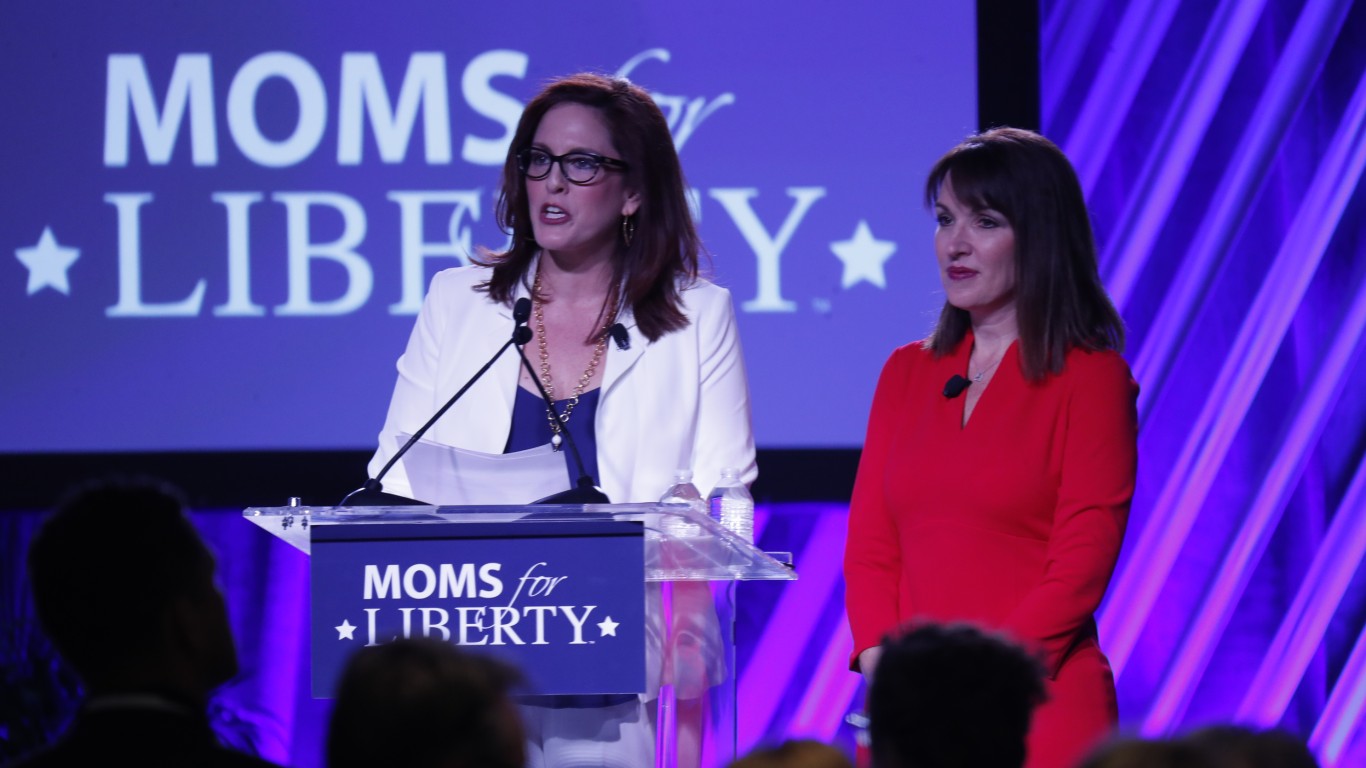
With nearly 300 chapters nationwide, Moms for Liberty is the most common extremist group in the United States. Founded in 2021 out of opposition to COVID-19 restrictions, Moms for Liberty advocates book bans and opposes racial and LGBTQ+ inclusive school curriculums, according to SPLC. Other common groups in these states include the Oath Keepers, a far-right anti-government organization, the Nationalist Social Club, a neo-Nazi group, and the white nationalist organization, Patriot Front. (Here is a look at the largest hate groups in the United States.)
Why It Matters
Rates of hate crime and domestic terrorism have been climbing for years in the United States. Many of these offenses are committed by individuals who have been radicalized by racist, homophobic, ethnocentric, or anti-government ideologies — ideologies that are widely propagated by extremist hate groups. While every American has the right to adhere to any belief system they choose, it is likely no coincidence that as hate crime rates have been rising in recent years, so too have the number of extremist groups.
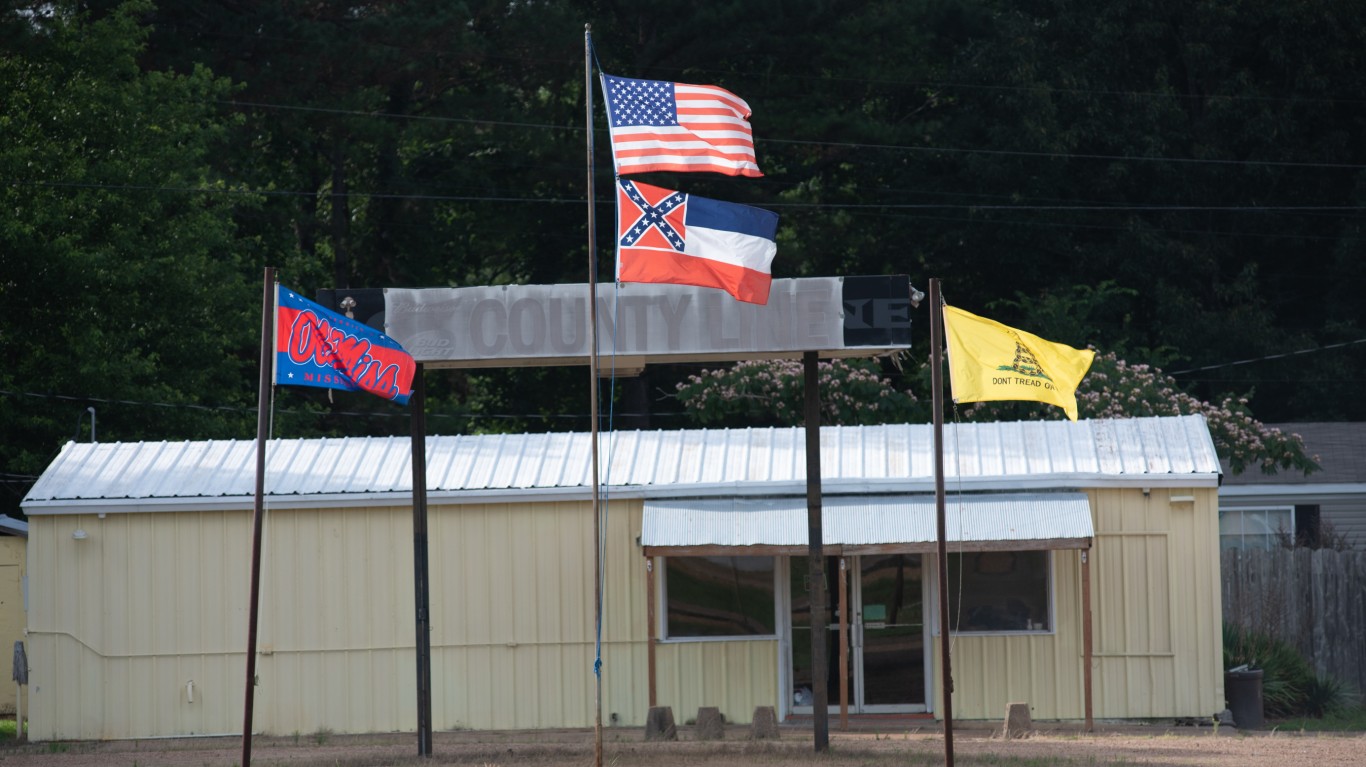
50. Mississippi
Extremist groups in 2023: 1.4 per million people (4 total)
Active extremist groups include: Moms for Liberty, Patriot Front
Most common extremist ideologies: White Nationalist (2 groups), Anti-LGBTQ, Anti-government (1 group each)
Statewide racial and ethnic makeup: 55.3% White; 36.5% Black, 0.9% Asian; 3.3% Hispanic or Latino
State nationality demographics: 97.8% native; 0.9% naturalized U.S. citizen; 1.3% foreign-born non-U.S. citizen
49. Louisiana
Extremist groups in 2023: 1.7 per million people (8 total)
Active extremist groups include: Moms for Liberty, Patriot Front, ACT for America
Most common extremist ideologies: Anti-LGBTQ, Sovereign Citizens Movement, White Nationalist (2 groups each), Anti-government, Anti-Muslim (1 group each)
Statewide racial and ethnic makeup: 56.7% White; 30.9% Black, 1.8% Asian; 5.7% Hispanic or Latino
State nationality demographics: 95.8% native; 1.9% naturalized U.S. citizen; 2.3% foreign-born non-U.S. citizen
48. Massachusetts
Extremist groups in 2023: 1.9 per million people (13 total)
Active extremist groups include: Moms for Liberty, Patriot Front, Nationalist Social Club
Most common extremist ideologies: Anti-government (5 groups), Anti-LGBTQ (3 groups)
Statewide racial and ethnic makeup: 67.0% White; 6.6% Black, 7.2% Asian; 13.0% Hispanic or Latino
State nationality demographics: 82.0% native; 10.0% naturalized U.S. citizen; 8.1% foreign-born non-U.S. citizen
47. New Jersey
Extremist groups in 2023: 2.3 per million people (21 total)
Active extremist groups include: Moms for Liberty, Proud Boys
Most common extremist ideologies: Anti-government (11 groups), Neo-Nazi, Sovereign Citizens Movement, White Nationalist (2 groups each)
Statewide racial and ethnic makeup: 51.5% White; 12.0% Black, 10.0% Asian; 21.9% Hispanic or Latino
State nationality demographics: 76.5% native; 13.7% naturalized U.S. citizen; 9.9% foreign-born non-U.S. citizen
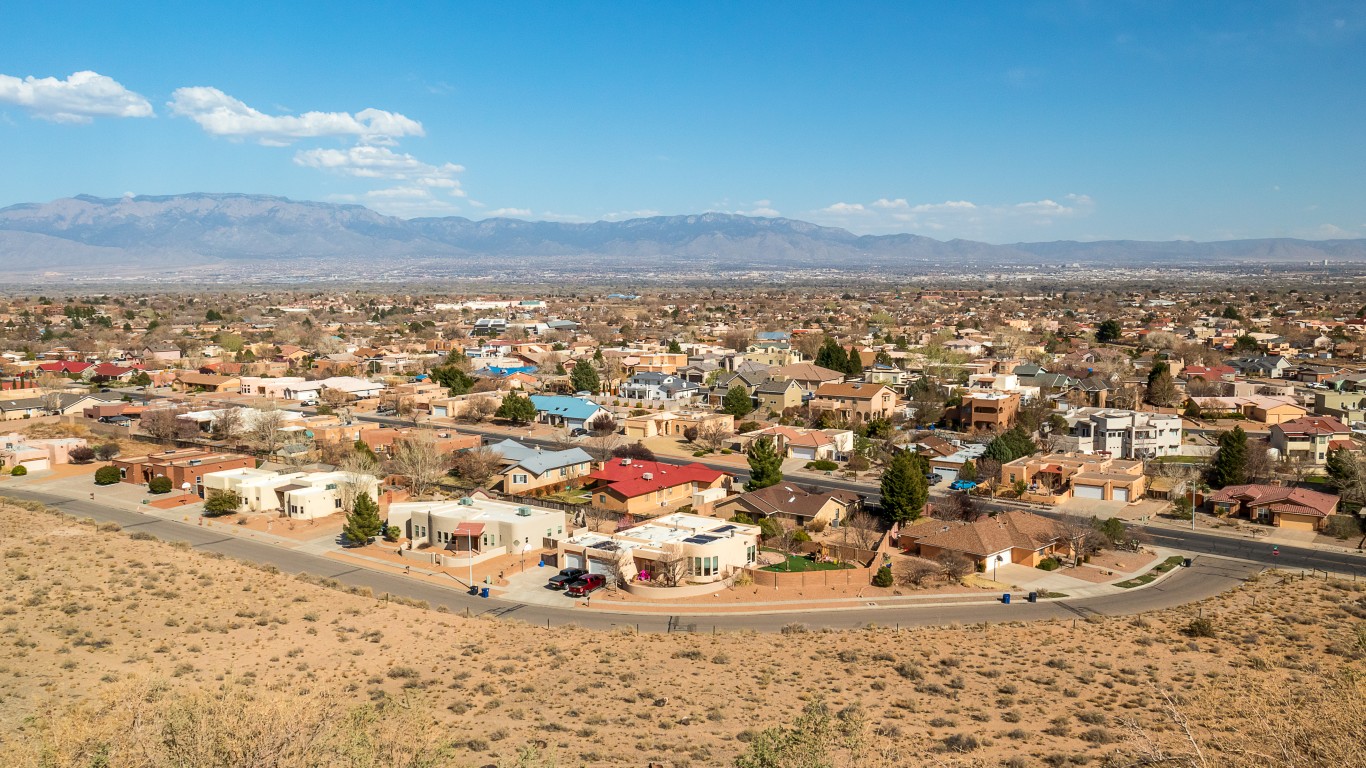
46. New Mexico
Extremist groups in 2023: 2.4 per million people (5 total)
Active extremist groups include: Moms for Liberty, Patriot Front
Most common extremist ideologies: Anti-government (3 groups), White Nationalist (2 groups)
Statewide racial and ethnic makeup: 34.8% White; 1.7% Black, 1.7% Asian; 50.2% Hispanic or Latino
State nationality demographics: 90.7% native; 4.1% naturalized U.S. citizen; 5.2% foreign-born non-U.S. citizen
45. Delaware
Extremist groups in 2023: 2.9 per million people (3 total)
Active extremist groups include: Moms for Liberty, Three Percenters
Most common extremist ideologies: Anti-government (2 groups), Militia Movement (1 group)
Statewide racial and ethnic makeup: 58.9% White; 21.6% Black, 4.1% Asian; 10.3% Hispanic or Latino
State nationality demographics: 90.1% native; 5.6% naturalized U.S. citizen; 4.3% foreign-born non-U.S. citizen
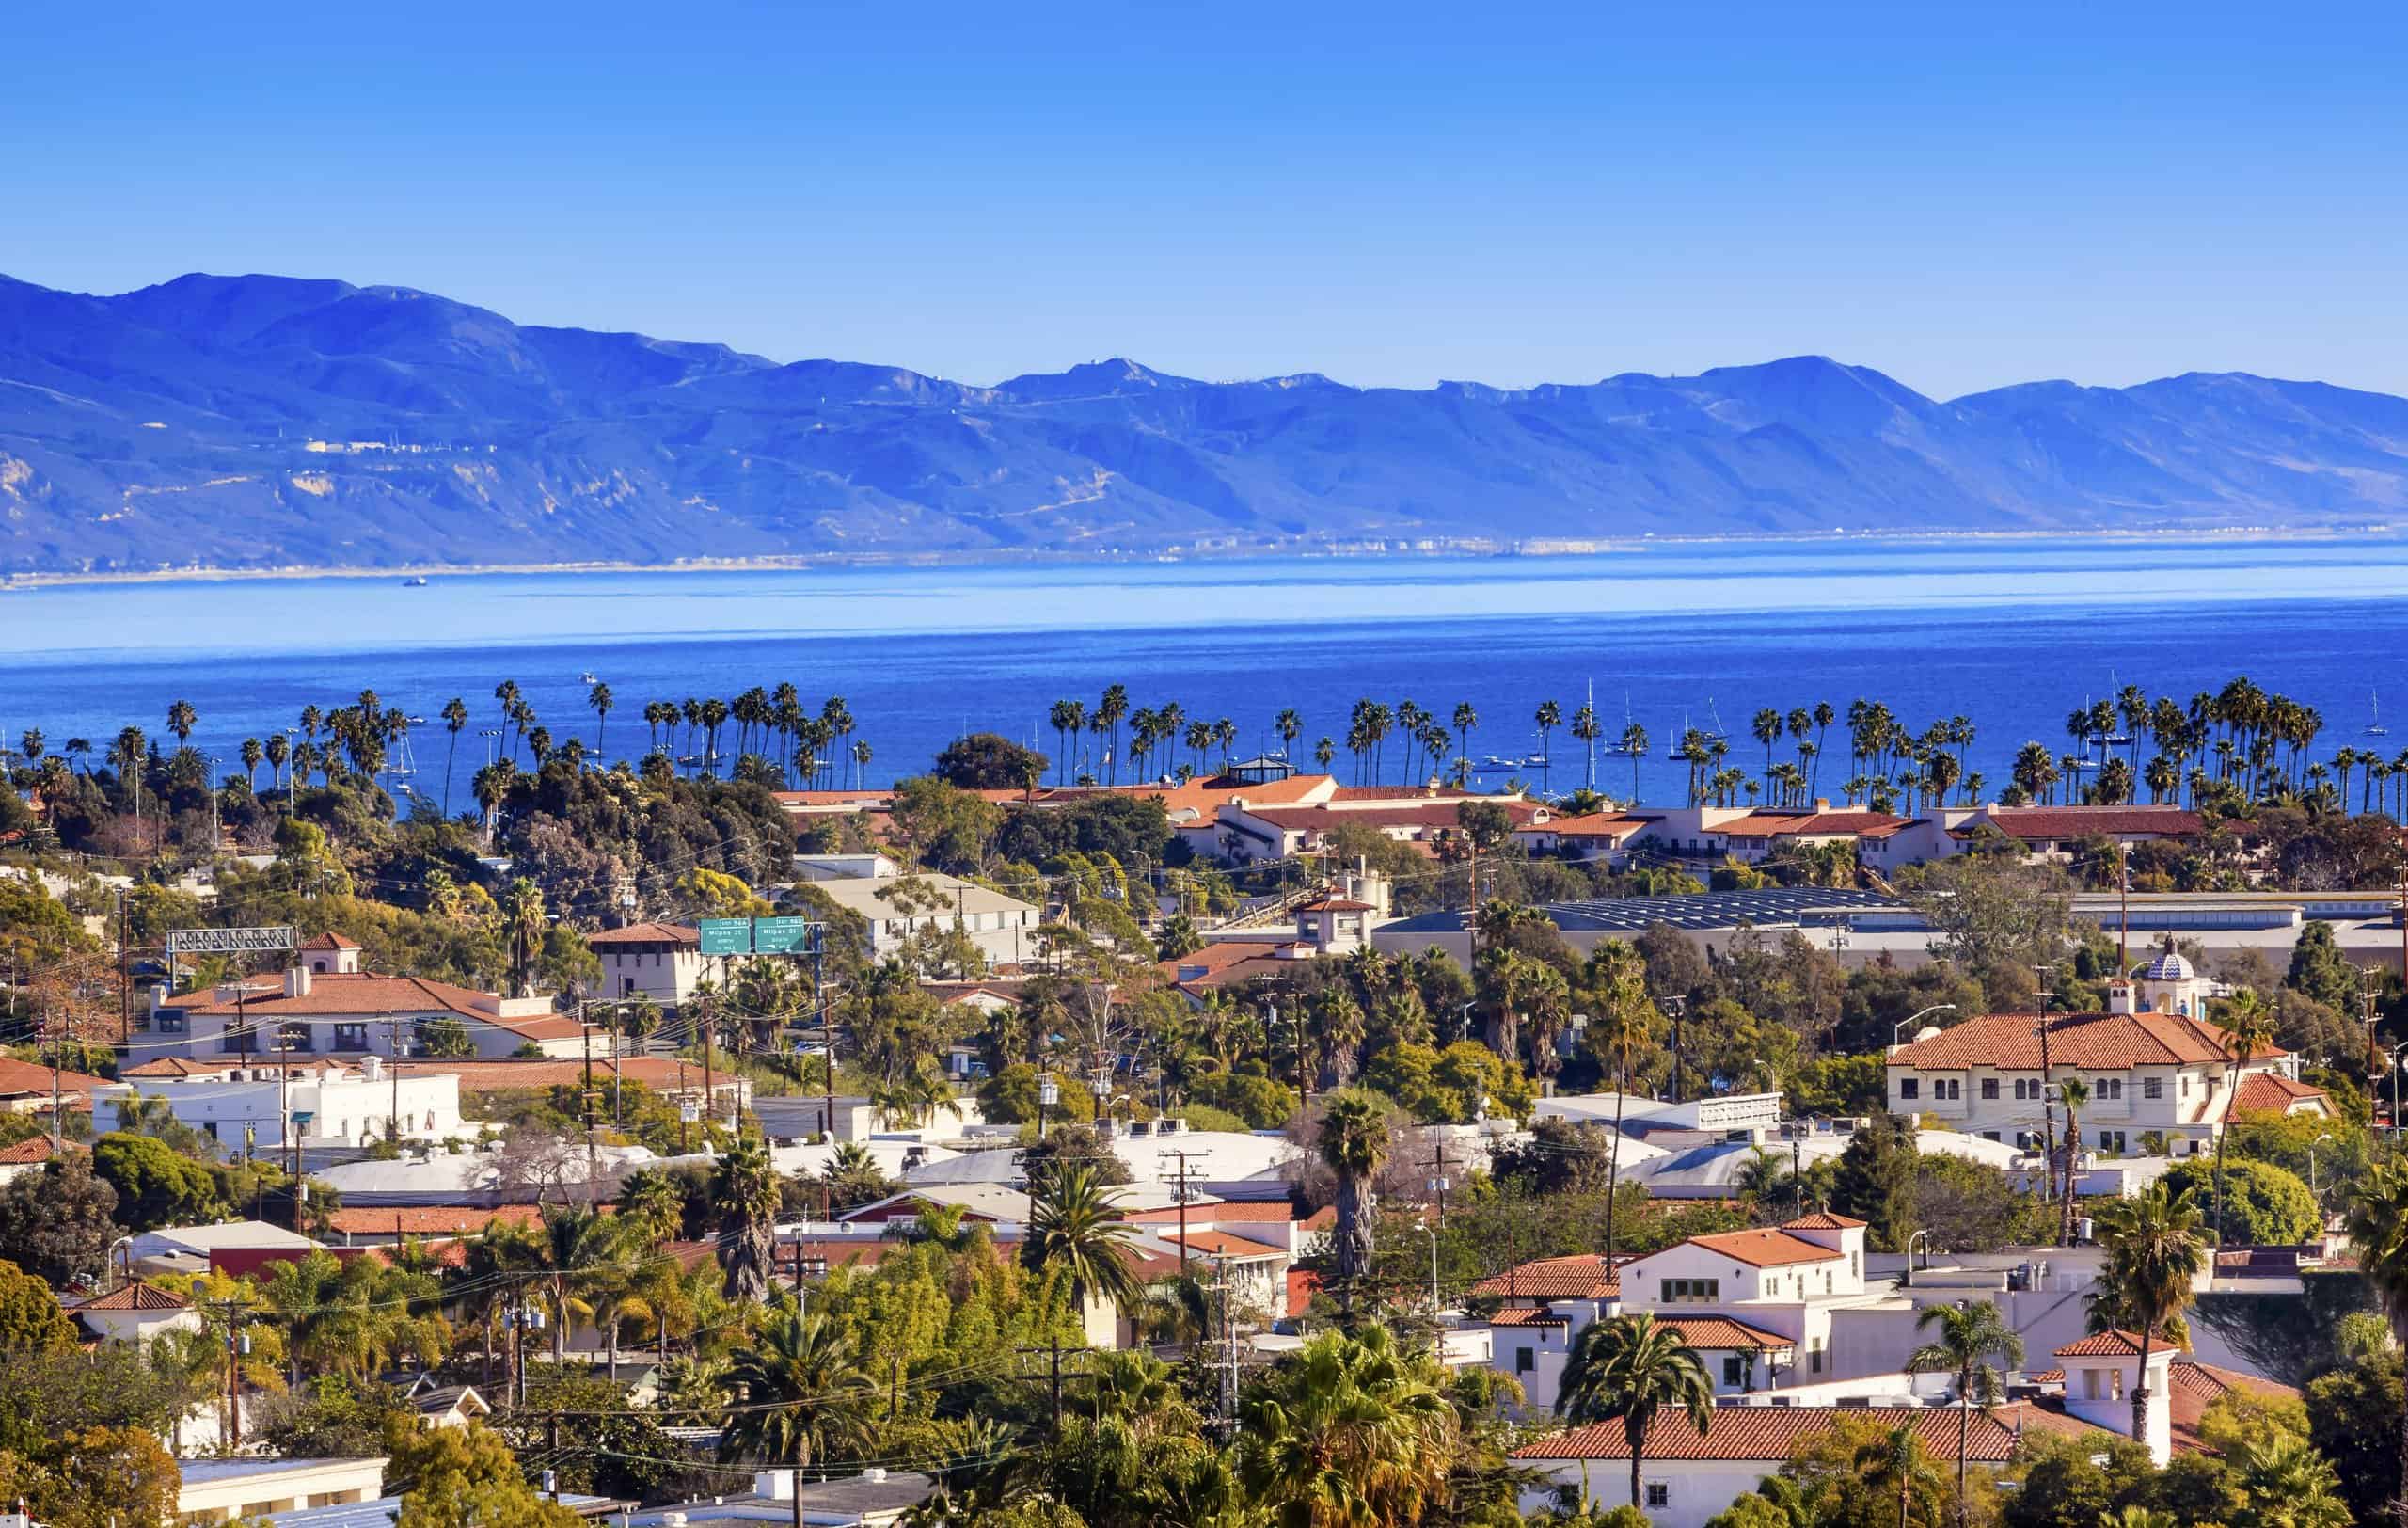
44. California
Extremist groups in 2023: 3.0 per million people (117 total)
Active extremist groups include: Moms for Liberty, Proud Boys, ACT for America
Most common extremist ideologies: Anti-government (46 groups), Sovereign Citizens Movement (15 groups)
Statewide racial and ethnic makeup: 33.7% White; 5.2% Black, 15.3% Asian; 40.3% Hispanic or Latino
State nationality demographics: 73.3% native; 14.5% naturalized U.S. citizen; 12.2% foreign-born non-U.S. citizen
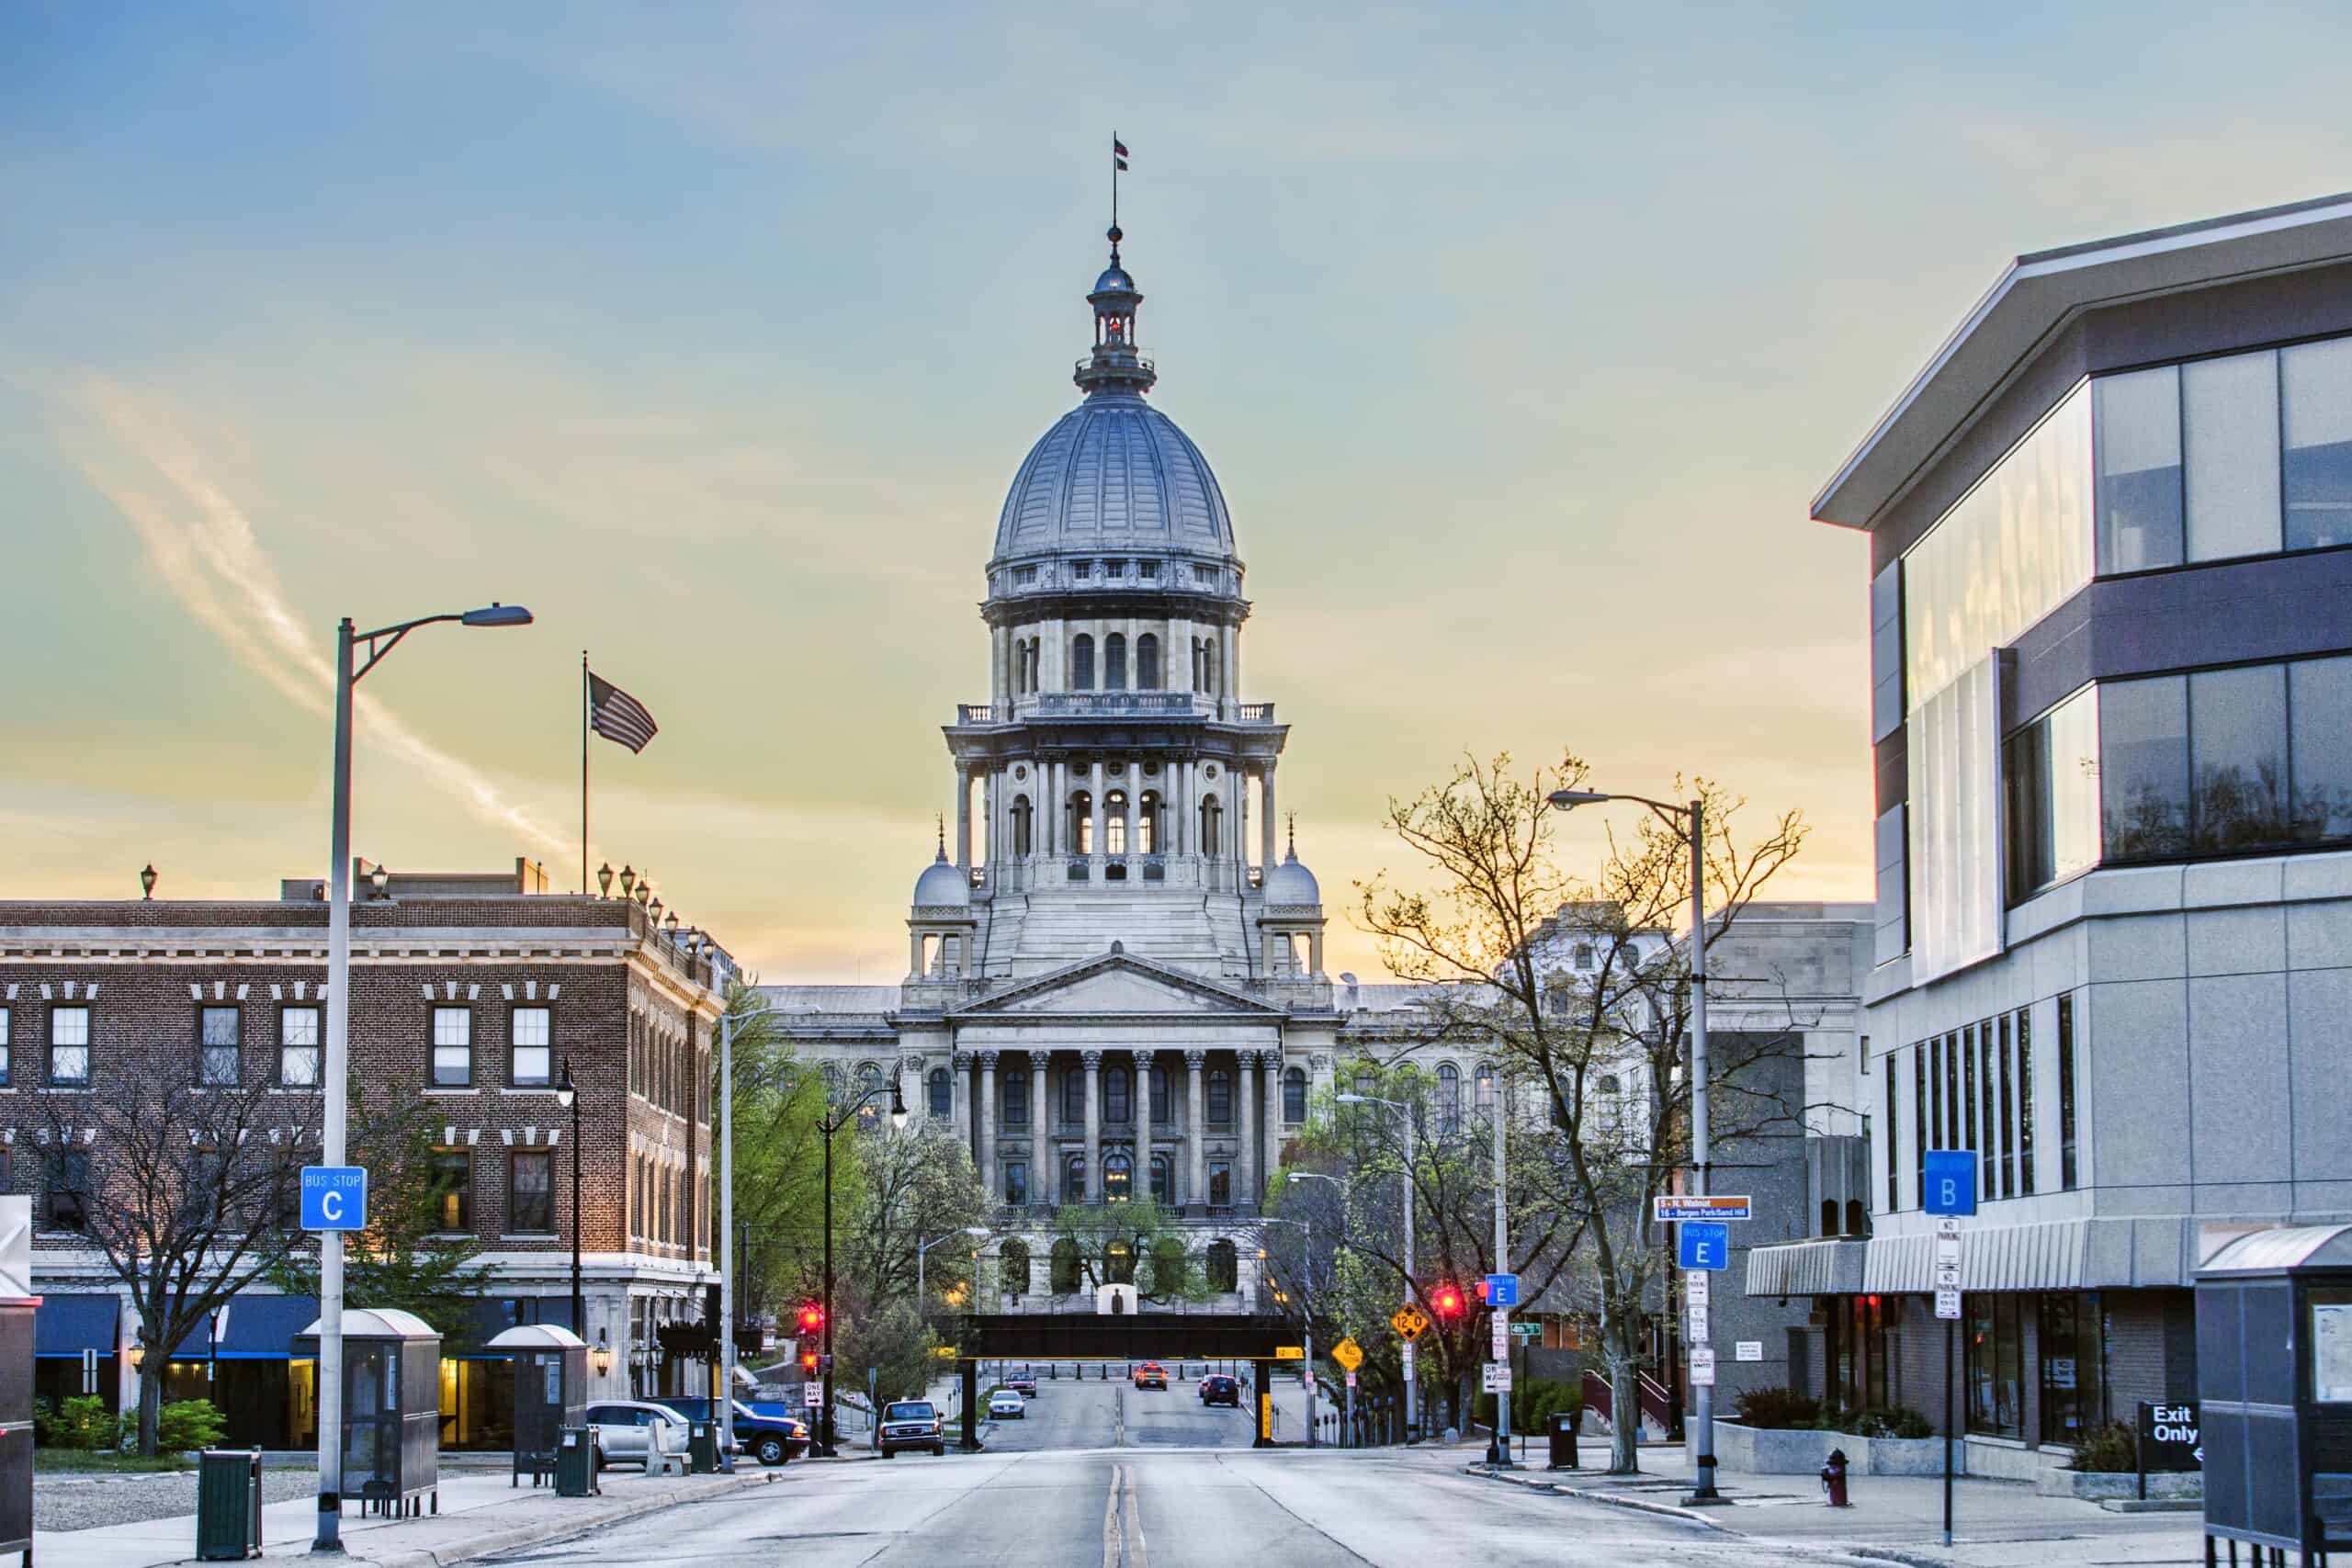
43. Illinois
Extremist groups in 2023: 3.1 per million people (39 total)
Active extremist groups include: Moms for Liberty, Nation of Islam, Proud Boys
Most common extremist ideologies: Anti-government (16 groups), Anti-LGBTQ (6 groups)
Statewide racial and ethnic makeup: 58.5% White; 13.2% Black, 5.9% Asian; 18.3% Hispanic or Latino
State nationality demographics: 85.6% native; 7.7% naturalized U.S. citizen; 6.7% foreign-born non-U.S. citizen
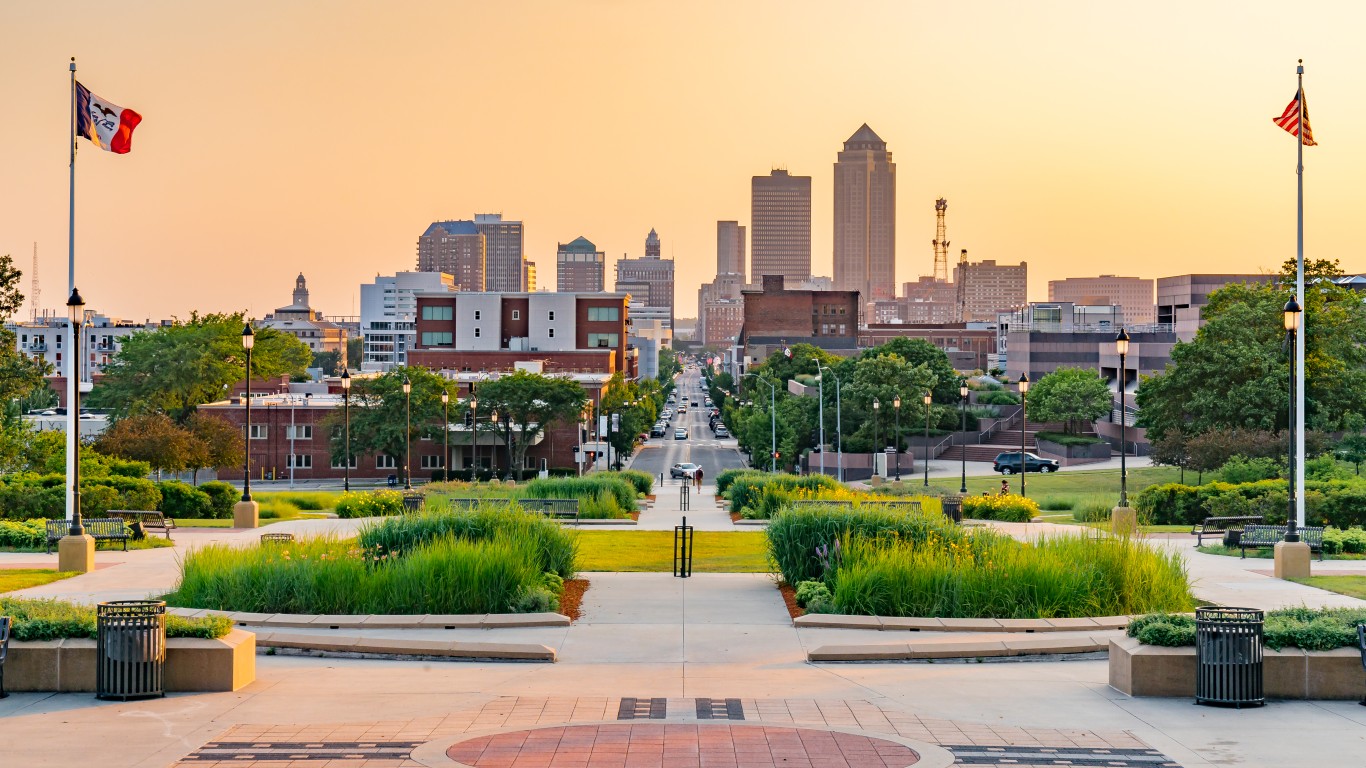
42. Iowa
Extremist groups in 2023: 3.1 per million people (10 total)
Active extremist groups include: Moms for Liberty, Patriot Front, National Alliance
Most common extremist ideologies: Anti-government (5 groups), White Nationalist (2 groups)
Statewide racial and ethnic makeup: 82.8% White; 3.7% Black, 2.3% Asian; 6.8% Hispanic or Latino
State nationality demographics: 94.0% native; 2.7% naturalized U.S. citizen; 3.3% foreign-born non-U.S. citizen
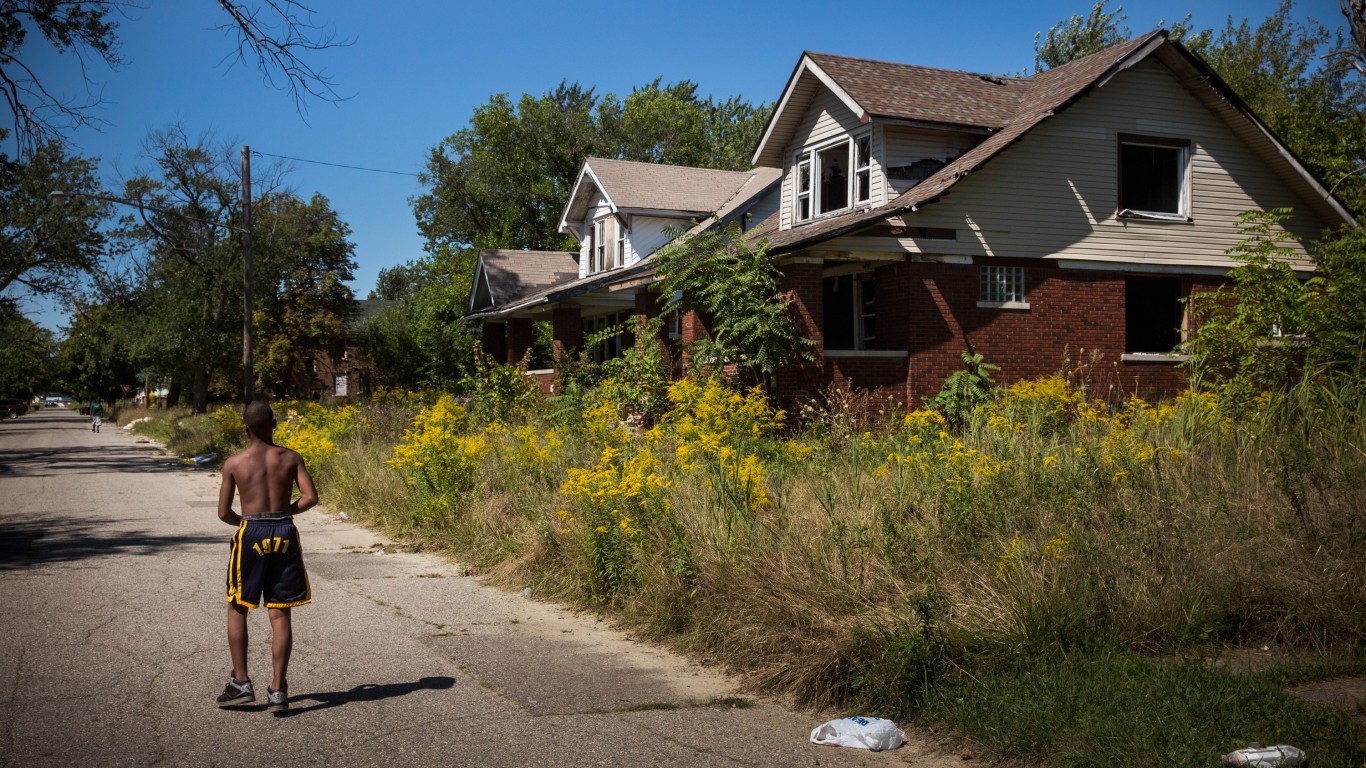
Extremist groups in 2023: 3.2 per million people (63 total)
Active extremist groups include: Moms for Liberty, Proud Boys, Nation of Islam, American Freedom Party
Most common extremist ideologies: Anti-government (21 groups), General Hate (13 groups)
Statewide racial and ethnic makeup: 52.9% White; 13.4% Black, 9.0% Asian; 19.7% Hispanic or Latino
State nationality demographics: 77.3% native; 13.8% naturalized U.S. citizen; 8.9% foreign-born non-U.S. citizen
40. Texas
Extremist groups in 2023: 3.2 per million people (97 total)
Active extremist groups include: Moms for Liberty, Proud Boys, ACT for America, New Black Panther Party
Most common extremist ideologies: Anti-government (45 groups), General Hate (9 groups)
Statewide racial and ethnic makeup: 38.9% White; 11.7% Black, 5.4% Asian; 40.2% Hispanic or Latino
State nationality demographics: 82.8% native; 7.5% naturalized U.S. citizen; 9.7% foreign-born non-U.S. citizen
39. Kansas
Extremist groups in 2023: 3.4 per million people (10 total)
Active extremist groups include: Moms for Liberty, Westboro Baptist Church, Proud Boys
Most common extremist ideologies: Anti-government, White Nationalist (3 groups each), Anti-LGBTQ, Conspiracy Propagandists, General Hate, Neo-Volkisch (1 group each)
Statewide racial and ethnic makeup: 73.1% White; 5.0% Black, 2.9% Asian; 13.0% Hispanic or Latino
State nationality demographics: 92.9% native; 3.0% naturalized U.S. citizen; 4.1% foreign-born non-U.S. citizen
38. Michigan
Extremist groups in 2023: 3.6 per million people (36 total)
Active extremist groups include: Moms for Liberty, Faith Education Commerce, Proud Boys
Most common extremist ideologies: Anti-government (19 groups), White Nationalist (5 groups)
Statewide racial and ethnic makeup: 72.6% White; 13.1% Black, 3.3% Asian; 5.7% Hispanic or Latino
State nationality demographics: 93.1% native; 4.0% naturalized U.S. citizen; 3.0% foreign-born non-U.S. citizen
37. Minnesota
Extremist groups in 2023: 3.8 per million people (22 total)
Active extremist groups include: Moms for Liberty, Proud Boys, Patriot Front
Most common extremist ideologies: Anti-government (12 groups), Sovereign Citizens Movement (3 groups)
Statewide racial and ethnic makeup: 76.2% White; 6.9% Black, 5.2% Asian; 5.8% Hispanic or Latino
State nationality demographics: 91.3% native; 5.1% naturalized U.S. citizen; 3.6% foreign-born non-U.S. citizen
36. Connecticut
Extremist groups in 2023: 3.9 per million people (14 total)
Active extremist groups include: Moms for Liberty, Patriot Front, Nationalist Social Club
Most common extremist ideologies: Anti-government (7 groups), Conspiracy Propagandists, White Nationalist (2 groups each)
Statewide racial and ethnic makeup: 62.0% White; 9.8% Black, 4.8% Asian; 18.2% Hispanic or Latino
State nationality demographics: 84.3% native; 8.7% naturalized U.S. citizen; 7.0% foreign-born non-U.S. citizen
35. Alabama
Extremist groups in 2023: 3.9 per million people (20 total)
Active extremist groups include: Moms for Liberty, Patriot Front, Three Percenters
Most common extremist ideologies: Anti-government (6 groups), Sovereign Citizens Movement, White Nationalist (3 groups each)
Statewide racial and ethnic makeup: 64.1% White; 25.6% Black, 1.5% Asian; 4.9% Hispanic or Latino
State nationality demographics: 96.2% native; 1.6% naturalized U.S. citizen; 2.2% foreign-born non-U.S. citizen
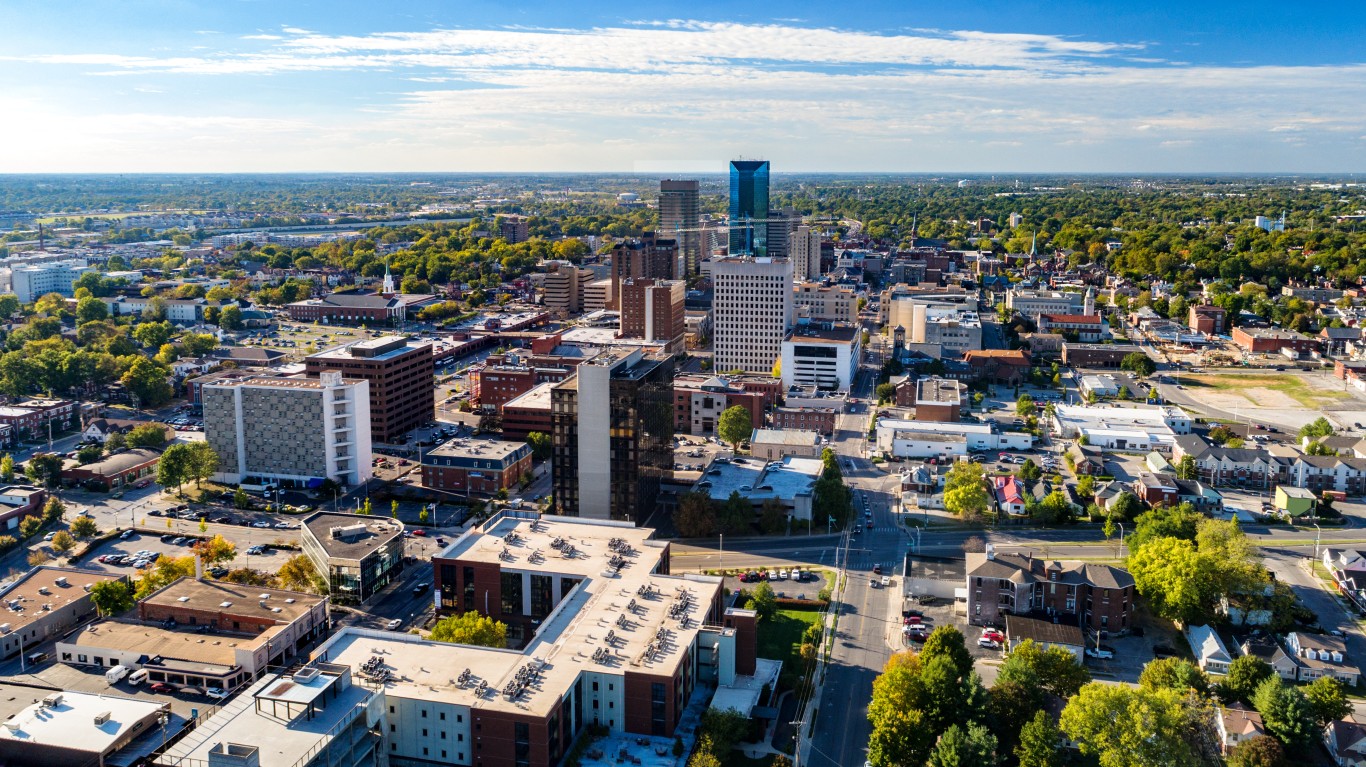
34. Kentucky
Extremist groups in 2023: 4.0 per million people (18 total)
Active extremist groups include: Moms for Liberty, Proud Boys, Patriot Front
Most common extremist ideologies: Anti-government (8 groups), General Hate, Sovereign Citizens Movement, White Nationalist (2 groups each)
Statewide racial and ethnic makeup: 82.2% White; 7.6% Black, 1.4% Asian; 4.2% Hispanic or Latino
State nationality demographics: 96.0% native; 1.8% naturalized U.S. citizen; 2.2% foreign-born non-U.S. citizen
33. Maryland
Extremist groups in 2023: 4.1 per million people (25 total)
Active extremist groups include: Moms for Liberty, Proud Boys, Patriot Front
Most common extremist ideologies: Anti-government (13 groups), General Hate, White Nationalist (3 groups each)
Statewide racial and ethnic makeup: 47.1% White; 29.2% Black, 6.5% Asian; 11.4% Hispanic or Latino
State nationality demographics: 83.3% native; 9.1% naturalized U.S. citizen; 7.6% foreign-born non-U.S. citizen
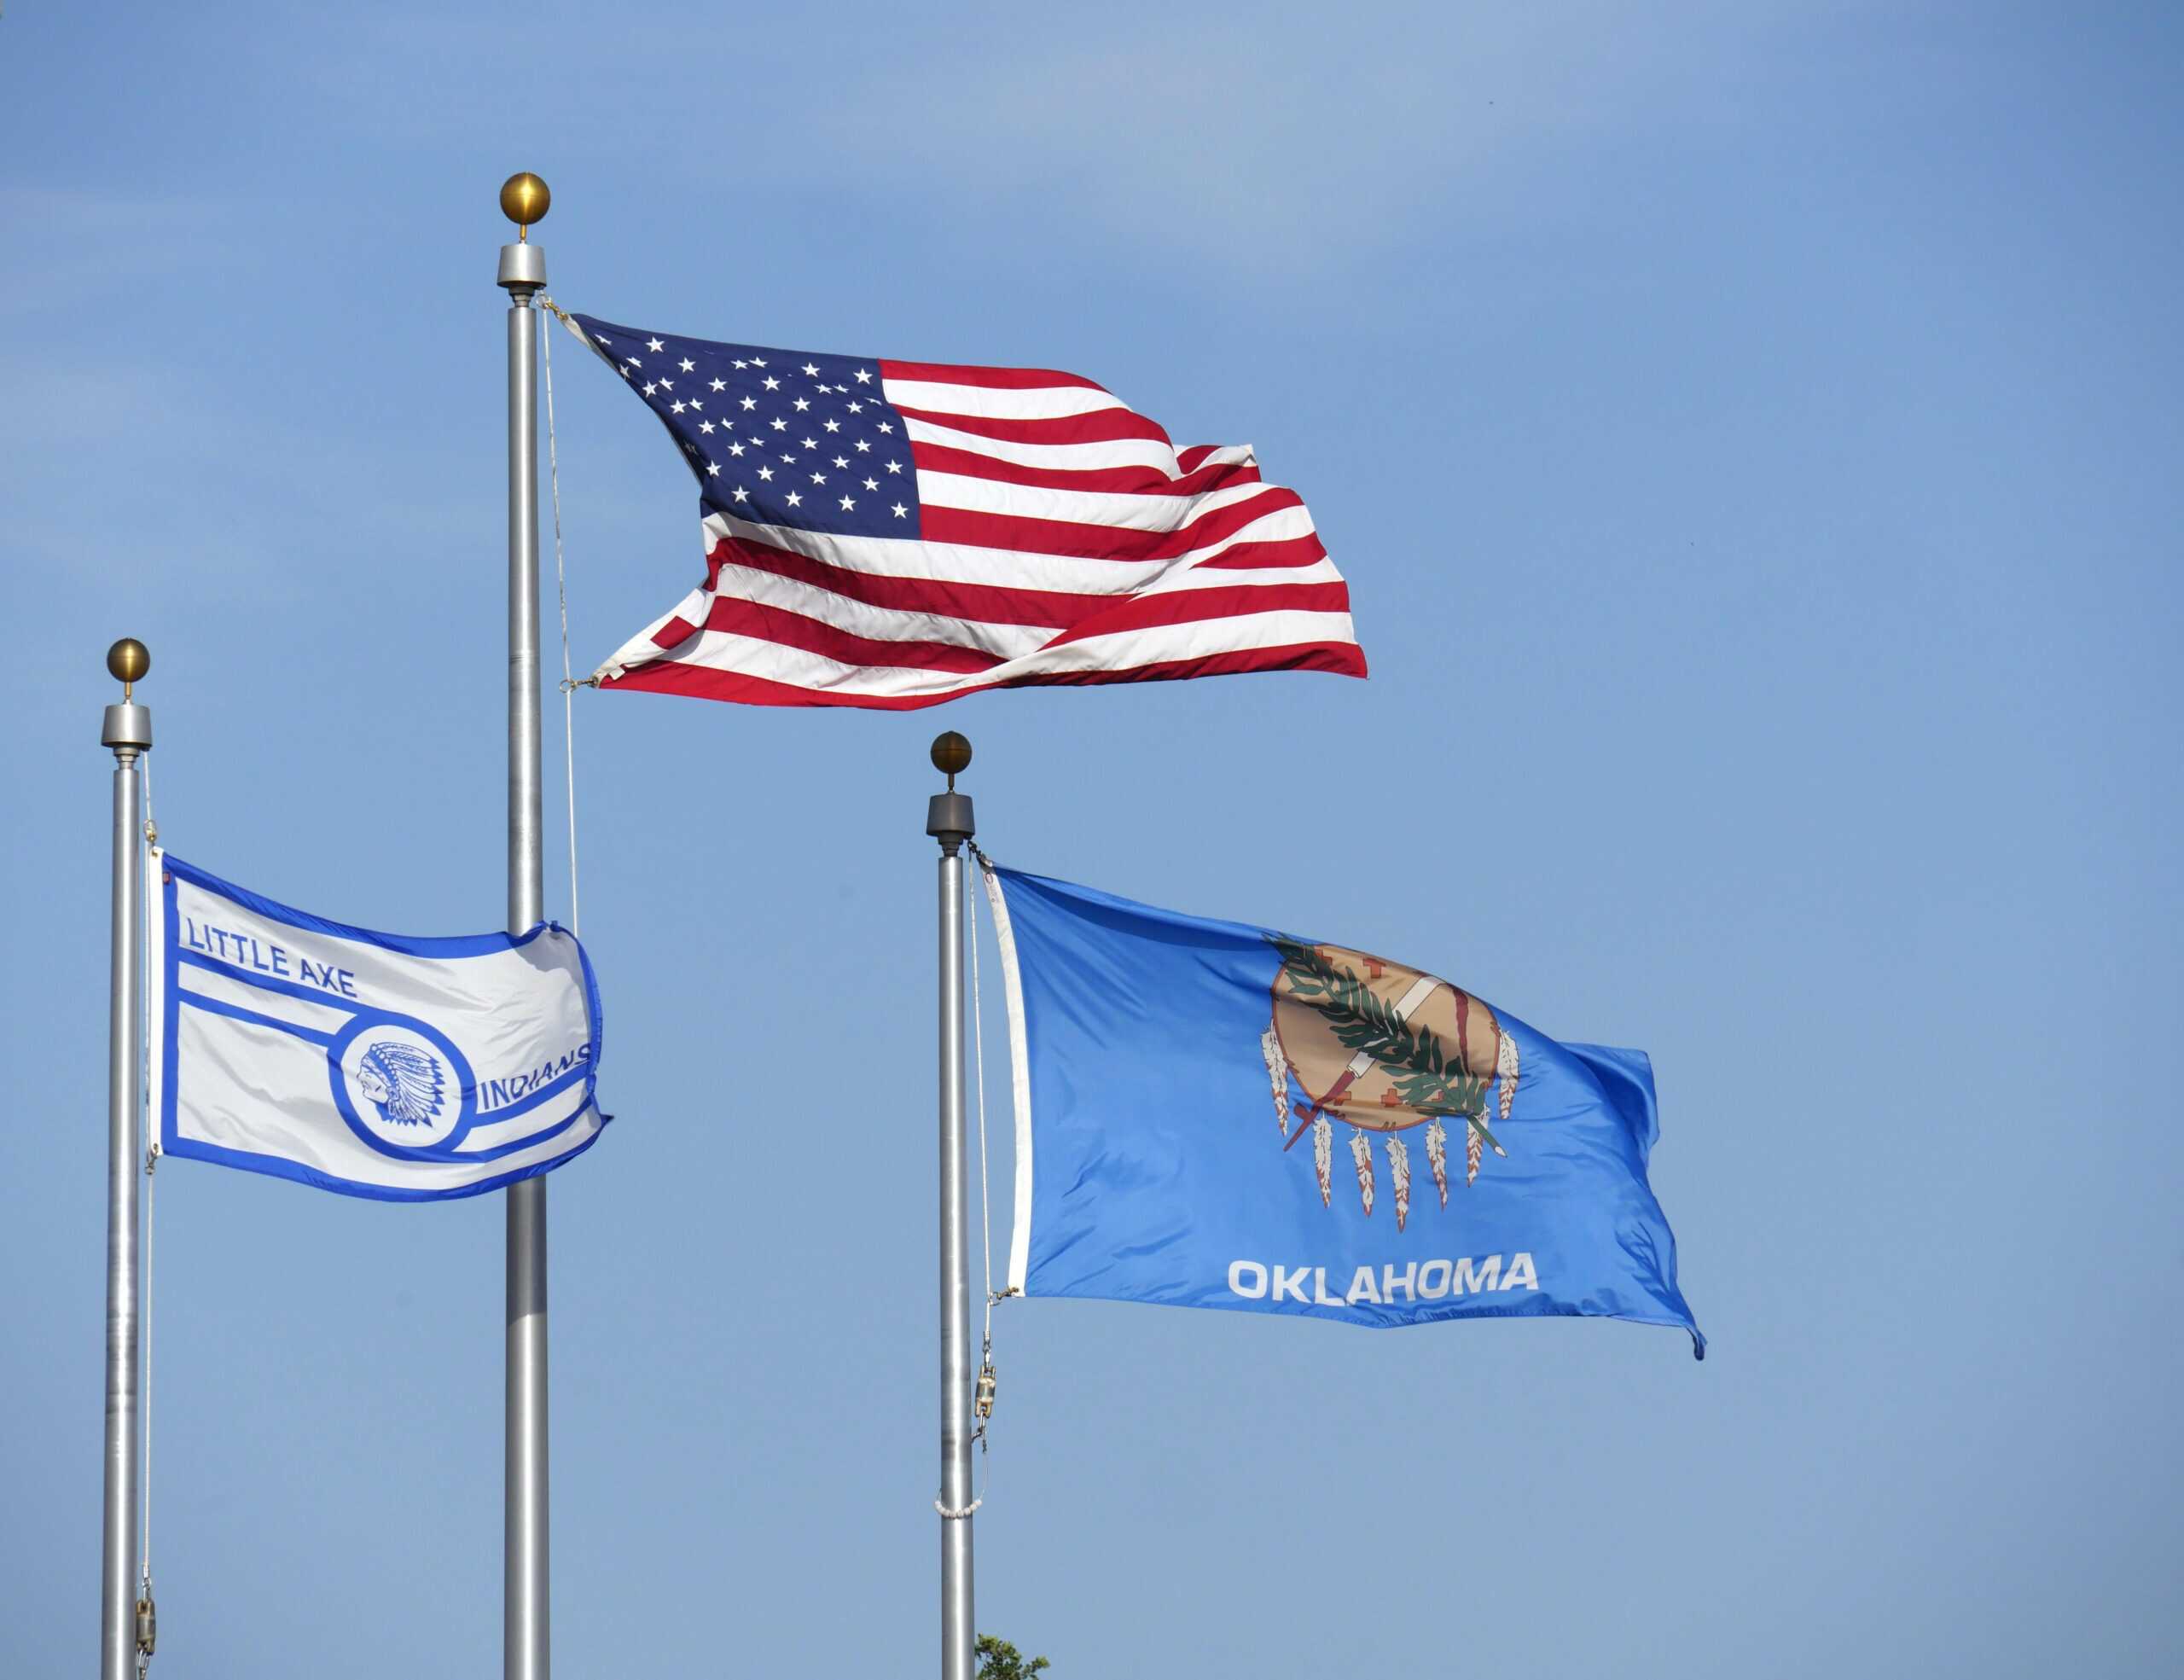
32. Oklahoma
Extremist groups in 2023: 4.2 per million people (17 total)
Active extremist groups include: Moms for Liberty, Proud Boys, Patriot Front
Most common extremist ideologies: Anti-government (9 groups), White Nationalist (2 groups)
Statewide racial and ethnic makeup: 62.6% White; 6.7% Black, 2.3% Asian; 12.1% Hispanic or Latino
State nationality demographics: 94.0% native; 2.4% naturalized U.S. citizen; 3.6% foreign-born non-U.S. citizen
31. Ohio
Extremist groups in 2023: 4.3 per million people (50 total)
Active extremist groups include: Moms for Liberty, Proud Boys, Asatru Folk Assembly
Most common extremist ideologies: Anti-government (19 groups), Militia Movement (6 groups)
Statewide racial and ethnic makeup: 76.1% White; 11.9% Black, 2.5% Asian; 4.4% Hispanic or Latino
State nationality demographics: 95.0% native; 2.7% naturalized U.S. citizen; 2.3% foreign-born non-U.S. citizen
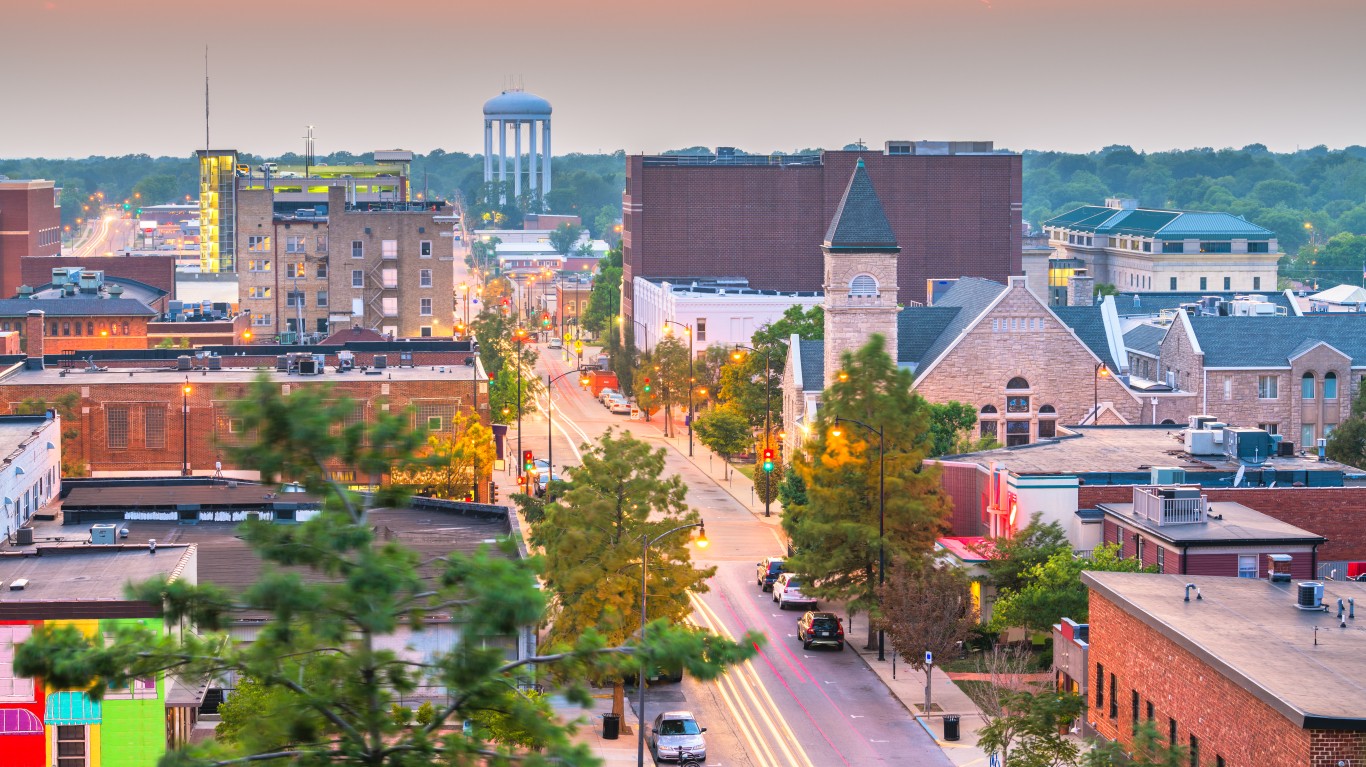
30. Missouri
Extremist groups in 2023: 4.4 per million people (27 total)
Active extremist groups include: Moms for Liberty, Proud Boys, Council of Conservative Citizens
Most common extremist ideologies: Anti-government (10 groups), White Nationalist (4 groups)
Statewide racial and ethnic makeup: 76.6% White; 10.6% Black, 2.1% Asian; 4.7% Hispanic or Latino
State nationality demographics: 95.9% native; 2.1% naturalized U.S. citizen; 2.0% foreign-born non-U.S. citizen
29. Georgia
Extremist groups in 2023: 4.5 per million people (49 total)
Active extremist groups include: Moms for Liberty, Proud Boys, Nation of Islam, Occidental Quarterly
Most common extremist ideologies: Anti-government (28 groups), White Nationalist (6 groups)
Statewide racial and ethnic makeup: 49.6% White; 30.7% Black, 4.4% Asian; 10.4% Hispanic or Latino
State nationality demographics: 89.3% native; 5.4% naturalized U.S. citizen; 5.3% foreign-born non-U.S. citizen
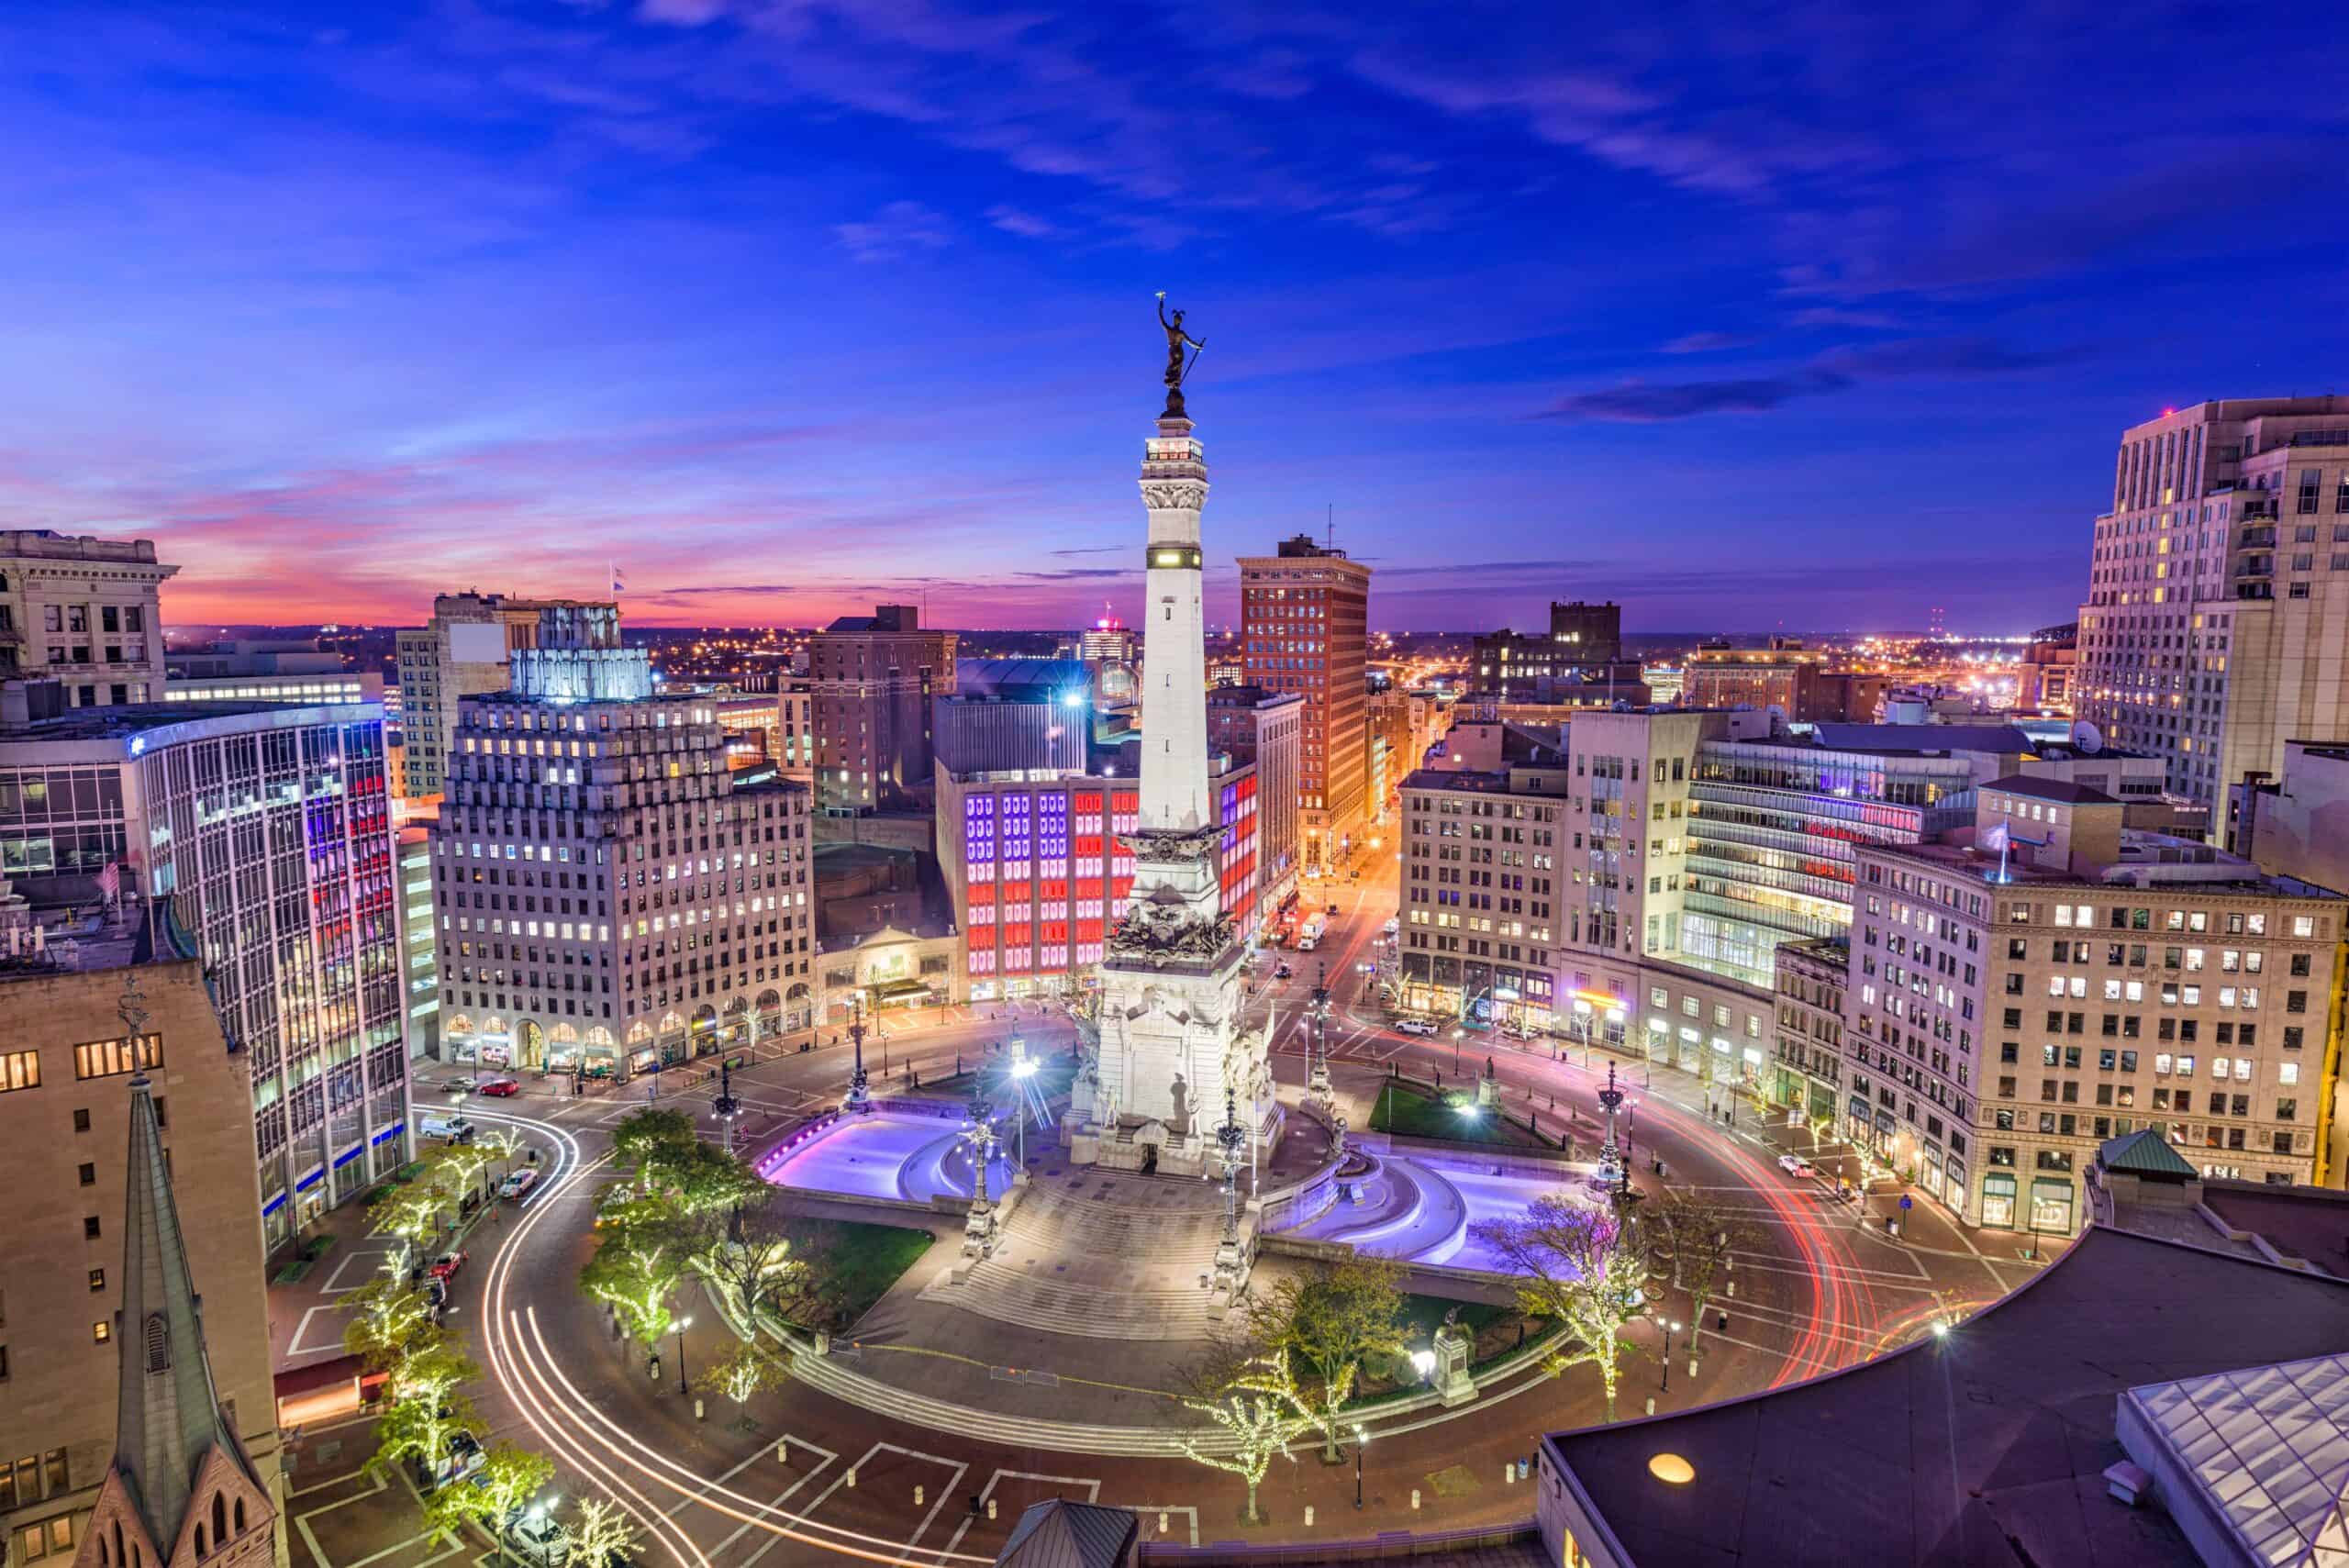
28. Indiana
Extremist groups in 2023: 4.5 per million people (31 total)
Active extremist groups include: Moms for Liberty, Oath Keepers, Proud Boys
Most common extremist ideologies: Anti-government (15 groups), White Nationalist (3 groups)
Statewide racial and ethnic makeup: 76.0% White; 9.2% Black, 2.5% Asian; 7.8% Hispanic or Latino
State nationality demographics: 93.9% native; 2.6% naturalized U.S. citizen; 3.4% foreign-born non-U.S. citizen
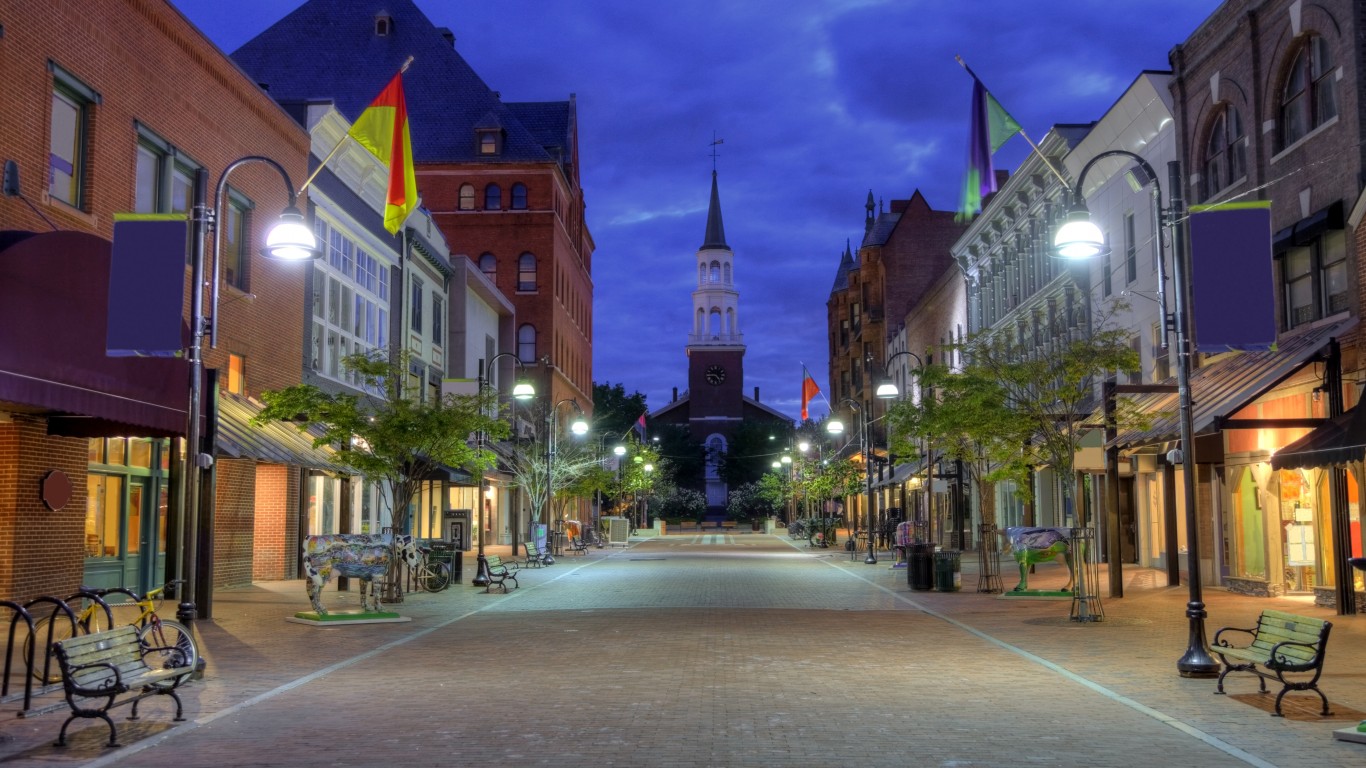
27. Vermont
Extremist groups in 2023: 4.6 per million people (3 total)
Active extremist groups include: Patriot Front
Most common extremist ideologies: Anti-government (2 groups), White Nationalist (1 group)
Statewide racial and ethnic makeup: 90.2% White; 1.0% Black, 1.8% Asian; 2.3% Hispanic or Latino
State nationality demographics: 95.8% native; 2.8% naturalized U.S. citizen; 1.5% foreign-born non-U.S. citizen
26. North Carolina
Extremist groups in 2023: 4.7 per million people (50 total)
Active extremist groups include: Moms for Liberty, Proud Boys, Patriot Front
Most common extremist ideologies: Anti-government (25 groups), General Hate (6 groups)
Statewide racial and ethnic makeup: 60.7% White; 20.1% Black, 3.2% Asian; 10.4% Hispanic or Latino
State nationality demographics: 91.4% native; 3.8% naturalized U.S. citizen; 4.8% foreign-born non-U.S. citizen
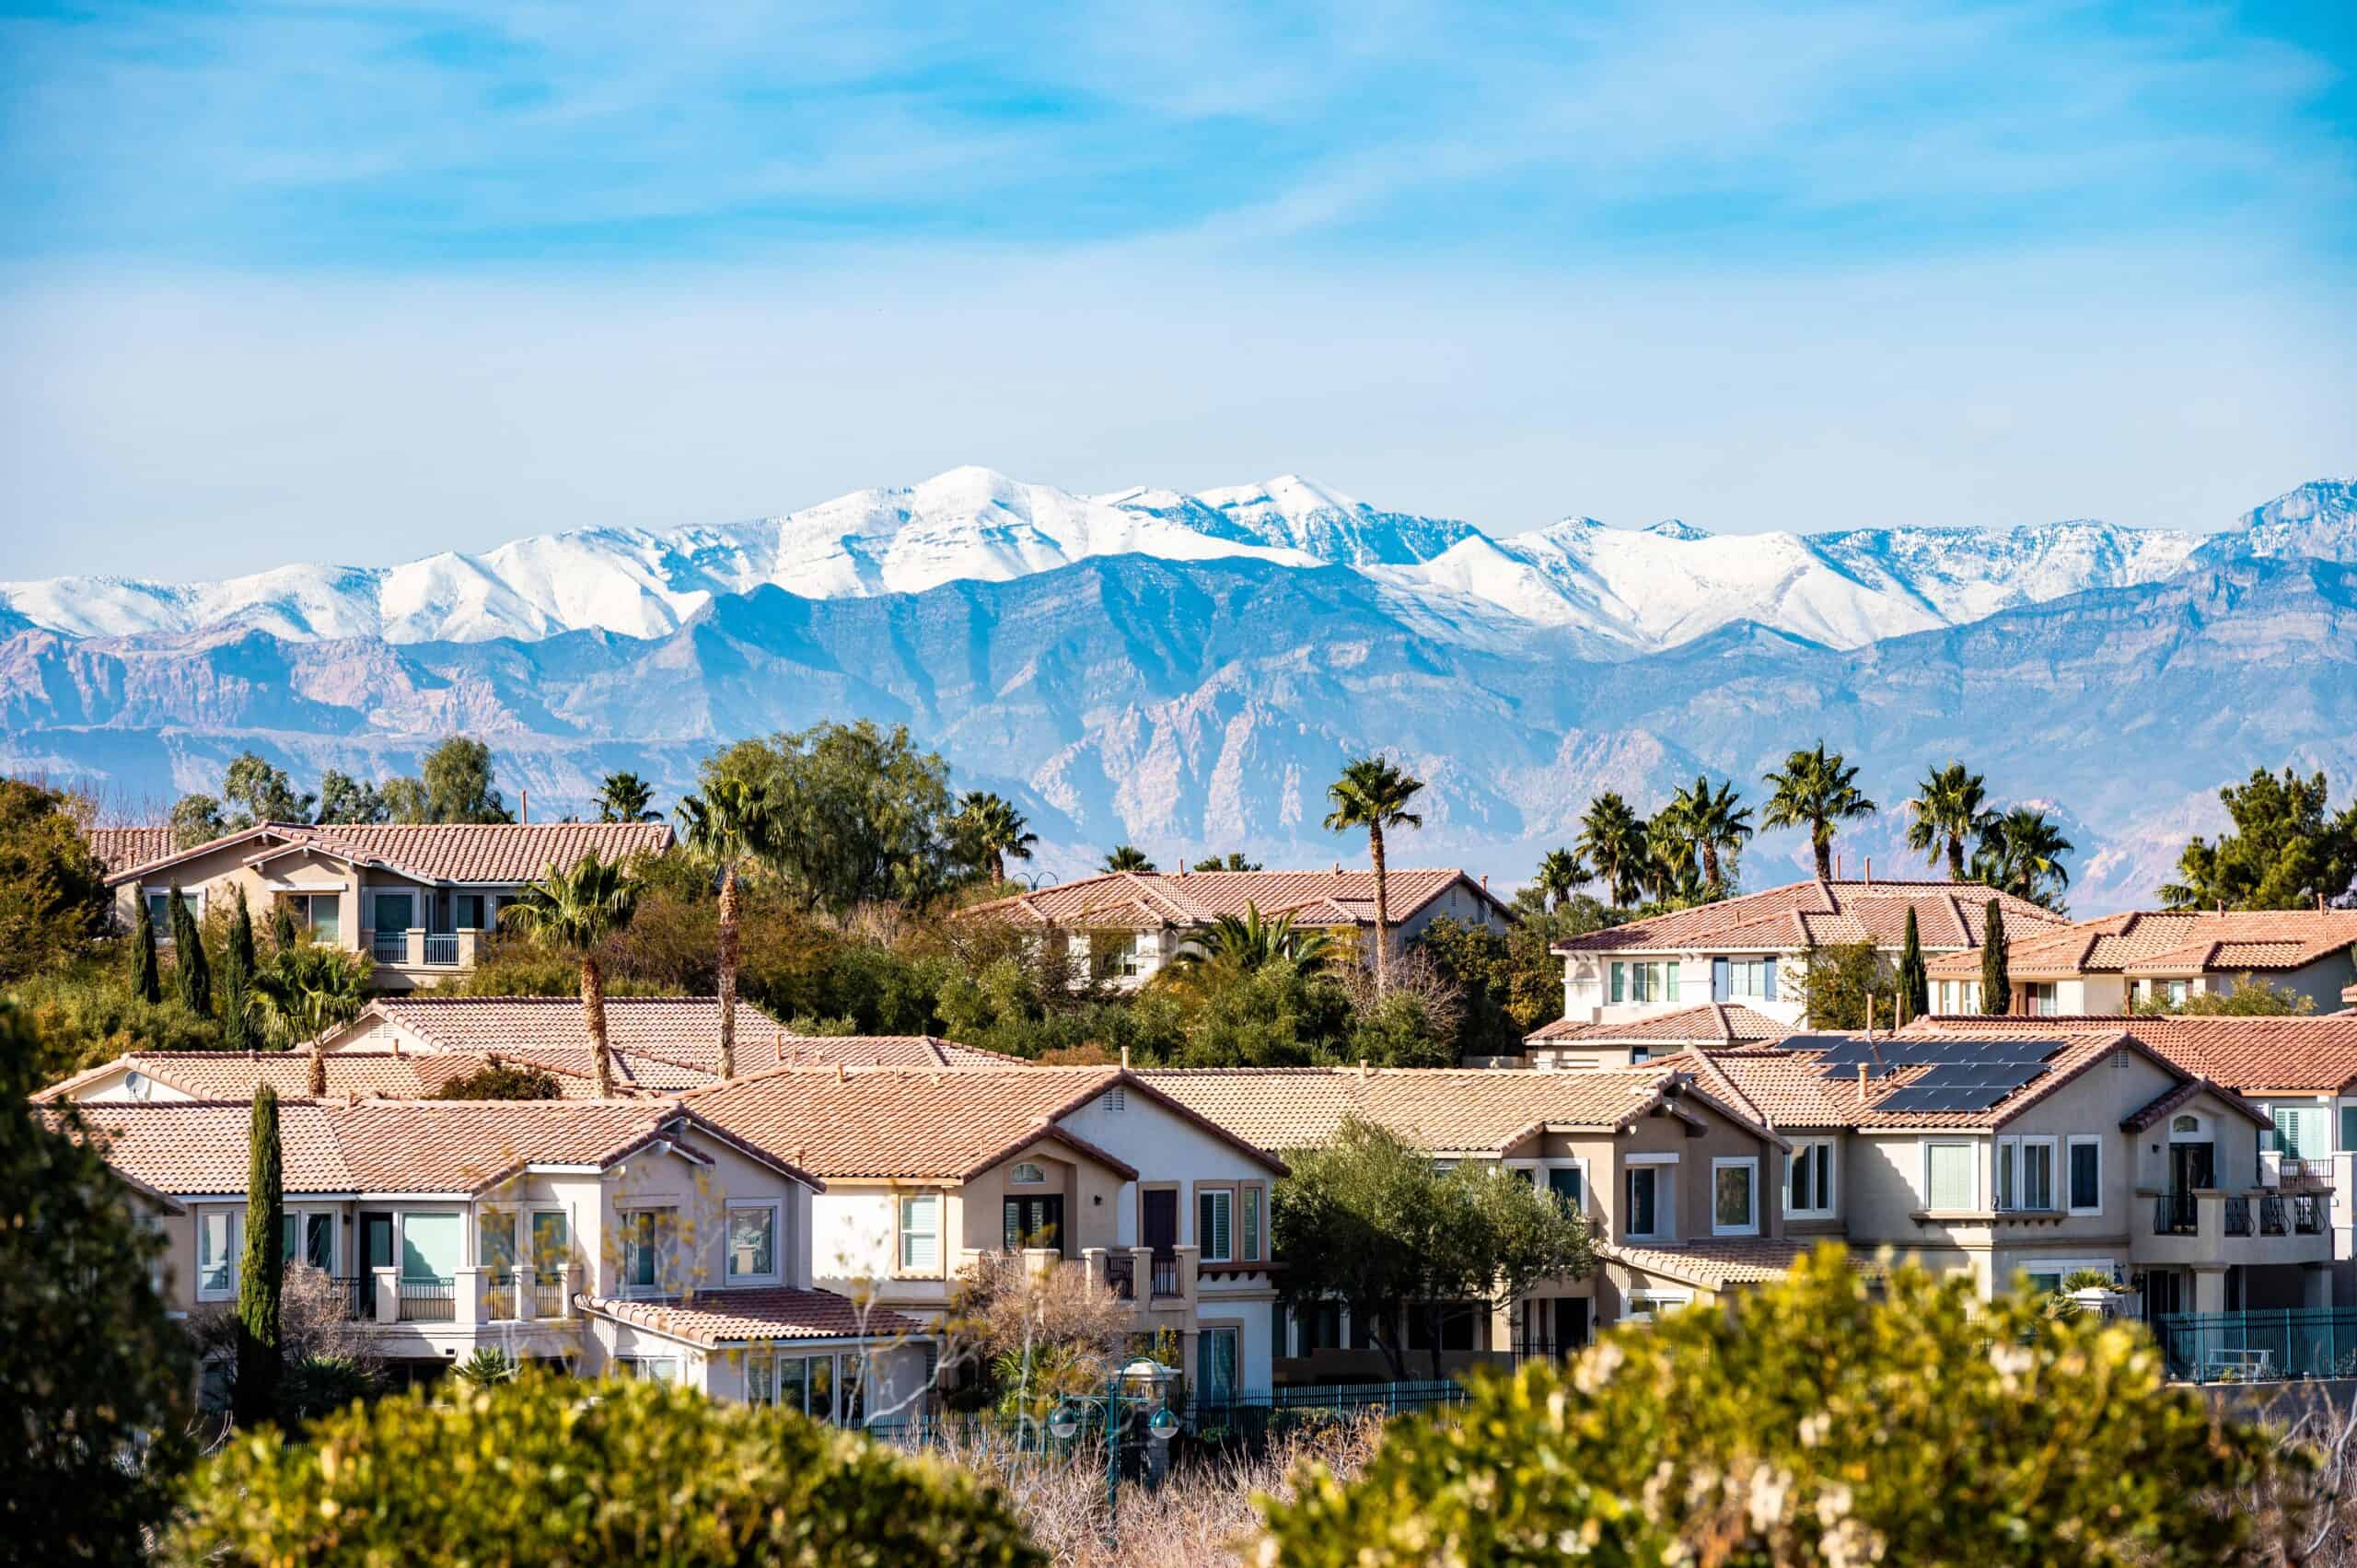
25. Nevada
Extremist groups in 2023: 4.7 per million people (15 total)
Active extremist groups include: Moms for Liberty, Proud Boys
Most common extremist ideologies: Anti-government, White Nationalist (4 groups each), General Hate, Sovereign Citizens Movement (2 groups each)
Statewide racial and ethnic makeup: 44.4% White; 9.0% Black, 8.8% Asian; 30.3% Hispanic or Latino
State nationality demographics: 81.1% native; 10.2% naturalized U.S. citizen; 8.7% foreign-born non-U.S. citizen
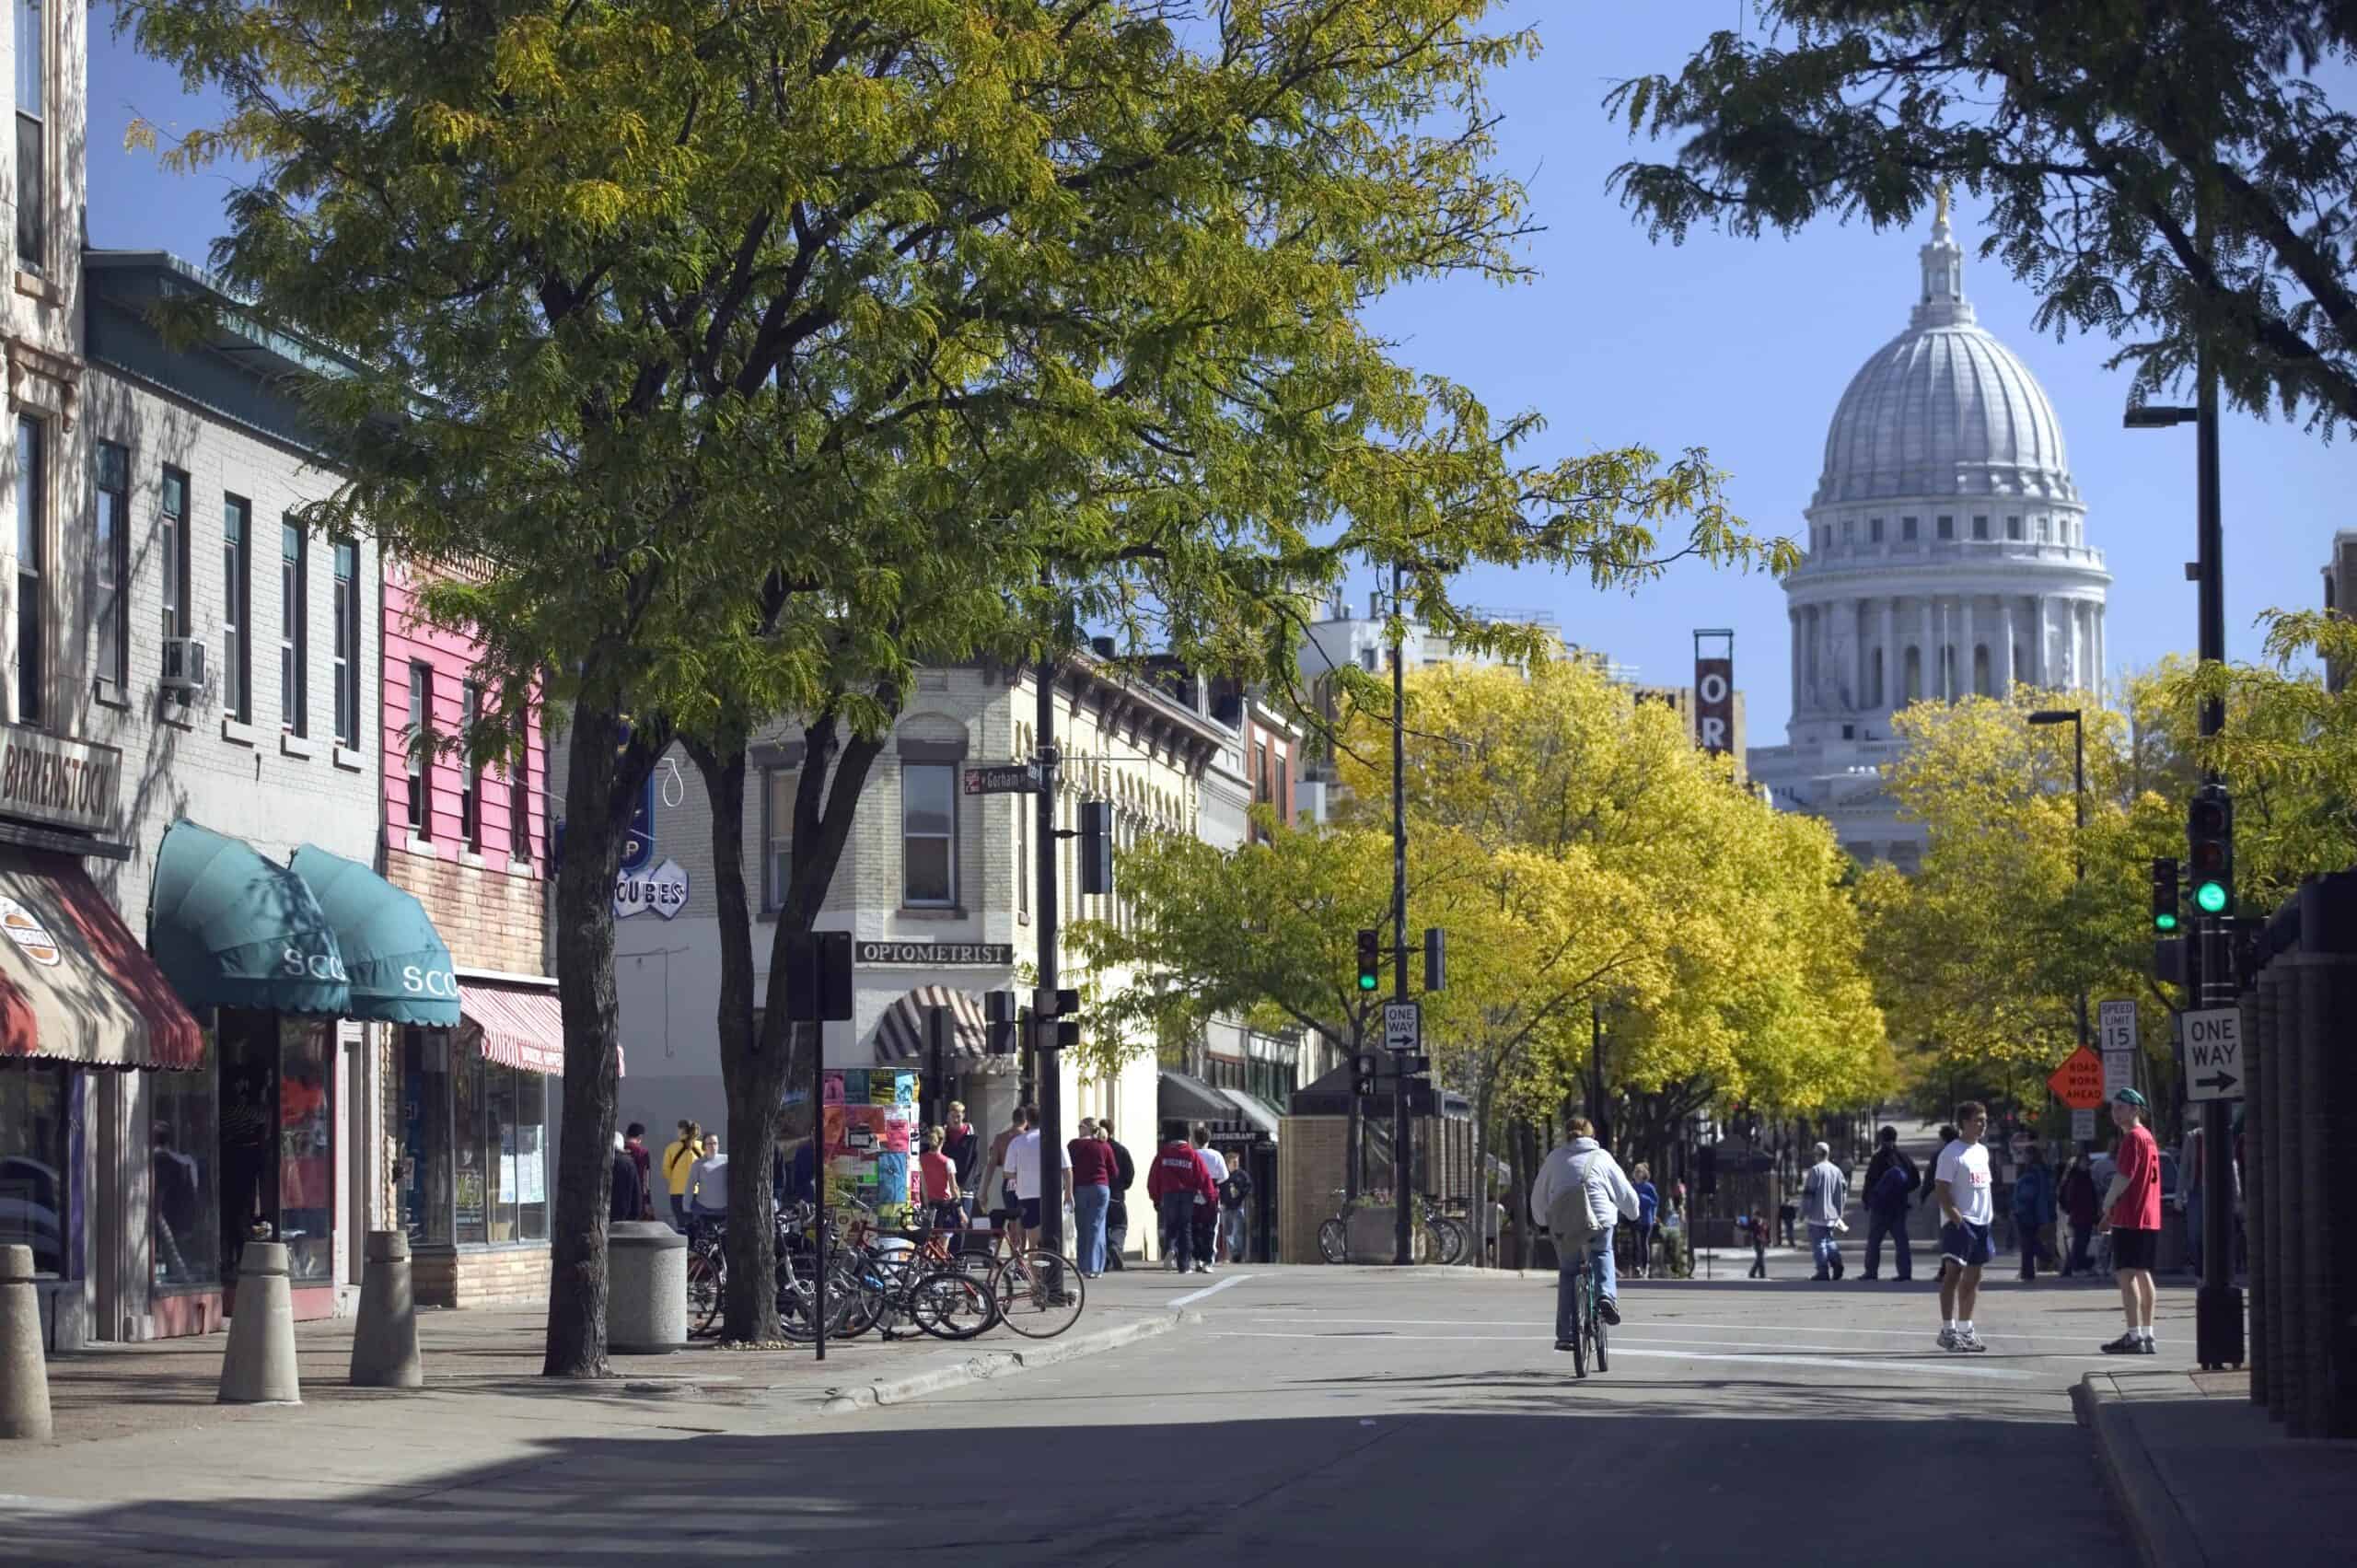
24. Wisconsin
Extremist groups in 2023: 4.8 per million people (28 total)
Active extremist groups include: Moms for Liberty, Patriot Front, Asatru Folk Assembly
Most common extremist ideologies: Anti-government (13 groups), Anti-LGBTQ, White Nationalist (3 groups each)
Statewide racial and ethnic makeup: 79.0% White; 5.9% Black, 2.9% Asian; 7.6% Hispanic or Latino
State nationality demographics: 95.0% native; 2.4% naturalized U.S. citizen; 2.6% foreign-born non-U.S. citizen
23. Arkansas
Extremist groups in 2023: 4.9 per million people (15 total)
Active extremist groups include: Moms for Liberty, Patriot Front
Most common extremist ideologies: Anti-government (9 groups), White Nationalist (3 groups)
Statewide racial and ethnic makeup: 67.5% White; 14.3% Black, 1.6% Asian; 8.4% Hispanic or Latino
State nationality demographics: 94.9% native; 1.9% naturalized U.S. citizen; 3.3% foreign-born non-U.S. citizen
22. Florida
Extremist groups in 2023: 5.1 per million people (114 total)
Active extremist groups include: Moms for Liberty, Proud Boys, Stormfront
Most common extremist ideologies: Anti-government (58 groups), General Hate (9 groups)
Statewide racial and ethnic makeup: 50.8% White; 14.6% Black, 2.8% Asian; 27.1% Hispanic or Latino
State nationality demographics: 78.3% native; 12.6% naturalized U.S. citizen; 9.1% foreign-born non-U.S. citizen
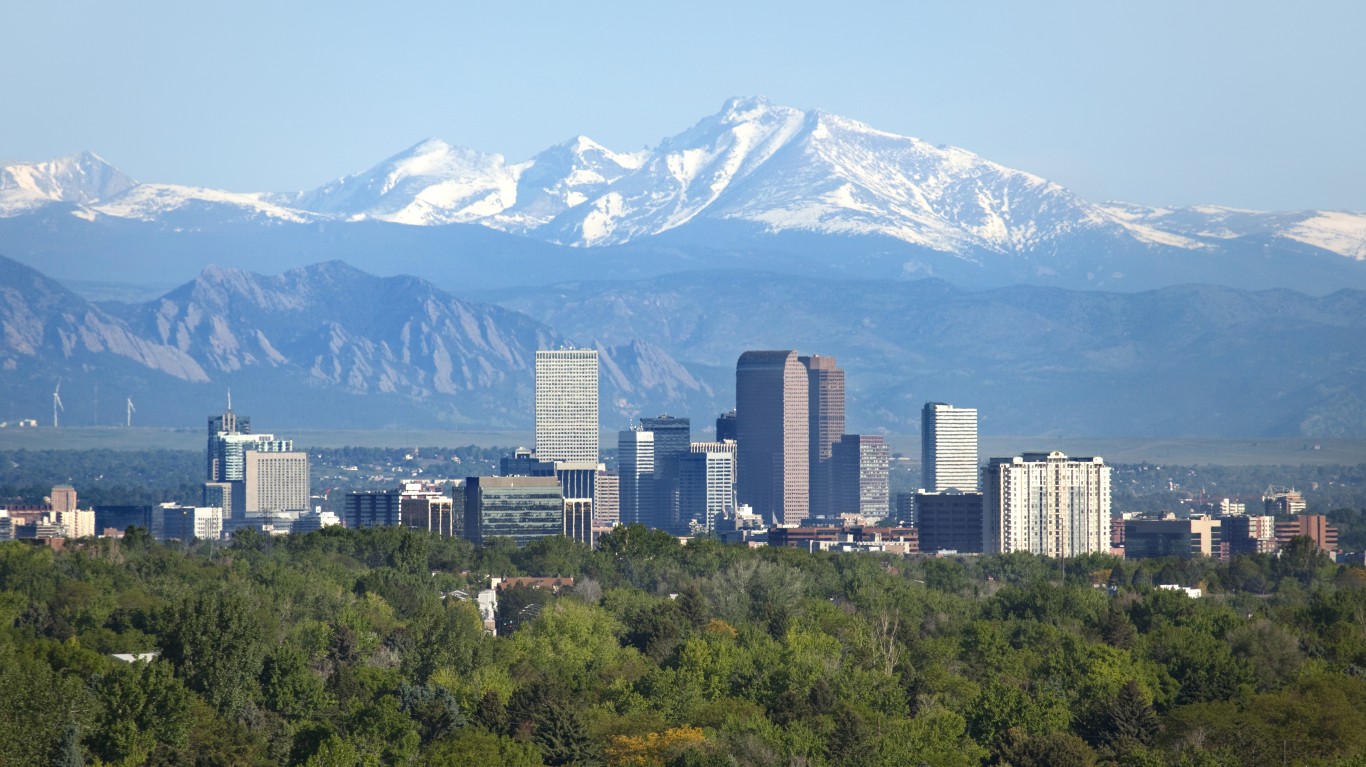
21. Colorado
Extremist groups in 2023: 5.1 per million people (30 total)
Active extremist groups include: Moms for Liberty, Proud Boys, Patriot Front
Most common extremist ideologies: Anti-government (10 groups), Anti-LGBTQ, Sovereign Citizens Movement (4 groups each)
Statewide racial and ethnic makeup: 65.0% White; 3.8% Black, 3.1% Asian; 22.5% Hispanic or Latino
State nationality demographics: 90.5% native; 4.7% naturalized U.S. citizen; 4.9% foreign-born non-U.S. citizen
20. Virginia
Extremist groups in 2023: 5.2 per million people (45 total)
Active extremist groups include: Moms for Liberty, Oath Keepers, Patriot Front
Most common extremist ideologies: Anti-government (20 groups), White Nationalist (6 groups)
Statewide racial and ethnic makeup: 58.7% White; 18.4% Black, 6.9% Asian; 10.4% Hispanic or Latino
State nationality demographics: 87.3% native; 7.5% naturalized U.S. citizen; 5.3% foreign-born non-U.S. citizen
19. Tennessee
Extremist groups in 2023: 5.2 per million people (37 total)
Active extremist groups include: Moms for Liberty, Proud Boys, National Alliance
Most common extremist ideologies: Anti-government (14 groups), White Nationalist (6 groups)
Statewide racial and ethnic makeup: 71.9% White; 15.5% Black, 1.9% Asian; 6.3% Hispanic or Latino
State nationality demographics: 94.4% native; 2.3% naturalized U.S. citizen; 3.3% foreign-born non-U.S. citizen
18. Washington
Extremist groups in 2023: 5.3 per million people (41 total)
Active extremist groups include: Moms for Liberty, Proud Boys, Patriot Front, Asatru Folk Assembly
Most common extremist ideologies: Anti-government (16 groups), Anti-LGBTQ (5 groups)
Statewide racial and ethnic makeup: 63.5% White; 3.8% Black, 9.7% Asian; 14.0% Hispanic or Latino
State nationality demographics: 84.7% native; 7.5% naturalized U.S. citizen; 7.8% foreign-born non-U.S. citizen
17. Arizona
Extremist groups in 2023: 5.3 per million people (39 total)
Active extremist groups include: Moms for Liberty, Proud Boys, Patriot Front
Most common extremist ideologies: Anti-government (9 groups), Anti-LGBTQ, Militia Movement, White Nationalist (5 groups each)
Statewide racial and ethnic makeup: 51.8% White; 4.4% Black, 3.5% Asian; 32.5% Hispanic or Latino
State nationality demographics: 86.9% native; 6.5% naturalized U.S. citizen; 6.6% foreign-born non-U.S. citizen
16. Oregon
Extremist groups in 2023: 5.4 per million people (23 total)
Active extremist groups include: Moms for Liberty, Proud Boys, Patriot Front
Most common extremist ideologies: Anti-government (10 groups), General Hate (4 groups)
Statewide racial and ethnic makeup: 71.6% White; 1.8% Black, 4.5% Asian; 14.4% Hispanic or Latino
State nationality demographics: 90.1% native; 4.8% naturalized U.S. citizen; 5.2% foreign-born non-U.S. citizen
15. Utah
Extremist groups in 2023: 5.9 per million people (20 total)
Active extremist groups include: Proud Boys, Proud Boys, Patriot Front
Most common extremist ideologies: Anti-government (14 groups), White Nationalist (3 groups)
Statewide racial and ethnic makeup: 75.6% White; 1.0% Black, 2.4% Asian; 15.1% Hispanic or Latino
State nationality demographics: 91.4% native; 3.6% naturalized U.S. citizen; 5.0% foreign-born non-U.S. citizen
14. Pennsylvania
Extremist groups in 2023: 6.0 per million people (78 total)
Active extremist groups include: Moms for Liberty, Proud Boys, National Alliance, Keystone United
Most common extremist ideologies: Anti-government (48 groups), White Nationalist (9 groups)
Statewide racial and ethnic makeup: 73.1% White; 10.1% Black, 3.8% Asian; 8.6% Hispanic or Latino
State nationality demographics: 92.5% native; 4.3% naturalized U.S. citizen; 3.3% foreign-born non-U.S. citizen
13. South Carolina
Extremist groups in 2023: 6.2 per million people (33 total)
Active extremist groups include: Moms for Liberty, Proud Boys, Patriot Front
Most common extremist ideologies: Anti-government (18 groups), White Nationalist (6 groups)
Statewide racial and ethnic makeup: 62.5% White; 24.9% Black, 1.7% Asian; 6.5% Hispanic or Latino
State nationality demographics: 94.8% native; 2.5% naturalized U.S. citizen; 2.7% foreign-born non-U.S. citizen
12. Hawaii
Extremist groups in 2023: 6.2 per million people (9 total)
Active extremist groups include: Moms for Liberty, Proud Boys
Most common extremist ideologies: Sovereign Citizens Movement (5 groups), Anti-government (2 groups)
Statewide racial and ethnic makeup: 20.7% White; 1.6% Black, 34.6% Asian; 11.1% Hispanic or Latino
State nationality demographics: 82.9% native; 10.6% naturalized U.S. citizen; 6.5% foreign-born non-U.S. citizen
11. Nebraska
Extremist groups in 2023: 6.6 per million people (13 total)
Active extremist groups include: Moms for Liberty, Patriot Front, Asatru Folk Assembly
Most common extremist ideologies: Anti-government (5 groups), Neo-Nazi, White Nationalist (2 groups each)
Statewide racial and ethnic makeup: 75.8% White; 4.5% Black, 2.5% Asian; 12.3% Hispanic or Latino
State nationality demographics: 92.8% native; 3.2% naturalized U.S. citizen; 4.0% foreign-born non-U.S. citizen
10. West Virginia
Extremist groups in 2023: 6.8 per million people (12 total)
Active extremist groups include: Moms for Liberty, Patriot Front, Asatru Folk Assembly, VDARE
Most common extremist ideologies: White Nationalist (5 groups), Anti-government (3 groups)
Statewide racial and ethnic makeup: 89.8% White; 3.3% Black, 0.7% Asian; 1.9% Hispanic or Latino
State nationality demographics: 98.2% native; 1.1% naturalized U.S. citizen; 0.8% foreign-born non-U.S. citizen
9. Alaska
Extremist groups in 2023: 6.8 per million people (5 total)
Active extremist groups include: Moms for Liberty, Asatru Folk Assembly
Most common extremist ideologies: Anti-government (3 groups), Neo-Volkisch, Sovereign Citizens Movement (1 group each)
Statewide racial and ethnic makeup: 57.4% White; 2.8% Black, 6.1% Asian; 7.7% Hispanic or Latino
State nationality demographics: 92.5% native; 4.7% naturalized U.S. citizen; 2.8% foreign-born non-U.S. citizen
8. Maine
Extremist groups in 2023: 8.7 per million people (12 total)
Active extremist groups include: Moms for Liberty, Patriot Front, Asatru Folk Assembly
Most common extremist ideologies: Anti-government (6 groups), Neo-Nazi, White Nationalist (2 groups each)
Statewide racial and ethnic makeup: 90.2% White; 1.6% Black, 1.2% Asian; 2.1% Hispanic or Latino
State nationality demographics: 95.9% native; 2.3% naturalized U.S. citizen; 1.8% foreign-born non-U.S. citizen
7. North Dakota
Extremist groups in 2023: 9.0 per million people (7 total)
Active extremist groups include: Moms for Liberty, Proud Boys, Patriot Front
Most common extremist ideologies: Anti-government, Neo-Volkisch, White Nationalist (2 groups each), General Hate (1 group)
Statewide racial and ethnic makeup: 82.0% White; 3.3% Black, 1.6% Asian; 4.4% Hispanic or Latino
State nationality demographics: 95.1% native; 2.0% naturalized U.S. citizen; 2.9% foreign-born non-U.S. citizen
6. Rhode Island
Extremist groups in 2023: 9.1 per million people (10 total)
Active extremist groups include: Moms for Liberty, Patriot Front, Nationalist Social Club
Most common extremist ideologies: Anti-government (5 groups), White Nationalist (2 groups)
Statewide racial and ethnic makeup: 68.2% White; 4.7% Black, 3.4% Asian; 17.6% Hispanic or Latino
State nationality demographics: 85.6% native; 7.5% naturalized U.S. citizen; 6.9% foreign-born non-U.S. citizen
5. New Hampshire
Extremist groups in 2023: 11.5 per million people (16 total)
Active extremist groups include: Moms for Liberty, Proud Boys, Patriot Front
Most common extremist ideologies: Anti-government (6 groups), Neo-Nazi, White Nationalist (2 groups each)
Statewide racial and ethnic makeup: 86.6% White; 1.3% Black, 2.6% Asian; 4.5% Hispanic or Latino
State nationality demographics: 93.8% native; 3.8% naturalized U.S. citizen; 2.4% foreign-born non-U.S. citizen
4. Idaho
Extremist groups in 2023: 12.9 per million people (25 total)
Active extremist groups include: Moms for Liberty, Asatru Folk Assembly, Three Percenters
Most common extremist ideologies: Anti-government (9 groups), White Nationalist (4 groups)
Statewide racial and ethnic makeup: 79.0% White; 0.6% Black, 1.3% Asian; 13.5% Hispanic or Latino
State nationality demographics: 94.0% native; 2.8% naturalized U.S. citizen; 3.2% foreign-born non-U.S. citizen
3. South Dakota
Extremist groups in 2023: 13.2 per million people (12 total)
Active extremist groups include: Moms for Liberty, Proud Boys, Asatru Folk Assembly
Most common extremist ideologies: Anti-government (5 groups), Sovereign Citizens Movement, White Nationalist (2 groups each)
Statewide racial and ethnic makeup: 79.9% White; 2.0% Black, 1.4% Asian; 4.7% Hispanic or Latino
State nationality demographics: 96.5% native; 1.9% naturalized U.S. citizen; 1.6% foreign-born non-U.S. citizen
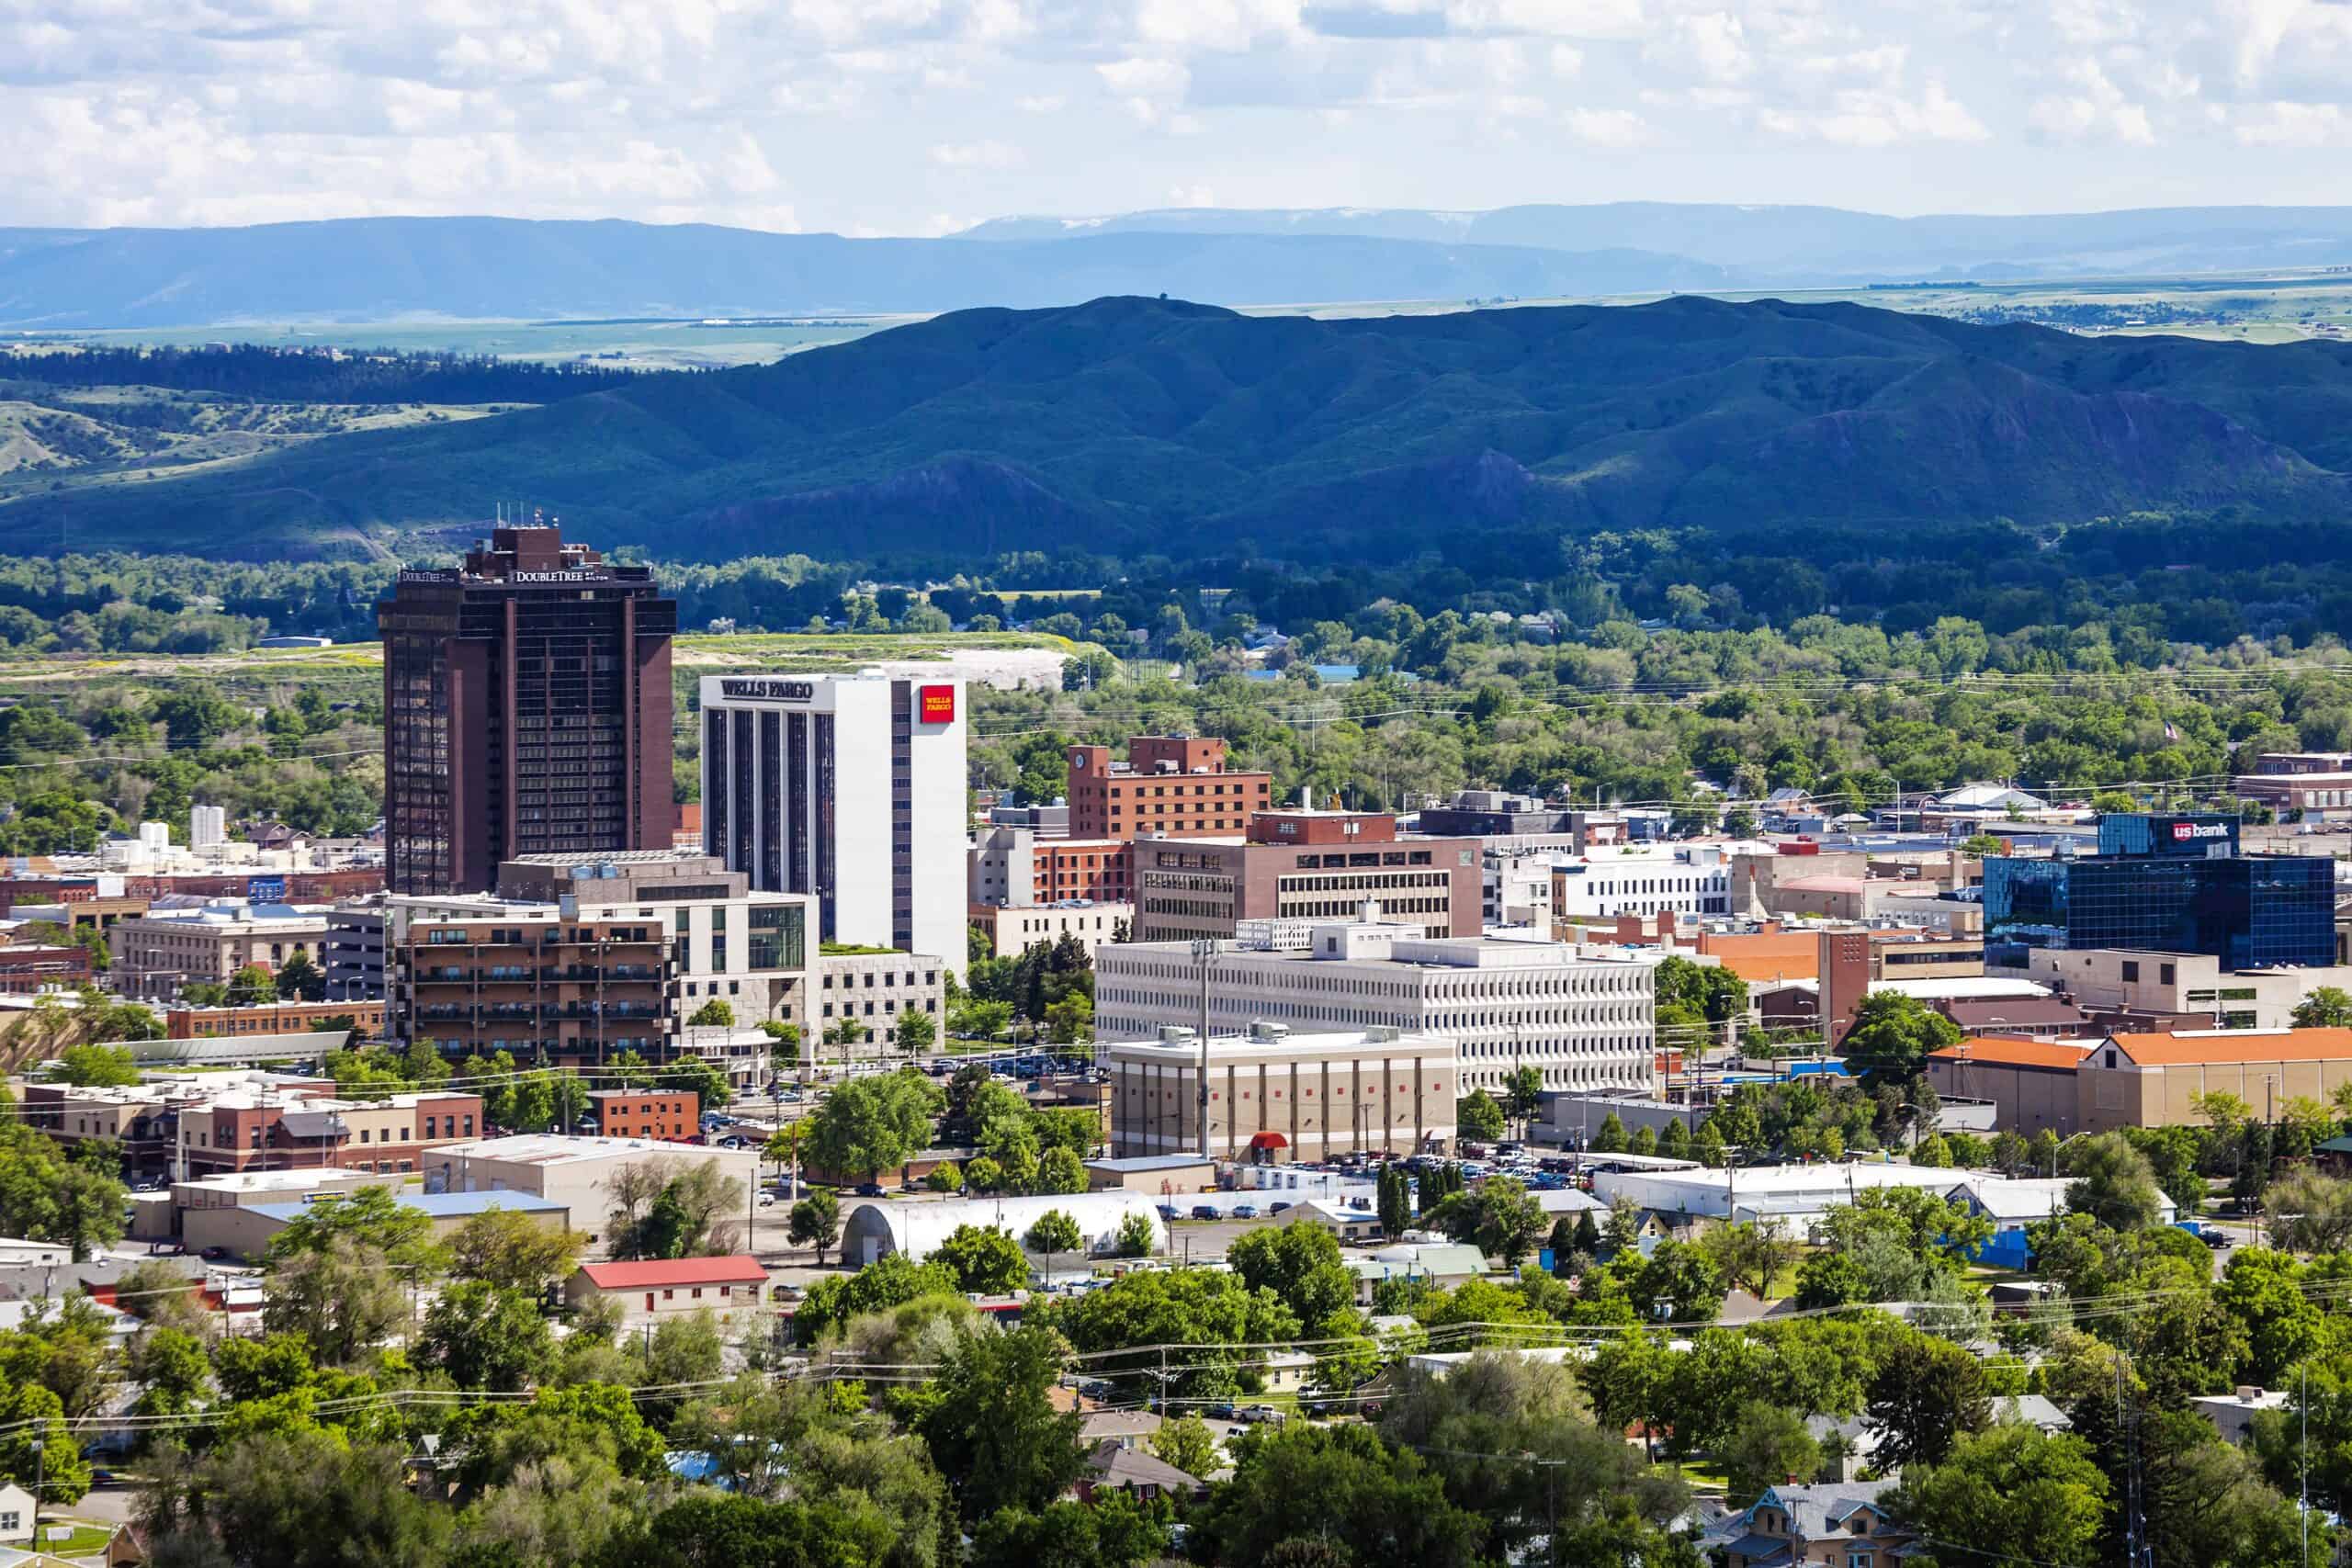
2. Montana
Extremist groups in 2023: 15.1 per million people (17 total)
Active extremist groups include: Moms for Liberty, National Socialist Movement
Most common extremist ideologies: Anti-government (7 groups), Conspiracy Propagandists (3 groups)
Statewide racial and ethnic makeup: 83.5% White; 0.3% Black, 0.7% Asian; 4.4% Hispanic or Latino
State nationality demographics: 97.7% native; 1.2% naturalized U.S. citizen; 1.1% foreign-born non-U.S. citizen
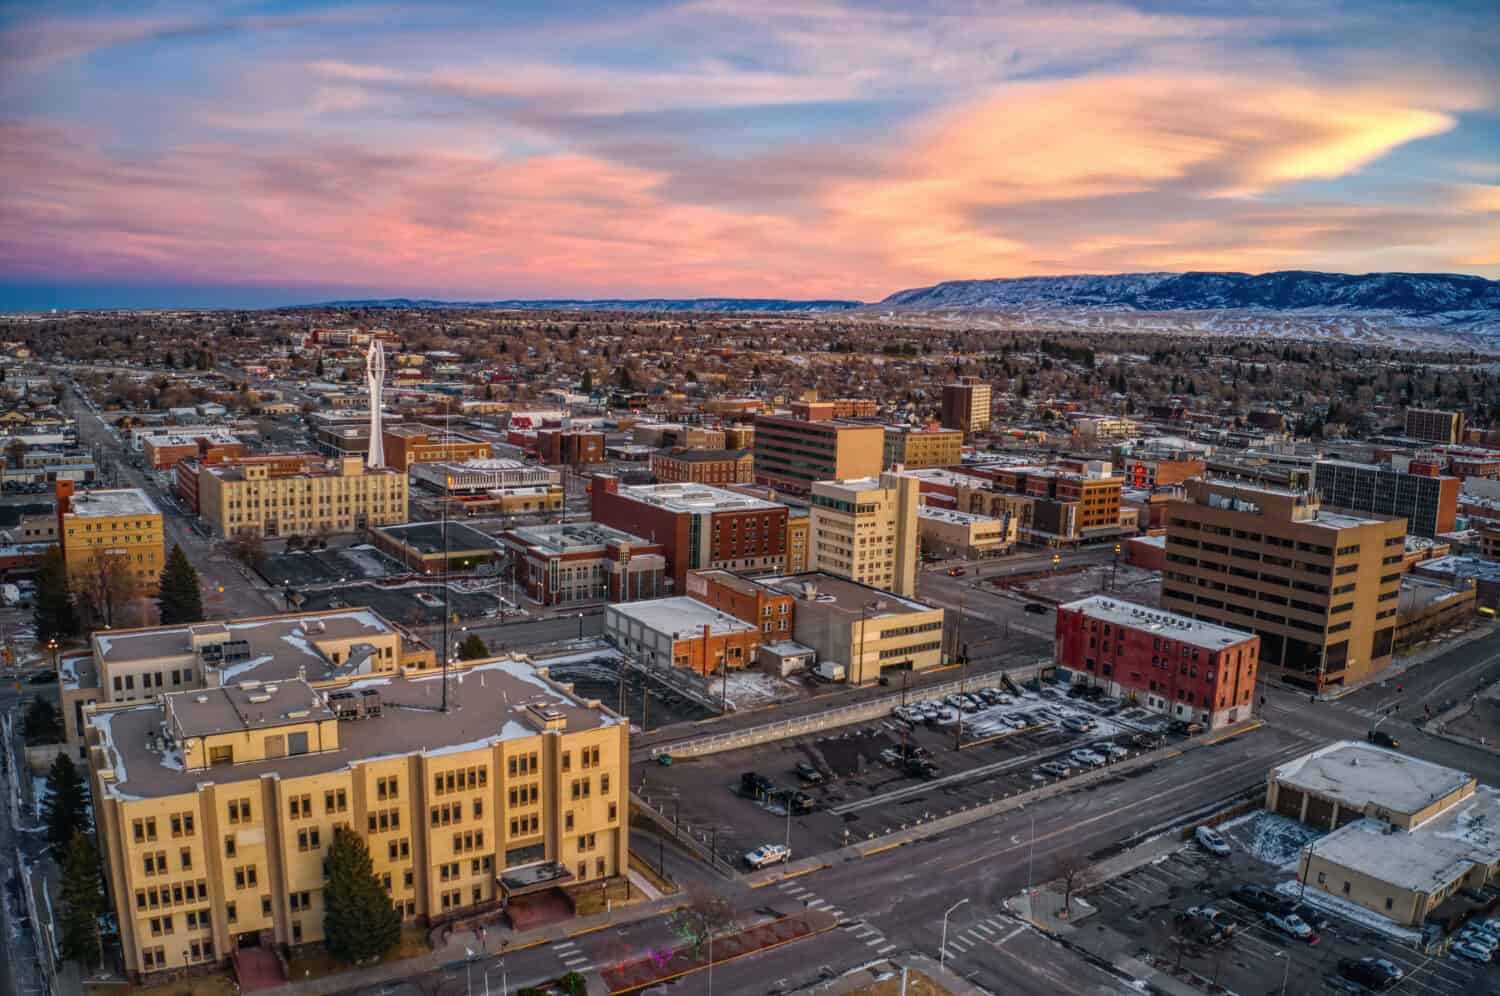
1. Wyoming
Extremist groups in 2023: 15.5 per million people (9 total)
Active extremist groups include: Moms for Liberty, Patriot Front
Most common extremist ideologies: Anti-government (5 groups), White Nationalist (2 groups)
Statewide racial and ethnic makeup: 81.4% White; 0.7% Black, 0.6% Asian; 10.8% Hispanic or Latino
State nationality demographics: 96.9% native; 1.5% naturalized U.S. citizen; 1.6% foreign-born non-U.S. citizen
Get Ready To Retire (Sponsored)
Start by taking a quick retirement quiz from SmartAsset that will match you with up to 3 financial advisors that serve your area and beyond in 5 minutes, or less.
Each advisor has been vetted by SmartAsset and is held to a fiduciary standard to act in your best interests.
Here’s how it works:
1. Answer SmartAsset advisor match quiz
2. Review your pre-screened matches at your leisure. Check out the advisors’ profiles.
3. Speak with advisors at no cost to you. Have an introductory call on the phone or introduction in person and choose whom to work with in the future