24/7 Wall St. Insights
- Vice President Kamala Harris is all but assured to be the Democratic nominee in November
- To close the gap with Donald Trump in the polls, the Harris campaign needs to target key voting blocs in the coming months
- Also: Discover the next Nvidia
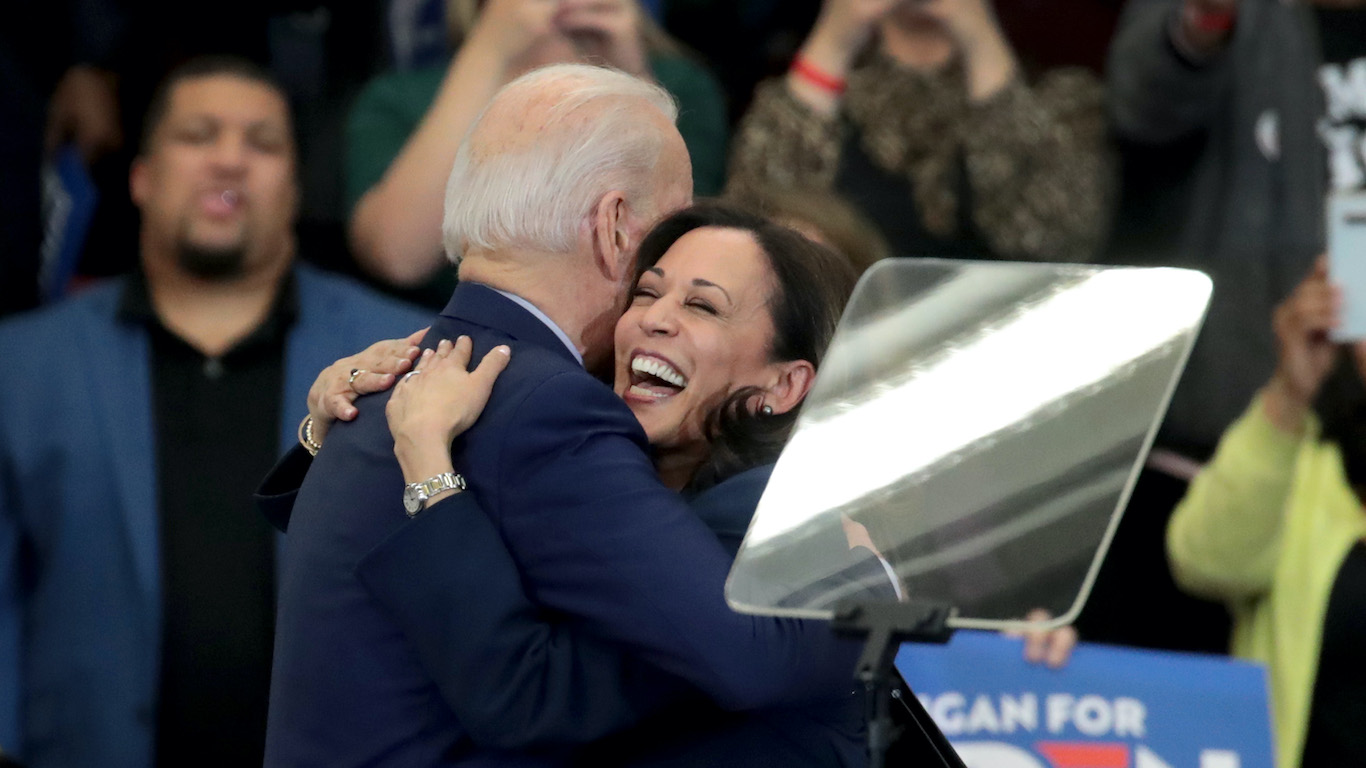
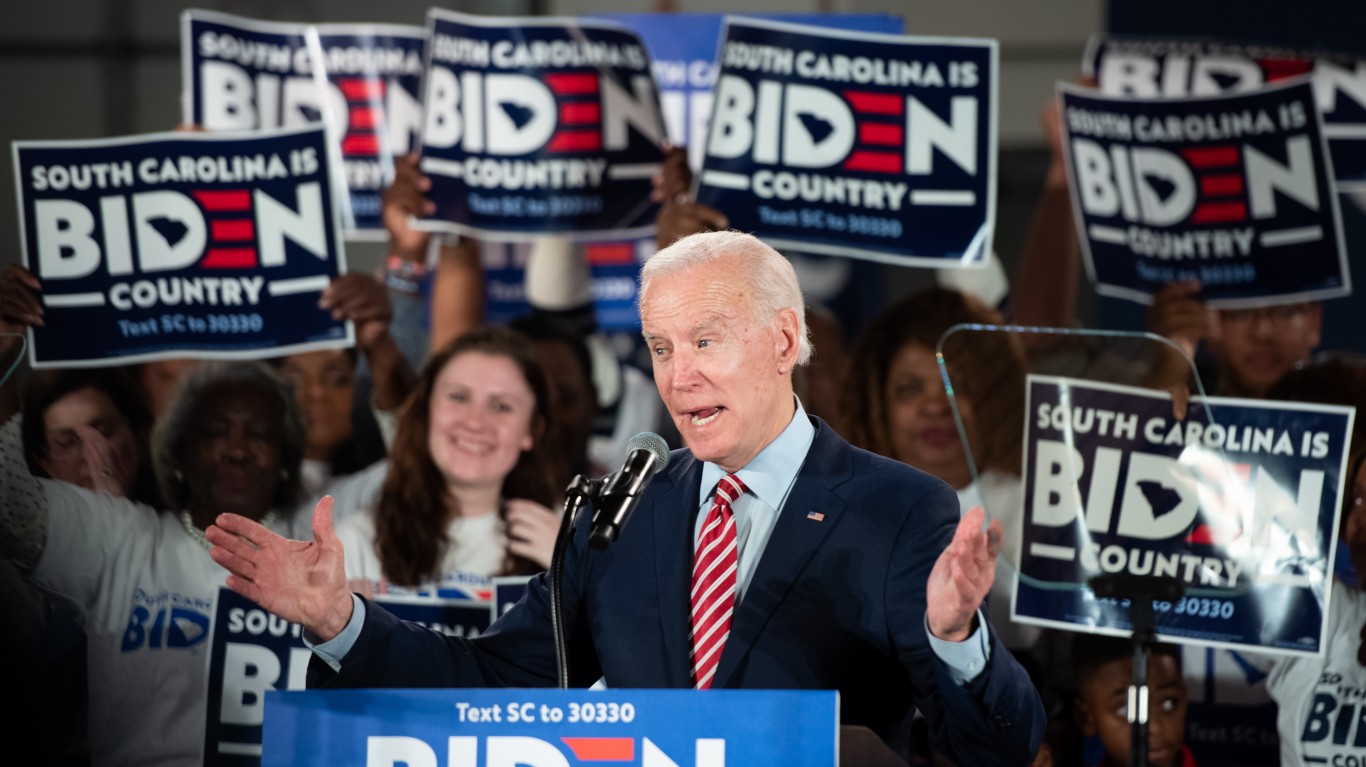
In the days since President Joe Biden announced plans to end his campaign for a second-term, the Democratic Party has rallied around Vice President Kamala Harris. With an uncontested campaign and endorsements from influential party members, including congressional leaders and Biden himself, Harris stands as the de facto choice for the top of the Democratic ticket in November.
With less than four months until Election Day, Harris’ window to mount a campaign is relatively short — and pulling in over $100 million in political contributions in the first few days, she is off to a strong start.
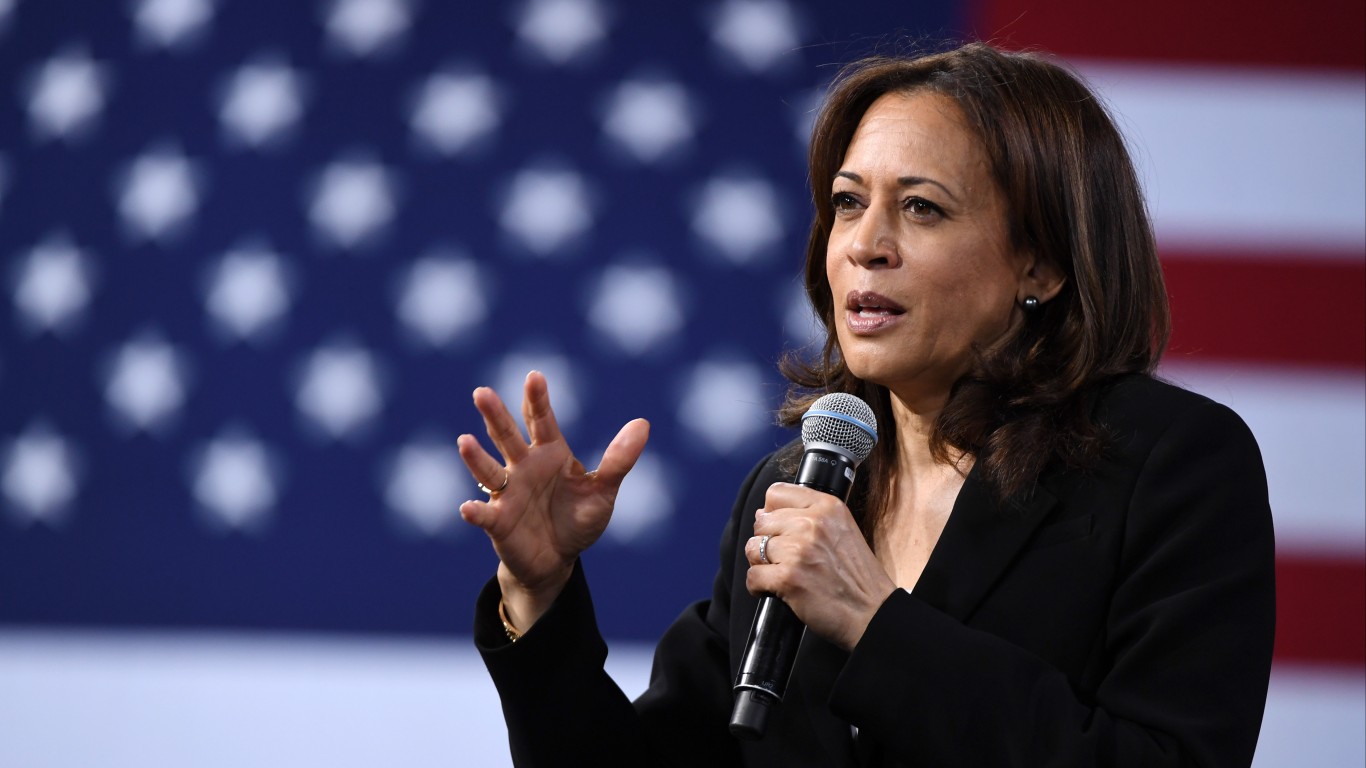
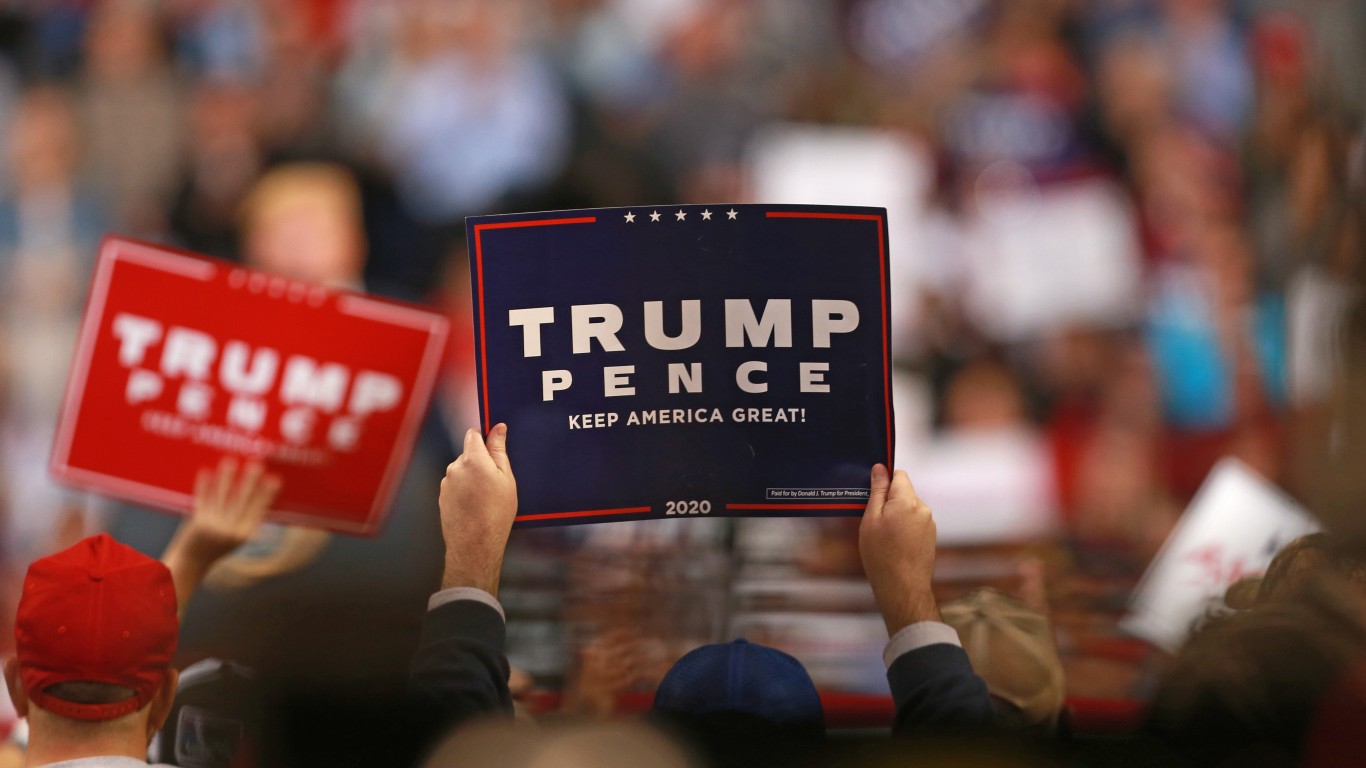
Still, polling shows Harris lagging behind the Republican candidate, former President Donald Trump. According to a survey conducted by Morning Consult, a public opinion research company, 45% of registered voters say they would cast a ballot for Harris if the election were today, compared to 47% who would back Trump.
To close the gap by Election Day, Harris will need to mobilize a broad coalition of voters from all age groups, education levels, ethnicities, and even political ideologies. In an abbreviated presidential campaign, the Harris team will specifically target millions of Americans within these demographic groups to gain support. Currently, Harris is performing far better with certain subsets of voters than with others.
Using data from Morning Consult, 24/7 Wall St. identified the Americans who are most likely to vote for Harris. We reviewed the share of Americans across 32 demographic segments who would vote for Harris if the election were today. The demographics on this list fall into one of 10 categories, including generation, educational attainment, race or ethnicity, political ideology, party affiliation, gender, income level, and geographic region. All polling data was collected from July 21-22, 2024. Due to rounding, percentages may not add to 100%.
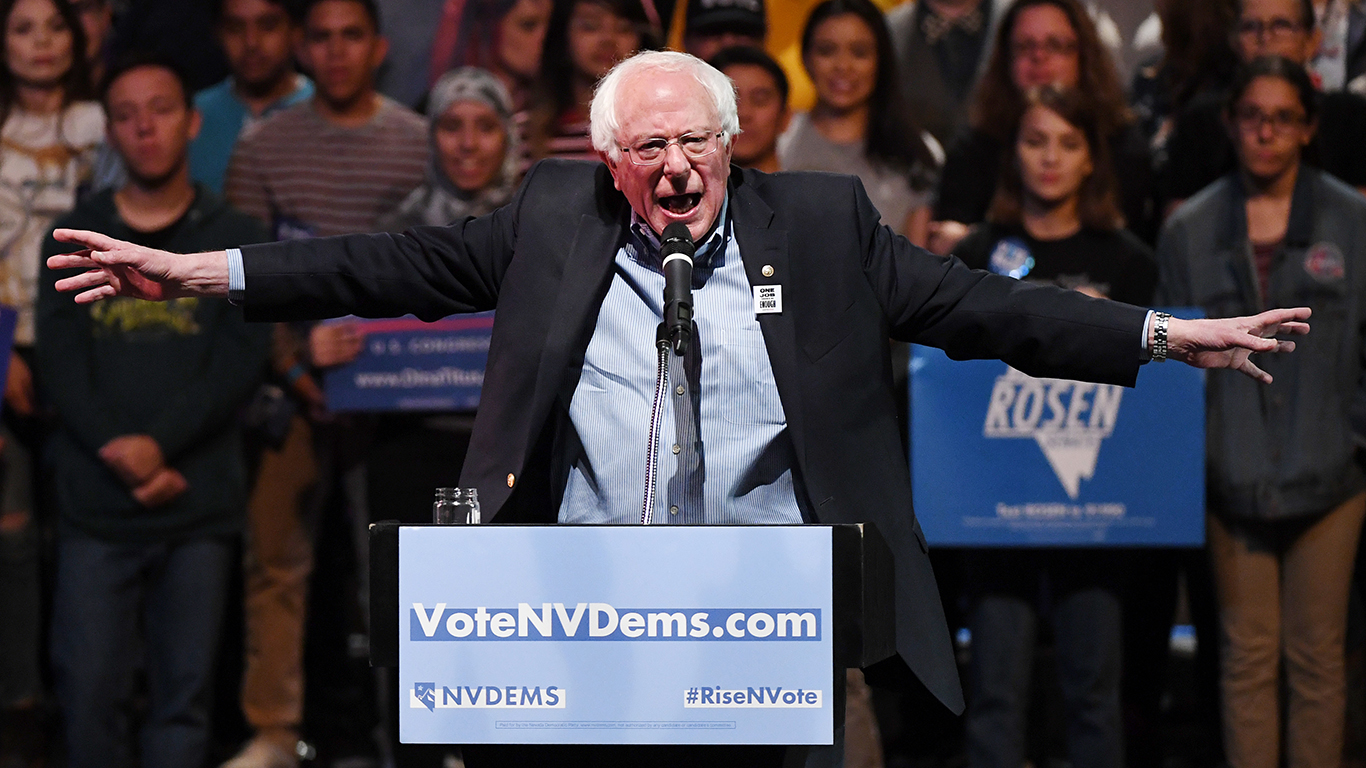
Among the groups of Americans on this list, the share who would vote for Harris today ranges from 3.6% to 88.3%. Not surprisingly, the strongest predictors of support for the Vice President are those directly related to politics. The Americans most likely to vote for Harris are those who belong to the Democratic Party and those who identify as ideologically liberal. Harris also has strong support from African Americans, voters with no religious affiliation, and Americans with a postgraduate degree. (Here is a look at the most liberal colleges in America.)
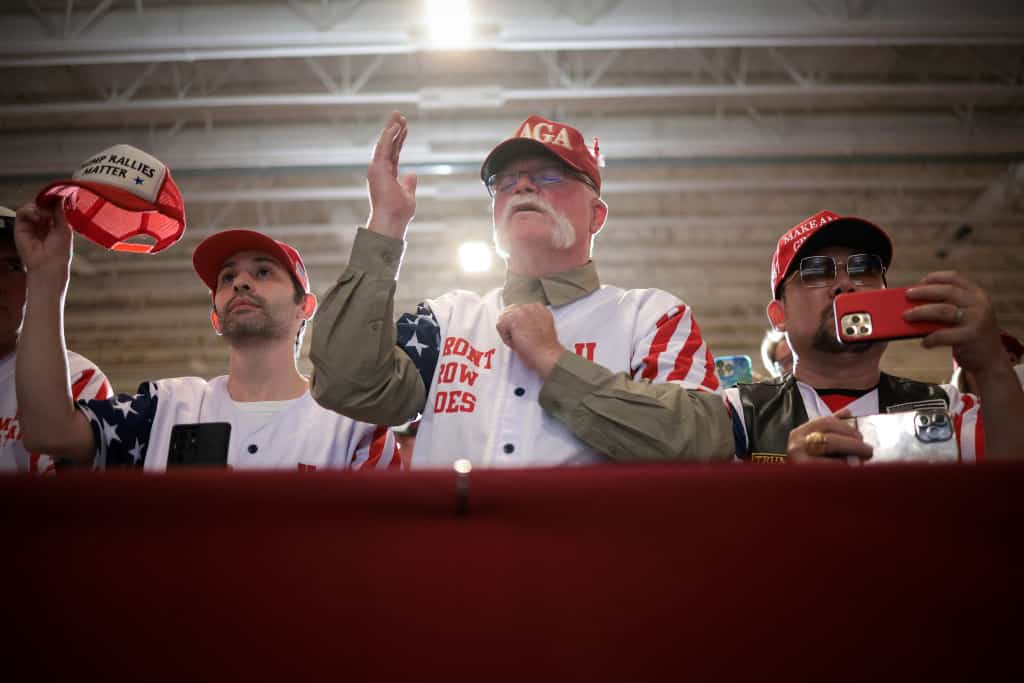
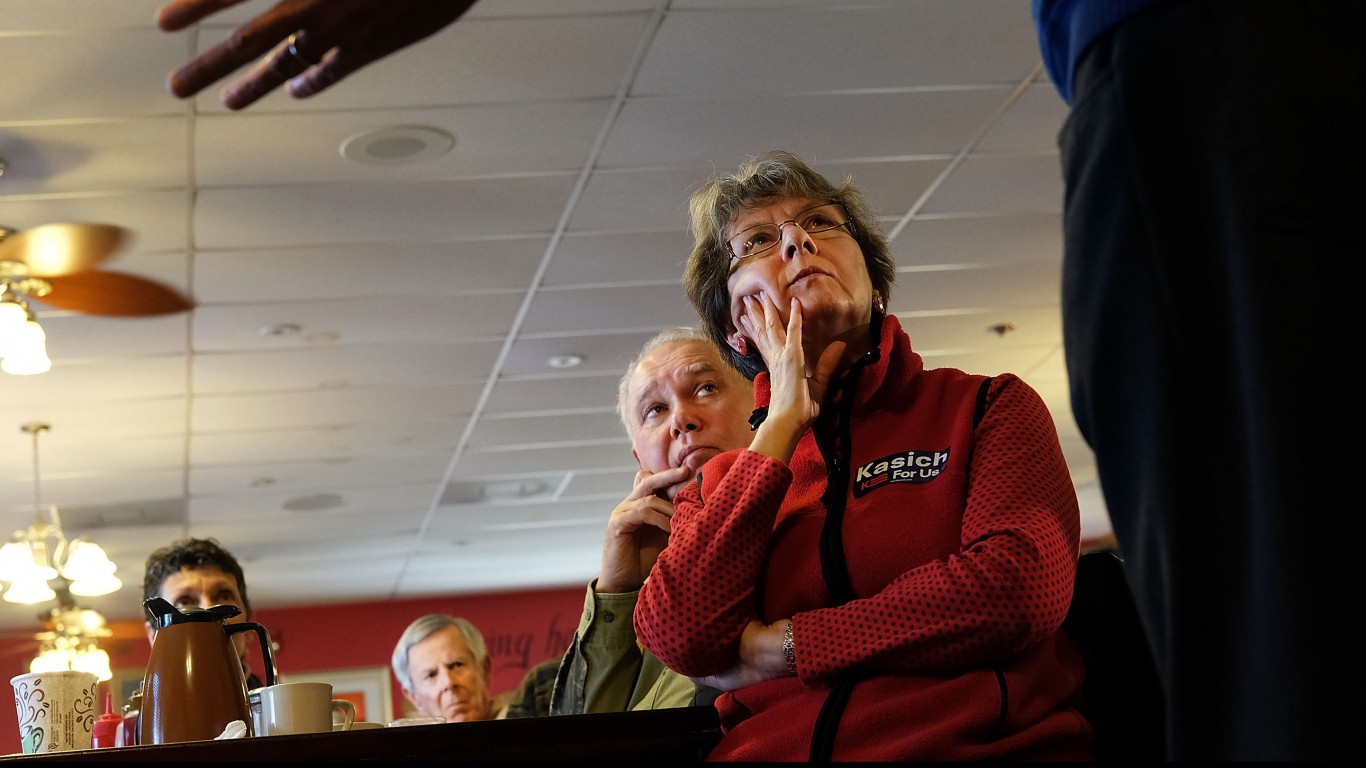
There are also several demographic groups with which the Harris campaign needs to make inroads in the coming months. Not surprisingly, fewer than 10% of Americans who identify as ideologically conservative, and only 3.6% of registered Republicans, would vote for Harris if the election were today. Support for Harris is also weak among Americans in rural communities, white voters, and Americans living in Southern states. Fewer than 40% of voters within each of these groups would vote for Harris.
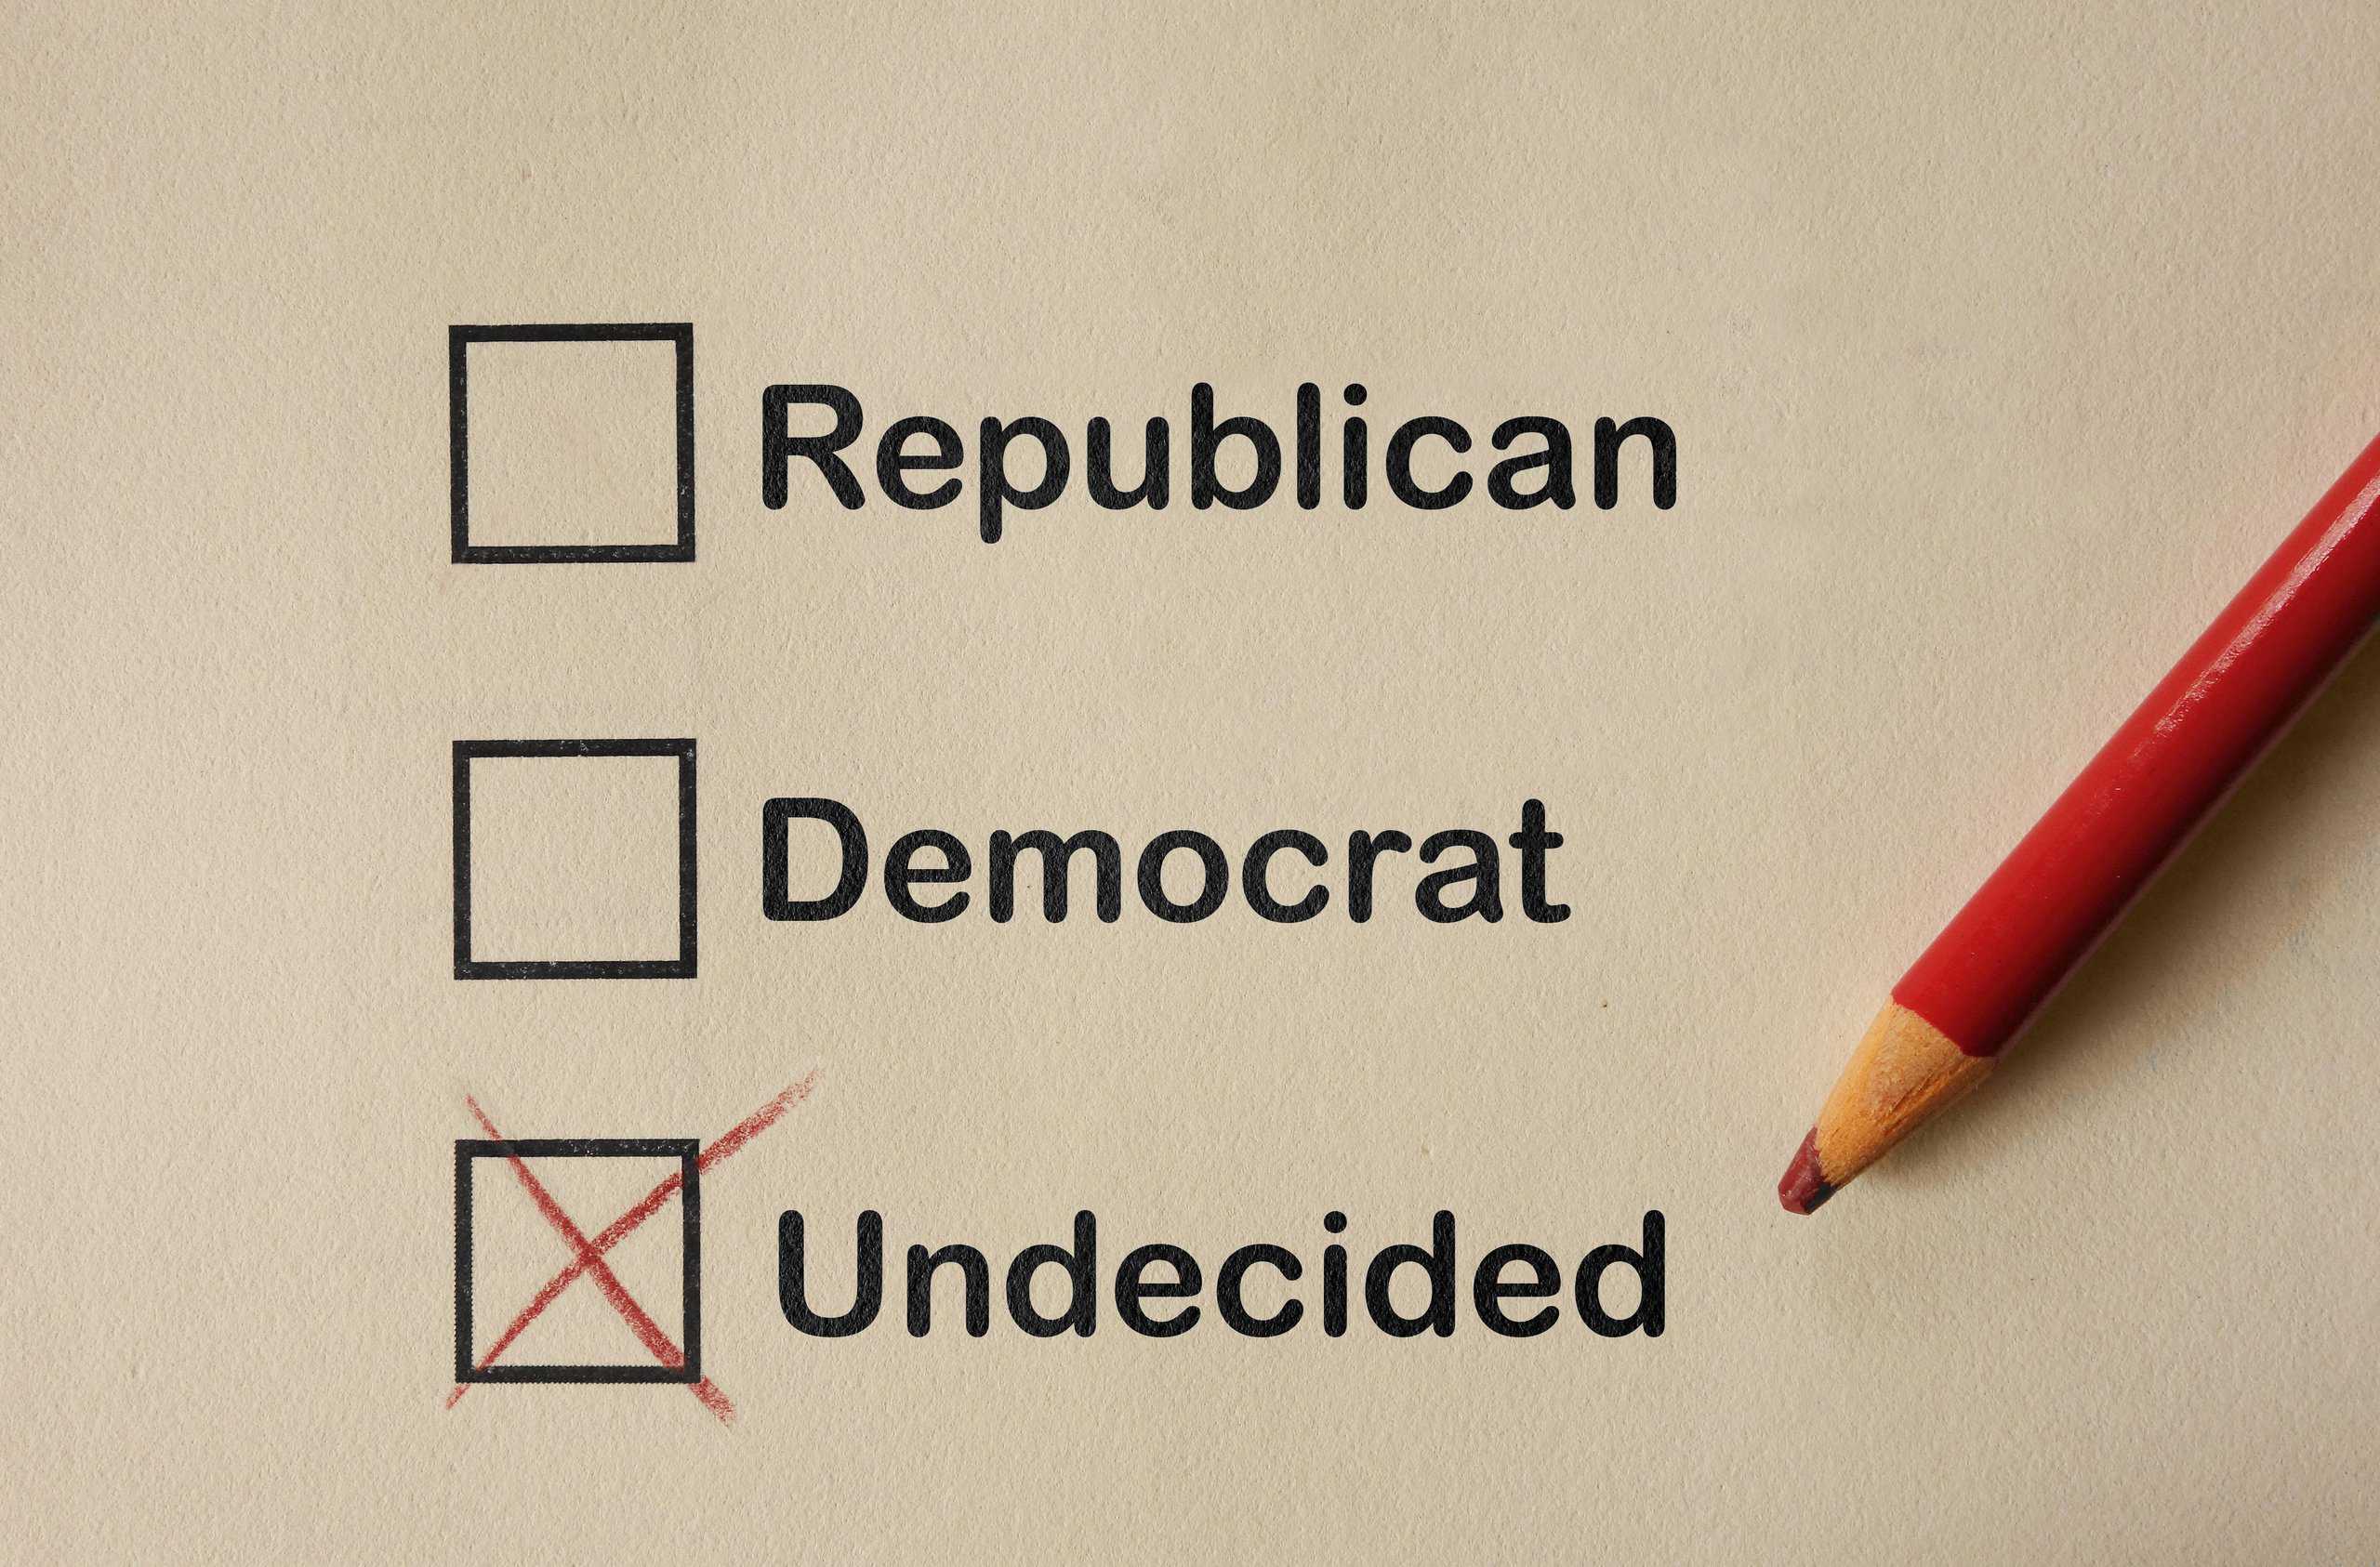
Notably, a relatively small but meaningful share of voters within every demographic group on this list remain undecided. Among the groups on this list, the share of voters who do not yet know who they would support ranges from about 2% to more than 10%. A Harris presidency may well hinge on her campaign’s ability to reach these voters. (Here is a look at the most important issues to voters in the 2024 election.)
Why It Matters
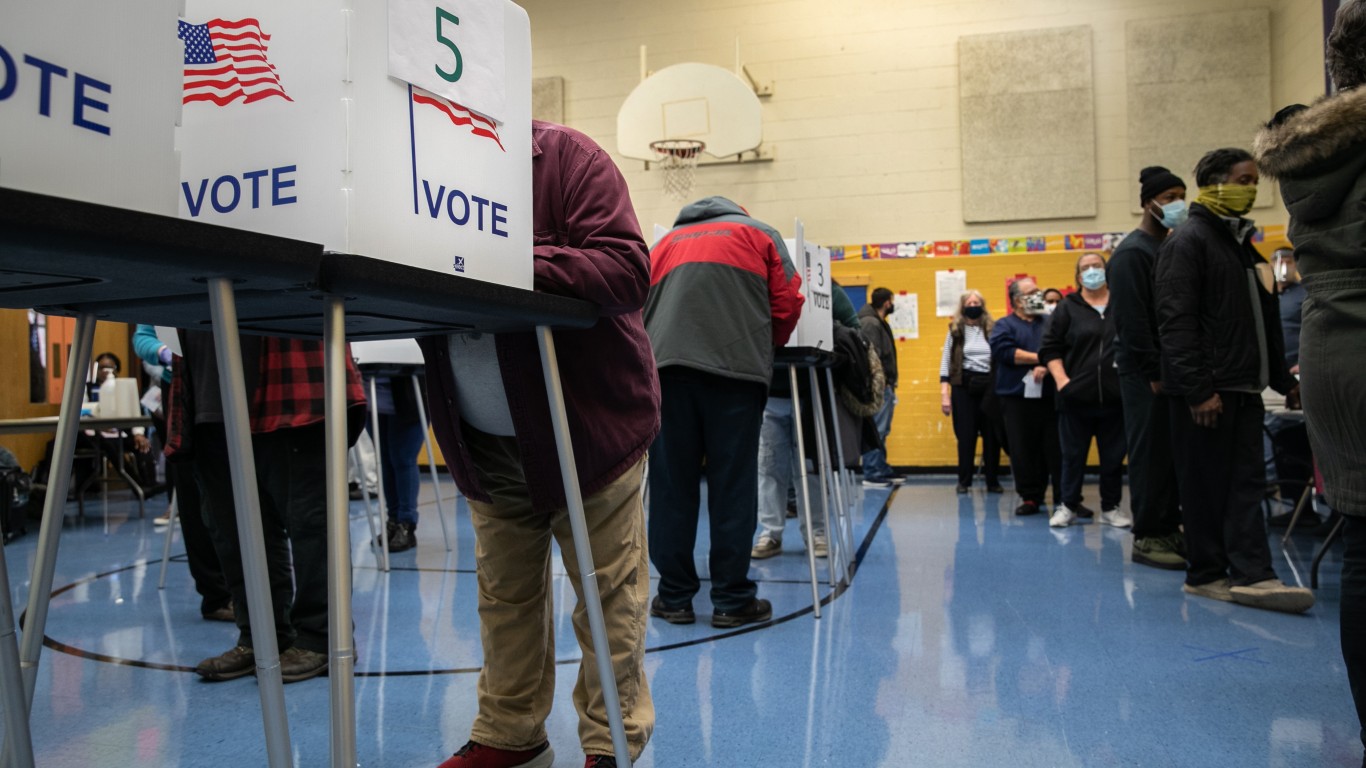
Home to over 333 million people, the United States is one of the largest democracies in world history. With such a broad constituency of diverging interests and priorities, it is impossible for political candidates to appeal to every voter. But while no two voters are exactly alike, patterns within key demographic groups can shed light on where presidential campaigns need to focus their resources. While Harris is currently trailing Trump in national polls, if she is able to effectively target and mobilize key voting blocs, the gap is not insurmountable.
Community type: Rural
- Share who would vote for Harris: 35.2% (30th highest of 32 categories considered)
- Share who would vote for Trump: 59.3% (3rd highest of 32 categories considered)
- Share who would vote for an alternative candidate: 3.0% (29th highest of 32 categories considered)
- Share with no opinion: 2.4% (27th highest of 32 categories considered)
Community type: Suburban

- Share who would vote for Harris: 45.5% (16th highest of 32 categories considered)
- Share who would vote for Trump: 45.1% (16th highest of 32 categories considered)
- Share who would vote for an alternative candidate: 5.0% (8th highest of 32 categories considered)
- Share with no opinion: 4.4% (11th highest of 32 categories considered)
Community type: Urban

- Share who would vote for Harris: 54.4% (6th highest of 32 categories considered)
- Share who would vote for Trump: 35.3% (26th highest of 32 categories considered)
- Share who would vote for an alternative candidate: 5.2% (6th highest of 32 categories considered)
- Share with no opinion: 5.0% (6th highest of 32 categories considered)
Education level: No college

- Share who would vote for Harris: 40.7% (26th highest of 32 categories considered)
- Share who would vote for Trump: 50.7% (7th highest of 32 categories considered)
- Share who would vote for an alternative candidate: 4.2% (21st highest of 32 categories considered)
- Share with no opinion: 4.5% (9th highest of 32 categories considered)
Education level: Bachelor’s degree holders

- Share who would vote for Harris: 48.5% (14th highest of 32 categories considered)
- Share who would vote for Trump: 42.6% (19th highest of 32 categories considered)
- Share who would vote for an alternative candidate: 5.3% (5th highest of 32 categories considered)
- Share with no opinion: 3.6% (19th highest of 32 categories considered)
Education level: Post-grad degree holders

- Share who would vote for Harris: 55.9% (5th highest of 32 categories considered)
- Share who would vote for Trump: 36.5% (25th highest of 32 categories considered)
- Share who would vote for an alternative candidate: 4.8% (14th highest of 32 categories considered)
- Share with no opinion: 2.9% (24th highest of 32 categories considered)
Gender: Male

- Share who would vote for Harris: 44.0% (21st highest of 32 categories considered)
- Share who would vote for Trump: 48.7% (10th highest of 32 categories considered)
- Share who would vote for an alternative candidate: 4.1% (22nd highest of 32 categories considered)
- Share with no opinion: 3.2% (23rd highest of 32 categories considered)
Gender: Female

- Share who would vote for Harris: 45.5% (15th highest of 32 categories considered)
- Share who would vote for Trump: 44.8% (17th highest of 32 categories considered)
- Share who would vote for an alternative candidate: 4.9% (9th highest of 32 categories considered)
- Share with no opinion: 4.8% (7th highest of 32 categories considered)
Generation: Millennials (born between 1981-1996)

- Share who would vote for Harris: 43.3% (23rd highest of 32 categories considered)
- Share who would vote for Trump: 47.8% (11th highest of 32 categories considered)
- Share who would vote for an alternative candidate: 4.5% (17th highest of 32 categories considered)
- Share with no opinion: 4.5% (10th highest of 32 categories considered)
Generation: Baby Boomers (born between 1946-1964)

- Share who would vote for Harris: 44.0% (22nd highest of 32 categories considered)
- Share who would vote for Trump: 49.1% (9th highest of 32 categories considered)
- Share who would vote for an alternative candidate: 4.2% (20th highest of 32 categories considered)
- Share with no opinion: 2.8% (25th highest of 32 categories considered)
Generation: GenXers (born between 1965-1980)

- Share who would vote for Harris: 44.3% (20th highest of 32 categories considered)
- Share who would vote for Trump: 46.6% (13th highest of 32 categories considered)
- Share who would vote for an alternative candidate: 5.1% (7th highest of 32 categories considered)
- Share with no opinion: 4.0% (17th highest of 32 categories considered)
Generation: GenZers (born between 1997-2012)

- Share who would vote for Harris: 51.5% (9th highest of 32 categories considered)
- Share who would vote for Trump: 37.4% (22nd highest of 32 categories considered)
- Share who would vote for an alternative candidate: 4.8% (13th highest of 32 categories considered)
- Share with no opinion: 6.2% (2nd highest of 32 categories considered)
Geographic region: South
- Share who would vote for Harris: 37.9% (29th highest of 32 categories considered)
- Share who would vote for Trump: 54.7% (4th highest of 32 categories considered)
- Share who would vote for an alternative candidate: 3.9% (25th highest of 32 categories considered)
- Share with no opinion: 3.6% (20th highest of 32 categories considered)
Geographic region: Midwest

- Share who would vote for Harris: 44.9% (18th highest of 32 categories considered)
- Share who would vote for Trump: 47.1% (12th highest of 32 categories considered)
- Share who would vote for an alternative candidate: 3.9% (26th highest of 32 categories considered)
- Share with no opinion: 4.2% (14th highest of 32 categories considered)
Geographic region: West

- Share who would vote for Harris: 50.5% (11th highest of 32 categories considered)
- Share who would vote for Trump: 40.2% (21st highest of 32 categories considered)
- Share who would vote for an alternative candidate: 4.9% (11th highest of 32 categories considered)
- Share with no opinion: 4.4% (12th highest of 32 categories considered)
Geographic region: Northeast

- Share who would vote for Harris: 52.2% (8th highest of 32 categories considered)
- Share who would vote for Trump: 37.1% (23rd highest of 32 categories considered)
- Share who would vote for an alternative candidate: 6.4% (4th highest of 32 categories considered)
- Share with no opinion: 4.3% (13th highest of 32 categories considered)
Income: Between $50k-$100k

- Share who would vote for Harris: 41.8% (25th highest of 32 categories considered)
- Share who would vote for Trump: 50.2% (8th highest of 32 categories considered)
- Share who would vote for an alternative candidate: 4.2% (18th highest of 32 categories considered)
- Share with no opinion: 3.8% (18th highest of 32 categories considered)
Income: Under $50k

- Share who would vote for Harris: 45.0% (17th highest of 32 categories considered)
- Share who would vote for Trump: 45.4% (15th highest of 32 categories considered)
- Share who would vote for an alternative candidate: 4.9% (12th highest of 32 categories considered)
- Share with no opinion: 4.7% (8th highest of 32 categories considered)
Income: $100k+

- Share who would vote for Harris: 49.4% (13th highest of 32 categories considered)
- Share who would vote for Trump: 42.9% (18th highest of 32 categories considered)
- Share who would vote for an alternative candidate: 4.5% (16th highest of 32 categories considered)
- Share with no opinion: 3.2% (22nd highest of 32 categories considered)
Party affiliation: Republican
- Share who would vote for Harris: 3.6% (the lowest of 32 categories considered)
- Share who would vote for Trump: 92.9% (the highest of 32 categories considered)
- Share who would vote for an alternative candidate: 1.7% (the lowest of 32 categories considered)
- Share with no opinion: 1.8% (the lowest of 32 categories considered)
Party affiliation: Independent
- Share who would vote for Harris: 42.2% (24th highest of 32 categories considered)
- Share who would vote for Trump: 36.9% (24th highest of 32 categories considered)
- Share who would vote for an alternative candidate: 10.3% (the highest of 32 categories considered)
- Share with no opinion: 10.6% (the highest of 32 categories considered)
Party affiliation: Democratic
- Share who would vote for Harris: 88.3% (the highest of 32 categories considered)
- Share who would vote for Trump: 5.6% (the lowest of 32 categories considered)
- Share who would vote for an alternative candidate: 3.9% (24th highest of 32 categories considered)
- Share with no opinion: 2.2% (29th highest of 32 categories considered)
Political ideology: Conservative
- Share who would vote for Harris: 9.6% (31st highest of 32 categories considered)
- Share who would vote for Trump: 85.7% (2nd highest of 32 categories considered)
- Share who would vote for an alternative candidate: 2.6% (30th highest of 32 categories considered)
- Share with no opinion: 2.1% (31st highest of 32 categories considered)
Political ideology: Moderate
- Share who would vote for Harris: 52.4% (7th highest of 32 categories considered)
- Share who would vote for Trump: 34.7% (28th highest of 32 categories considered)
- Share who would vote for an alternative candidate: 7.9% (2nd highest of 32 categories considered)
- Share with no opinion: 5.0% (5th highest of 32 categories considered)
Political ideology: Liberal
- Share who would vote for Harris: 83.2% (2nd highest of 32 categories considered)
- Share who would vote for Trump: 11.4% (31st highest of 32 categories considered)
- Share who would vote for an alternative candidate: 3.1% (28th highest of 32 categories considered)
- Share with no opinion: 2.2% (30th highest of 32 categories considered)
Race/Ethnicity: White
- Share who would vote for Harris: 39.4% (28th highest of 32 categories considered)
- Share who would vote for Trump: 53.2% (6th highest of 32 categories considered)
- Share who would vote for an alternative candidate: 4.2% (19th highest of 32 categories considered)
- Share with no opinion: 3.3% (21st highest of 32 categories considered)
Race/Ethnicity: Hispanic

- Share who would vote for Harris: 50.1% (12th highest of 32 categories considered)
- Share who would vote for Trump: 41.8% (20th highest of 32 categories considered)
- Share who would vote for an alternative candidate: 4.1% (23rd highest of 32 categories considered)
- Share with no opinion: 4.0% (16th highest of 32 categories considered)
Race/Ethnicity: Black

- Share who would vote for Harris: 71.6% (4th highest of 32 categories considered)
- Share who would vote for Trump: 18.2% (29th highest of 32 categories considered)
- Share who would vote for an alternative candidate: 4.9% (10th highest of 32 categories considered)
- Share with no opinion: 5.2% (4th highest of 32 categories considered)
Religion: Christian

- Share who would vote for Harris: 40.2% (27th highest of 32 categories considered)
- Share who would vote for Trump: 53.4% (5th highest of 32 categories considered)
- Share who would vote for an alternative candidate: 3.8% (27th highest of 32 categories considered)
- Share with no opinion: 2.6% (26th highest of 32 categories considered)
Religion: All non-Christian

- Share who would vote for Harris: 51.4% (10th highest of 32 categories considered)
- Share who would vote for Trump: 35.2% (27th highest of 32 categories considered)
- Share who would vote for an alternative candidate: 7.4% (3rd highest of 32 categories considered)
- Share with no opinion: 6.0% (3rd highest of 32 categories considered)
Religion: Atheist

- Share who would vote for Harris: 80.8% (3rd highest of 32 categories considered)
- Share who would vote for Trump: 14.6% (30th highest of 32 categories considered)
- Share who would vote for an alternative candidate: 2.3% (31st highest of 32 categories considered)
- Share with no opinion: 2.3% (28th highest of 32 categories considered)
All registered voters
- Share who would vote for Harris: 44.8% (19th highest of 32 categories considered)
- Share who would vote for Trump: 46.6% (14th highest of 32 categories considered)
- Share who would vote for an alternative candidate: 4.5% (15th highest of 32 categories considered)
- Share with no opinion: 4.0% (15th highest of 32 categories considered)
The Average American Has No Idea How Much Money You Can Make Today (Sponsor)
The last few years made people forget how much banks and CD’s can pay. Meanwhile, interest rates have spiked and many can afford to pay you much more, but most are keeping yields low and hoping you won’t notice.
But there is good news. To win qualified customers, some accounts are paying almost 10x the national average! That’s an incredible way to keep your money safe and earn more at the same time. Our top pick for high yield savings accounts includes other benefits as well. You can earn up to 3.80% with a Checking & Savings Account today Sign up and get up to $300 with direct deposit. No account fees. FDIC Insured.
Click here to see how much more you could be earning on your savings today. It takes just a few minutes to open an account to make your money work for you.
Our top pick for high yield savings accounts includes other benefits as well. You can earn up to 4.00% with a Checking & Savings Account from Sofi. Sign up and get up to $300 with direct deposit. No account fees. FDIC Insured.
Thank you for reading! Have some feedback for us?
Contact the 24/7 Wall St. editorial team.
Latest from 24/7


Our expert who first called NVIDIA in 2009 is predicting 2025 will see a historic AI breakthrough.
You can follow him investing $500,000 of his own money on our top AI stocks for free.