
24/7 Wall St. Insights
- This election cycle, Harris and Trump campaigns are focusing their resources on a handful of key swing-states, where the election will likely be decided.
- In most of the rest of the country, including Illinois, the outcome of the race is effectively predetermined.
- Illinois’ status as a Democratic stronghold is evidenced, in part, by historical voting patterns in several deep-blue counties.
- Also: Discover the next Nvidia
Election Day is less than 60 days away, and the two major party candidates — Democrat Kamala Harris and Republican Donald Trump — are locked in a very close race. According to a New York Times analysis of national polls, Harris is currently leading her opponent, with support from 49% of voters compared to Trump’s 47%. These numbers are expected to shift in the coming weeks, but even if Harris maintains her slim advantage in the national polls, a Democratic victory is by no means guaranteed. (Here is a look at which Americans are most likely to vote for Kamala Harris.)
As has been the case in other recent presidential elections, the outcome of the 2024 race will likely come down to a handful of closely contested swing states. This election cycle, the most competitive states, where both campaigns are focusing their resources, are Arizona, Georgia, Michigan, Nevada, North Carolina, Pennsylvania, and Wisconsin. In these places, the candidates are polling so closely that either one has a reasonable chance of winning in November. (This is how Trump and Harris are polling in every key swing state.)
In stark contrast to these battleground states, most other states are considered a virtual lock for either Trump or Harris. Based on current polling results, political affiliation of the electorate, and historical voting patterns, Illinois is one of these states. According to official records from the Federal Election Commission, the last time Illinois went to a Republican candidate was in 1988, when the GOP’s George H.W. Bush defeated Michael Dukakis, a Democrat.
Illinois’ status as a Democratic stronghold is driven by voters in certain parts of the state. There are 15 counties in Illinois where, over the last four presidential elections, an average of at least 50% of voters have cast a ballot for the Democratic candidate.
If historical patterns hold up this election year, these same counties will help deliver Illinois and its 19 electoral votes to Harris in November 2024. All historical, county-level, voting statistics are from the MIT Election Data and Science Lab’s County Presidential Election Returns 2000-2020 database, as compiled in the Harvard Dataverse, V13.
These are the most Democratic counties in Illinois.
Why It Matters
Because of the electoral college system, the outcome of presidential elections often comes down to voters in just a handful of closely contested states. In contrast to these battleground states, most of the country has reliably voted either Democratic or Republican in recent presidential elections. These states include Illinois, which, barring any unforeseen shake ups in the race, is all but guaranteed to go to Harris in 2024. Outcomes in states like Illinois are driven, in part, by party strongholds at the county-level.
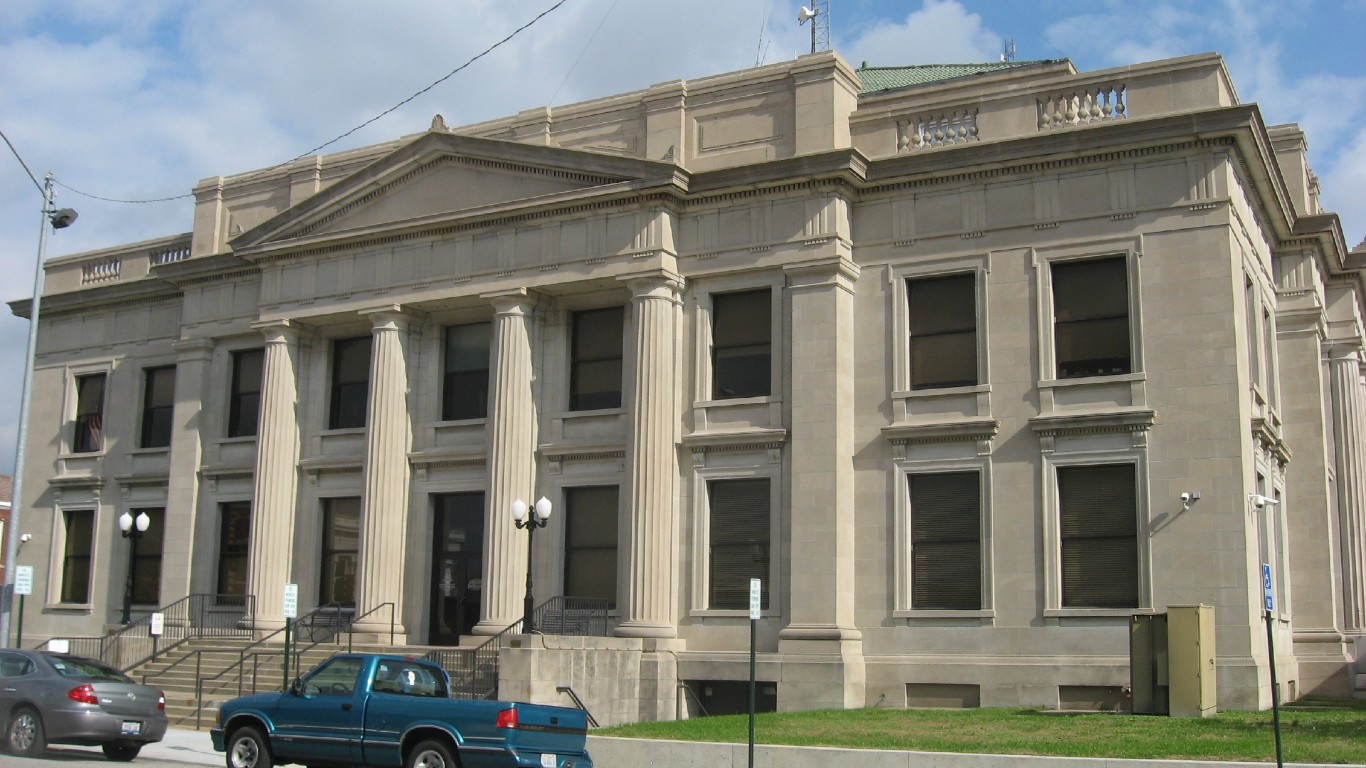
15. Alexander County

- Average popular vote split in last 4 presidential elections: 50.6% Democratic; 47.8% Republican
- Popular vote split in 2020 election: 42.6% Democrat (Joe Biden); 56.8% Republican (Donald Trump)
- Popular vote split in 2016 election: 44.3% Democrat (Hillary Clinton); 52.6% Republican (Donald Trump)
- Popular vote split in 2012 election: 56.1% Democrat (Barack Obama); 42.5% Republican (Mitt Romney)
- Popular vote split in 2008 election: 55.6% Democrat (Barack Obama); 43.0% Republican (John McCain)
- County population: 5,261
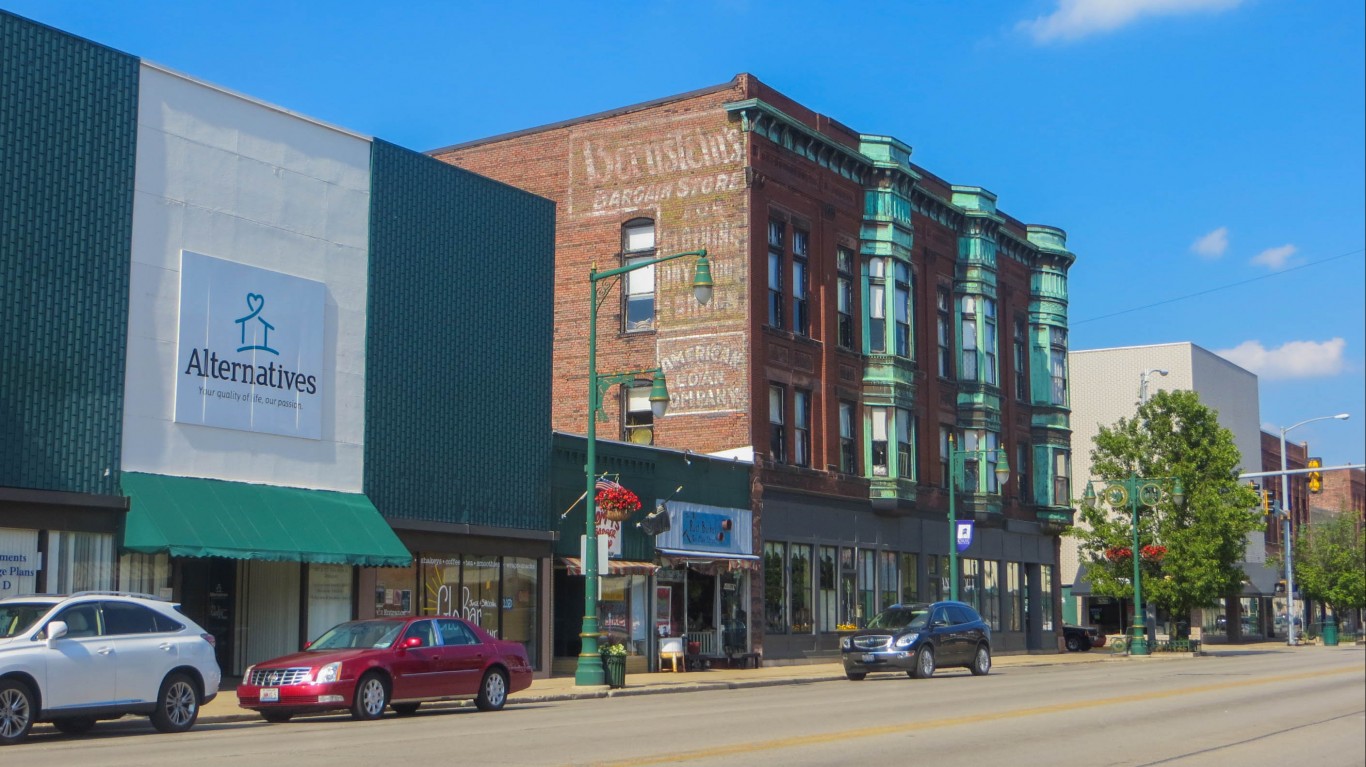
14. Whiteside County
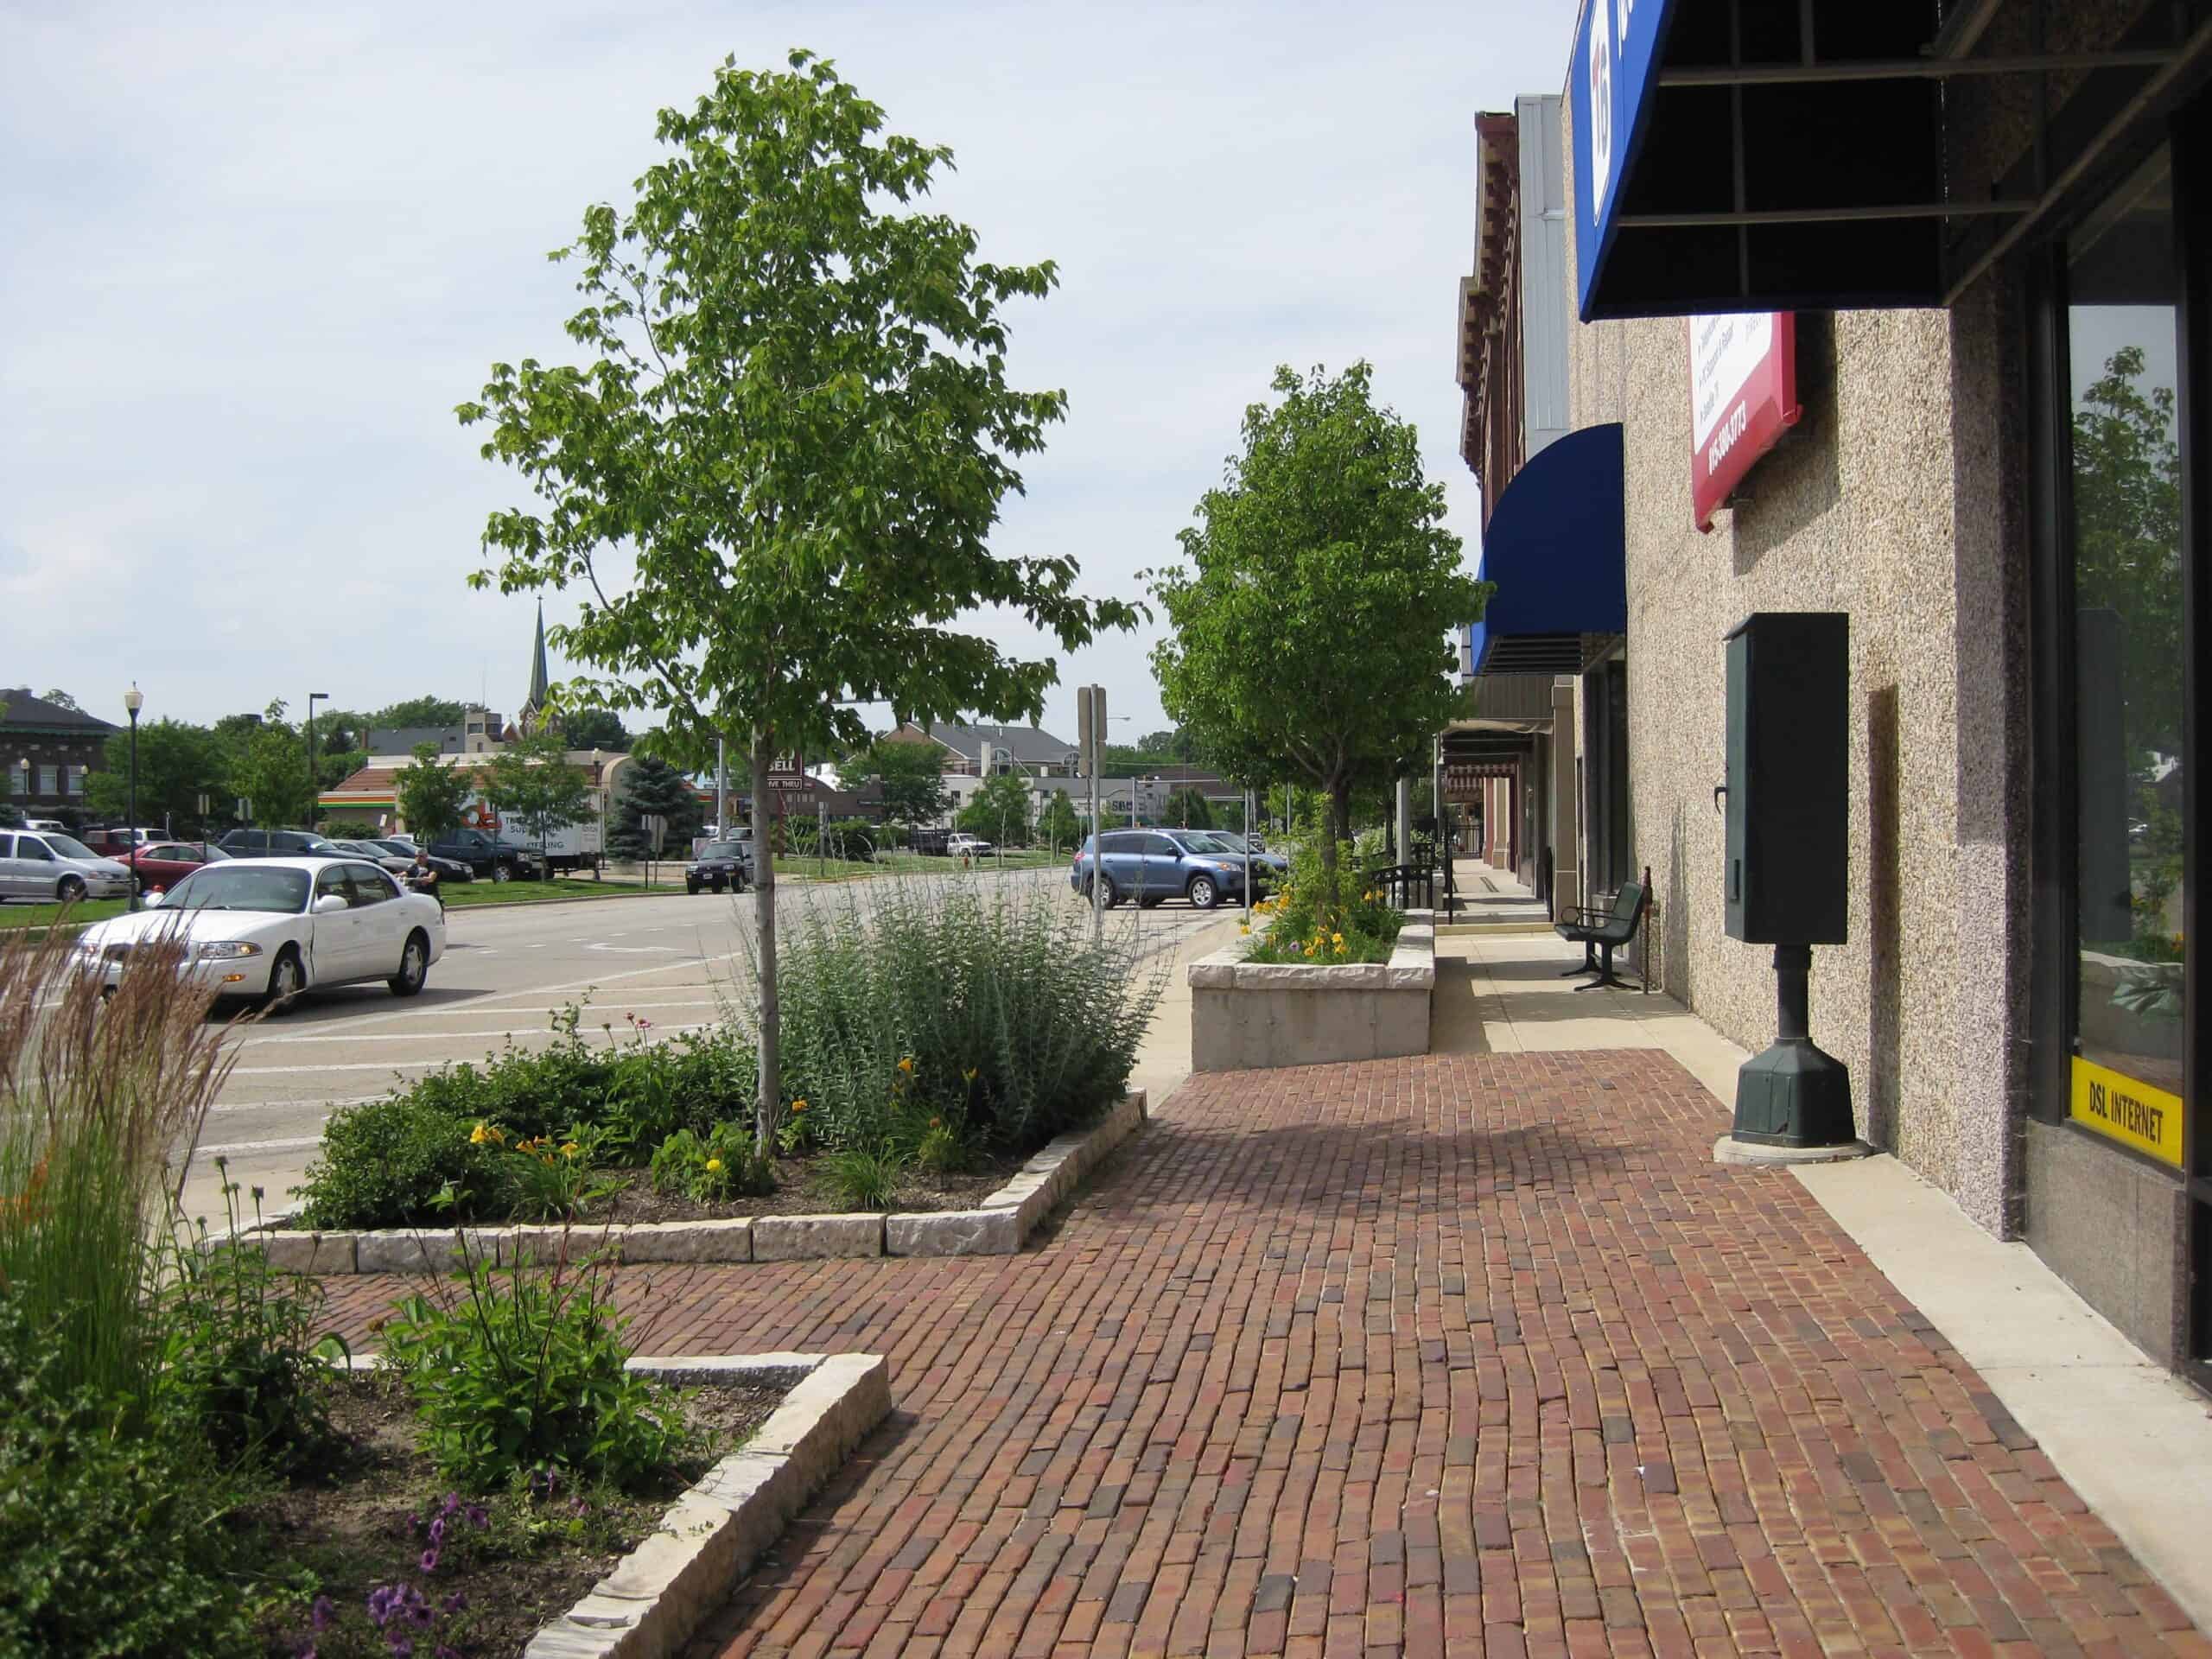
- Average popular vote split in last 4 presidential elections: 50.9% Democratic; 45.8% Republican
- Popular vote split in 2020 election: 44.8% Democrat (Joe Biden); 53.1% Republican (Donald Trump)
- Popular vote split in 2016 election: 43.1% Democrat (Hillary Clinton); 49.3% Republican (Donald Trump)
- Popular vote split in 2012 election: 57.8% Democrat (Barack Obama); 40.3% Republican (Mitt Romney)
- Popular vote split in 2008 election: 58.0% Democrat (Barack Obama); 40.4% Republican (John McCain)
- County population: 55,569
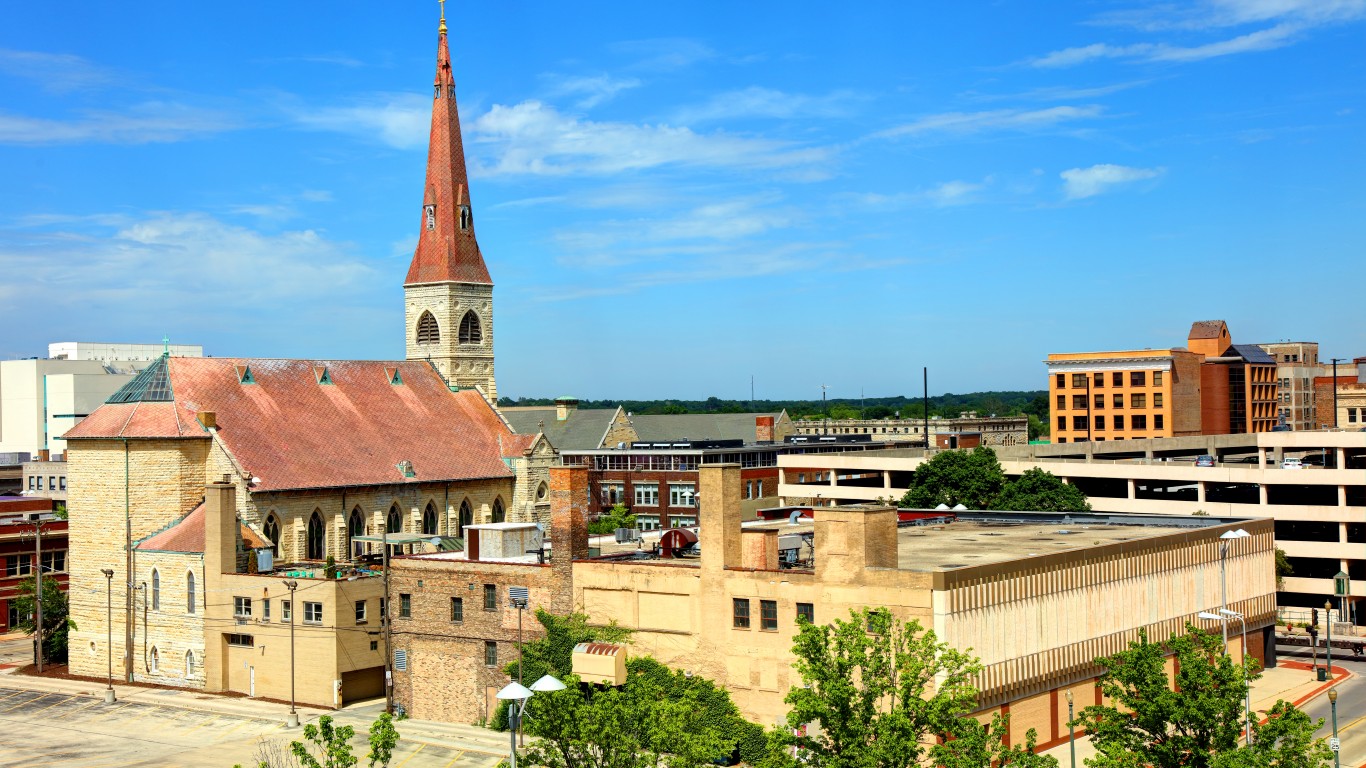
13. Winnebago County
- Average popular vote split in last 4 presidential elections: 51.2% Democratic; 45.9% Republican
- Popular vote split in 2020 election: 50.2% Democrat (Joe Biden); 47.7% Republican (Donald Trump)
- Popular vote split in 2016 election: 47.1% Democrat (Hillary Clinton); 47.0% Republican (Donald Trump)
- Popular vote split in 2012 election: 51.9% Democrat (Barack Obama); 46.3% Republican (Mitt Romney)
- Popular vote split in 2008 election: 55.6% Democrat (Barack Obama); 42.8% Republican (John McCain)
- County population: 284,591
12. Dekalb County
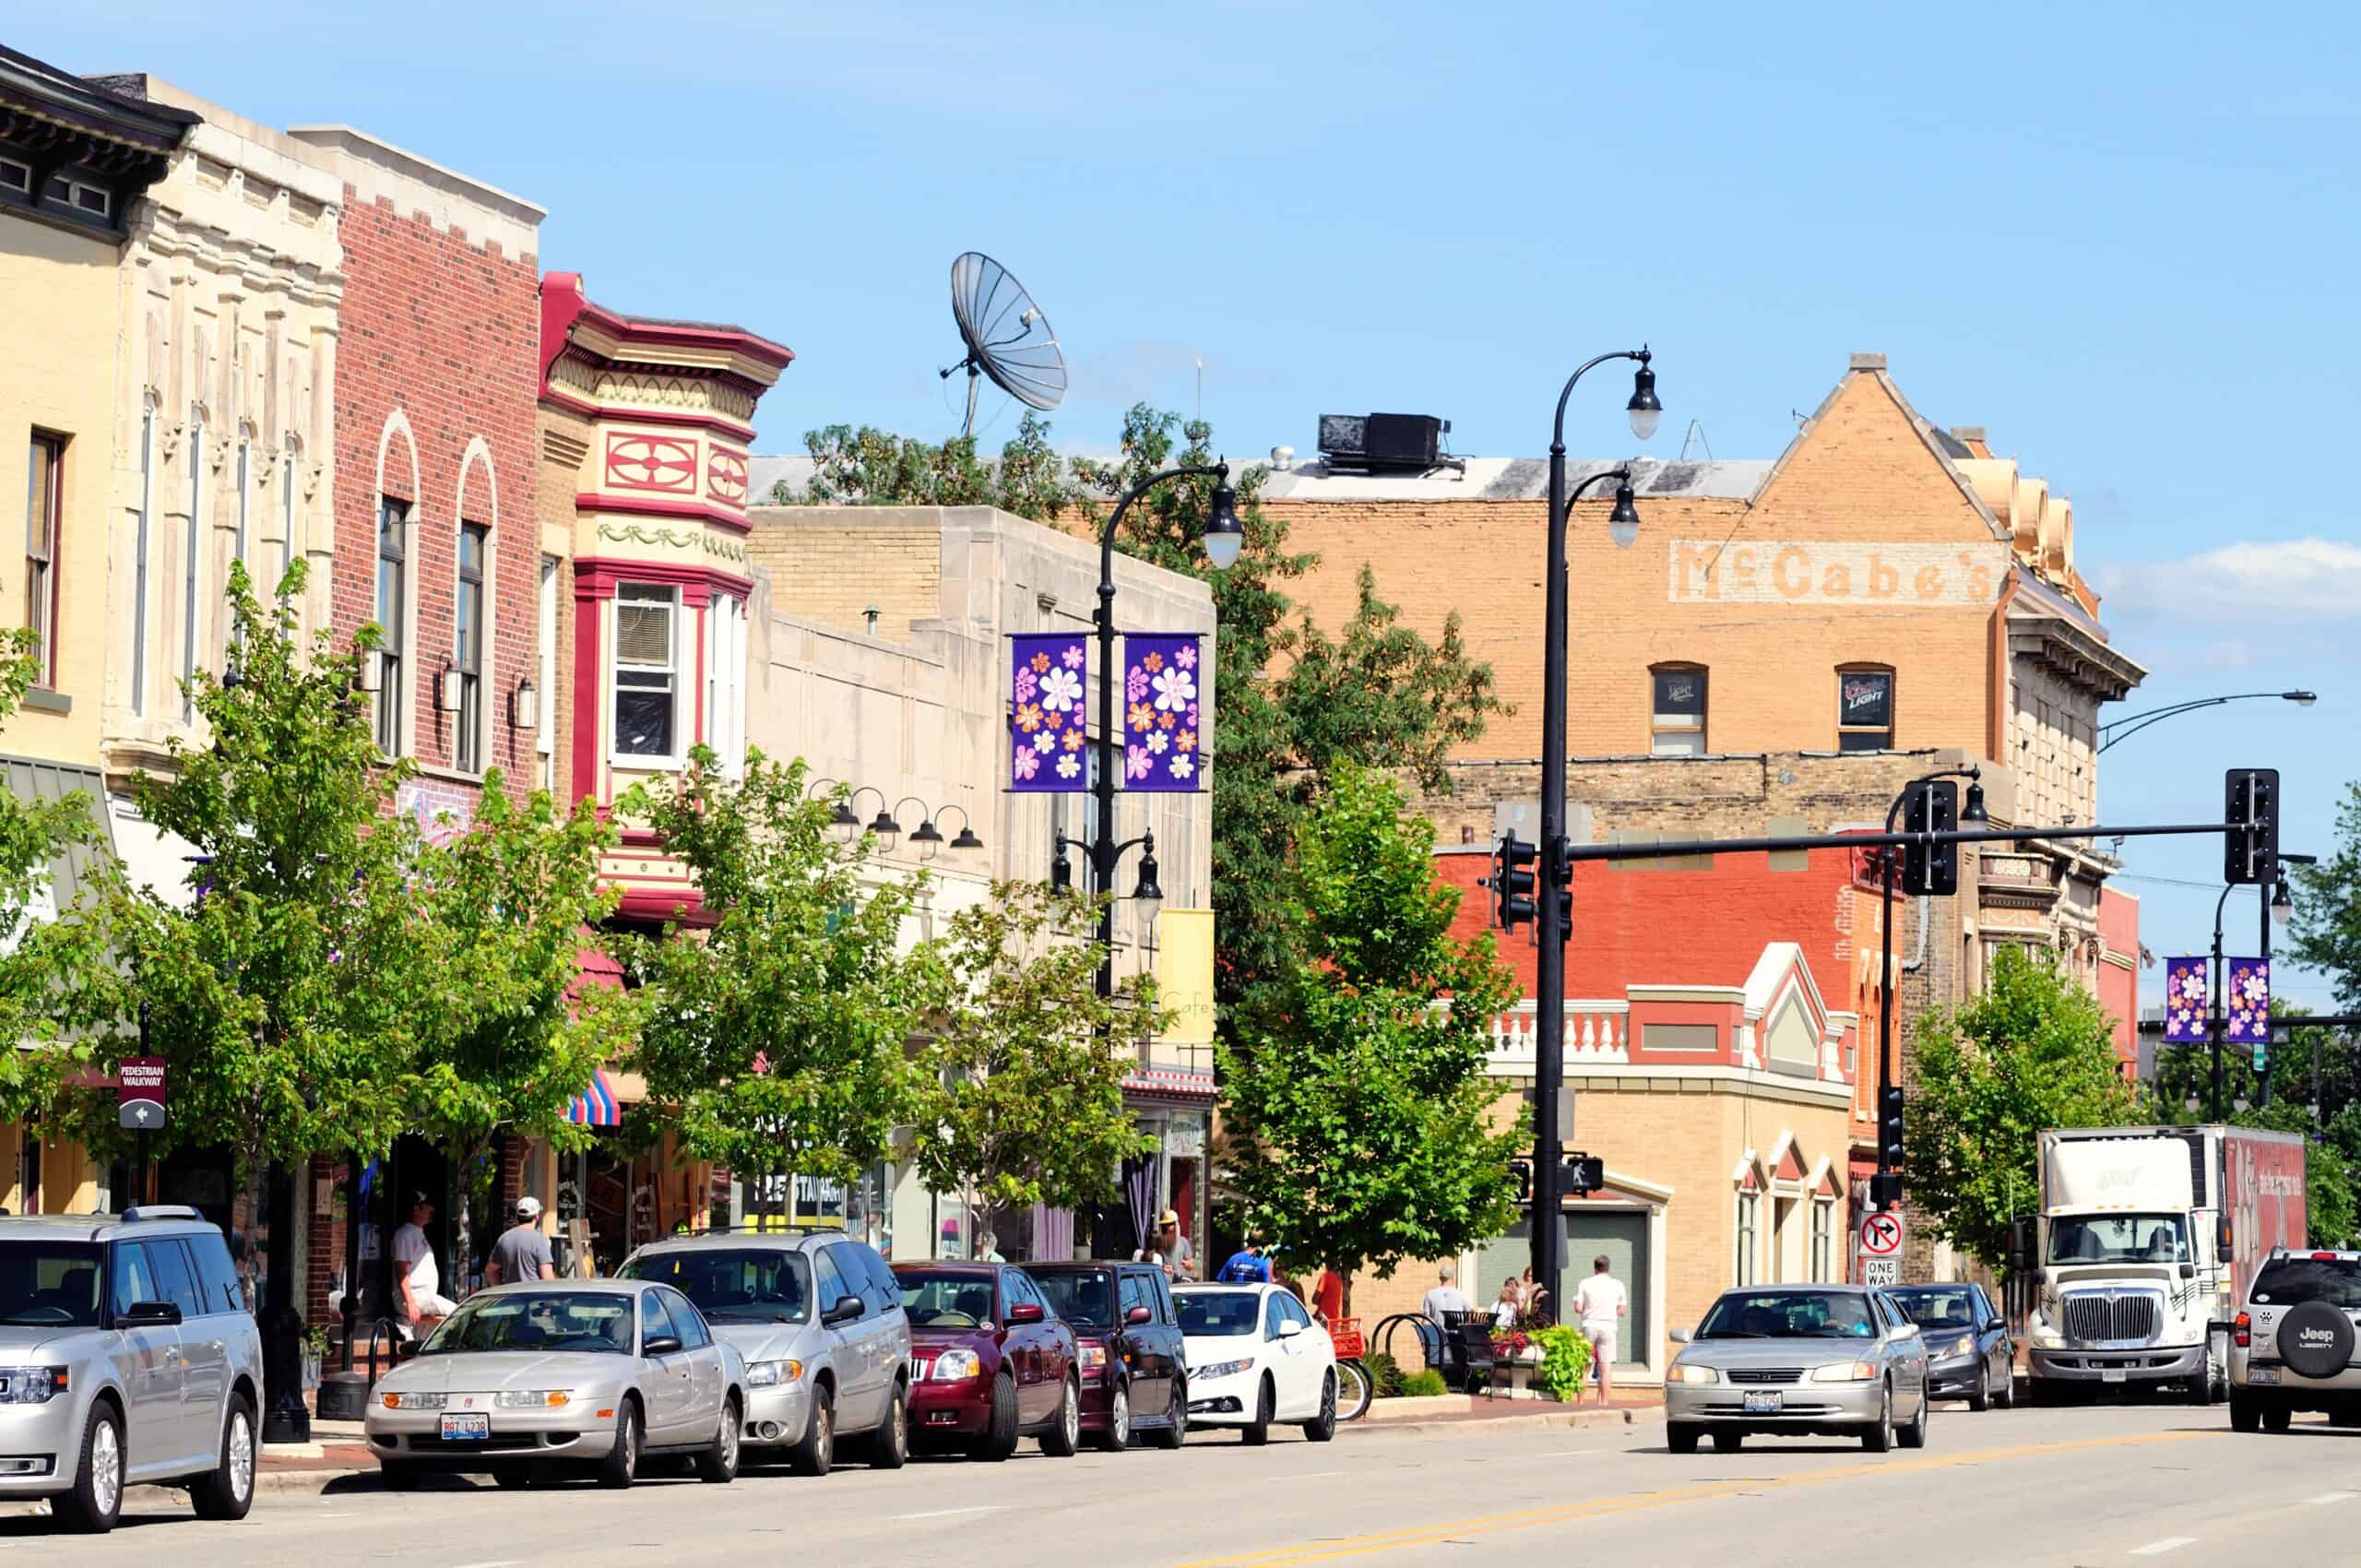
- Average popular vote split in last 4 presidential elections: 51.9% Democratic; 44.1% Republican
- Popular vote split in 2020 election: 51.5% Democrat (Joe Biden); 45.8% Republican (Donald Trump)
- Popular vote split in 2016 election: 46.9% Democrat (Hillary Clinton); 43.8% Republican (Donald Trump)
- Popular vote split in 2012 election: 51.6% Democrat (Barack Obama); 46.1% Republican (Mitt Romney)
- Popular vote split in 2008 election: 57.5% Democrat (Barack Obama); 40.8% Republican (John McCain)
- County population: 100,686
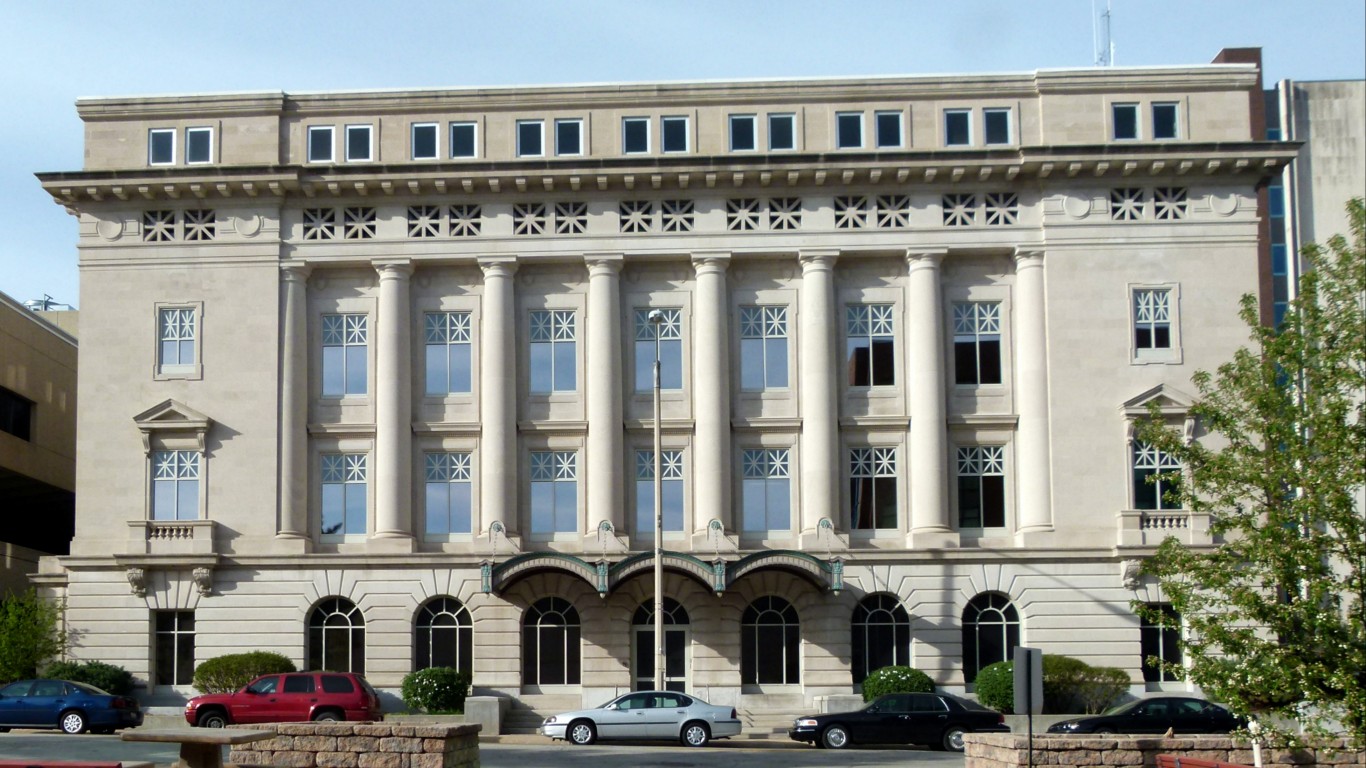
11. Peoria County
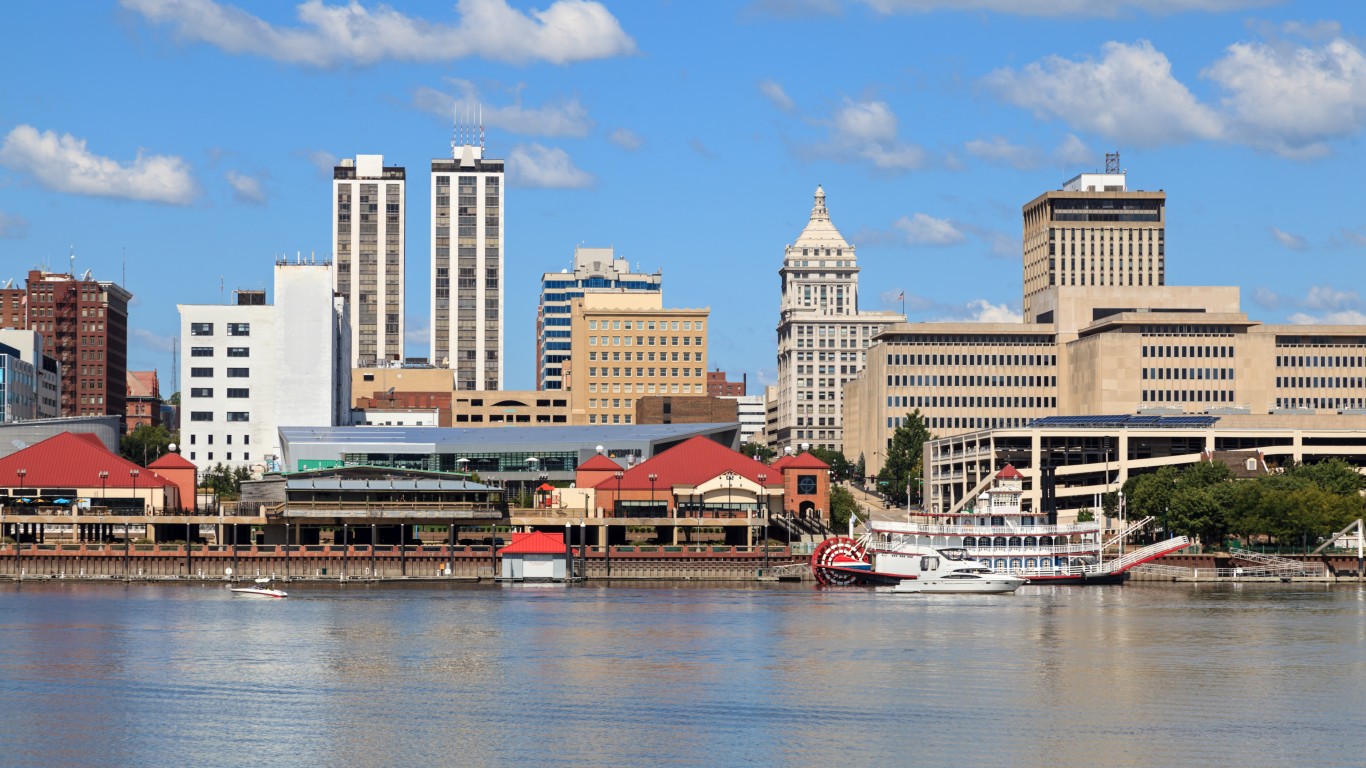
- Average popular vote split in last 4 presidential elections: 52.0% Democratic; 45.0% Republican
- Popular vote split in 2020 election: 51.9% Democrat (Joe Biden); 45.6% Republican (Donald Trump)
- Popular vote split in 2016 election: 48.5% Democrat (Hillary Clinton); 45.4% Republican (Donald Trump)
- Popular vote split in 2012 election: 51.3% Democrat (Barack Obama); 46.9% Republican (Mitt Romney)
- Popular vote split in 2008 election: 56.2% Democrat (Barack Obama); 42.3% Republican (John McCain)
- County population: 181,186
10. Knox County
- Average popular vote split in last 4 presidential elections: 52.3% Democratic; 44.9% Republican
- Popular vote split in 2020 election: 46.2% Democrat (Joe Biden); 51.9% Republican (Donald Trump)
- Popular vote split in 2016 election: 45.3% Democrat (Hillary Clinton); 48.3% Republican (Donald Trump)
- Popular vote split in 2012 election: 57.8% Democrat (Barack Obama); 40.4% Republican (Mitt Romney)
- Popular vote split in 2008 election: 59.2% Democrat (Barack Obama); 39.3% Republican (John McCain)
- County population: 49,751
9. Will County
- Average popular vote split in last 4 presidential elections: 52.9% Democratic; 44.6% Republican
- Popular vote split in 2020 election: 53.3% Democrat (Joe Biden); 44.9% Republican (Donald Trump)
- Popular vote split in 2016 election: 50.5% Democrat (Hillary Clinton); 44.1% Republican (Donald Trump)
- Popular vote split in 2012 election: 52.0% Democrat (Barack Obama); 46.5% Republican (Mitt Romney)
- Popular vote split in 2008 election: 56.0% Democrat (Barack Obama); 42.8% Republican (John McCain)
- County population: 696,774
8. Jackson County
- Average popular vote split in last 4 presidential elections: 53.1% Democratic; 42.6% Republican
- Popular vote split in 2020 election: 49.4% Democrat (Joe Biden); 48.1% Republican (Donald Trump)
- Popular vote split in 2016 election: 47.3% Democrat (Hillary Clinton); 44.0% Republican (Donald Trump)
- Popular vote split in 2012 election: 55.5% Democrat (Barack Obama); 41.1% Republican (Mitt Romney)
- Popular vote split in 2008 election: 59.7% Democrat (Barack Obama); 37.9% Republican (John McCain)
- County population: 53,176
7. Kane County

- Average popular vote split in last 4 presidential elections: 53.5% Democratic; 43.6% Republican
- Popular vote split in 2020 election: 56.1% Democrat (Joe Biden); 41.7% Republican (Donald Trump)
- Popular vote split in 2016 election: 52.0% Democrat (Hillary Clinton); 41.5% Republican (Donald Trump)
- Popular vote split in 2012 election: 49.7% Democrat (Barack Obama); 48.6% Republican (Mitt Romney)
- Popular vote split in 2008 election: 55.2% Democrat (Barack Obama); 43.4% Republican (John McCain)
- County population: 517,254
6. Dupage County

- Average popular vote split in last 4 presidential elections: 54.1% Democratic; 42.6% Republican
- Popular vote split in 2020 election: 58.0% Democrat (Joe Biden); 39.9% Republican (Donald Trump)
- Popular vote split in 2016 election: 53.3% Democrat (Hillary Clinton); 38.8% Republican (Donald Trump)
- Popular vote split in 2012 election: 49.7% Democrat (Barack Obama); 48.6% Republican (Mitt Romney)
- Popular vote split in 2008 election: 54.7% Democrat (Barack Obama); 43.9% Republican (John McCain)
- County population: 930,559
5. St. Clair County
- Average popular vote split in last 4 presidential elections: 55.2% Democratic; 42.3% Republican
- Popular vote split in 2020 election: 53.3% Democrat (Joe Biden); 44.6% Republican (Donald Trump)
- Popular vote split in 2016 election: 50.4% Democrat (Hillary Clinton); 44.7% Republican (Donald Trump)
- Popular vote split in 2012 election: 56.3% Democrat (Barack Obama); 42.0% Republican (Mitt Romney)
- Popular vote split in 2008 election: 60.6% Democrat (Barack Obama); 38.1% Republican (John McCain)
- County population: 256,791
4. Champaign County

- Average popular vote split in last 4 presidential elections: 56.3% Democratic; 39.5% Republican
- Popular vote split in 2020 election: 60.0% Democrat (Joe Biden); 37.1% Republican (Donald Trump)
- Popular vote split in 2016 election: 54.7% Democrat (Hillary Clinton); 36.4% Republican (Donald Trump)
- Popular vote split in 2012 election: 52.1% Democrat (Barack Obama); 45.1% Republican (Mitt Romney)
- Popular vote split in 2008 election: 57.8% Democrat (Barack Obama); 40.3% Republican (John McCain)
- County population: 206,525
3. Rock Island County

- Average popular vote split in last 4 presidential elections: 56.9% Democratic; 40.1% Republican
- Popular vote split in 2020 election: 55.0% Democrat (Joe Biden); 42.8% Republican (Donald Trump)
- Popular vote split in 2016 election: 50.5% Democrat (Hillary Clinton); 42.2% Republican (Donald Trump)
- Popular vote split in 2012 election: 60.2% Democrat (Barack Obama); 38.4% Republican (Mitt Romney)
- Popular vote split in 2008 election: 61.7% Democrat (Barack Obama); 37.1% Republican (John McCain)
- County population: 143,819
2. Lake County

- Average popular vote split in last 4 presidential elections: 57.7% Democratic; 39.3% Republican
- Popular vote split in 2020 election: 61.1% Democrat (Joe Biden); 37.0% Republican (Donald Trump)
- Popular vote split in 2016 election: 56.4% Democrat (Hillary Clinton); 36.2% Republican (Donald Trump)
- Popular vote split in 2012 election: 53.5% Democrat (Barack Obama); 45.1% Republican (Mitt Romney)
- Popular vote split in 2008 election: 59.3% Democrat (Barack Obama); 39.6% Republican (John McCain)
- County population: 713,159
1. Cook County

- Average popular vote split in last 4 presidential elections: 74.8% Democratic; 23.1% Republican
- Popular vote split in 2020 election: 74.3% Democrat (Joe Biden); 24.0% Republican (Donald Trump)
- Popular vote split in 2016 election: 74.7% Democrat (Hillary Clinton); 21.0% Republican (Donald Trump)
- Popular vote split in 2012 election: 74.0% Democrat (Barack Obama); 24.6% Republican (Mitt Romney)
- Popular vote split in 2008 election: 76.2% Democrat (Barack Obama); 22.8% Republican (John McCain)
- County population: 5,225,367
Take Charge of Your Retirement In Just A Few Minutes (Sponsor)
Retirement planning doesn’t have to feel overwhelming. The key is finding expert guidance—and SmartAsset’s simple quiz makes it easier than ever for you to connect with a vetted financial advisor.
Here’s how it works:
- Answer a Few Simple Questions. Tell us a bit about your goals and preferences—it only takes a few minutes!
- Get Matched with Vetted Advisors Our smart tool matches you with up to three pre-screened, vetted advisors who serve your area and are held to a fiduciary standard to act in your best interests. Click here to begin
- Choose Your Fit Review their profiles, schedule an introductory call (or meet in person), and select the advisor who feel is right for you.
Why wait? Start building the retirement you’ve always dreamed of. Click here to get started today!
Thank you for reading! Have some feedback for us?
Contact the 24/7 Wall St. editorial team.

Our expert who first called NVIDIA in 2009 is predicting 2025 will see a historic AI breakthrough.
You can follow him investing $500,000 of his own money on our top AI stocks for free.