24/7 Wall St. Insights
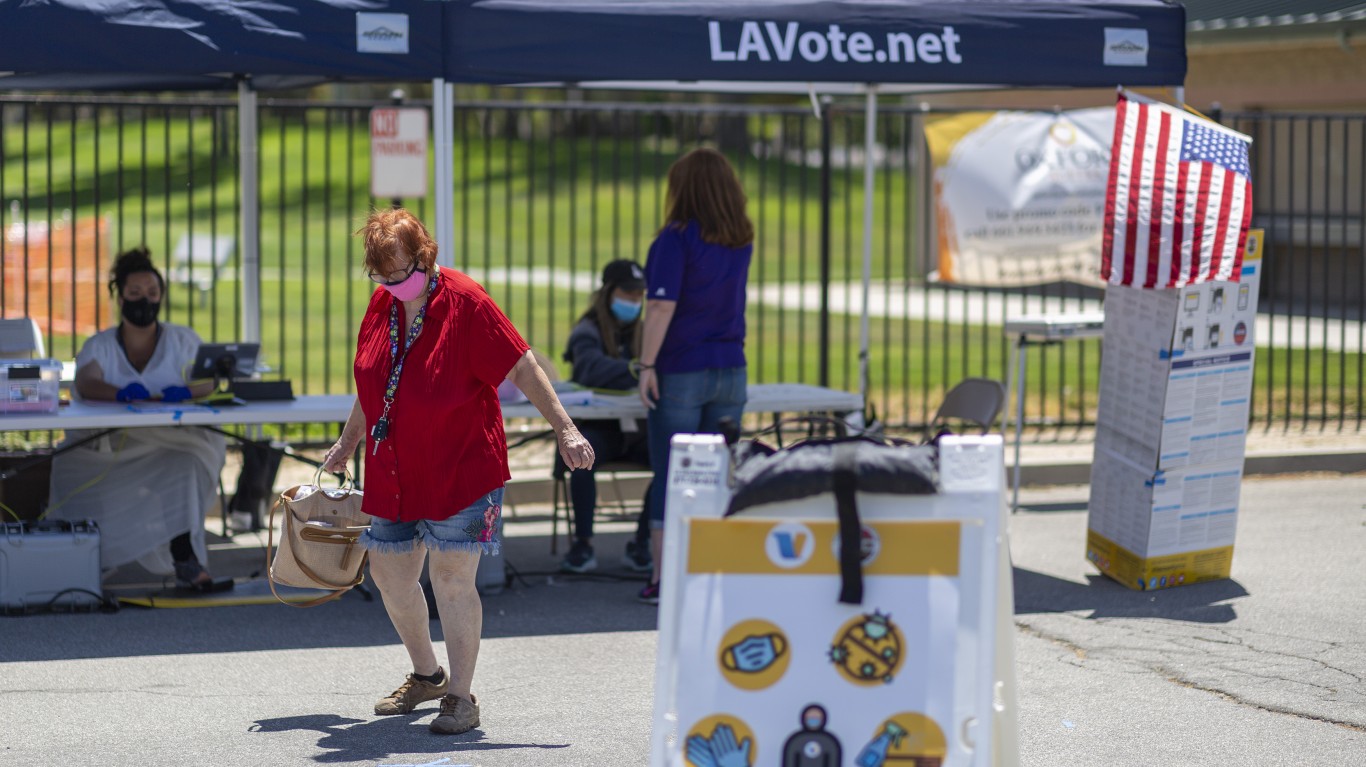
- This election cycle, Harris and Trump campaigns are focusing their resources on a handful of key swing-states, where the election will likely be decided.
- In most of the rest of the country, including California, the outcome of the race is effectively predetermined.
- However, California’s status as a blue state is an oversimplification that belies a much more nuanced reality.
- Also: 2 Dividend Legends to Hold Forever
Election Day is looming, and in the wake of the first, and perhaps only, presidential debate in the 2024 race, Democrat Kamala Harris is leading Republican Donald Trump in the polls by the widest margin since the start of her campaign. According to a recent national survey conducted by Morning Consult, 51% of Americans now say they would vote for Harris if the election were today, compared to 45% who would support Trump.
However, Harris’ advantage in national polls is only a reflection of current voter sentiment, and public opinion is likely to shift in the coming weeks. Additionally, presidential races are not decided by popular vote, and this election cycle, the outcome will likely hinge on voters in a handful of closely contested swing states. In these states, which include Arizona, Georgia, North Carolina, Pennsylvania, and Wisconsin, both Trump and Harris are polling so closely that either one has a reasonable chance of winning in November. For either candidate to garner the 270 electoral votes necessary to win the White House, they will first need to persuade voters in these and other battleground states. (This is how Trump and Harris are polling in every key swing state.)
Unlike swing states — which are effectively a toss-up – a combination of polling results, the electorate’s political affiliation, and historical voting patterns show that most other states are already a virtual lock for either Trump or Harris. So-called blue states, like Massachusetts and Vermont, are places that Harris can reliably count on taking in November. Meanwhile, red states like Idaho and Wyoming are Republican strongholds that Trump will likely win handily.
Because the electoral outcome is effectively predetermined, these and other non-swing states are often characterized as political monoliths, home to populations of like-minded voters with similar values and priorities. This, however, is an oversimplification that belies a much more nuanced reality.
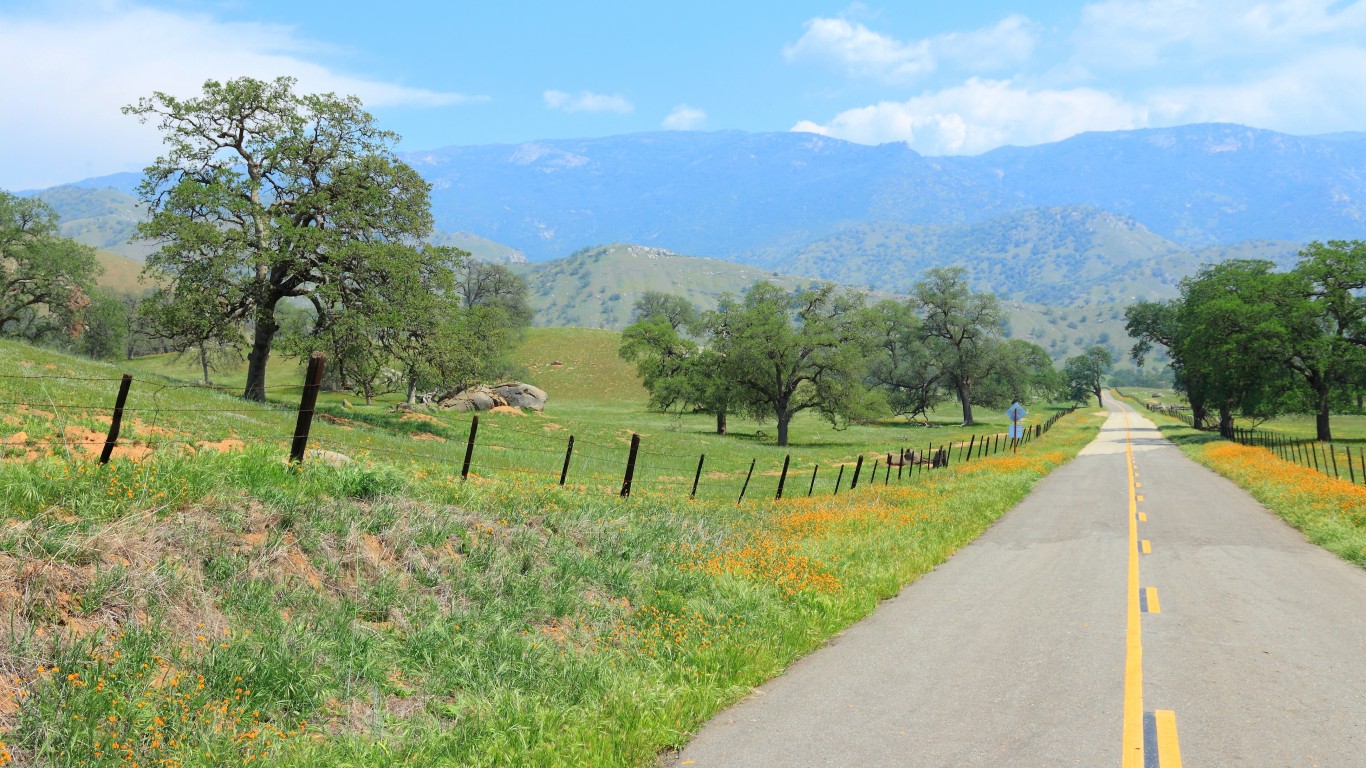
In California, long considered a deep-blue state, an average of 61.8% of voters have supported the Democratic candidate across the last four presidential elections. In fact, California has gone to the Democratic candidate in every presidential election since 1988, when George H.W. Bush, a Republican, defeated Democrat Michael Dukakis. Barring any major, unforeseen shakeup, California is expected to align with historical voting patterns once again in 2024 and go to Harris. (Here is a look at the 15 least popular presidents, according to Millennials.)
Despite its status as a Democratic stronghold, there are several parts of the state that have consistently broken with the prevailing political ideology in recent elections. According to voting records, there are 23 counties in California where an average of at least 50% of voters have supported the Republican candidate across the last four presidential elections. In one of these counties, an average of 70.3% of voters cast ballots for the Republican candidate over the same four general elections. All historical, county-level, voting statistics are from the MIT Election Data and Science Lab’s County Presidential Election Returns 2000-2020 database, as compiled in the Harvard Dataverse, V13.
These are the most Republican counties in California.
Why It Matters
Because of the electoral college system, the outcome of presidential elections often comes down to voters in just a handful of closely contested states. In contrast to these battleground states, most of the country has reliably voted either Democratic or Republican in recent presidential elections. These states include California, which, barring any unforeseen shake ups in the race, is all but guaranteed to go to Harris in 2024. Still, California is not the partisan monolith it is often perceived to be.
23. Inyo County

- Average popular vote split in last 4 presidential elections: 43.8% Democratic; 51.9% Republican
- Popular vote split in 2020 election: 48.9% Democrat (Joe Biden); 48.7% Republican (Donald Trump)
- Popular vote split in 2016 election: 39.0% Democrat (Hillary Clinton); 52.5% Republican (Donald Trump)
- Popular vote split in 2012 election: 42.6% Democrat (Barack Obama); 54.0% Republican (Mitt Romney)
- Popular vote split in 2008 election: 43.9% Democrat (Barack Obama); 53.0% Republican (John McCain)
- County population: 18,829
22. Del Norte County

- Average popular vote split in last 4 presidential elections: 41.4% Democratic; 53.9% Republican
- Popular vote split in 2020 election: 40.8% Democrat (Joe Biden); 56.4% Republican (Donald Trump)
- Popular vote split in 2016 election: 36.5% Democrat (Hillary Clinton); 53.7% Republican (Donald Trump)
- Popular vote split in 2012 election: 43.2% Democrat (Barack Obama); 52.6% Republican (Mitt Romney)
- Popular vote split in 2008 election: 45.4% Democrat (Barack Obama); 52.1% Republican (John McCain)
- County population: 27,462
21. Placer County

- Average popular vote split in last 4 presidential elections: 42.3% Democratic; 54.1% Republican
- Popular vote split in 2020 election: 45.5% Democrat (Joe Biden); 52.1% Republican (Donald Trump)
- Popular vote split in 2016 election: 40.2% Democrat (Hillary Clinton); 52.0% Republican (Donald Trump)
- Popular vote split in 2012 election: 39.0% Democrat (Barack Obama); 58.3% Republican (Mitt Romney)
- Popular vote split in 2008 election: 43.4% Democrat (Barack Obama); 54.7% Republican (John McCain)
- County population: 406,608
20. El Dorado County

- Average popular vote split in last 4 presidential elections: 41.8% Democratic; 54.3% Republican
- Popular vote split in 2020 election: 44.4% Democrat (Joe Biden); 53.2% Republican (Donald Trump)
- Popular vote split in 2016 election: 38.9% Democrat (Hillary Clinton); 52.6% Republican (Donald Trump)
- Popular vote split in 2012 election: 39.6% Democrat (Barack Obama); 57.4% Republican (Mitt Romney)
- Popular vote split in 2008 election: 43.6% Democrat (Barack Obama); 54.1% Republican (John McCain)
- County population: 191,713
19. Tulare County
- Average popular vote split in last 4 presidential elections: 42.8% Democratic; 54.3% Republican
- Popular vote split in 2020 election: 45.0% Democrat (Joe Biden); 52.8% Republican (Donald Trump)
- Popular vote split in 2016 election: 42.4% Democrat (Hillary Clinton); 51.9% Republican (Donald Trump)
- Popular vote split in 2012 election: 41.3% Democrat (Barack Obama); 56.3% Republican (Mitt Romney)
- Popular vote split in 2008 election: 41.5% Democrat (Barack Obama); 56.8% Republican (John McCain)
- County population: 473,446
18. Kings County

- Average popular vote split in last 4 presidential elections: 41.6% Democratic; 55.1% Republican
- Popular vote split in 2020 election: 42.6% Democrat (Joe Biden); 54.9% Republican (Donald Trump)
- Popular vote split in 2016 election: 40.2% Democrat (Hillary Clinton); 53.3% Republican (Donald Trump)
- Popular vote split in 2012 election: 41.3% Democrat (Barack Obama); 56.2% Republican (Mitt Romney)
- Popular vote split in 2008 election: 42.0% Democrat (Barack Obama); 56.1% Republican (John McCain)
- County population: 152,515
17. Siskiyou County
- Average popular vote split in last 4 presidential elections: 40.0% Democratic; 55.3% Republican
- Popular vote split in 2020 election: 40.9% Democrat (Joe Biden); 56.6% Republican (Donald Trump)
- Popular vote split in 2016 election: 35.3% Democrat (Hillary Clinton); 55.3% Republican (Donald Trump)
- Popular vote split in 2012 election: 40.4% Democrat (Barack Obama); 55.6% Republican (Mitt Romney)
- Popular vote split in 2008 election: 43.3% Democrat (Barack Obama); 53.7% Republican (John McCain)
- County population: 44,049
16. Kern County
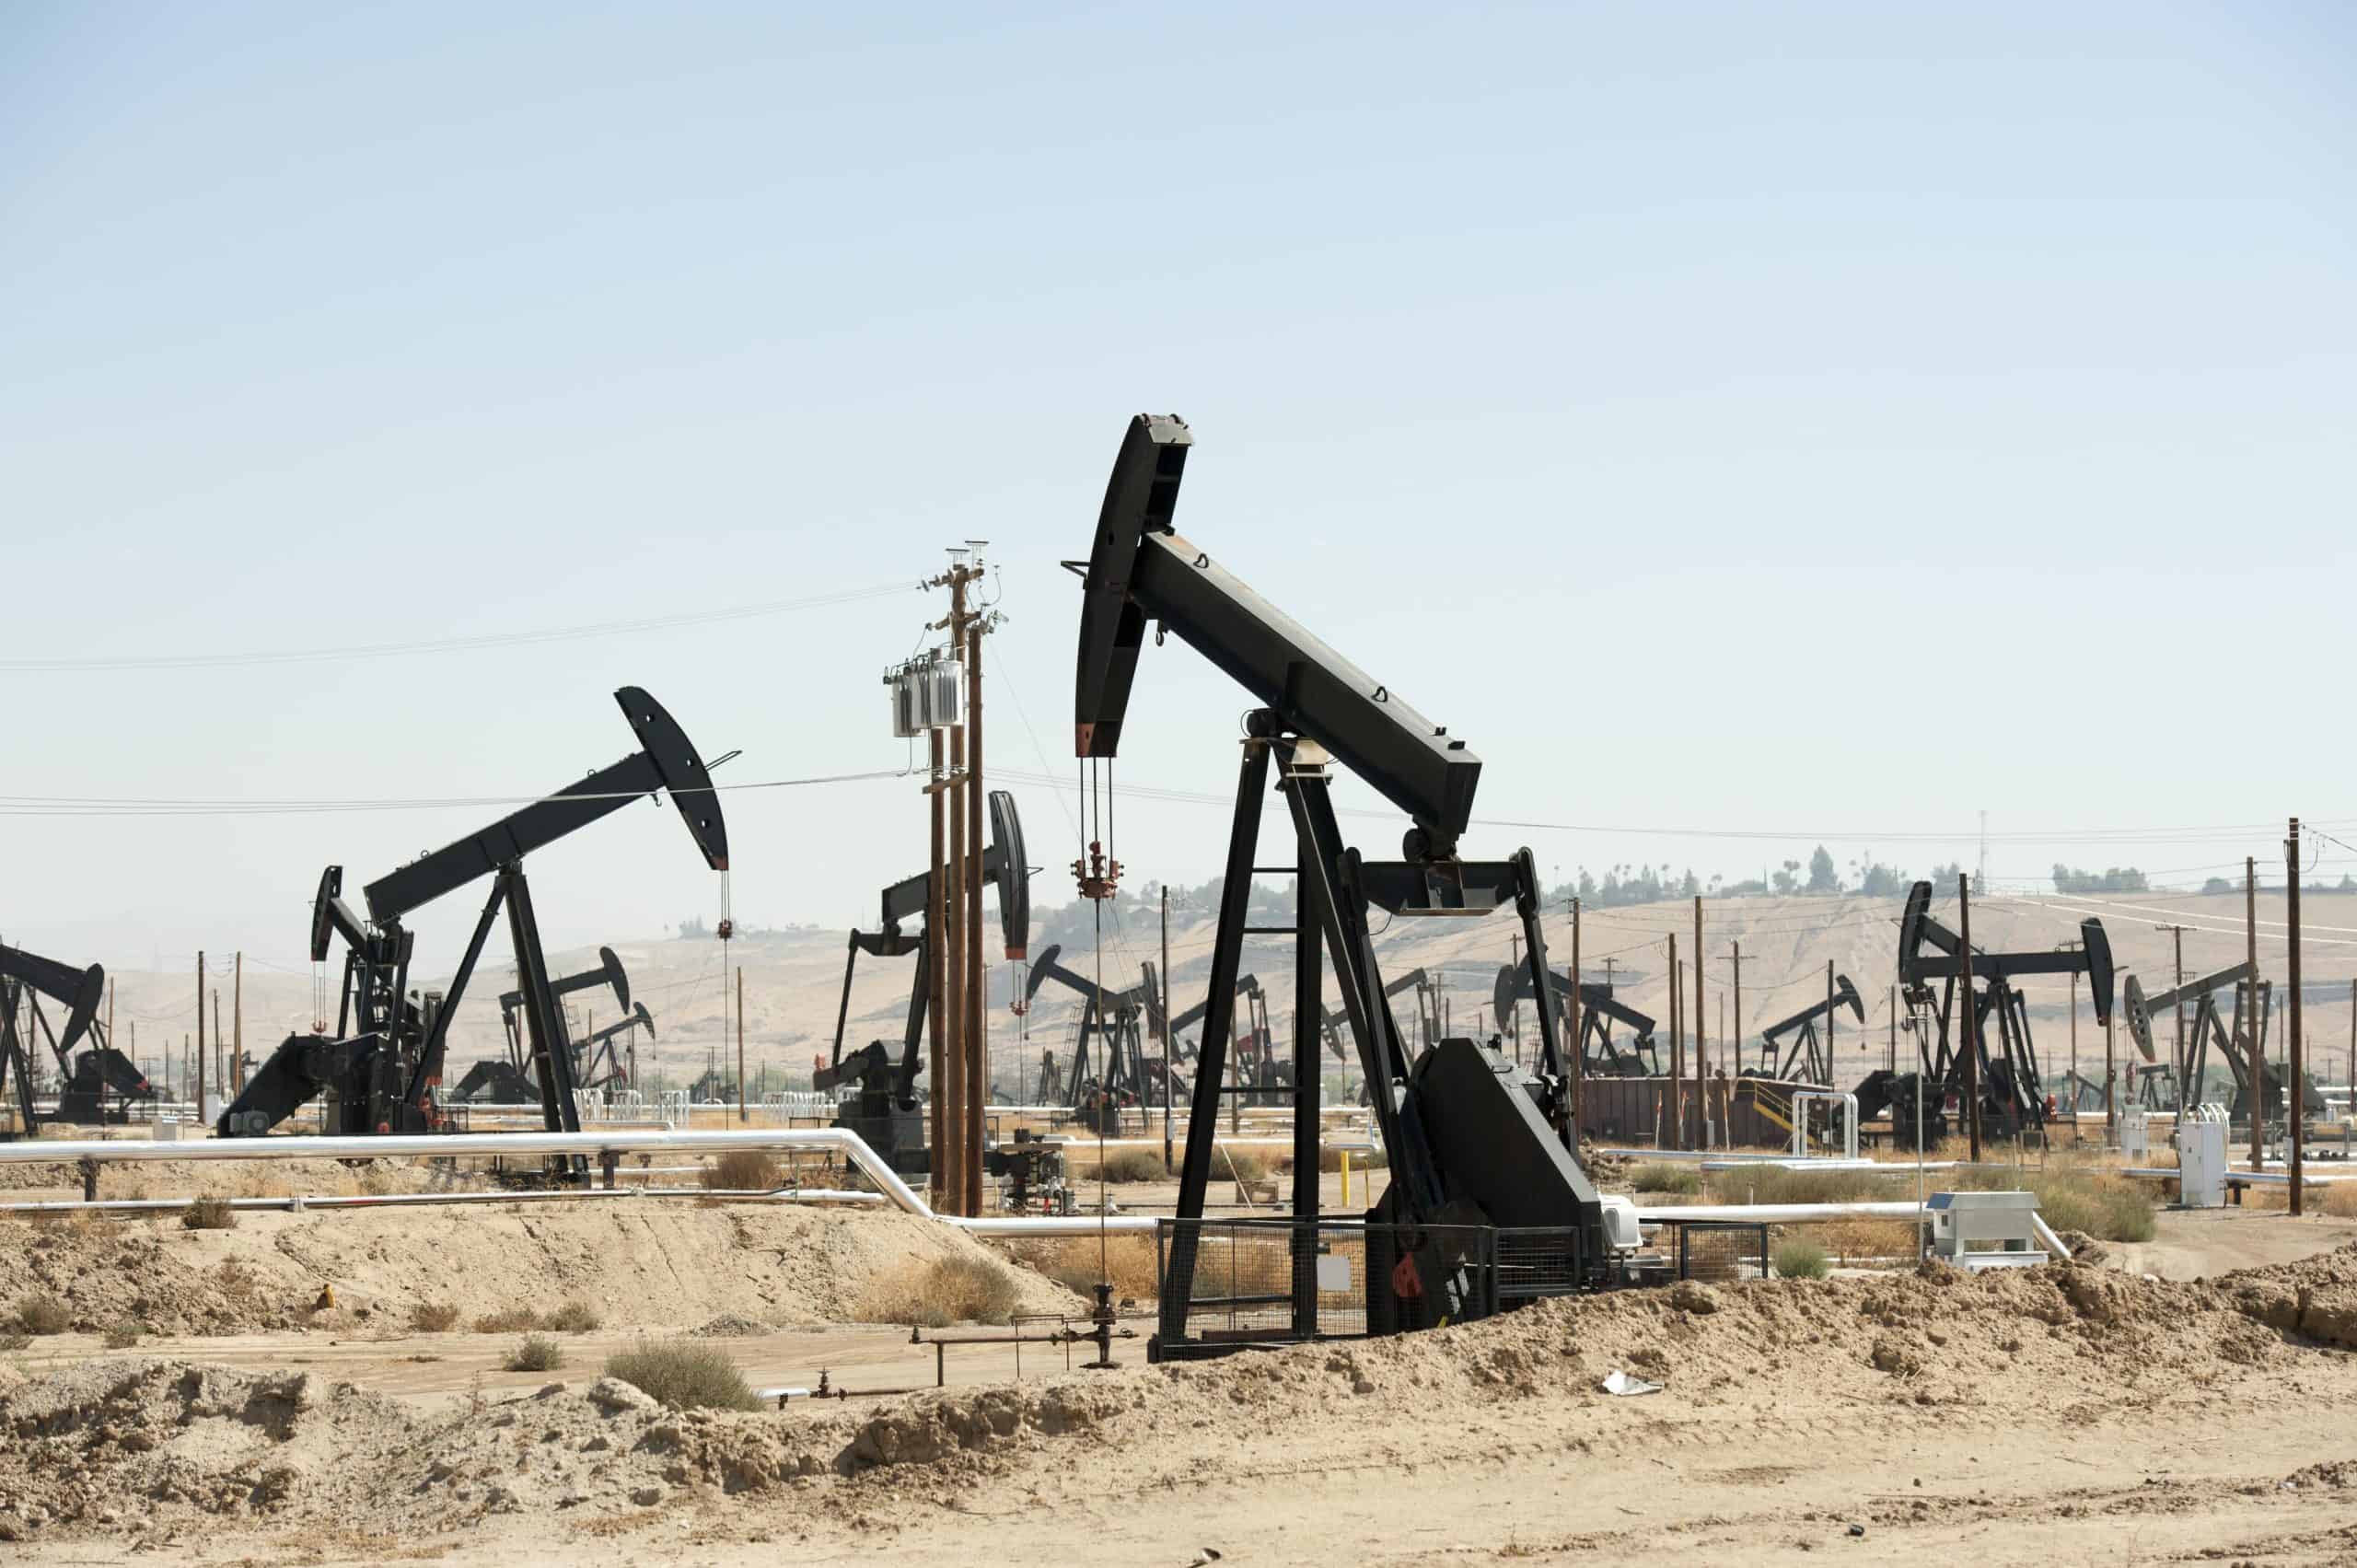
- Average popular vote split in last 4 presidential elections: 41.3% Democratic; 55.3% Republican
- Popular vote split in 2020 election: 43.7% Democrat (Joe Biden); 53.9% Republican (Donald Trump)
- Popular vote split in 2016 election: 40.4% Democrat (Hillary Clinton); 53.1% Republican (Donald Trump)
- Popular vote split in 2012 election: 40.4% Democrat (Barack Obama); 57.2% Republican (Mitt Romney)
- Popular vote split in 2008 election: 40.1% Democrat (Barack Obama); 57.9% Republican (John McCain)
- County population: 906,883
15. Madera County
- Average popular vote split in last 4 presidential elections: 41.4% Democratic; 55.4% Republican
- Popular vote split in 2020 election: 43.1% Democrat (Joe Biden); 54.7% Republican (Donald Trump)
- Popular vote split in 2016 election: 39.5% Democrat (Hillary Clinton); 54.2% Republican (Donald Trump)
- Popular vote split in 2012 election: 40.2% Democrat (Barack Obama); 57.3% Republican (Mitt Romney)
- Popular vote split in 2008 election: 42.4% Democrat (Barack Obama); 55.7% Republican (John McCain)
- County population: 157,243
14. Plumas County
- Average popular vote split in last 4 presidential elections: 39.9% Democratic; 56.2% Republican
- Popular vote split in 2020 election: 40.5% Democrat (Joe Biden); 57.2% Republican (Donald Trump)
- Popular vote split in 2016 election: 35.7% Democrat (Hillary Clinton); 56.0% Republican (Donald Trump)
- Popular vote split in 2012 election: 40.1% Democrat (Barack Obama); 56.9% Republican (Mitt Romney)
- Popular vote split in 2008 election: 42.8% Democrat (Barack Obama); 54.7% Republican (John McCain)
- County population: 19,650
13. Tuolumne County
- Average popular vote split in last 4 presidential elections: 39.5% Democratic; 56.7% Republican
- Popular vote split in 2020 election: 39.4% Democrat (Joe Biden); 58.2% Republican (Donald Trump)
- Popular vote split in 2016 election: 35.7% Democrat (Hillary Clinton); 57.0% Republican (Donald Trump)
- Popular vote split in 2012 election: 40.5% Democrat (Barack Obama); 56.2% Republican (Mitt Romney)
- Popular vote split in 2008 election: 42.4% Democrat (Barack Obama); 55.1% Republican (John McCain)
- County population: 54,993
12. Sutter County

- Average popular vote split in last 4 presidential elections: 40.0% Democratic; 56.8% Republican
- Popular vote split in 2020 election: 40.7% Democrat (Joe Biden); 57.2% Republican (Donald Trump)
- Popular vote split in 2016 election: 39.0% Democrat (Hillary Clinton); 54.2% Republican (Donald Trump)
- Popular vote split in 2012 election: 39.3% Democrat (Barack Obama); 58.4% Republican (Mitt Romney)
- Popular vote split in 2008 election: 40.7% Democrat (Barack Obama); 57.4% Republican (John McCain)
- County population: 99,101
11. Mariposa County

- Average popular vote split in last 4 presidential elections: 39.2% Democratic; 57.1% Republican
- Popular vote split in 2020 election: 39.8% Democrat (Joe Biden); 57.9% Republican (Donald Trump)
- Popular vote split in 2016 election: 35.2% Democrat (Hillary Clinton); 58.4% Republican (Donald Trump)
- Popular vote split in 2012 election: 38.9% Democrat (Barack Obama); 57.1% Republican (Mitt Romney)
- Popular vote split in 2008 election: 42.5% Democrat (Barack Obama); 54.9% Republican (John McCain)
- County population: 17,130
10. Colusa County

- Average popular vote split in last 4 presidential elections: 39.9% Democratic; 57.1% Republican
- Popular vote split in 2020 election: 40.7% Democrat (Joe Biden); 57.3% Republican (Donald Trump)
- Popular vote split in 2016 election: 40.1% Democrat (Hillary Clinton); 53.5% Republican (Donald Trump)
- Popular vote split in 2012 election: 38.3% Democrat (Barack Obama); 59.7% Republican (Mitt Romney)
- Popular vote split in 2008 election: 40.0% Democrat (Barack Obama); 58.1% Republican (John McCain)
- County population: 21,811
9. Yuba County
- Average popular vote split in last 4 presidential elections: 38.0% Democratic; 57.6% Republican
- Popular vote split in 2020 election: 37.7% Democrat (Joe Biden); 59.3% Republican (Donald Trump)
- Popular vote split in 2016 election: 34.4% Democrat (Hillary Clinton); 57.3% Republican (Donald Trump)
- Popular vote split in 2012 election: 39.1% Democrat (Barack Obama); 57.2% Republican (Mitt Romney)
- Popular vote split in 2008 election: 41.4% Democrat (Barack Obama); 56.1% Republican (John McCain)
- County population: 81,705
8. Calaveras County

- Average popular vote split in last 4 presidential elections: 38.2% Democratic; 57.9% Republican
- Popular vote split in 2020 election: 37.0% Democrat (Joe Biden); 60.8% Republican (Donald Trump)
- Popular vote split in 2016 election: 34.3% Democrat (Hillary Clinton); 58.4% Republican (Donald Trump)
- Popular vote split in 2012 election: 39.8% Democrat (Barack Obama); 56.8% Republican (Mitt Romney)
- Popular vote split in 2008 election: 42.1% Democrat (Barack Obama); 55.1% Republican (John McCain)
- County population: 45,674
7. Sierra County
- Average popular vote split in last 4 presidential elections: 36.1% Democratic; 58.4% Republican
- Popular vote split in 2020 election: 37.8% Democrat (Joe Biden); 59.1% Republican (Donald Trump)
- Popular vote split in 2016 election: 32.8% Democrat (Hillary Clinton); 57.3% Republican (Donald Trump)
- Popular vote split in 2012 election: 36.4% Democrat (Barack Obama); 58.8% Republican (Mitt Romney)
- Popular vote split in 2008 election: 37.3% Democrat (Barack Obama); 58.2% Republican (John McCain)
- County population: 2,916
6. Amador County

- Average popular vote split in last 4 presidential elections: 37.6% Democratic; 58.7% Republican
- Popular vote split in 2020 election: 36.6% Democrat (Joe Biden); 60.9% Republican (Donald Trump)
- Popular vote split in 2016 election: 33.9% Democrat (Hillary Clinton); 59.1% Republican (Donald Trump)
- Popular vote split in 2012 election: 38.7% Democrat (Barack Obama); 58.3% Republican (Mitt Romney)
- Popular vote split in 2008 election: 41.5% Democrat (Barack Obama); 56.1% Republican (John McCain)
- County population: 40,577
5. Glenn County
- Average popular vote split in last 4 presidential elections: 35.4% Democratic; 61.2% Republican
- Popular vote split in 2020 election: 35.4% Democrat (Joe Biden); 62.5% Republican (Donald Trump)
- Popular vote split in 2016 election: 32.4% Democrat (Hillary Clinton); 61.1% Republican (Donald Trump)
- Popular vote split in 2012 election: 35.8% Democrat (Barack Obama); 61.1% Republican (Mitt Romney)
- Popular vote split in 2008 election: 37.8% Democrat (Barack Obama); 59.8% Republican (John McCain)
- County population: 28,657
4. Tehama County

- Average popular vote split in last 4 presidential elections: 32.6% Democratic; 63.7% Republican
- Popular vote split in 2020 election: 31.0% Democrat (Joe Biden); 66.6% Republican (Donald Trump)
- Popular vote split in 2016 election: 28.5% Democrat (Hillary Clinton); 64.8% Republican (Donald Trump)
- Popular vote split in 2012 election: 34.5% Democrat (Barack Obama); 62.0% Republican (Mitt Romney)
- Popular vote split in 2008 election: 36.6% Democrat (Barack Obama); 60.7% Republican (John McCain)
- County population: 65,484
3. Shasta County

- Average popular vote split in last 4 presidential elections: 32.4% Democratic; 63.8% Republican
- Popular vote split in 2020 election: 32.3% Democrat (Joe Biden); 65.4% Republican (Donald Trump)
- Popular vote split in 2016 election: 27.9% Democrat (Hillary Clinton); 64.7% Republican (Donald Trump)
- Popular vote split in 2012 election: 33.8% Democrat (Barack Obama); 63.0% Republican (Mitt Romney)
- Popular vote split in 2008 election: 35.9% Democrat (Barack Obama); 61.7% Republican (John McCain)
- County population: 181,852
2. Modoc County
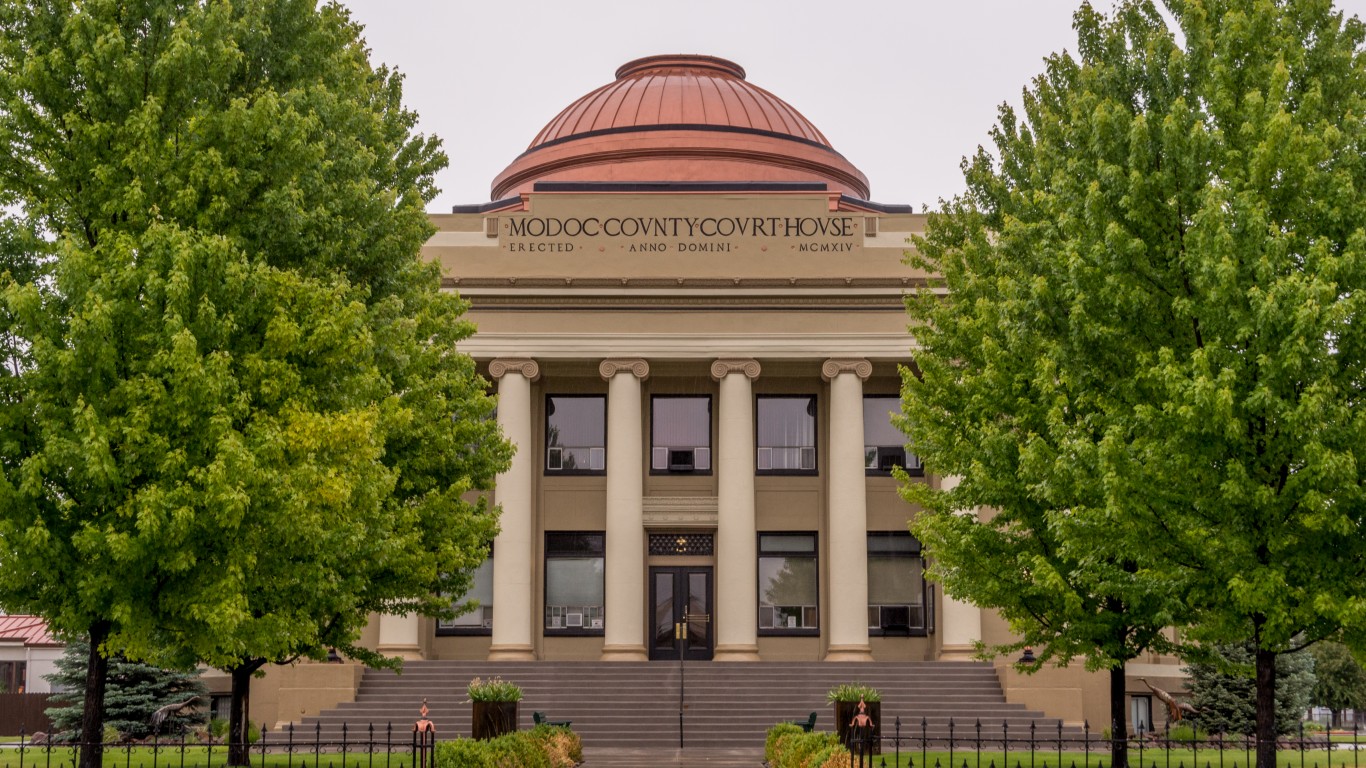
- Average popular vote split in last 4 presidential elections: 26.9% Democratic; 69.9% Republican
- Popular vote split in 2020 election: 26.5% Democrat (Joe Biden); 71.6% Republican (Donald Trump)
- Popular vote split in 2016 election: 23.2% Democrat (Hillary Clinton); 71.2% Republican (Donald Trump)
- Popular vote split in 2012 election: 27.9% Democrat (Barack Obama); 69.7% Republican (Mitt Romney)
- Popular vote split in 2008 election: 29.7% Democrat (Barack Obama); 67.4% Republican (John McCain)
- County population: 8,651
1. Lassen County

- Average popular vote split in last 4 presidential elections: 26.2% Democratic; 70.3% Republican
- Popular vote split in 2020 election: 23.4% Democrat (Joe Biden); 74.8% Republican (Donald Trump)
- Popular vote split in 2016 election: 21.1% Democrat (Hillary Clinton); 72.0% Republican (Donald Trump)
- Popular vote split in 2012 election: 28.6% Democrat (Barack Obama); 68.3% Republican (Mitt Romney)
- Popular vote split in 2008 election: 31.5% Democrat (Barack Obama); 65.7% Republican (John McCain)
- County population: 31,873
Get Ready To Retire (Sponsored)
Start by taking a quick retirement quiz from SmartAsset that will match you with up to 3 financial advisors that serve your area and beyond in 5 minutes, or less.
Each advisor has been vetted by SmartAsset and is held to a fiduciary standard to act in your best interests.
Here’s how it works:
1. Answer SmartAsset advisor match quiz
2. Review your pre-screened matches at your leisure. Check out the advisors’ profiles.
3. Speak with advisors at no cost to you. Have an introductory call on the phone or introduction in person and choose whom to work with in the future
Thank you for reading! Have some feedback for us?
Contact the 24/7 Wall St. editorial team.

Our expert who first called NVIDIA in 2009 is predicting 2025 will see a historic AI breakthrough.
You can follow him investing $500,000 of his own money on our top AI stocks for free.