24/7 Wall St. Insights
- This election cycle, Harris and Trump campaigns are focusing their resources on a handful of key swing-states, where the election will likely be decided.
- In most of the rest of the country, including Mississippi, the outcome of the race is effectively predetermined.
- However, Mississippi’s status as a red state is an oversimplification that belies a much more nuanced reality.
- Also: 2 Dividend Legends to Hold Forever
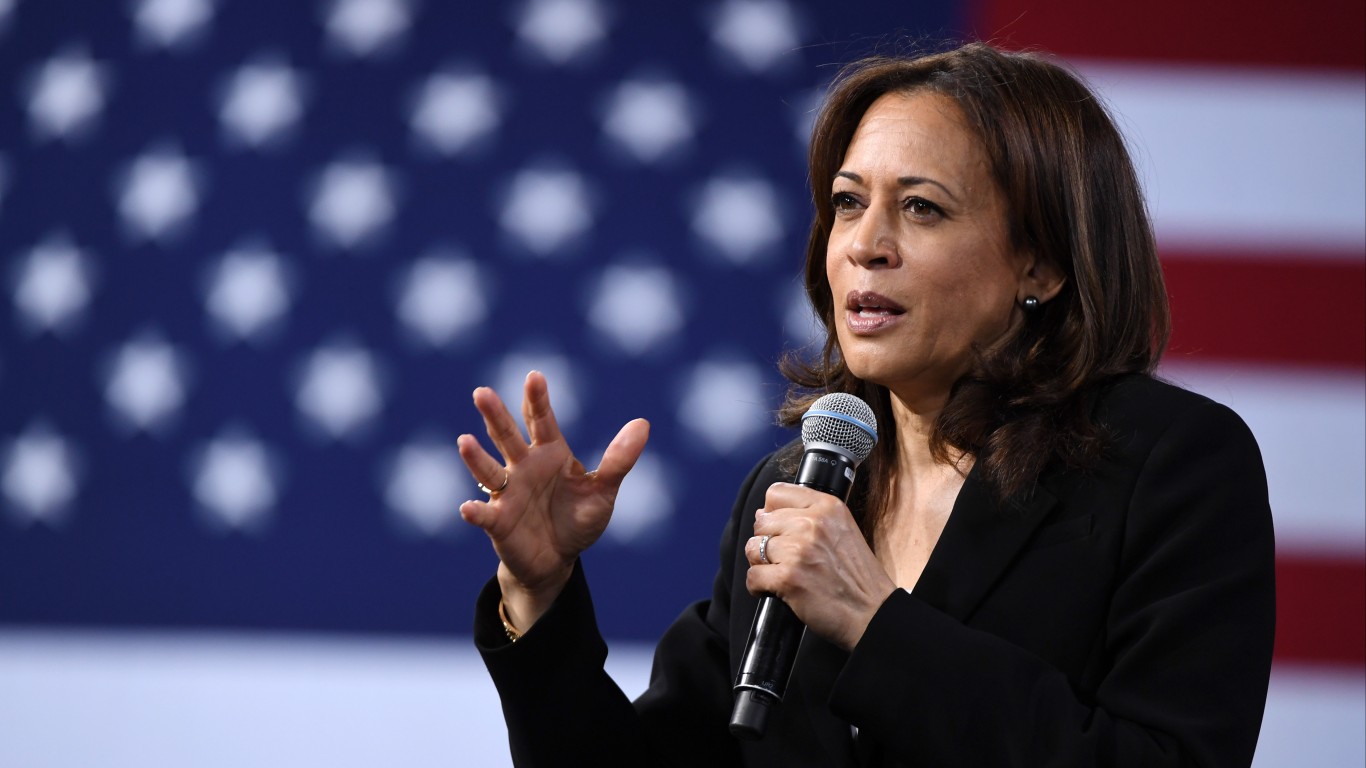
Election Day is looming, and in the wake of the first, and perhaps only, presidential debate in the 2024 race, Democrat Kamala Harris is leading Republican Donald Trump in the polls by the widest margin since the start of her campaign. According to a recent national survey conducted by Morning Consult, 51% of Americans now say they would vote for Harris if the election were today, compared to 45% who would support Trump.
However, Harris’ advantage in national polls is only a reflection of current voter sentiment, and public opinion is likely to shift in the coming weeks. Additionally, presidential races are not decided by popular vote, and this election cycle, the outcome will likely hinge on voters in a handful of closely contested swing states. In these states, which include Arizona, Georgia, North Carolina, Pennsylvania, and Wisconsin, both Trump and Harris are polling so closely that either one has a reasonable chance of winning in November. For either candidate to garner the 270 electoral votes necessary to win the White House, they will first need to persuade voters in these and other battleground states. (This is how Trump and Harris are polling in every key swing state.)
Unlike swing states — which are effectively a toss-up – a combination of polling results, the electorate’s political affiliation, and historical voting patterns show that most other states are already a virtual lock for either Trump or Harris. So-called blue states, like Massachusetts and Vermont, are places that Harris can reliably count on taking in November. Meanwhile, red states like Idaho and Wyoming are Republican strongholds that Trump will likely win handily.
Because the electoral outcome is effectively predetermined, these and other non-swing states are often characterized as political monoliths, home to populations of like-minded voters with similar values and priorities. This, however, is an oversimplification that belies a much more nuanced reality.
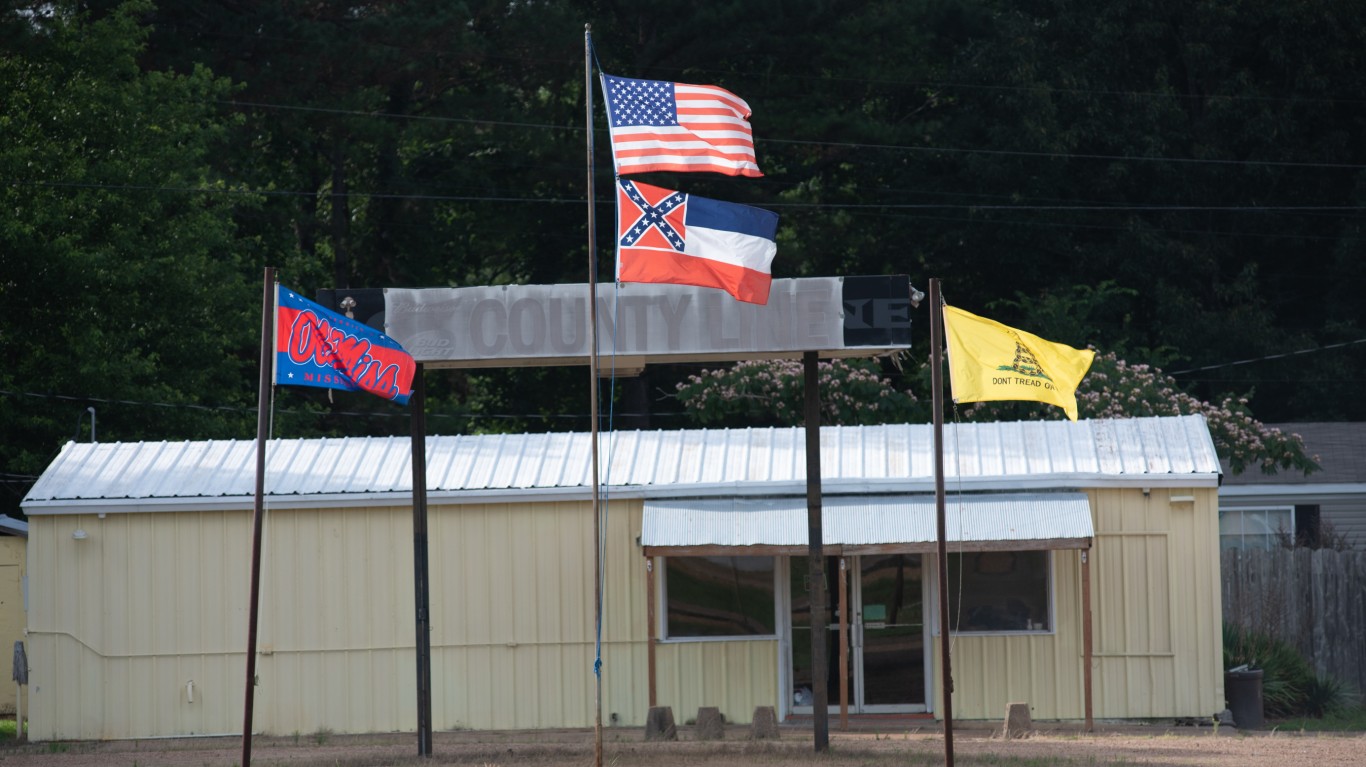
In Mississippi, long considered a red state, an average of 56.7% of voters have supported the Republican candidate across the last four presidential elections. In fact, Mississippi has gone to the Republican candidate in every presidential election since 1976, when Jimmy Carter, a Democrat, defeated Republican Gerald Ford. Barring any major, unforeseen shakeup, Mississippi is expected to align with historical voting patterns once again in 2024 and go to Trump. (Here is a look at the 15 least popular presidents, according to Millennials.)
Despite its status as a Republican stronghold, there are several parts of the state that have consistently broken with the prevailing political ideology in recent elections. According to voting records, there are 28 counties in Mississippi where an average of at least 50% of voters have supported the Democratic candidate across the last four presidential elections. In one of these counties, an average of 87.0% of voters cast ballots for the Democratic candidate over the same four general elections. All historical, county-level, voting statistics are from the MIT Election Data and Science Lab’s County Presidential Election Returns 2000-2020 database, as compiled in the Harvard Dataverse, V13.
These are the most Democratic counties in Mississippi.
Why It Matters
Because of the electoral college system, the outcome of presidential elections often comes down to voters in just a handful of closely contested states. In contrast to these battleground states, most of the country has reliably voted either Democratic or Republican in recent presidential elections. These states include Mississippi, which, barring any unforeseen shake ups in the race, is all but guaranteed to go to Trump in 2024. Still, Mississippi is not the partisan monolith it is often perceived to be.
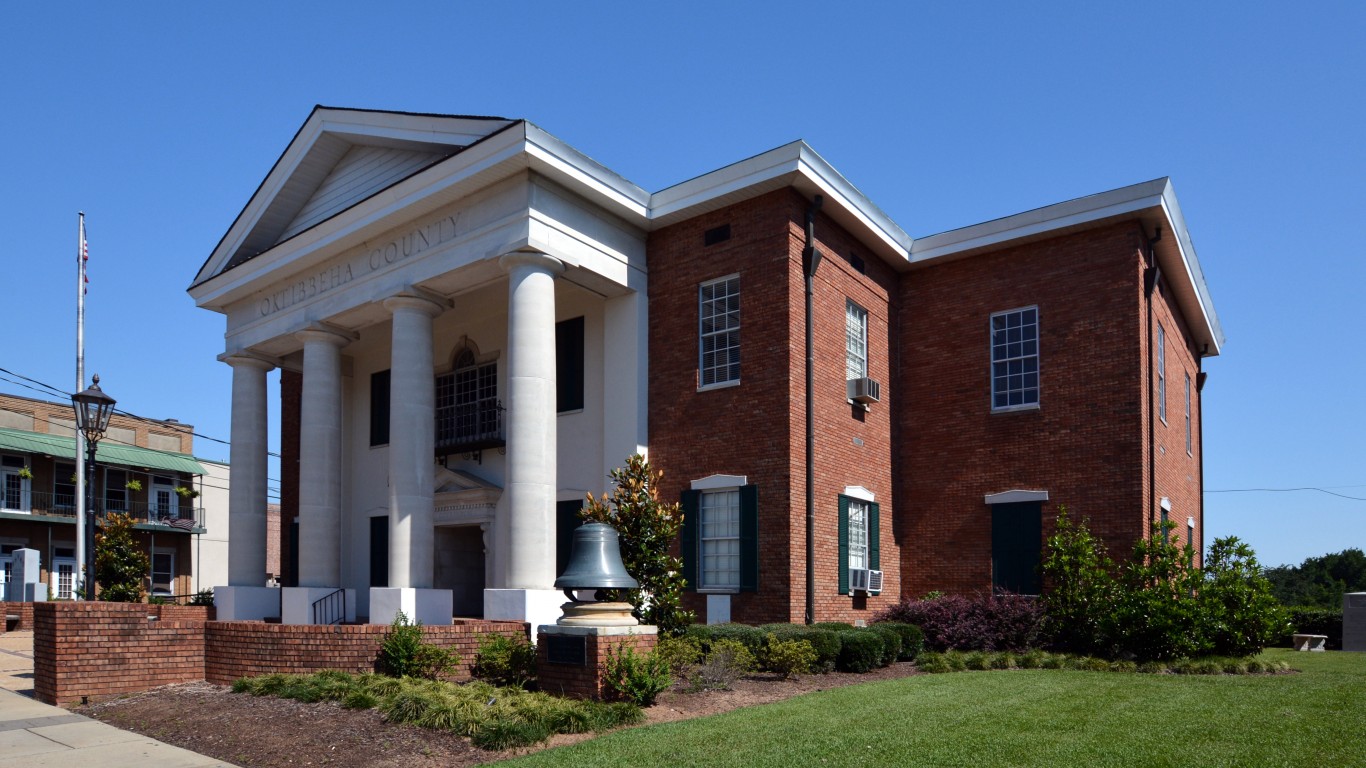
28. Oktibbeha County
- Average popular vote split in last 4 presidential elections: 50.2% Democratic; 47.7% Republican
- Popular vote split in 2020 election: 52.1% Democrat (Joe Biden); 45.6% Republican (Donald Trump)
- Popular vote split in 2016 election: 48.9% Democrat (Hillary Clinton); 47.3% Republican (Donald Trump)
- Popular vote split in 2012 election: 50.2% Democrat (Barack Obama); 48.4% Republican (Mitt Romney)
- Popular vote split in 2008 election: 49.6% Democrat (Barack Obama); 49.6% Republican (John McCain)
- County population: 51,388
27. Panola County
- Average popular vote split in last 4 presidential elections: 51.0% Democratic; 48.1% Republican
- Popular vote split in 2020 election: 47.4% Democrat (Joe Biden); 51.6% Republican (Donald Trump)
- Popular vote split in 2016 election: 49.3% Democrat (Hillary Clinton); 49.4% Republican (Donald Trump)
- Popular vote split in 2012 election: 54.0% Democrat (Barack Obama); 45.3% Republican (Mitt Romney)
- Popular vote split in 2008 election: 52.9% Democrat (Barack Obama); 46.4% Republican (John McCain)
- County population: 33,157
26. Pike County
- Average popular vote split in last 4 presidential elections: 51.2% Democratic; 47.9% Republican
- Popular vote split in 2020 election: 49.9% Democrat (Joe Biden); 48.9% Republican (Donald Trump)
- Popular vote split in 2016 election: 49.3% Democrat (Hillary Clinton); 49.1% Republican (Donald Trump)
- Popular vote split in 2012 election: 53.7% Democrat (Barack Obama); 45.5% Republican (Mitt Romney)
- Popular vote split in 2008 election: 51.6% Democrat (Barack Obama); 48.1% Republican (John McCain)
- County population: 40,098
25. Copiah County
- Average popular vote split in last 4 presidential elections: 52.7% Democratic; 46.5% Republican
- Popular vote split in 2020 election: 50.2% Democrat (Joe Biden); 48.5% Republican (Donald Trump)
- Popular vote split in 2016 election: 51.9% Democrat (Hillary Clinton); 47.0% Republican (Donald Trump)
- Popular vote split in 2012 election: 54.9% Democrat (Barack Obama); 44.5% Republican (Mitt Romney)
- Popular vote split in 2008 election: 53.3% Democrat (Barack Obama); 46.3% Republican (John McCain)
- County population: 28,210
24. Jasper County

- Average popular vote split in last 4 presidential elections: 52.7% Democratic; 46.6% Republican
- Popular vote split in 2020 election: 49.7% Democrat (Joe Biden); 49.2% Republican (Donald Trump)
- Popular vote split in 2016 election: 51.5% Democrat (Hillary Clinton); 47.6% Republican (Donald Trump)
- Popular vote split in 2012 election: 54.6% Democrat (Barack Obama); 44.9% Republican (Mitt Romney)
- Popular vote split in 2008 election: 54.7% Democrat (Barack Obama); 45.0% Republican (John McCain)
- County population: 16,320
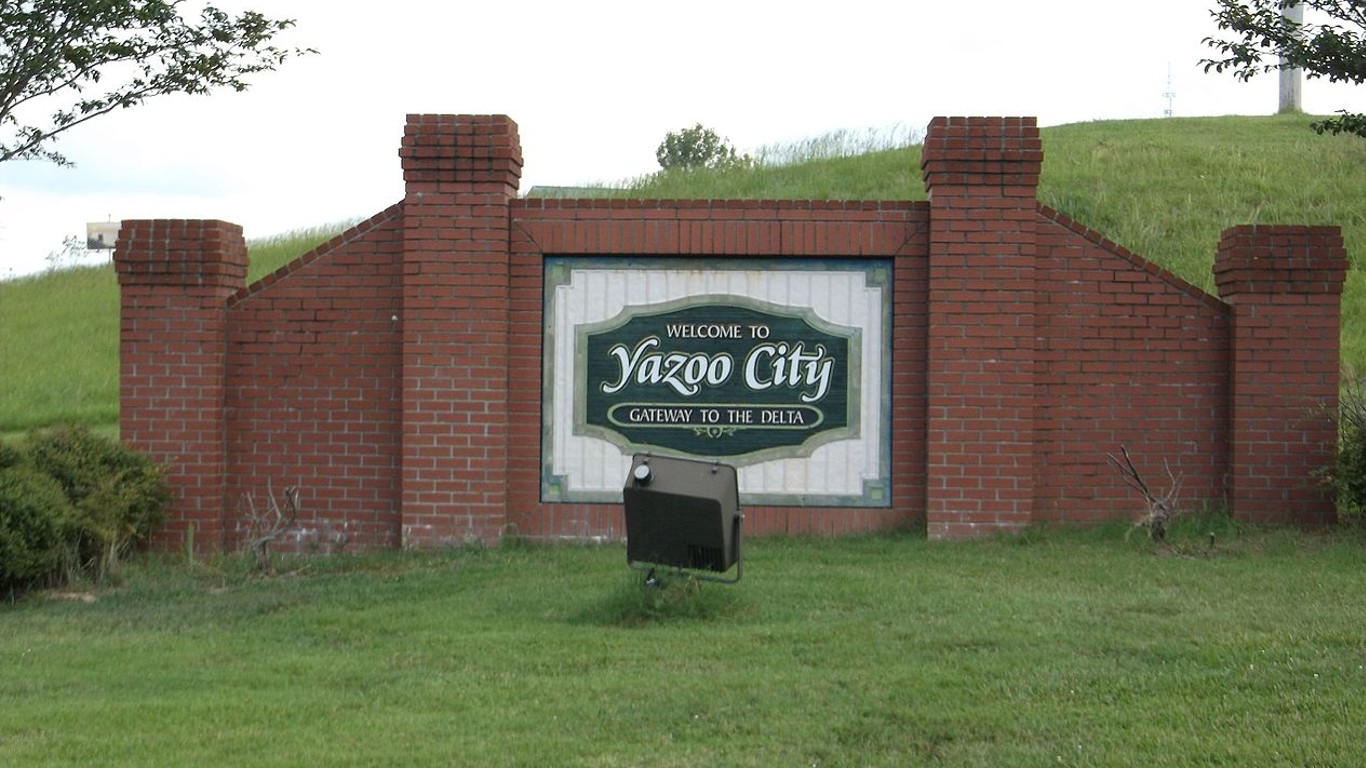
23. Yazoo County
- Average popular vote split in last 4 presidential elections: 54.1% Democratic; 45.1% Republican
- Popular vote split in 2020 election: 52.7% Democrat (Joe Biden); 46.3% Republican (Donald Trump)
- Popular vote split in 2016 election: 53.3% Democrat (Hillary Clinton); 45.7% Republican (Donald Trump)
- Popular vote split in 2012 election: 56.8% Democrat (Barack Obama); 42.5% Republican (Mitt Romney)
- Popular vote split in 2008 election: 53.4% Democrat (Barack Obama); 46.2% Republican (John McCain)
- County population: 27,467
22. Marshall County
- Average popular vote split in last 4 presidential elections: 55.9% Democratic; 43.1% Republican
- Popular vote split in 2020 election: 50.9% Democrat (Joe Biden); 47.8% Republican (Donald Trump)
- Popular vote split in 2016 election: 54.1% Democrat (Hillary Clinton); 44.4% Republican (Donald Trump)
- Popular vote split in 2012 election: 59.4% Democrat (Barack Obama); 39.9% Republican (Mitt Romney)
- Popular vote split in 2008 election: 58.9% Democrat (Barack Obama); 40.6% Republican (John McCain)
- County population: 33,980
21. Adams County
- Average popular vote split in last 4 presidential elections: 57.5% Democratic; 41.6% Republican
- Popular vote split in 2020 election: 57.5% Democrat (Joe Biden); 41.4% Republican (Donald Trump)
- Popular vote split in 2016 election: 56.1% Democrat (Hillary Clinton); 42.5% Republican (Donald Trump)
- Popular vote split in 2012 election: 58.7% Democrat (Barack Obama); 40.7% Republican (Mitt Romney)
- Popular vote split in 2008 election: 57.5% Democrat (Barack Obama); 41.8% Republican (John McCain)
- County population: 29,425
20. Tallahatchie County
- Average popular vote split in last 4 presidential elections: 58.1% Democratic; 41.0% Republican
- Popular vote split in 2020 election: 54.6% Democrat (Joe Biden); 43.8% Republican (Donald Trump)
- Popular vote split in 2016 election: 56.8% Democrat (Hillary Clinton); 41.9% Republican (Donald Trump)
- Popular vote split in 2012 election: 60.9% Democrat (Barack Obama); 38.4% Republican (Mitt Romney)
- Popular vote split in 2008 election: 59.3% Democrat (Barack Obama); 40.2% Republican (John McCain)
- County population: 12,621
19. Issaquena County
- Average popular vote split in last 4 presidential elections: 58.2% Democratic; 40.9% Republican
- Popular vote split in 2020 election: 52.5% Democrat (Joe Biden); 45.6% Republican (Donald Trump)
- Popular vote split in 2016 election: 56.5% Democrat (Hillary Clinton); 42.6% Republican (Donald Trump)
- Popular vote split in 2012 election: 60.9% Democrat (Barack Obama); 38.4% Republican (Mitt Romney)
- Popular vote split in 2008 election: 61.2% Democrat (Barack Obama); 38.5% Republican (John McCain)
- County population: 1,206
18. Clay County
- Average popular vote split in last 4 presidential elections: 58.7% Democratic; 40.4% Republican
- Popular vote split in 2020 election: 57.4% Democrat (Joe Biden); 41.0% Republican (Donald Trump)
- Popular vote split in 2016 election: 57.2% Democrat (Hillary Clinton); 41.5% Republican (Donald Trump)
- Popular vote split in 2012 election: 60.6% Democrat (Barack Obama); 38.8% Republican (Mitt Romney)
- Popular vote split in 2008 election: 59.3% Democrat (Barack Obama); 40.4% Republican (John McCain)
- County population: 18,598
17. Jefferson Davis County

- Average popular vote split in last 4 presidential elections: 60.2% Democratic; 38.9% Republican
- Popular vote split in 2020 election: 57.9% Democrat (Joe Biden); 40.8% Republican (Donald Trump)
- Popular vote split in 2016 election: 59.6% Democrat (Hillary Clinton); 39.5% Republican (Donald Trump)
- Popular vote split in 2012 election: 62.2% Democrat (Barack Obama); 36.5% Republican (Mitt Romney)
- Popular vote split in 2008 election: 60.6% Democrat (Barack Obama); 39.1% Republican (John McCain)
- County population: 11,291
16. Kemper County
- Average popular vote split in last 4 presidential elections: 62.2% Democratic; 37.1% Republican
- Popular vote split in 2020 election: 61.0% Democrat (Joe Biden); 37.8% Republican (Donald Trump)
- Popular vote split in 2016 election: 60.9% Democrat (Hillary Clinton); 38.3% Republican (Donald Trump)
- Popular vote split in 2012 election: 64.1% Democrat (Barack Obama); 35.4% Republican (Mitt Romney)
- Popular vote split in 2008 election: 62.5% Democrat (Barack Obama); 37.1% Republican (John McCain)
- County population: 8,980
15. Bolivar County

- Average popular vote split in last 4 presidential elections: 66.6% Democratic; 32.3% Republican
- Popular vote split in 2020 election: 64.8% Democrat (Joe Biden); 34.0% Republican (Donald Trump)
- Popular vote split in 2016 election: 65.4% Democrat (Hillary Clinton); 33.2% Republican (Donald Trump)
- Popular vote split in 2012 election: 68.6% Democrat (Barack Obama); 30.5% Republican (Mitt Romney)
- Popular vote split in 2008 election: 67.4% Democrat (Barack Obama); 31.9% Republican (John McCain)
- County population: 30,688
14. Sharkey County
- Average popular vote split in last 4 presidential elections: 68.4% Democratic; 30.8% Republican
- Popular vote split in 2020 election: 67.1% Democrat (Joe Biden); 31.5% Republican (Donald Trump)
- Popular vote split in 2016 election: 67.5% Democrat (Hillary Clinton); 31.6% Republican (Donald Trump)
- Popular vote split in 2012 election: 70.4% Democrat (Barack Obama); 29.1% Republican (Mitt Romney)
- Popular vote split in 2008 election: 68.4% Democrat (Barack Obama); 31.3% Republican (John McCain)
- County population: 3,910
13. Wilkinson County

- Average popular vote split in last 4 presidential elections: 68.5% Democratic; 30.7% Republican
- Popular vote split in 2020 election: 66.6% Democrat (Joe Biden); 32.1% Republican (Donald Trump)
- Popular vote split in 2016 election: 67.7% Democrat (Hillary Clinton); 31.2% Republican (Donald Trump)
- Popular vote split in 2012 election: 70.3% Democrat (Barack Obama); 29.2% Republican (Mitt Romney)
- Popular vote split in 2008 election: 69.0% Democrat (Barack Obama); 30.5% Republican (John McCain)
- County population: 8,531
12. Quitman County
")
- Average popular vote split in last 4 presidential elections: 68.6% Democratic; 30.4% Republican
- Popular vote split in 2020 election: 66.6% Democrat (Joe Biden); 31.8% Republican (Donald Trump)
- Popular vote split in 2016 election: 68.7% Democrat (Hillary Clinton); 29.7% Republican (Donald Trump)
- Popular vote split in 2012 election: 71.3% Democrat (Barack Obama); 28.0% Republican (Mitt Romney)
- Popular vote split in 2008 election: 67.5% Democrat (Barack Obama); 32.1% Republican (John McCain)
- County population: 6,113
11. Washington County

- Average popular vote split in last 4 presidential elections: 68.8% Democratic; 30.4% Republican
- Popular vote split in 2020 election: 69.4% Democrat (Joe Biden); 29.4% Republican (Donald Trump)
- Popular vote split in 2016 election: 67.6% Democrat (Hillary Clinton); 31.2% Republican (Donald Trump)
- Popular vote split in 2012 election: 70.9% Democrat (Barack Obama); 28.7% Republican (Mitt Romney)
- Popular vote split in 2008 election: 67.2% Democrat (Barack Obama); 32.5% Republican (John McCain)
- County population: 44,604
10. Leflore County
- Average popular vote split in last 4 presidential elections: 69.9% Democratic; 29.3% Republican
- Popular vote split in 2020 election: 70.2% Democrat (Joe Biden); 28.7% Republican (Donald Trump)
- Popular vote split in 2016 election: 69.9% Democrat (Hillary Clinton); 28.8% Republican (Donald Trump)
- Popular vote split in 2012 election: 71.4% Democrat (Barack Obama); 28.1% Republican (Mitt Romney)
- Popular vote split in 2008 election: 68.1% Democrat (Barack Obama); 31.4% Republican (John McCain)
- County population: 27,920
9. Sunflower County

- Average popular vote split in last 4 presidential elections: 70.9% Democratic; 28.2% Republican
- Popular vote split in 2020 election: 70.0% Democrat (Joe Biden); 28.9% Republican (Donald Trump)
- Popular vote split in 2016 election: 70.1% Democrat (Hillary Clinton); 29.1% Republican (Donald Trump)
- Popular vote split in 2012 election: 73.0% Democrat (Barack Obama); 26.1% Republican (Mitt Romney)
- Popular vote split in 2008 election: 70.3% Democrat (Barack Obama); 29.1% Republican (John McCain)
- County population: 25,867
8. Hinds County
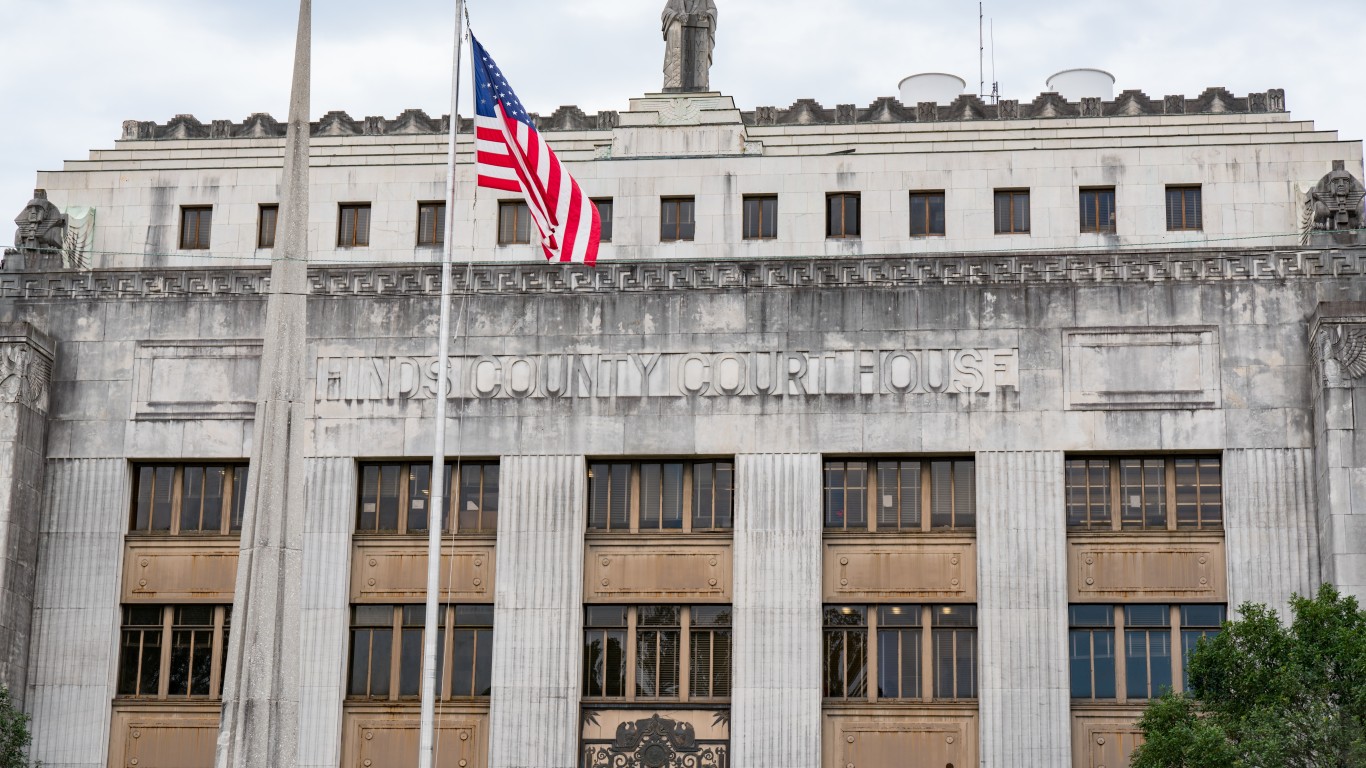
- Average popular vote split in last 4 presidential elections: 71.4% Democratic; 27.6% Republican
- Popular vote split in 2020 election: 73.6% Democrat (Joe Biden); 25.1% Republican (Donald Trump)
- Popular vote split in 2016 election: 71.4% Democrat (Hillary Clinton); 26.7% Republican (Donald Trump)
- Popular vote split in 2012 election: 71.5% Democrat (Barack Obama); 27.9% Republican (Mitt Romney)
- Popular vote split in 2008 election: 69.4% Democrat (Barack Obama); 30.3% Republican (John McCain)
- County population: 226,541
7. Coahoma County

- Average popular vote split in last 4 presidential elections: 72.1% Democratic; 27.1% Republican
- Popular vote split in 2020 election: 70.8% Democrat (Joe Biden); 27.9% Republican (Donald Trump)
- Popular vote split in 2016 election: 71.6% Democrat (Hillary Clinton); 27.2% Republican (Donald Trump)
- Popular vote split in 2012 election: 73.9% Democrat (Barack Obama); 25.7% Republican (Mitt Romney)
- Popular vote split in 2008 election: 72.0% Democrat (Barack Obama); 27.6% Republican (John McCain)
- County population: 21,264
6. Humphreys County
- Average popular vote split in last 4 presidential elections: 72.6% Democratic; 26.8% Republican
- Popular vote split in 2020 election: 72.0% Democrat (Joe Biden); 26.7% Republican (Donald Trump)
- Popular vote split in 2016 election: 72.2% Democrat (Hillary Clinton); 27.1% Republican (Donald Trump)
- Popular vote split in 2012 election: 74.9% Democrat (Barack Obama); 24.8% Republican (Mitt Romney)
- Popular vote split in 2008 election: 71.1% Democrat (Barack Obama); 28.6% Republican (John McCain)
- County population: 7,744
5. Tunica County
- Average popular vote split in last 4 presidential elections: 75.8% Democratic; 23.2% Republican
- Popular vote split in 2020 election: 72.4% Democrat (Joe Biden); 26.0% Republican (Donald Trump)
- Popular vote split in 2016 election: 74.8% Democrat (Hillary Clinton); 23.9% Republican (Donald Trump)
- Popular vote split in 2012 election: 79.3% Democrat (Barack Obama); 20.2% Republican (Mitt Romney)
- Popular vote split in 2008 election: 75.9% Democrat (Barack Obama); 23.5% Republican (John McCain)
- County population: 9,787
4. Noxubee County
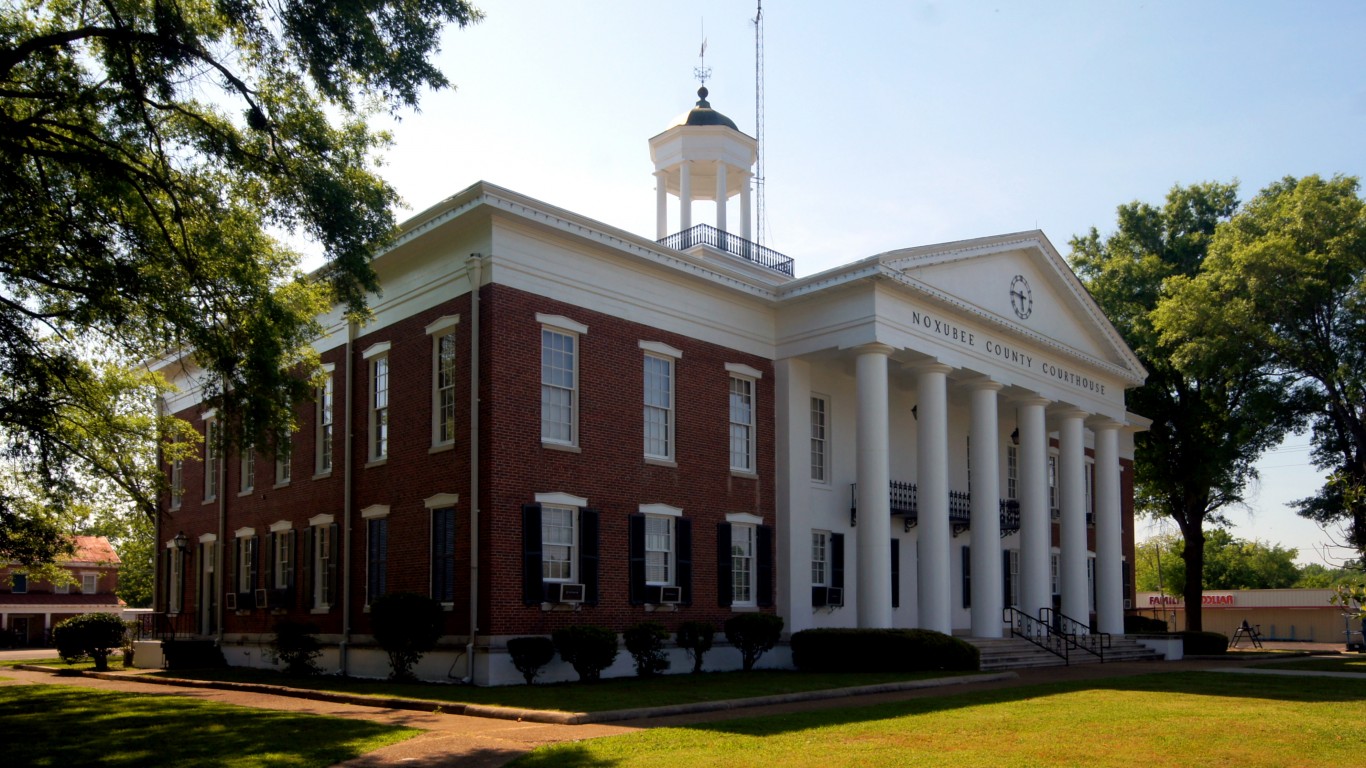
- Average popular vote split in last 4 presidential elections: 77.2% Democratic; 22.3% Republican
- Popular vote split in 2020 election: 75.7% Democrat (Joe Biden); 23.2% Republican (Donald Trump)
- Popular vote split in 2016 election: 78.0% Democrat (Hillary Clinton); 21.5% Republican (Donald Trump)
- Popular vote split in 2012 election: 78.5% Democrat (Barack Obama); 21.2% Republican (Mitt Romney)
- Popular vote split in 2008 election: 76.4% Democrat (Barack Obama); 23.2% Republican (John McCain)
- County population: 10,261
3. Holmes County
- Average popular vote split in last 4 presidential elections: 82.4% Democratic; 16.6% Republican
- Popular vote split in 2020 election: 81.2% Democrat (Joe Biden); 16.9% Republican (Donald Trump)
- Popular vote split in 2016 election: 82.8% Democrat (Hillary Clinton); 16.2% Republican (Donald Trump)
- Popular vote split in 2012 election: 84.1% Democrat (Barack Obama); 15.5% Republican (Mitt Romney)
- Popular vote split in 2008 election: 81.5% Democrat (Barack Obama); 18.0% Republican (John McCain)
- County population: 16,848
2. Claiborne County
- Average popular vote split in last 4 presidential elections: 86.5% Democratic; 12.8% Republican
- Popular vote split in 2020 election: 84.8% Democrat (Joe Biden); 13.6% Republican (Donald Trump)
- Popular vote split in 2016 election: 86.8% Democrat (Hillary Clinton); 12.6% Republican (Donald Trump)
- Popular vote split in 2012 election: 88.2% Democrat (Barack Obama); 11.4% Republican (Mitt Romney)
- Popular vote split in 2008 election: 85.9% Democrat (Barack Obama); 13.7% Republican (John McCain)
- County population: 9,044
1. Jefferson County
- Average popular vote split in last 4 presidential elections: 87.0% Democratic; 12.2% Republican
- Popular vote split in 2020 election: 85.1% Democrat (Joe Biden); 13.6% Republican (Donald Trump)
- Popular vote split in 2016 election: 86.5% Democrat (Hillary Clinton); 12.7% Republican (Donald Trump)
- Popular vote split in 2012 election: 89.1% Democrat (Barack Obama); 10.6% Republican (Mitt Romney)
- Popular vote split in 2008 election: 86.9% Democrat (Barack Obama); 12.3% Republican (John McCain)
- County population: 7,207
Take Charge of Your Retirement In Just A Few Minutes (Sponsor)
Retirement planning doesn’t have to feel overwhelming. The key is finding expert guidance—and SmartAsset’s simple quiz makes it easier than ever for you to connect with a vetted financial advisor.
Here’s how it works:
- Answer a Few Simple Questions. Tell us a bit about your goals and preferences—it only takes a few minutes!
- Get Matched with Vetted Advisors Our smart tool matches you with up to three pre-screened, vetted advisors who serve your area and are held to a fiduciary standard to act in your best interests. Click here to begin
- Choose Your Fit Review their profiles, schedule an introductory call (or meet in person), and select the advisor who feel is right for you.
Why wait? Start building the retirement you’ve always dreamed of. Click here to get started today!
Thank you for reading! Have some feedback for us?
Contact the 24/7 Wall St. editorial team.
Latest from 24/7


Our expert who first called NVIDIA in 2009 is predicting 2025 will see a historic AI breakthrough.
You can follow him investing $500,000 of his own money on our top AI stocks for free.