Despite its status as a Democratic stronghold, there are several parts of New Jersey that have consistently broken with the prevailing political ideology in recent elections. According to voting records, there are eight counties in New Jersey where an average of at least 50% of voters have supported the Republican candidate across the last four presidential elections. In one of these counties, an average of 61.8% of voters cast ballots for the Republican candidate over the same four general elections. All historical, county-level, voting statistics are from the MIT Election Data and Science Lab’s County Presidential Election Returns 2000-2020 database, as compiled in the Harvard Dataverse, V13.
These are the most Republican counties in New Jersey.
Why It Matters

Because of the electoral college system, the outcome of presidential elections often comes down to voters in just a handful of closely contested states. In contrast to these battleground states, most of the country has reliably voted either Democratic or Republican in recent presidential elections. These states include New Jersey, which, barring any unforeseen shake ups in the race, is all but guaranteed to go to Harris in 2024. Still, New Jersey is not the partisan monolith it is often perceived to be.
8. Morris County

- Average popular vote split in last 4 presidential elections: 47.1% Democratic; 51.3% Republican
- Popular vote split in 2020 election: 51.4% Democrat (Joe Biden); 47.2% Republican (Donald Trump)
- Popular vote split in 2016 election: 46.0% Democrat (Hillary Clinton); 50.3% Republican (Donald Trump)
- Popular vote split in 2012 election: 44.0% Democrat (Barack Obama); 54.9% Republican (Mitt Romney)
- Popular vote split in 2008 election: 45.8% Democrat (Barack Obama); 54.0% Republican (John McCain)
- County population: 508,816
7. Monmouth County

- Average popular vote split in last 4 presidential elections: 46.7% Democratic; 51.8% Republican
- Popular vote split in 2020 election: 47.9% Democrat (Joe Biden); 50.7% Republican (Donald Trump)
- Popular vote split in 2016 election: 43.6% Democrat (Hillary Clinton); 53.0% Republican (Donald Trump)
- Popular vote split in 2012 election: 46.9% Democrat (Barack Obama); 51.9% Republican (Mitt Romney)
- Popular vote split in 2008 election: 48.0% Democrat (Barack Obama); 51.8% Republican (John McCain)
- County population: 643,064
6. Salem County

- Average popular vote split in last 4 presidential elections: 46.1% Democratic; 52.0% Republican
- Popular vote split in 2020 election: 42.7% Democrat (Joe Biden); 55.5% Republican (Donald Trump)
- Popular vote split in 2016 election: 40.4% Democrat (Hillary Clinton); 55.5% Republican (Donald Trump)
- Popular vote split in 2012 election: 49.9% Democrat (Barack Obama); 48.6% Republican (Mitt Romney)
- Popular vote split in 2008 election: 51.8% Democrat (Barack Obama); 47.9% Republican (John McCain)
- County population: 64,840
5. Hunterdon County

- Average popular vote split in last 4 presidential elections: 43.0% Democratic; 54.9% Republican
- Popular vote split in 2020 election: 46.8% Democrat (Joe Biden); 51.2% Republican (Donald Trump)
- Popular vote split in 2016 election: 40.8% Democrat (Hillary Clinton); 54.7% Republican (Donald Trump)
- Popular vote split in 2012 election: 40.4% Democrat (Barack Obama); 58.2% Republican (Mitt Romney)
- Popular vote split in 2008 election: 43.1% Democrat (Barack Obama); 56.6% Republican (John McCain)
- County population: 129,099
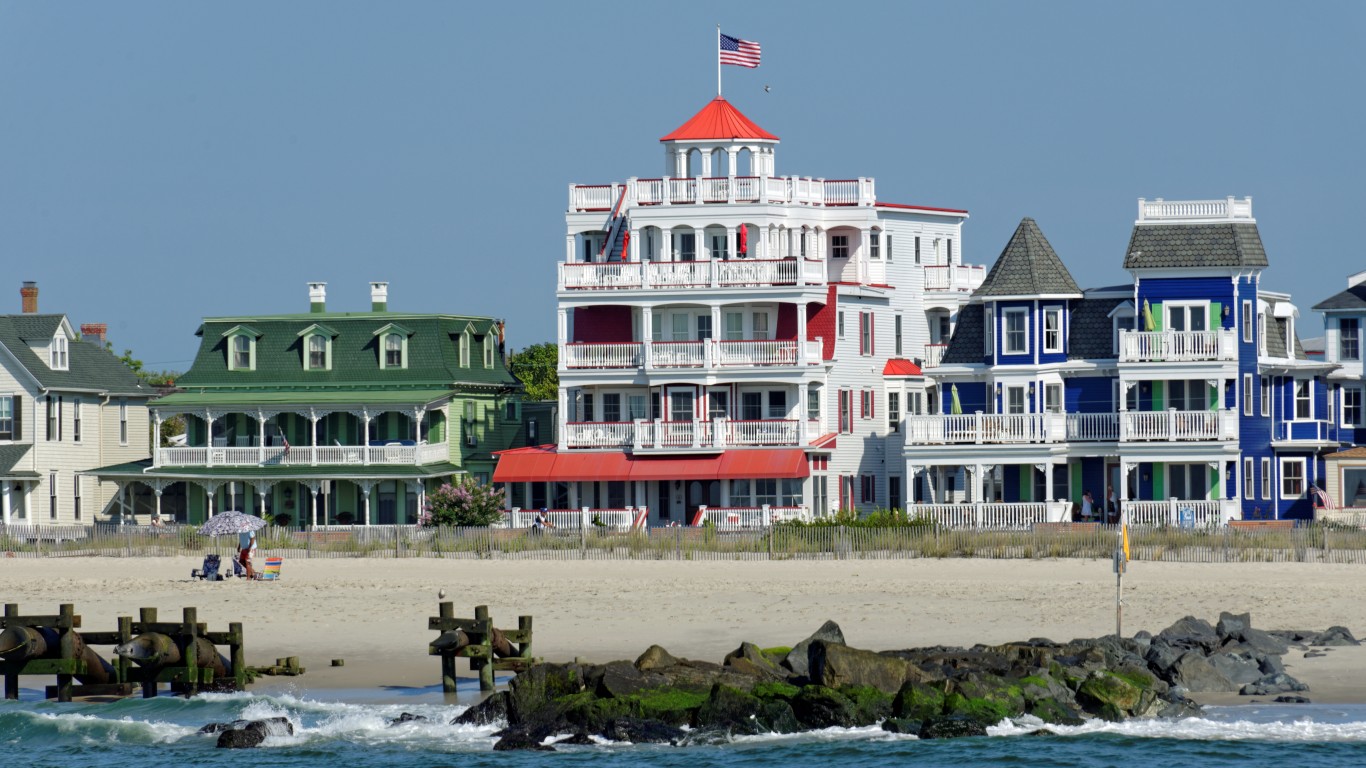
4. Cape May County
- Average popular vote split in last 4 presidential elections: 42.6% Democratic; 56.0% Republican
- Popular vote split in 2020 election: 41.5% Democrat (Joe Biden); 57.5% Republican (Donald Trump)
- Popular vote split in 2016 election: 38.5% Democrat (Hillary Clinton); 58.4% Republican (Donald Trump)
- Popular vote split in 2012 election: 45.2% Democrat (Barack Obama); 53.8% Republican (Mitt Romney)
- Popular vote split in 2008 election: 45.4% Democrat (Barack Obama); 54.2% Republican (John McCain)
- County population: 95,456
3. Warren County

- Average popular vote split in last 4 presidential elections: 40.1% Democratic; 57.9% Republican
- Popular vote split in 2020 election: 41.0% Democrat (Joe Biden); 57.2% Republican (Donald Trump)
- Popular vote split in 2016 election: 35.1% Democrat (Hillary Clinton); 60.6% Republican (Donald Trump)
- Popular vote split in 2012 election: 41.4% Democrat (Barack Obama); 56.9% Republican (Mitt Romney)
- Popular vote split in 2008 election: 42.7% Democrat (Barack Obama); 56.9% Republican (John McCain)
- County population: 109,739
2. Sussex County

- Average popular vote split in last 4 presidential elections: 37.5% Democratic; 60.4% Republican
- Popular vote split in 2020 election: 39.2% Democrat (Joe Biden); 58.8% Republican (Donald Trump)
- Popular vote split in 2016 election: 32.7% Democrat (Hillary Clinton); 62.9% Republican (Donald Trump)
- Popular vote split in 2012 election: 38.4% Democrat (Barack Obama); 59.8% Republican (Mitt Romney)
- Popular vote split in 2008 election: 39.3% Democrat (Barack Obama); 60.2% Republican (John McCain)
- County population: 144,808
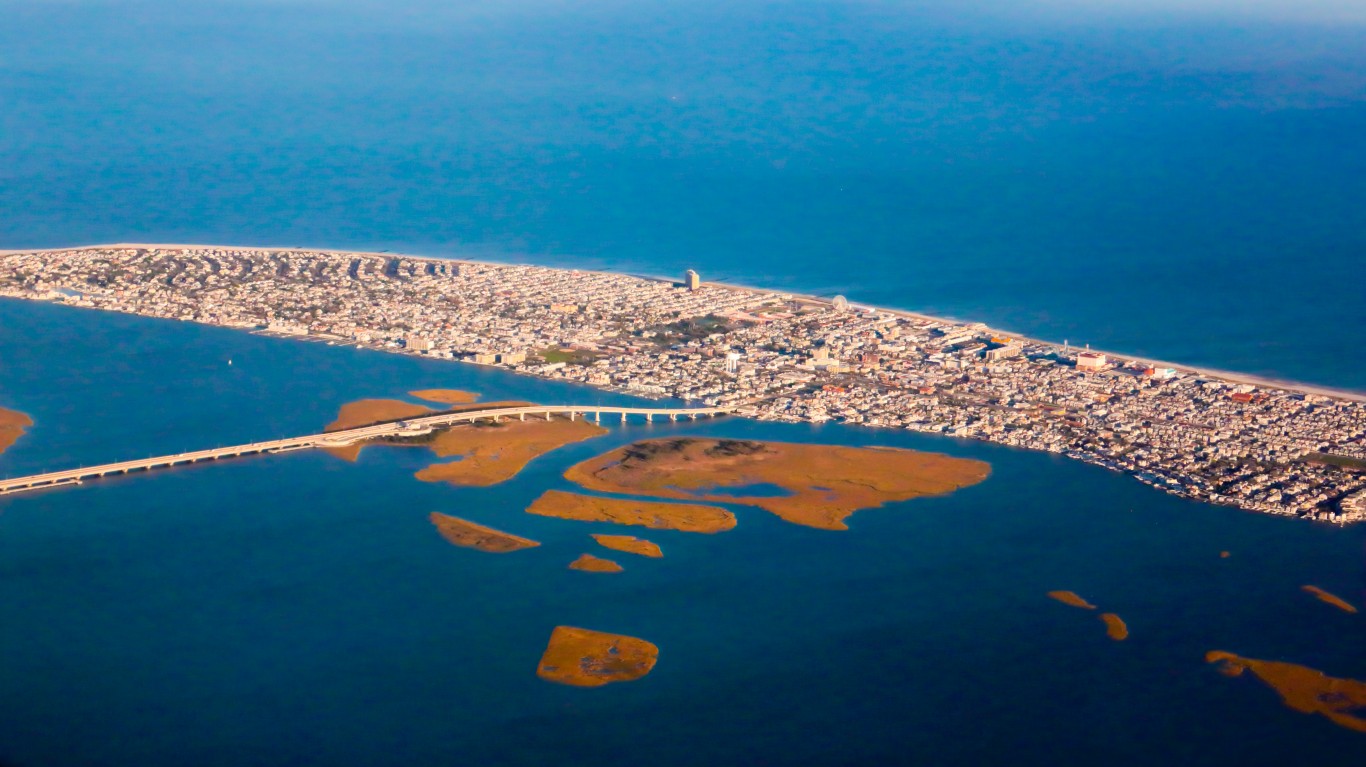
1. Ocean County

- Average popular vote split in last 4 presidential elections: 36.8% Democratic; 61.8% Republican
- Popular vote split in 2020 election: 35.0% Democrat (Joe Biden); 63.8% Republican (Donald Trump)
- Popular vote split in 2016 election: 31.8% Democrat (Hillary Clinton); 65.3% Republican (Donald Trump)
- Popular vote split in 2012 election: 40.7% Democrat (Barack Obama); 58.3% Republican (Mitt Romney)
- Popular vote split in 2008 election: 40.6% Democrat (Barack Obama); 59.2% Republican (John McCain)
- County population: 638,691
It’s Your Money, Your Future—Own It (sponsor)
Are you ahead, or behind on retirement? For families with more than $500,000 saved for retirement, finding a financial advisor who puts your interest first can be the difference, and today it’s easier than ever. SmartAsset’s free tool matches you with up to three fiduciary financial advisors who serve your area in minutes. Each advisor has been carefully vetted and must act in your best interests. Start your search now.
If you’ve saved and built a substantial nest egg for you and your family, don’t delay; get started right here and help your retirement dreams become a retirement reality.
Thank you for reading! Have some feedback for us?
Contact the 24/7 Wall St. editorial team.

Our expert who first called NVIDIA in 2009 is predicting 2025 will see a historic AI breakthrough.
You can follow him investing $500,000 of his own money on our top AI stocks for free.