24/7 Wall St. Insights
- This election cycle, Harris and Trump campaigns are focusing their resources on a handful of key swing states, where the election will likely be decided.
- In most of the rest of the country, including Minnesota, the outcome of the race is effectively predetermined.
- However, Minnesota’s status as a blue state is an oversimplification that belies a much more nuanced reality.
- Also: 2 Dividend Legends to Hold Forever
As has been the case in other recent presidential elections, the 2024 race will likely hinge on voters in a handful of closely contested swing states. In these states, which include Arizona, Georgia, North Carolina, Pennsylvania, and Wisconsin, both major party candidates are polling so closely that either one has a reasonable chance of winning in November. (This is how Trump and Harris are polling in every key swing state.)
Unlike swing states — which are effectively a toss-up – most states are already a virtual lock for either Donald Trump, the Republican candidate, or Kamala Harris, the Democratic nominee. So-called blue states, like Massachusetts and Vermont, are places that Harris can reliably count on taking in November. Meanwhile, red states like Idaho and Wyoming are GOP strongholds that Trump will likely win handily.
These and other non-swing states are often characterized as political monoliths, home to populations of like-minded voters with similar values and priorities. This, however, is an oversimplification that belies a much more nuanced reality.
Minnesota, long considered a blue state, has gone to the Democratic candidate in every presidential election since the GOP’s Richard Nixon defeated George McGovern, a Democrat, in 1972. Barring unforeseen shakeup, Minnesota is expected to align with historical voting patterns once again in 2024 and go to Harris. (Here is a look at the 15 least popular presidents, according to Millennials.)
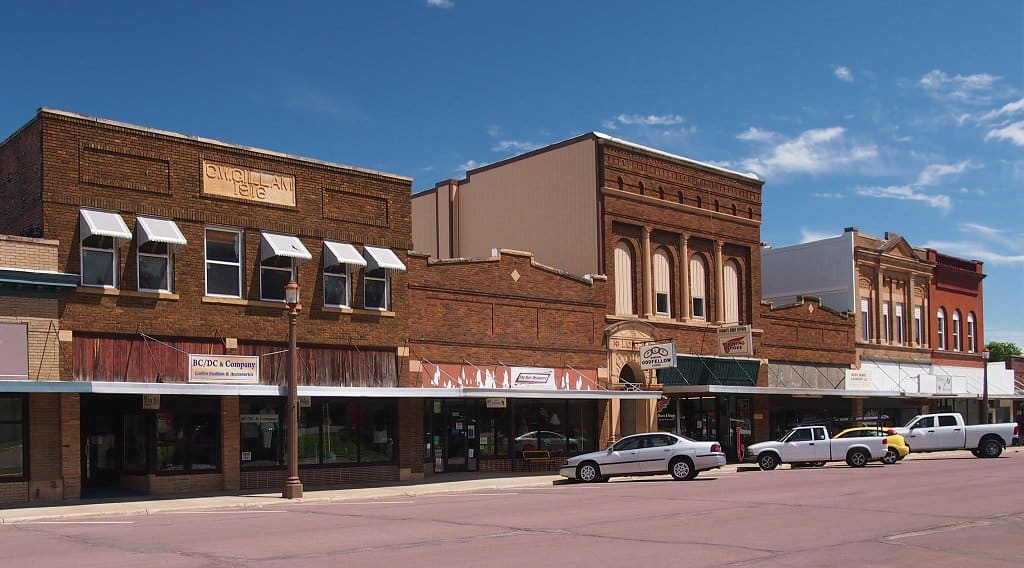
Despite its status as a Democratic stronghold, there are several parts of the state that have consistently broken with the prevailing political ideology in recent elections. According to voting records, there are 24 counties in Minnesota where an average of at least 60% of voters have supported the Republican candidate across the last four presidential elections. In one of these counties, more than 67% of voters cast ballots for the Republican candidate over the same four general elections.
These are the most Republican counties in Minnesota. All historical, county-level, voting statistics are from the MIT Election Data and Science Lab’s County Presidential Election Returns 2000-2020 database, as compiled in the Harvard Dataverse, V13.
Why It Matters
Because of the electoral college system, the outcome of presidential elections often comes down to voters in just a handful of closely contested states. In contrast to these battleground states, most of the country has reliably voted either Democratic or Republican in recent presidential elections. These states include Minnesota, which, barring any unforeseen shake ups in the race, is expected to go to Harris in 2024. Still, Minnesota is not the partisan monolith it is often perceived to be.
24. Brown County

- Average popular vote split in last 4 presidential elections: 35.7% Democratic; 60.1% Republican
- Popular vote split in 2020 election: 32.5% Democrat (Joe Biden); 65.3% Republican (Donald Trump)
- Popular vote split in 2016 election: 27.3% Democrat (Hillary Clinton); 63.2% Republican (Donald Trump)
- Popular vote split in 2012 election: 40.4% Democrat (Barack Obama); 57.0% Republican (Mitt Romney)
- Popular vote split in 2008 election: 42.7% Democrat (Barack Obama); 54.7% Republican (John McCain)
- County population: 25,880
23. Hubbard County

- Average popular vote split in last 4 presidential elections: 36.6% Democratic; 60.1% Republican
- Popular vote split in 2020 election: 34.4% Democrat (Joe Biden); 63.3% Republican (Donald Trump)
- Popular vote split in 2016 election: 29.8% Democrat (Hillary Clinton); 63.1% Republican (Donald Trump)
- Popular vote split in 2012 election: 40.6% Democrat (Barack Obama); 57.5% Republican (Mitt Romney)
- Popular vote split in 2008 election: 41.9% Democrat (Barack Obama); 56.3% Republican (John McCain)
- County population: 21,479
22. Jackson County
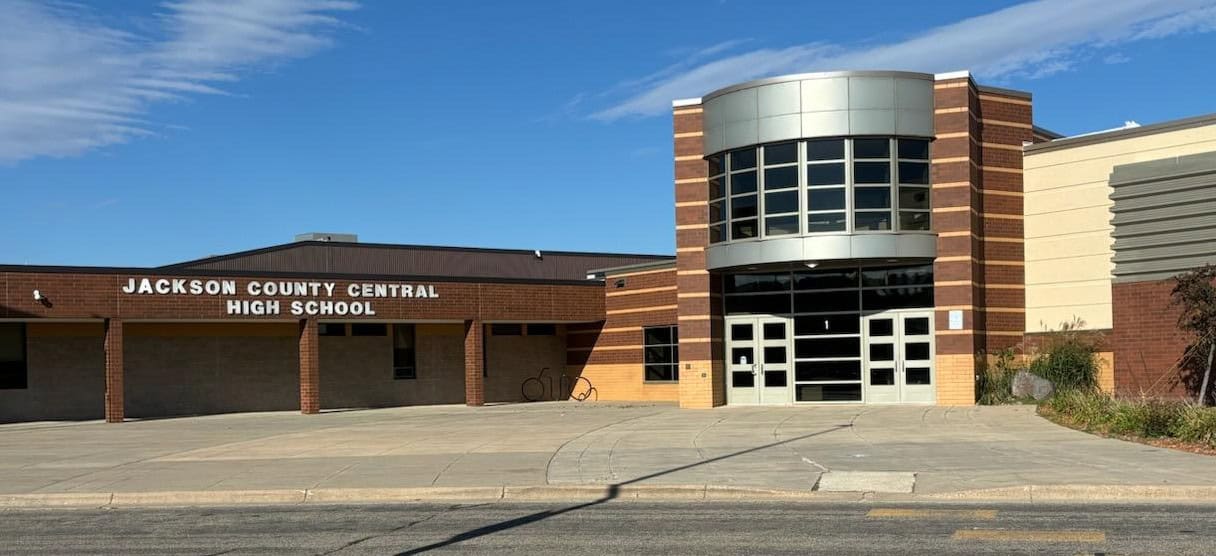
- Average popular vote split in last 4 presidential elections: 36.3% Democratic; 60.2% Republican
- Popular vote split in 2020 election: 30.0% Democrat (Joe Biden); 67.8% Republican (Donald Trump)
- Popular vote split in 2016 election: 27.2% Democrat (Hillary Clinton); 65.8% Republican (Donald Trump)
- Popular vote split in 2012 election: 41.8% Democrat (Barack Obama); 56.1% Republican (Mitt Romney)
- Popular vote split in 2008 election: 46.6% Democrat (Barack Obama); 50.8% Republican (John McCain)
- County population: 9,990
21. Douglas County

- Average popular vote split in last 4 presidential elections: 36.4% Democratic; 60.2% Republican
- Popular vote split in 2020 election: 32.6% Democrat (Joe Biden); 65.4% Republican (Donald Trump)
- Popular vote split in 2016 election: 28.6% Democrat (Hillary Clinton); 64.1% Republican (Donald Trump)
- Popular vote split in 2012 election: 41.3% Democrat (Barack Obama); 56.7% Republican (Mitt Romney)
- Popular vote split in 2008 election: 44.2% Democrat (Barack Obama); 53.7% Republican (John McCain)
- County population: 39,081
20. Cottonwood County
- Average popular vote split in last 4 presidential elections: 36.7% Democratic; 60.3% Republican
- Popular vote split in 2020 election: 30.0% Democrat (Joe Biden); 68.2% Republican (Donald Trump)
- Popular vote split in 2016 election: 29.3% Democrat (Hillary Clinton); 64.3% Republican (Donald Trump)
- Popular vote split in 2012 election: 41.5% Democrat (Barack Obama); 56.6% Republican (Mitt Romney)
- Popular vote split in 2008 election: 45.7% Democrat (Barack Obama); 52.3% Republican (John McCain)
- County population: 11,481
19. Wright County
- Average popular vote split in last 4 presidential elections: 35.3% Democratic; 60.8% Republican
- Popular vote split in 2020 election: 34.5% Democrat (Joe Biden); 63.1% Republican (Donald Trump)
- Popular vote split in 2016 election: 29.2% Democrat (Hillary Clinton); 62.2% Republican (Donald Trump)
- Popular vote split in 2012 election: 38.0% Democrat (Barack Obama); 59.7% Republican (Mitt Romney)
- Popular vote split in 2008 election: 40.2% Democrat (Barack Obama); 57.6% Republican (John McCain)
- County population: 142,543
18. Wilkin County
- Average popular vote split in last 4 presidential elections: 35.4% Democratic; 60.8% Republican
- Popular vote split in 2020 election: 29.9% Democrat (Joe Biden); 67.9% Republican (Donald Trump)
- Popular vote split in 2016 election: 27.0% Democrat (Hillary Clinton); 64.5% Republican (Donald Trump)
- Popular vote split in 2012 election: 39.0% Democrat (Barack Obama); 58.5% Republican (Mitt Romney)
- Popular vote split in 2008 election: 45.4% Democrat (Barack Obama); 52.3% Republican (John McCain)
- County population: 6,454
17. Marshall County
- Average popular vote split in last 4 presidential elections: 35.3% Democratic; 60.8% Republican
- Popular vote split in 2020 election: 25.3% Democrat (Joe Biden); 72.8% Republican (Donald Trump)
- Popular vote split in 2016 election: 25.4% Democrat (Hillary Clinton); 66.6% Republican (Donald Trump)
- Popular vote split in 2012 election: 42.5% Democrat (Barack Obama); 54.7% Republican (Mitt Romney)
- Popular vote split in 2008 election: 48.8% Democrat (Barack Obama); 48.2% Republican (John McCain)
- County population: 9,017
16. Otter Tail County

- Average popular vote split in last 4 presidential elections: 35.5% Democratic; 61.3% Republican
- Popular vote split in 2020 election: 32.9% Democrat (Joe Biden); 65.4% Republican (Donald Trump)
- Popular vote split in 2016 election: 28.7% Democrat (Hillary Clinton); 64.4% Republican (Donald Trump)
- Popular vote split in 2012 election: 38.4% Democrat (Barack Obama); 59.6% Republican (Mitt Romney)
- Popular vote split in 2008 election: 42.4% Democrat (Barack Obama); 55.3% Republican (John McCain)
- County population: 60,072
15. Meeker County

- Average popular vote split in last 4 presidential elections: 34.4% Democratic; 61.5% Republican
- Popular vote split in 2020 election: 28.6% Democrat (Joe Biden); 69.2% Republican (Donald Trump)
- Popular vote split in 2016 election: 26.0% Democrat (Hillary Clinton); 66.0% Republican (Donald Trump)
- Popular vote split in 2012 election: 40.7% Democrat (Barack Obama); 56.6% Republican (Mitt Romney)
- Popular vote split in 2008 election: 42.9% Democrat (Barack Obama); 53.7% Republican (John McCain)
- County population: 23,352
14. Rock County

- Average popular vote split in last 4 presidential elections: 34.9% Democratic; 61.6% Republican
- Popular vote split in 2020 election: 29.7% Democrat (Joe Biden); 68.4% Republican (Donald Trump)
- Popular vote split in 2016 election: 28.4% Democrat (Hillary Clinton); 63.9% Republican (Donald Trump)
- Popular vote split in 2012 election: 40.2% Democrat (Barack Obama); 58.0% Republican (Mitt Romney)
- Popular vote split in 2008 election: 41.8% Democrat (Barack Obama); 55.8% Republican (John McCain)
- County population: 9,659
13. Sherburne County

- Average popular vote split in last 4 presidential elections: 34.2% Democratic; 62.1% Republican
- Popular vote split in 2020 election: 32.5% Democrat (Joe Biden); 65.1% Republican (Donald Trump)
- Popular vote split in 2016 election: 27.5% Democrat (Hillary Clinton); 64.3% Republican (Donald Trump)
- Popular vote split in 2012 election: 37.8% Democrat (Barack Obama); 59.9% Republican (Mitt Romney)
- Popular vote split in 2008 election: 39.9% Democrat (Barack Obama); 58.1% Republican (John McCain)
- County population: 97,820
12. Isanti County

- Average popular vote split in last 4 presidential elections: 34.0% Democratic; 62.1% Republican
- Popular vote split in 2020 election: 29.5% Democrat (Joe Biden); 68.0% Republican (Donald Trump)
- Popular vote split in 2016 election: 26.9% Democrat (Hillary Clinton); 64.9% Republican (Donald Trump)
- Popular vote split in 2012 election: 39.7% Democrat (Barack Obama); 57.7% Republican (Mitt Romney)
- Popular vote split in 2008 election: 41.1% Democrat (Barack Obama); 56.5% Republican (John McCain)
- County population: 41,257
11. Mcleod County

- Average popular vote split in last 4 presidential elections: 33.4% Democratic; 62.3% Republican
- Popular vote split in 2020 election: 30.6% Democrat (Joe Biden); 66.8% Republican (Donald Trump)
- Popular vote split in 2016 election: 26.5% Democrat (Hillary Clinton); 64.6% Republican (Donald Trump)
- Popular vote split in 2012 election: 37.6% Democrat (Barack Obama); 59.7% Republican (Mitt Romney)
- Popular vote split in 2008 election: 39.4% Democrat (Barack Obama); 57.8% Republican (John McCain)
- County population: 36,727
10. Redwood County

- Average popular vote split in last 4 presidential elections: 33.3% Democratic; 62.8% Republican
- Popular vote split in 2020 election: 28.4% Democrat (Joe Biden); 69.7% Republican (Donald Trump)
- Popular vote split in 2016 election: 24.8% Democrat (Hillary Clinton); 67.5% Republican (Donald Trump)
- Popular vote split in 2012 election: 38.6% Democrat (Barack Obama); 58.7% Republican (Mitt Romney)
- Popular vote split in 2008 election: 41.6% Democrat (Barack Obama); 55.2% Republican (John McCain)
- County population: 15,428
9. Clearwater County
- Average popular vote split in last 4 presidential elections: 34.4% Democratic; 62.9% Republican
- Popular vote split in 2020 election: 26.8% Democrat (Joe Biden); 71.6% Republican (Donald Trump)
- Popular vote split in 2016 election: 25.9% Democrat (Hillary Clinton); 68.9% Republican (Donald Trump)
- Popular vote split in 2012 election: 41.8% Democrat (Barack Obama); 56.2% Republican (Mitt Romney)
- Popular vote split in 2008 election: 44.1% Democrat (Barack Obama); 53.8% Republican (John McCain)
- County population: 8,541
8. Martin County

- Average popular vote split in last 4 presidential elections: 33.5% Democratic; 63.0% Republican
- Popular vote split in 2020 election: 30.0% Democrat (Joe Biden); 67.9% Republican (Donald Trump)
- Popular vote split in 2016 election: 26.0% Democrat (Hillary Clinton); 67.1% Republican (Donald Trump)
- Popular vote split in 2012 election: 37.0% Democrat (Barack Obama); 60.7% Republican (Mitt Romney)
- Popular vote split in 2008 election: 41.0% Democrat (Barack Obama); 56.3% Republican (John McCain)
- County population: 19,960
7. Lake Of The Woods County

- Average popular vote split in last 4 presidential elections: 33.2% Democratic; 63.4% Republican
- Popular vote split in 2020 election: 27.9% Democrat (Joe Biden); 70.8% Republican (Donald Trump)
- Popular vote split in 2016 election: 24.7% Democrat (Hillary Clinton); 68.7% Republican (Donald Trump)
- Popular vote split in 2012 election: 38.5% Democrat (Barack Obama); 58.5% Republican (Mitt Romney)
- Popular vote split in 2008 election: 42.0% Democrat (Barack Obama); 55.3% Republican (John McCain)
- County population: 3,786
6. Sibley County
- Average popular vote split in last 4 presidential elections: 32.4% Democratic; 63.7% Republican
- Popular vote split in 2020 election: 28.6% Democrat (Joe Biden); 69.4% Republican (Donald Trump)
- Popular vote split in 2016 election: 25.1% Democrat (Hillary Clinton); 66.8% Republican (Donald Trump)
- Popular vote split in 2012 election: 37.3% Democrat (Barack Obama); 60.1% Republican (Mitt Romney)
- Popular vote split in 2008 election: 38.8% Democrat (Barack Obama); 58.1% Republican (John McCain)
- County population: 14,950
5. Todd County
- Average popular vote split in last 4 presidential elections: 32.8% Democratic; 64.1% Republican
- Popular vote split in 2020 election: 24.8% Democrat (Joe Biden); 73.6% Republican (Donald Trump)
- Popular vote split in 2016 election: 23.2% Democrat (Hillary Clinton); 70.7% Republican (Donald Trump)
- Popular vote split in 2012 election: 40.8% Democrat (Barack Obama); 56.9% Republican (Mitt Romney)
- Popular vote split in 2008 election: 43.1% Democrat (Barack Obama); 54.1% Republican (John McCain)
- County population: 25,277
4. Pipestone County
- Average popular vote split in last 4 presidential elections: 32.2% Democratic; 64.4% Republican
- Popular vote split in 2020 election: 26.4% Democrat (Joe Biden); 71.9% Republican (Donald Trump)
- Popular vote split in 2016 election: 23.4% Democrat (Hillary Clinton); 69.4% Republican (Donald Trump)
- Popular vote split in 2012 election: 37.1% Democrat (Barack Obama); 60.8% Republican (Mitt Romney)
- Popular vote split in 2008 election: 42.1% Democrat (Barack Obama); 55.2% Republican (John McCain)
- County population: 9,380
3. Roseau County
- Average popular vote split in last 4 presidential elections: 31.7% Democratic; 65.1% Republican
- Popular vote split in 2020 election: 26.0% Democrat (Joe Biden); 72.0% Republican (Donald Trump)
- Popular vote split in 2016 election: 23.8% Democrat (Hillary Clinton); 69.8% Republican (Donald Trump)
- Popular vote split in 2012 election: 37.7% Democrat (Barack Obama); 60.0% Republican (Mitt Romney)
- Popular vote split in 2008 election: 40.2% Democrat (Barack Obama); 57.6% Republican (John McCain)
- County population: 15,294
2. Wadena County
- Average popular vote split in last 4 presidential elections: 31.8% Democratic; 65.2% Republican
- Popular vote split in 2020 election: 26.4% Democrat (Joe Biden); 71.9% Republican (Donald Trump)
- Popular vote split in 2016 election: 24.3% Democrat (Hillary Clinton); 69.8% Republican (Donald Trump)
- Popular vote split in 2012 election: 36.7% Democrat (Barack Obama); 61.0% Republican (Mitt Romney)
- Popular vote split in 2008 election: 40.2% Democrat (Barack Obama); 57.6% Republican (John McCain)
- County population: 14,108
1. Morrison County
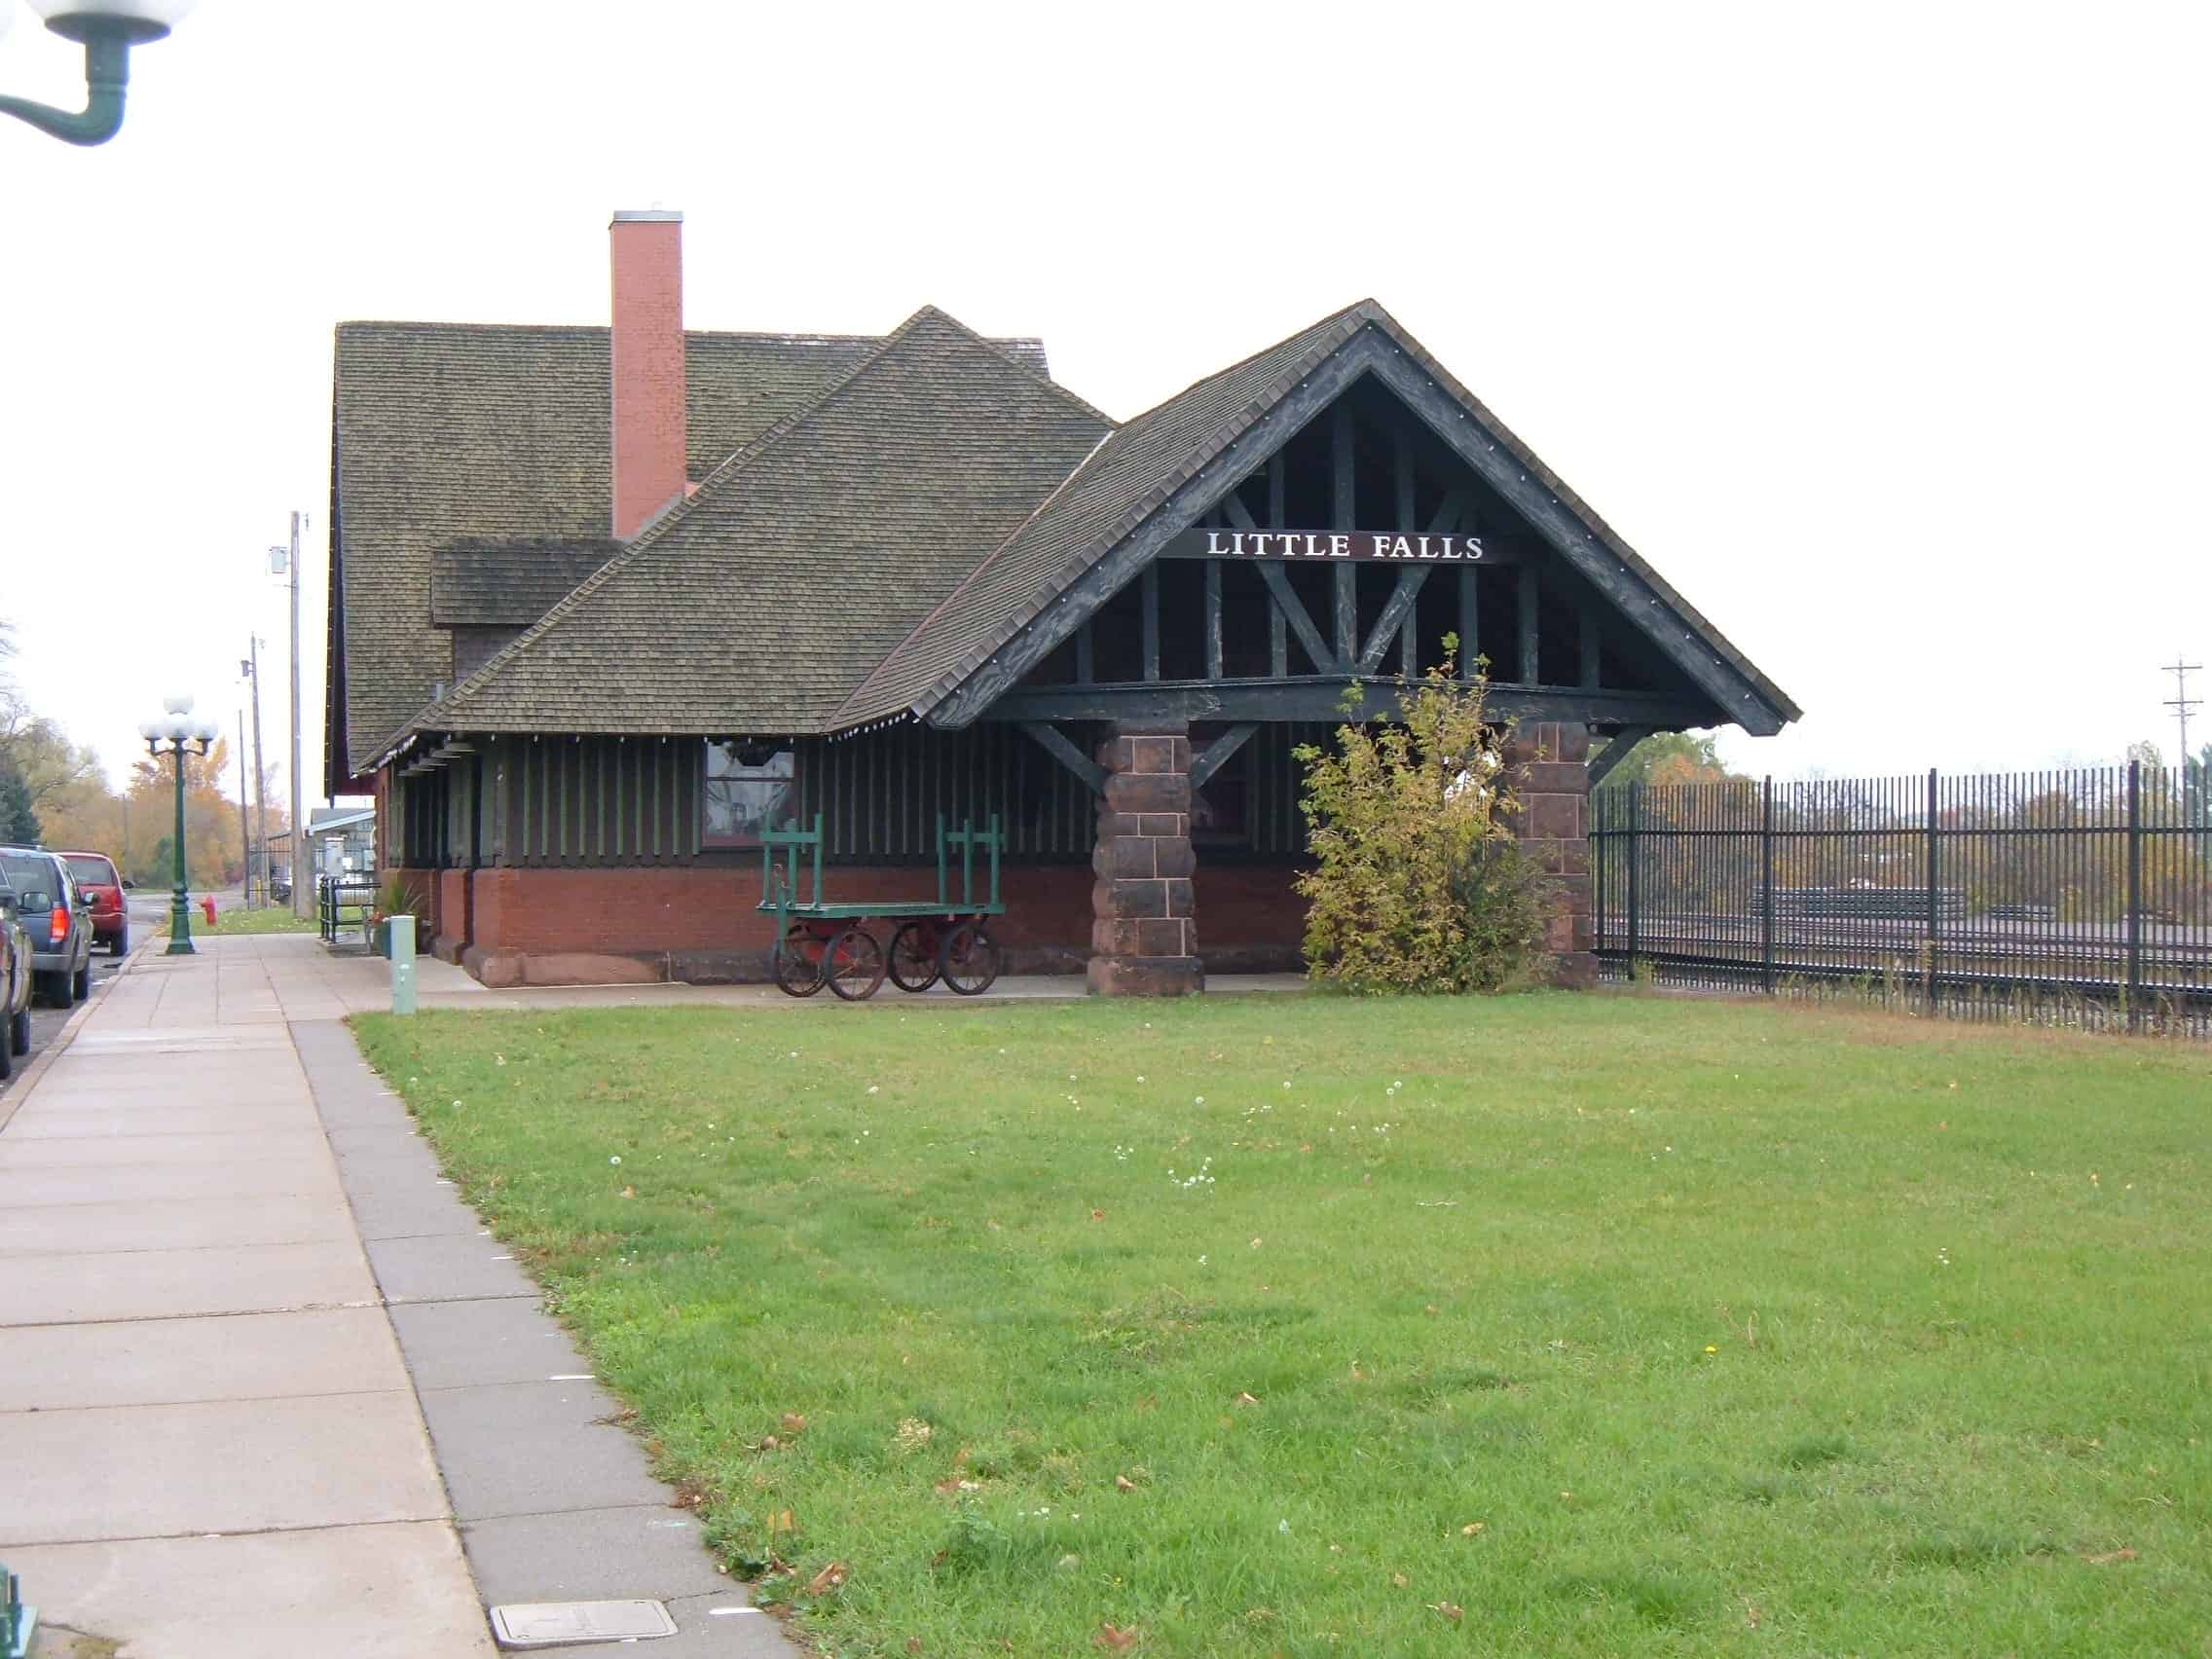
- Average popular vote split in last 4 presidential elections: 29.3% Democratic; 67.5% Republican
- Popular vote split in 2020 election: 22.3% Democrat (Joe Biden); 75.8% Republican (Donald Trump)
- Popular vote split in 2016 election: 20.6% Democrat (Hillary Clinton); 73.4% Republican (Donald Trump)
- Popular vote split in 2012 election: 36.8% Democrat (Barack Obama); 60.8% Republican (Mitt Romney)
- Popular vote split in 2008 election: 39.1% Democrat (Barack Obama); 58.1% Republican (John McCain)
- County population: 34,023
It’s Your Money, Your Future—Own It (sponsor)
Are you ahead, or behind on retirement? For families with more than $500,000 saved for retirement, finding a financial advisor who puts your interest first can be the difference, and today it’s easier than ever. SmartAsset’s free tool matches you with up to three fiduciary financial advisors who serve your area in minutes. Each advisor has been carefully vetted and must act in your best interests. Start your search now.
If you’ve saved and built a substantial nest egg for you and your family, don’t delay; get started right here and help your retirement dreams become a retirement reality.
Thank you for reading! Have some feedback for us?
Contact the 24/7 Wall St. editorial team.

Our expert who first called NVIDIA in 2009 is predicting 2025 will see a historic AI breakthrough.
You can follow him investing $500,000 of his own money on our top AI stocks for free.