24/7 Wall St. Insights
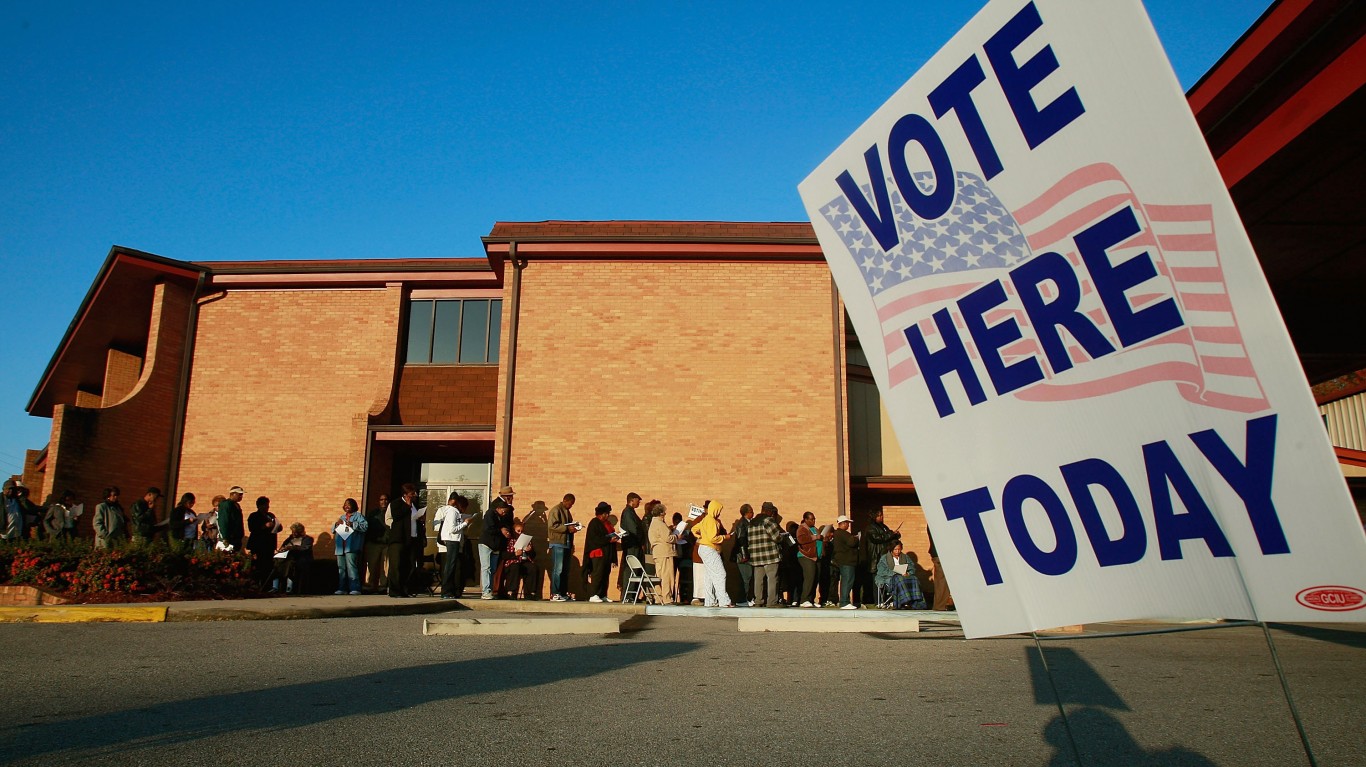
- This election cycle, Harris and Trump campaigns are focusing their resources on a handful of key swing-states, where the election will likely be decided.
- In most of the rest of the country, including Alabama, the outcome of the race is effectively predetermined.
- However, Alabama’s status as a red state is an oversimplification that belies a much more nuanced reality.
- Also: 2 Dividend Legends to Hold Forever
Recent presidential elections have been decided by voters in a handful of closely contested swing states — and 2024 is shaping up to be no different. In a handful of states this election cycle, both major party candidates are polling so closely that either one has a reasonable chance of winning. These states include Arizona, Georgia, North Carolina, Pennsylvania, and Wisconsin. (This is how Trump and Harris are polling in every key swing state.)
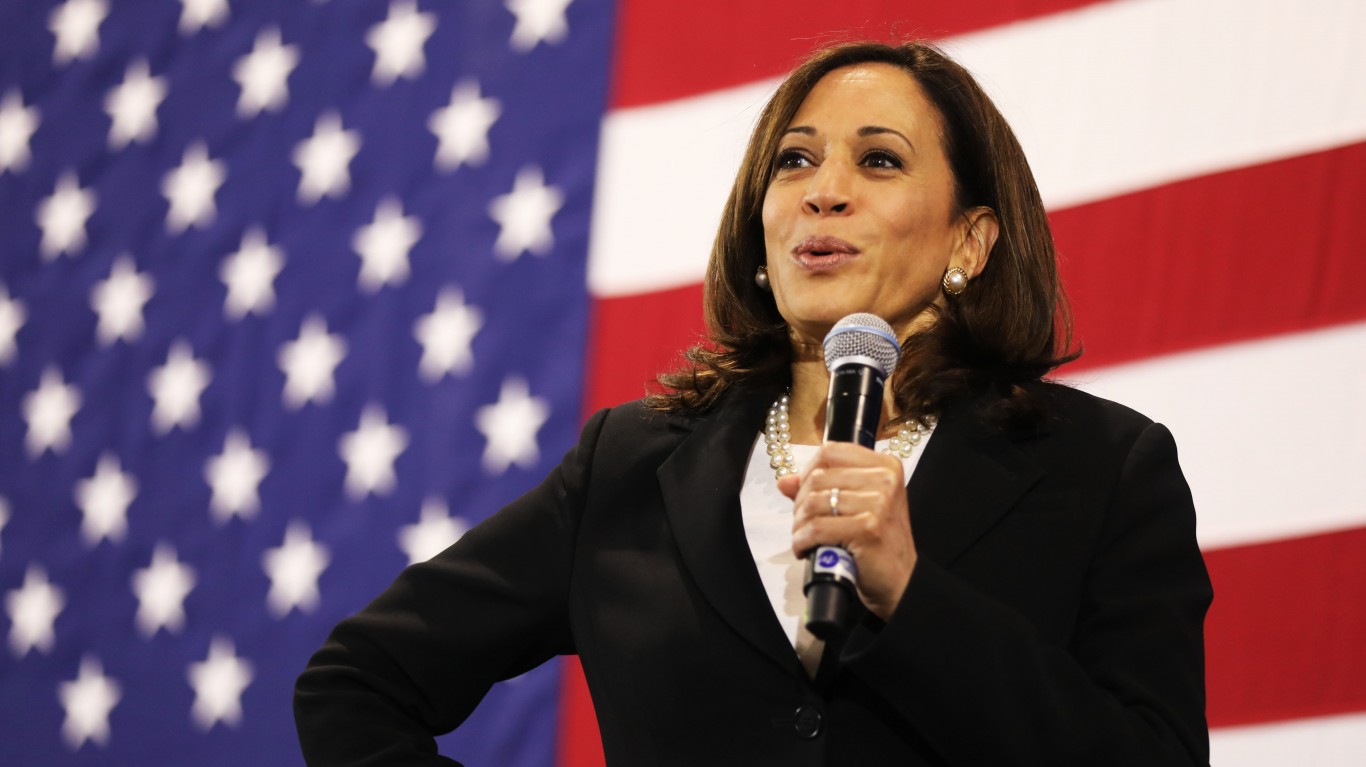
Unlike these swing states — which are effectively a toss-up – most states are already a virtual lock for either Donald Trump, the Republican candidate, or Kamala Harris, the Democratic nominee. So-called blue states, like Massachusetts and Vermont, are places that Harris can reliably count on taking in November. Meanwhile, Trump is expected to handily win red states like Idaho and Wyoming.
These and other non-swing states are often seen as political monoliths, home to populations of like-minded voters with similar values and priorities. This, however, is an oversimplification that belies a much more nuanced reality.
Alabama has long been seen as a red state. An average of 61.3% of Alabama voters have supported the Republican candidate across the last four presidential elections. In fact, Alabama has gone to the Republican candidate in every presidential election since 1976, when Jimmy Carter, a Democrat, defeated the GOP’s Gerald Ford. Barring any major, unforeseen shakeup, Alabama is expected to align with historical voting patterns once again in 2024 and go to Trump. (Here is a look at the 15 least popular presidents, according to Millennials.)
Despite its status as a Republican stronghold, there are several parts of the state that have consistently broken with the prevailing political ideology in recent elections. According to voting records, there are 13 counties in Alabama where an average of at least 50% of voters have supported the Democratic candidate across the last four presidential elections. In one of these counties, an average of 84.8% of voters cast ballots for the Democratic candidate over the same four general elections.
These are the most Democratic counties in Alabama. All historical, county-level, voting statistics are from the MIT Election Data and Science Lab’s County Presidential Election Returns 2000-2020 database, as compiled in the Harvard Dataverse, V13.
Why It Matters
Because of the electoral college system, the outcome of presidential elections often comes down to voters in just a handful of closely contested states. In contrast to these battleground states, most of the country has reliably voted either Democratic or Republican in recent presidential elections. These states include Alabama, which, barring any unforeseen shake ups in the race, is all but guaranteed to go to Trump in 2024. Still, Alabama is not the partisan monolith it is often perceived to be.
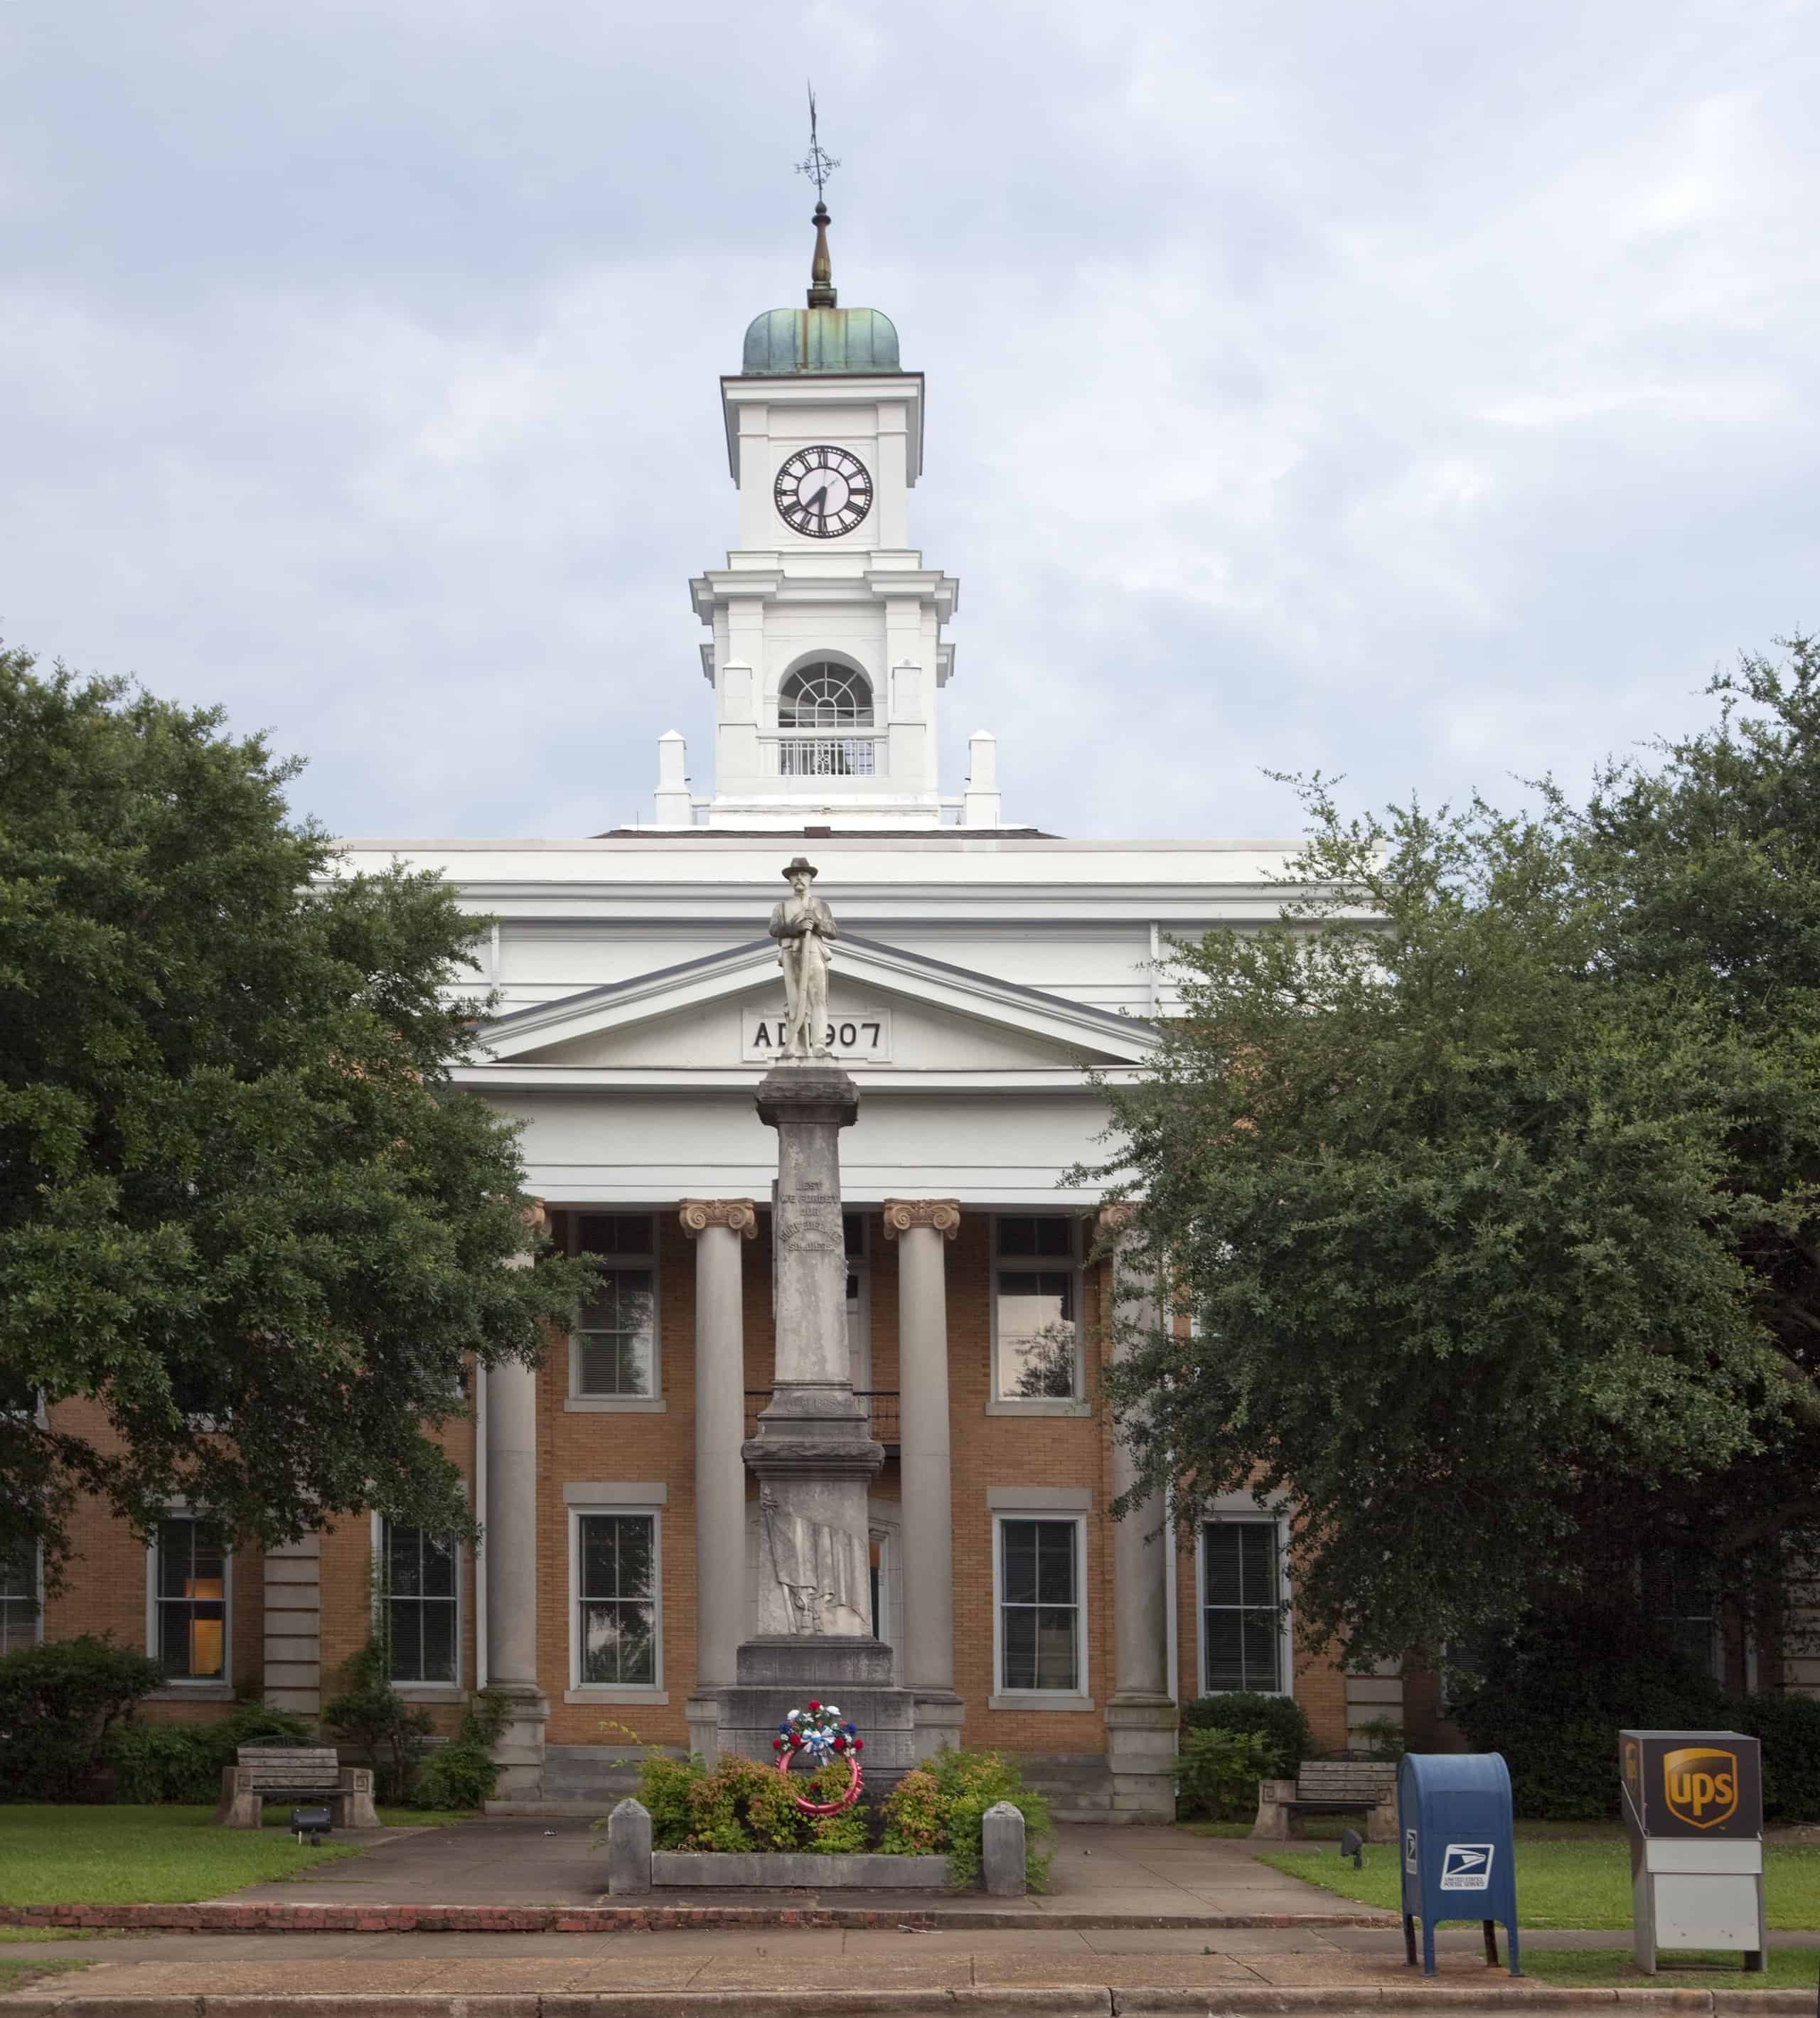
13. Marengo County
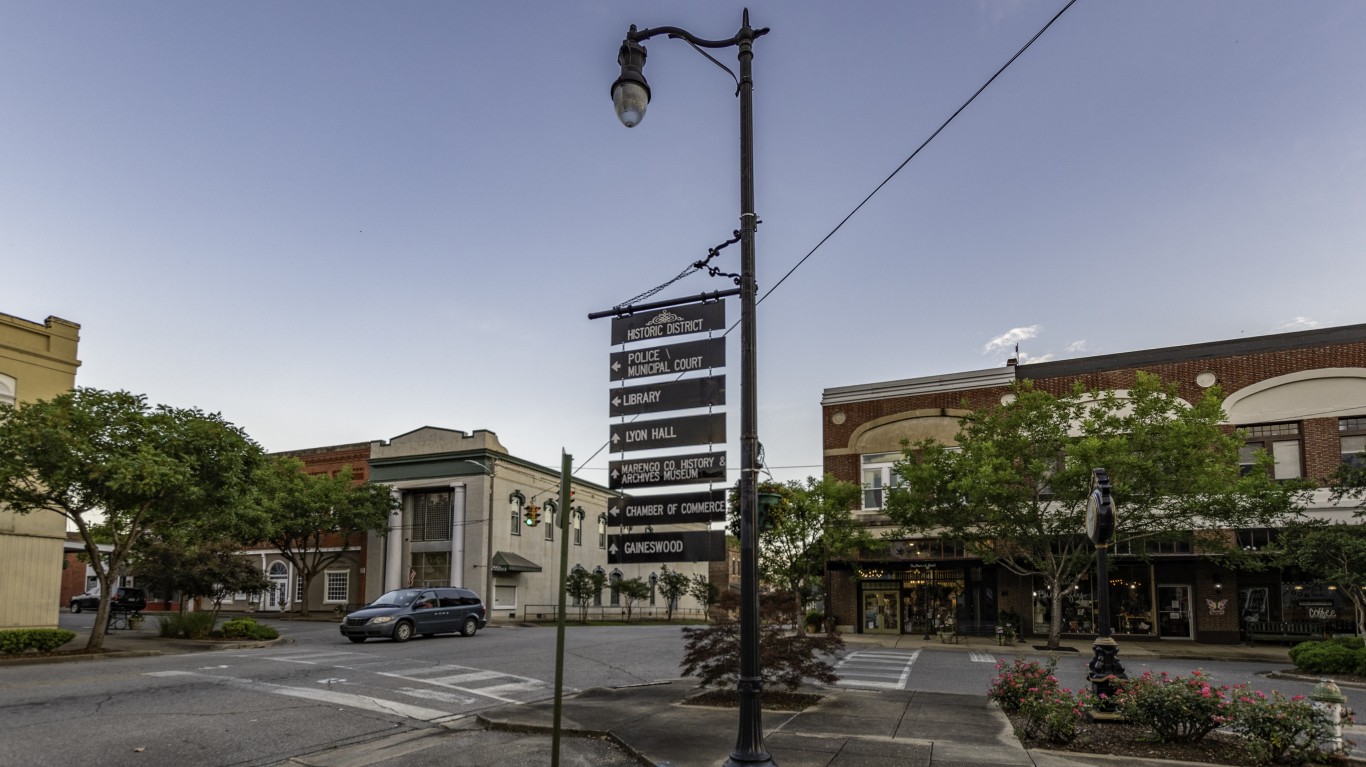
- Average popular vote split in last 4 presidential elections: 51.7% Democratic; 47.7% Republican
- Popular vote split in 2020 election: 50.3% Democrat (Joe Biden); 49.0% Republican (Donald Trump)
- Popular vote split in 2016 election: 51.1% Democrat (Hillary Clinton); 47.6% Republican (Donald Trump)
- Popular vote split in 2012 election: 53.5% Democrat (Barack Obama); 46.3% Republican (Mitt Romney)
- Popular vote split in 2008 election: 51.7% Democrat (Barack Obama); 48.1% Republican (John McCain)
- County population: 19,180
12. Russell County

- Average popular vote split in last 4 presidential elections: 52.8% Democratic; 46.0% Republican
- Popular vote split in 2020 election: 52.6% Democrat (Joe Biden); 46.2% Republican (Donald Trump)
- Popular vote split in 2016 election: 49.7% Democrat (Hillary Clinton); 47.8% Republican (Donald Trump)
- Popular vote split in 2012 election: 55.6% Democrat (Barack Obama); 43.8% Republican (Mitt Romney)
- Popular vote split in 2008 election: 53.3% Democrat (Barack Obama); 46.0% Republican (John McCain)
- County population: 58,849
11. Jefferson County
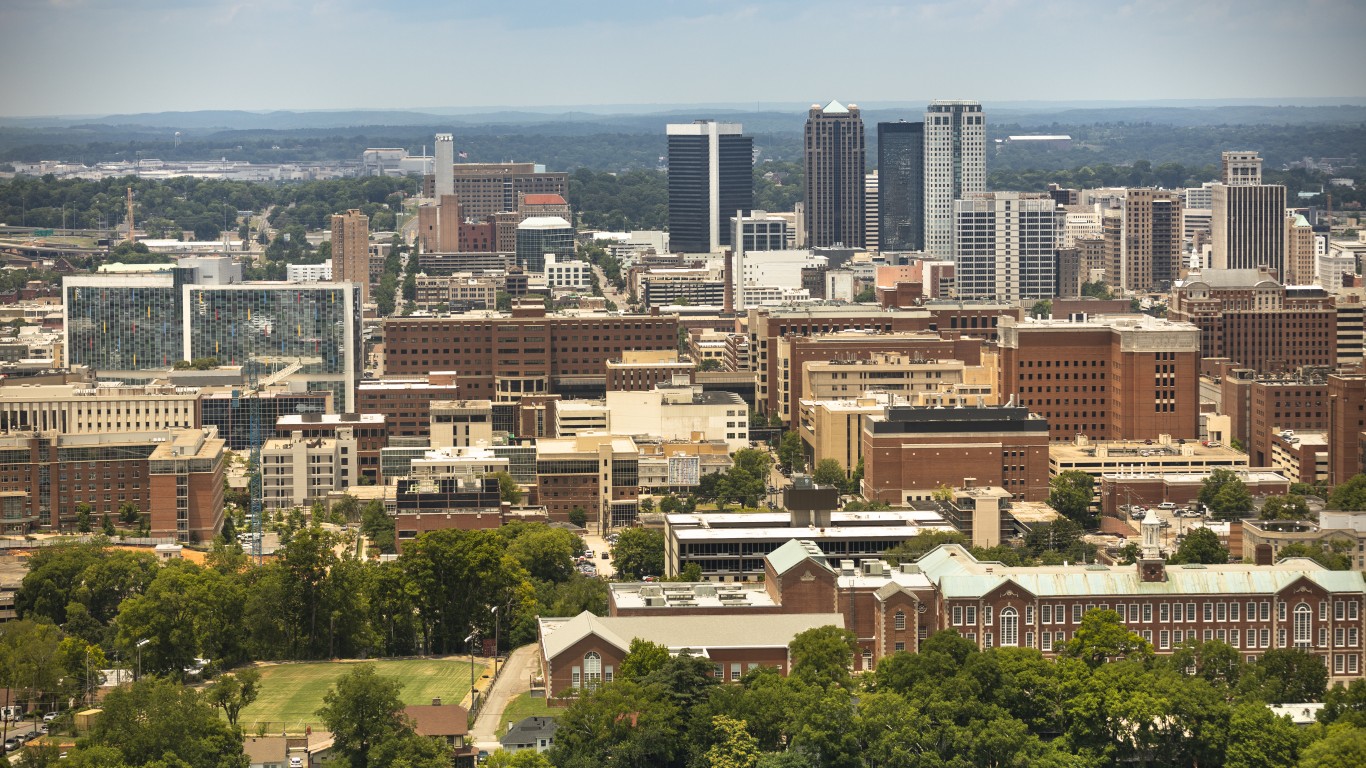
- Average popular vote split in last 4 presidential elections: 53.1% Democratic; 45.1% Republican
- Popular vote split in 2020 election: 55.8% Democrat (Joe Biden); 42.6% Republican (Donald Trump)
- Popular vote split in 2016 election: 51.6% Democrat (Hillary Clinton); 44.3% Republican (Donald Trump)
- Popular vote split in 2012 election: 52.6% Democrat (Barack Obama); 46.6% Republican (Mitt Romney)
- Popular vote split in 2008 election: 52.2% Democrat (Barack Obama); 47.1% Republican (John McCain)
- County population: 672,265
10. Hale County
- Average popular vote split in last 4 presidential elections: 60.5% Democratic; 39.0% Republican
- Popular vote split in 2020 election: 59.0% Democrat (Joe Biden); 40.4% Republican (Donald Trump)
- Popular vote split in 2016 election: 59.4% Democrat (Hillary Clinton); 39.5% Republican (Donald Trump)
- Popular vote split in 2012 election: 62.6% Democrat (Barack Obama); 37.1% Republican (Mitt Romney)
- Popular vote split in 2008 election: 60.7% Democrat (Barack Obama); 39.0% Republican (John McCain)
- County population: 14,742
9. Montgomery County
- Average popular vote split in last 4 presidential elections: 61.9% Democratic; 36.8% Republican
- Popular vote split in 2020 election: 65.1% Democrat (Joe Biden); 33.6% Republican (Donald Trump)
- Popular vote split in 2016 election: 61.4% Democrat (Hillary Clinton); 35.5% Republican (Donald Trump)
- Popular vote split in 2012 election: 61.9% Democrat (Barack Obama); 37.6% Republican (Mitt Romney)
- Popular vote split in 2008 election: 59.4% Democrat (Barack Obama); 40.1% Republican (John McCain)
- County population: 228,132
8. Dallas County
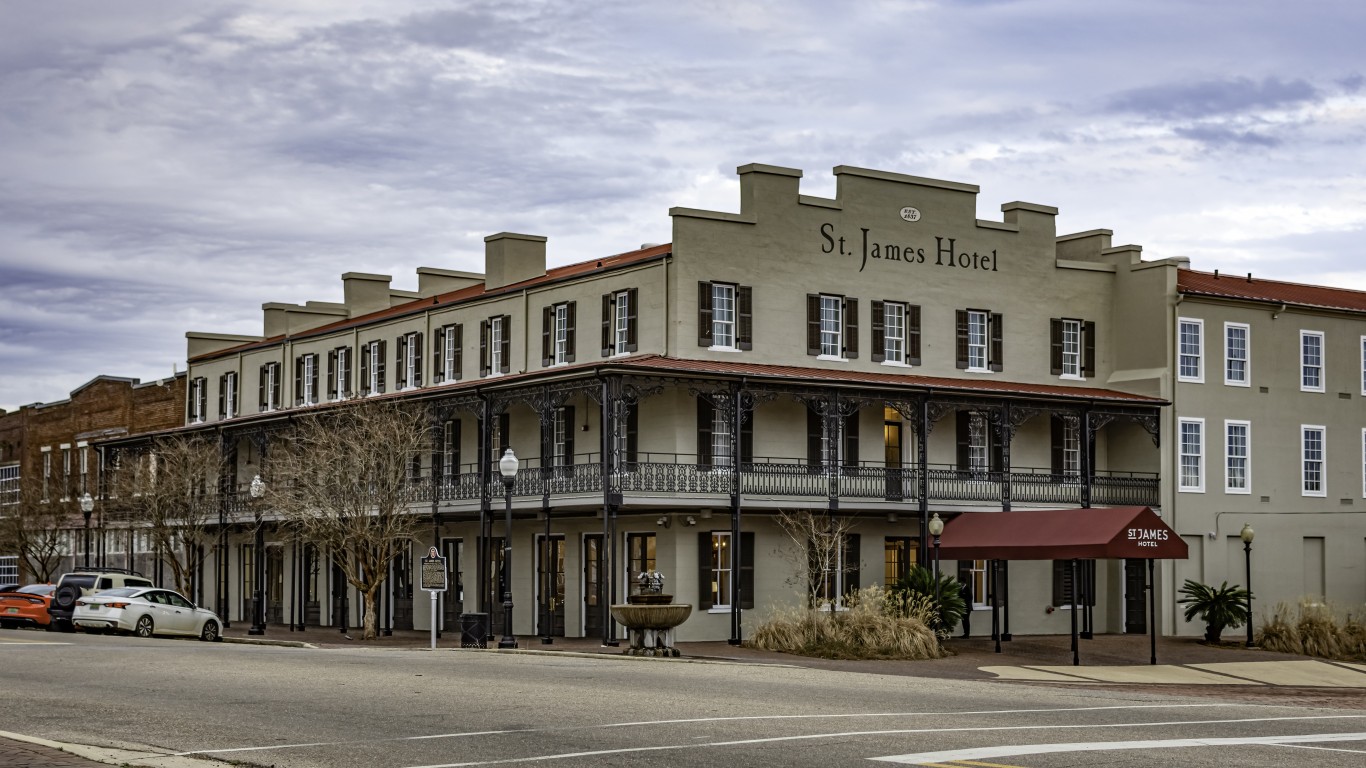
- Average popular vote split in last 4 presidential elections: 68.4% Democratic; 31.1% Republican
- Popular vote split in 2020 election: 68.5% Democrat (Joe Biden); 30.9% Republican (Donald Trump)
- Popular vote split in 2016 election: 68.3% Democrat (Hillary Clinton); 30.8% Republican (Donald Trump)
- Popular vote split in 2012 election: 69.7% Democrat (Barack Obama); 30.0% Republican (Mitt Romney)
- Popular vote split in 2008 election: 67.1% Democrat (Barack Obama); 32.6% Republican (John McCain)
- County population: 38,326
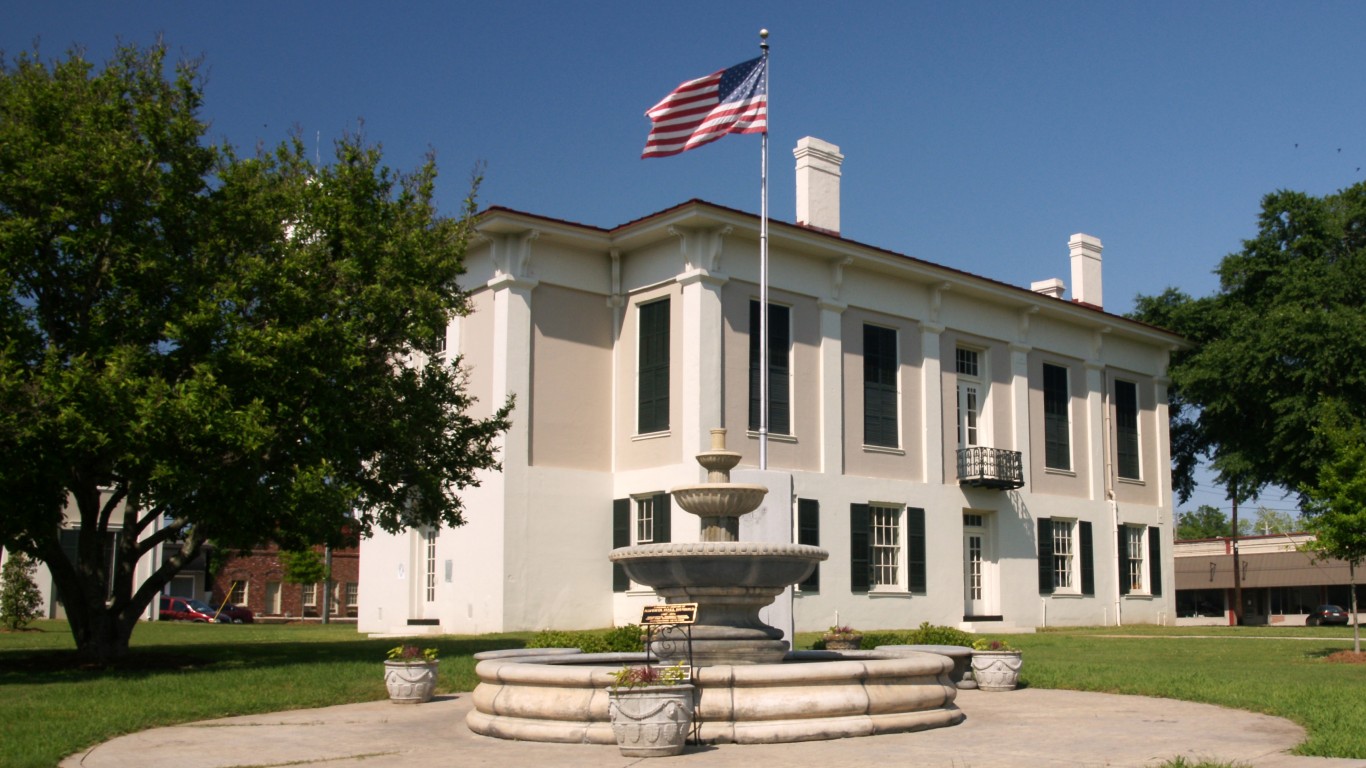
7. Wilcox County
- Average popular vote split in last 4 presidential elections: 71.3% Democratic; 28.4% Republican
- Popular vote split in 2020 election: 68.6% Democrat (Joe Biden); 31.1% Republican (Donald Trump)
- Popular vote split in 2016 election: 70.9% Democrat (Hillary Clinton); 28.4% Republican (Donald Trump)
- Popular vote split in 2012 election: 74.3% Democrat (Barack Obama); 25.6% Republican (Mitt Romney)
- Popular vote split in 2008 election: 71.0% Democrat (Barack Obama); 28.8% Republican (John McCain)
- County population: 10,441
6. Perry County
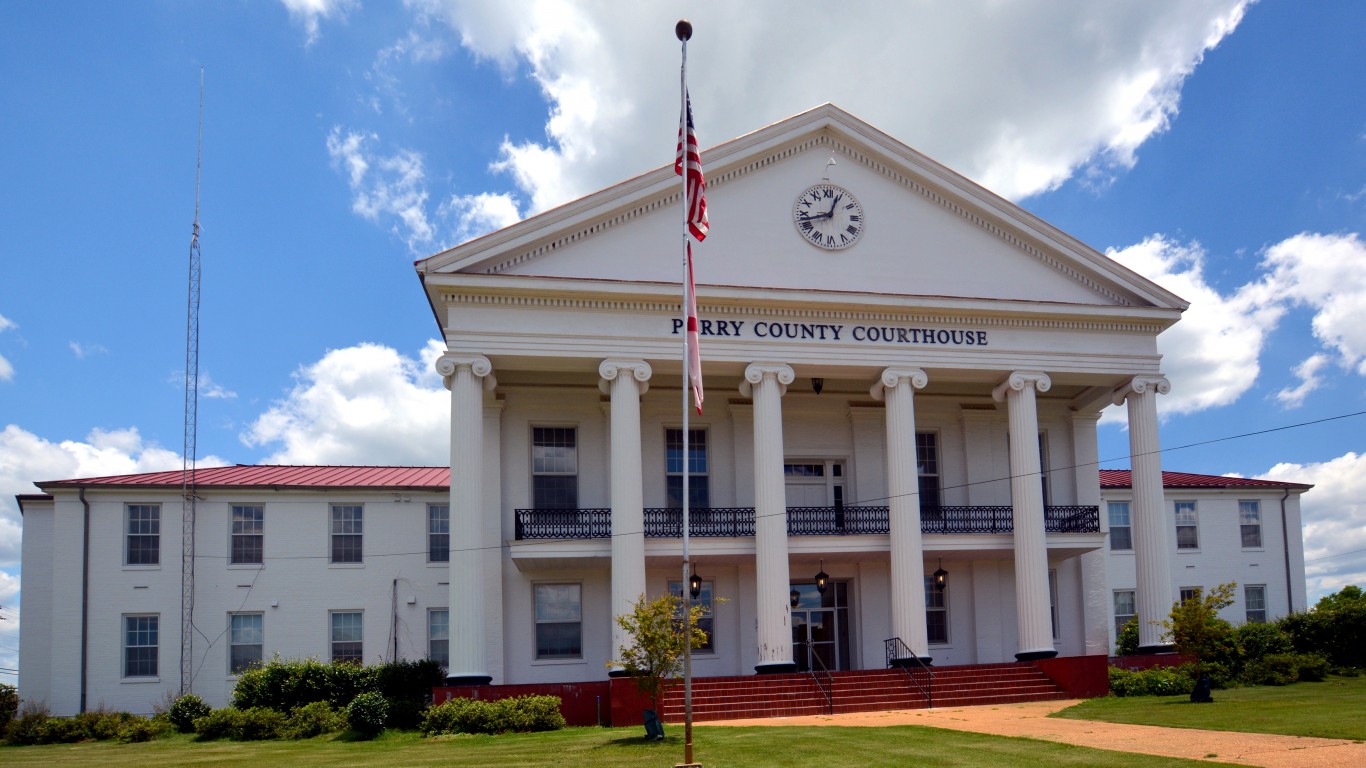
- Average popular vote split in last 4 presidential elections: 73.4% Democratic; 26.1% Republican
- Popular vote split in 2020 election: 73.8% Democrat (Joe Biden); 25.6% Republican (Donald Trump)
- Popular vote split in 2016 election: 72.5% Democrat (Hillary Clinton); 26.7% Republican (Donald Trump)
- Popular vote split in 2012 election: 74.9% Democrat (Barack Obama); 24.7% Republican (Mitt Romney)
- Popular vote split in 2008 election: 72.4% Democrat (Barack Obama); 27.3% Republican (John McCain)
- County population: 8,479
5. Lowndes County
- Average popular vote split in last 4 presidential elections: 74.3% Democratic; 25.3% Republican
- Popular vote split in 2020 election: 72.7% Democrat (Joe Biden); 26.9% Republican (Donald Trump)
- Popular vote split in 2016 election: 73.1% Democrat (Hillary Clinton); 26.2% Republican (Donald Trump)
- Popular vote split in 2012 election: 76.4% Democrat (Barack Obama); 23.3% Republican (Mitt Romney)
- Popular vote split in 2008 election: 74.9% Democrat (Barack Obama); 24.9% Republican (John McCain)
- County population: 10,153
4. Bullock County
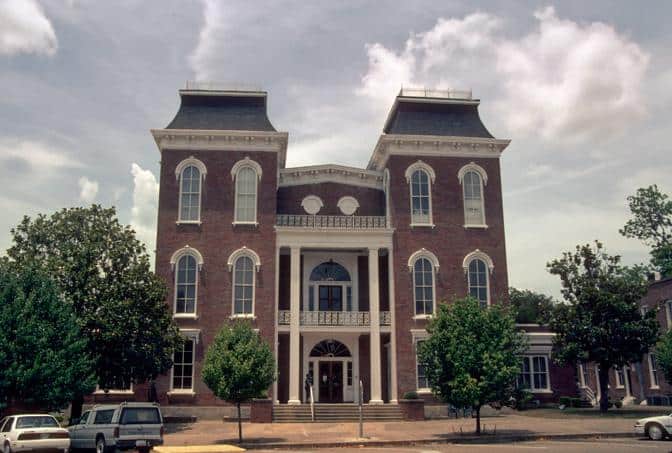
- Average popular vote split in last 4 presidential elections: 75.0% Democratic; 24.6% Republican
- Popular vote split in 2020 election: 74.7% Democrat (Joe Biden); 24.8% Republican (Donald Trump)
- Popular vote split in 2016 election: 74.9% Democrat (Hillary Clinton); 24.2% Republican (Donald Trump)
- Popular vote split in 2012 election: 76.3% Democrat (Barack Obama); 23.5% Republican (Mitt Romney)
- Popular vote split in 2008 election: 74.1% Democrat (Barack Obama); 25.7% Republican (John McCain)
- County population: 10,328
3. Sumter County

- Average popular vote split in last 4 presidential elections: 75.1% Democratic; 24.3% Republican
- Popular vote split in 2020 election: 73.9% Democrat (Joe Biden); 25.4% Republican (Donald Trump)
- Popular vote split in 2016 election: 74.0% Democrat (Hillary Clinton); 24.7% Republican (Donald Trump)
- Popular vote split in 2012 election: 77.1% Democrat (Barack Obama); 22.6% Republican (Mitt Romney)
- Popular vote split in 2008 election: 75.0% Democrat (Barack Obama); 24.7% Republican (John McCain)
- County population: 12,196
2. Greene County
- Average popular vote split in last 4 presidential elections: 82.9% Democratic; 16.7% Republican
- Popular vote split in 2020 election: 81.3% Democrat (Joe Biden); 18.3% Republican (Donald Trump)
- Popular vote split in 2016 election: 82.2% Democrat (Hillary Clinton); 17.2% Republican (Donald Trump)
- Popular vote split in 2012 election: 84.7% Democrat (Barack Obama); 15.1% Republican (Mitt Romney)
- Popular vote split in 2008 election: 83.1% Democrat (Barack Obama); 16.5% Republican (John McCain)
- County population: 7,706
1. Macon County
- Average popular vote split in last 4 presidential elections: 84.8% Democratic; 14.6% Republican
- Popular vote split in 2020 election: 81.5% Democrat (Joe Biden); 17.7% Republican (Donald Trump)
- Popular vote split in 2016 election: 82.8% Democrat (Hillary Clinton); 15.7% Republican (Donald Trump)
- Popular vote split in 2012 election: 87.0% Democrat (Barack Obama); 12.8% Republican (Mitt Romney)
- Popular vote split in 2008 election: 86.9% Democrat (Barack Obama); 12.8% Republican (John McCain)
- County population: 19,198
It’s Your Money, Your Future—Own It (sponsor)
Retirement can be daunting, but it doesn’t need to be.
Imagine having an expert in your corner to help you with your financial goals. Someone to help you determine if you’re ahead, behind, or right on track. With SmartAsset, that’s not just a dream—it’s reality. This free tool connects you with pre-screened financial advisors who work in your best interests. It’s quick, it’s easy, so take the leap today and start planning smarter!
Don’t waste another minute; get started right here and help your retirement dreams become a retirement reality.
Thank you for reading! Have some feedback for us?
Contact the 24/7 Wall St. editorial team.

Our expert who first called NVIDIA in 2009 is predicting 2025 will see a historic AI breakthrough.
You can follow him investing $500,000 of his own money on our top AI stocks for free.