24/7 Wall St. Insights
- This election cycle, Harris and Trump campaigns are focusing their resources on a handful of key swing-states, where the election will likely be decided.
- In most of the rest of the country, including Washington, the outcome of the race is effectively predetermined.
- However, Washington’s status as a blue state is an oversimplification that belies a much more nuanced reality.
- Also: 2 Dividend Legends to Hold Forever
The 2024 presidential race will likely be decided by voters in seven closely contested swing states where both major party candidates have a reasonable chance of winning. In most of the 43 remaining states, however, the outcome on Election Day is far more predictable. So-called blue states, like Massachusetts and Vermont, are places that Kamala Harris, a Democrat, can reliably count on taking in November. Meanwhile, Donald Trump, the Republican candidate, is expected to handily win red states like Idaho and Wyoming. (This is how Trump and Harris are polling in every key swing state.)
These and other non-swing states are often seen as political monoliths, home to populations of like-minded voters with similar values and priorities. This, however, is an oversimplification that belies a much more nuanced reality.
In Washington, which has long been a blue state, an average of 56.2% of voters have supported the Democratic candidate across the last four presidential elections. In fact, Washington has gone to the Democratic candidate in every presidential election since 1984, when Ronald Reagan, the GOP’s candidate, defeated Democrat Walter Mondale. Barring any major, unforeseen shakeup, Washington state is expected to align with historical voting patterns once again in 2024 and go to Harris. (Here is a look at the 15 least popular presidents, according to Millennials.)
Despite its status as a Democratic stronghold, there are several parts of the state that have consistently broken with the prevailing political ideology in recent elections. According to voting records, there are 23 counties in Washington where an average of at least 50% of voters have supported the Republican candidate in the last four presidential elections. In one of these counties, more than 70% of voters cast ballots for the Republican candidate over the same four general elections.
These are the most Republican counties in Washington. All historical, county-level, voting statistics are from the MIT Election Data and Science Lab’s County Presidential Election Returns 2000-2020 database, as compiled in the Harvard Dataverse, V13.
Why It Matters

Because of the electoral college system, the outcome of presidential elections often comes down to voters in just a handful of closely contested states. In contrast to these battleground states, most of the country has reliably voted either Democratic or Republican in recent presidential elections. These states include Washington, which, barring any unforeseen shake ups in the race, is all but guaranteed to go to Harris in 2024. Still, Washington is not the partisan monolith it is often perceived to be.
23. Spokane County
- Average popular vote split in last 4 presidential elections: 45.3% Democratic; 50.3% Republican
- Popular vote split in 2020 election: 46.0% Democrat (Joe Biden); 50.3% Republican (Donald Trump)
- Popular vote split in 2016 election: 41.3% Democrat (Hillary Clinton); 49.9% Republican (Donald Trump)
- Popular vote split in 2012 election: 45.7% Democrat (Barack Obama); 51.5% Republican (Mitt Romney)
- Popular vote split in 2008 election: 48.2% Democrat (Barack Obama); 49.3% Republican (John McCain)
- County population: 538,711
22. Skamania County
- Average popular vote split in last 4 presidential elections: 45.5% Democratic; 50.3% Republican
- Popular vote split in 2020 election: 43.7% Democrat (Joe Biden); 53.1% Republican (Donald Trump)
- Popular vote split in 2016 election: 39.6% Democrat (Hillary Clinton); 51.9% Republican (Donald Trump)
- Popular vote split in 2012 election: 48.1% Democrat (Barack Obama); 49.2% Republican (Mitt Romney)
- Popular vote split in 2008 election: 51.3% Democrat (Barack Obama); 46.0% Republican (John McCain)
- County population: 12,118
21. Cowlitz County
- Average popular vote split in last 4 presidential elections: 45.5% Democratic; 50.5% Republican
- Popular vote split in 2020 election: 39.7% Democrat (Joe Biden); 57.1% Republican (Donald Trump)
- Popular vote split in 2016 election: 39.2% Democrat (Hillary Clinton); 52.9% Republican (Donald Trump)
- Popular vote split in 2012 election: 50.9% Democrat (Barack Obama); 46.5% Republican (Mitt Romney)
- Popular vote split in 2008 election: 54.4% Democrat (Barack Obama); 43.2% Republican (John McCain)
- County population: 110,621
20. Klickitat County
- Average popular vote split in last 4 presidential elections: 44.0% Democratic; 52.0% Republican
- Popular vote split in 2020 election: 43.9% Democrat (Joe Biden); 53.4% Republican (Donald Trump)
- Popular vote split in 2016 election: 38.9% Democrat (Hillary Clinton); 53.8% Republican (Donald Trump)
- Popular vote split in 2012 election: 44.8% Democrat (Barack Obama); 51.7% Republican (Mitt Romney)
- Popular vote split in 2008 election: 48.8% Democrat (Barack Obama); 48.6% Republican (John McCain)
- County population: 22,798
19. Kittitas County

- Average popular vote split in last 4 presidential elections: 42.9% Democratic; 53.4% Republican
- Popular vote split in 2020 election: 43.3% Democrat (Joe Biden); 53.5% Republican (Donald Trump)
- Popular vote split in 2016 election: 39.5% Democrat (Hillary Clinton); 53.3% Republican (Donald Trump)
- Popular vote split in 2012 election: 43.7% Democrat (Barack Obama); 53.8% Republican (Mitt Romney)
- Popular vote split in 2008 election: 44.9% Democrat (Barack Obama); 53.0% Republican (John McCain)
- County population: 44,424
18. Wahkiakum County
- Average popular vote split in last 4 presidential elections: 42.4% Democratic; 53.5% Republican
- Popular vote split in 2020 election: 39.1% Democrat (Joe Biden); 58.4% Republican (Donald Trump)
- Popular vote split in 2016 election: 35.3% Democrat (Hillary Clinton); 57.0% Republican (Donald Trump)
- Popular vote split in 2012 election: 47.7% Democrat (Barack Obama); 48.8% Republican (Mitt Romney)
- Popular vote split in 2008 election: 48.9% Democrat (Barack Obama); 48.2% Republican (John McCain)
- County population: 4,476
17. Yakima County
- Average popular vote split in last 4 presidential elections: 43.1% Democratic; 53.8% Republican
- Popular vote split in 2020 election: 44.9% Democrat (Joe Biden); 52.6% Republican (Donald Trump)
- Popular vote split in 2016 election: 40.2% Democrat (Hillary Clinton); 53.7% Republican (Donald Trump)
- Popular vote split in 2012 election: 43.2% Democrat (Barack Obama); 54.9% Republican (Mitt Romney)
- Popular vote split in 2008 election: 43.9% Democrat (Barack Obama); 54.4% Republican (John McCain)
- County population: 256,143
16. Chelan County
- Average popular vote split in last 4 presidential elections: 42.1% Democratic; 54.6% Republican
- Popular vote split in 2020 election: 44.7% Democrat (Joe Biden); 52.5% Republican (Donald Trump)
- Popular vote split in 2016 election: 39.0% Democrat (Hillary Clinton); 54.3% Republican (Donald Trump)
- Popular vote split in 2012 election: 40.7% Democrat (Barack Obama); 57.1% Republican (Mitt Romney)
- Popular vote split in 2008 election: 43.1% Democrat (Barack Obama); 55.1% Republican (John McCain)
- County population: 79,076
15. Okanogan County
- Average popular vote split in last 4 presidential elections: 41.5% Democratic; 54.8% Republican
- Popular vote split in 2020 election: 41.8% Democrat (Joe Biden); 55.6% Republican (Donald Trump)
- Popular vote split in 2016 election: 36.8% Democrat (Hillary Clinton); 56.2% Republican (Donald Trump)
- Popular vote split in 2012 election: 42.2% Democrat (Barack Obama); 54.7% Republican (Mitt Romney)
- Popular vote split in 2008 election: 45.1% Democrat (Barack Obama); 52.2% Republican (John McCain)
- County population: 42,336
14. Walla Walla County
- Average popular vote split in last 4 presidential elections: 40.6% Democratic; 55.3% Republican
- Popular vote split in 2020 election: 43.8% Democrat (Joe Biden); 52.5% Republican (Donald Trump)
- Popular vote split in 2016 election: 38.1% Democrat (Hillary Clinton); 53.7% Republican (Donald Trump)
- Popular vote split in 2012 election: 38.9% Democrat (Barack Obama); 58.3% Republican (Mitt Romney)
- Popular vote split in 2008 election: 40.8% Democrat (Barack Obama); 57.4% Republican (John McCain)
- County population: 62,150
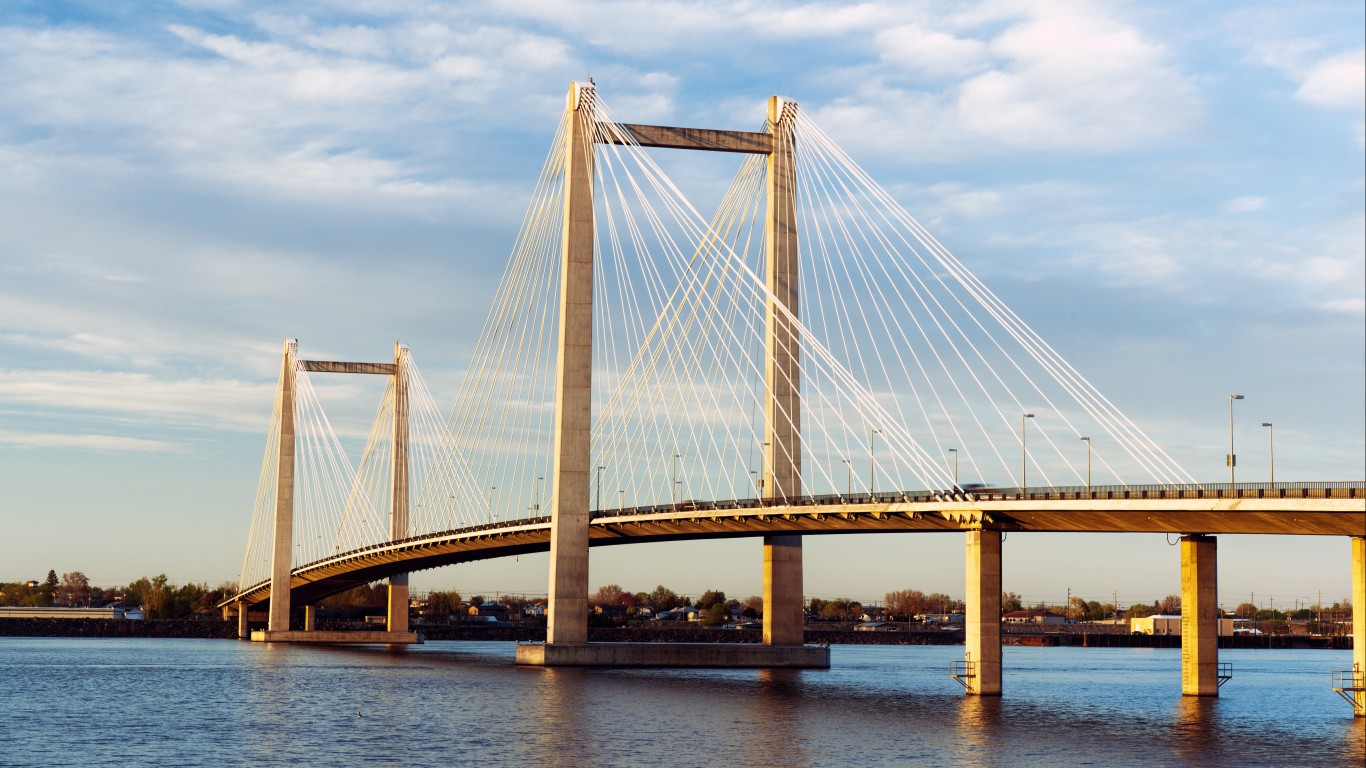
13. Franklin County
- Average popular vote split in last 4 presidential elections: 38.6% Democratic; 57.9% Republican
- Popular vote split in 2020 election: 41.2% Democrat (Joe Biden); 55.7% Republican (Donald Trump)
- Popular vote split in 2016 election: 37.5% Democrat (Hillary Clinton); 55.7% Republican (Donald Trump)
- Popular vote split in 2012 election: 37.1% Democrat (Barack Obama); 60.7% Republican (Mitt Romney)
- Popular vote split in 2008 election: 37.4% Democrat (Barack Obama); 61.1% Republican (John McCain)
- County population: 96,692
12. Asotin County
- Average popular vote split in last 4 presidential elections: 37.5% Democratic; 58.4% Republican
- Popular vote split in 2020 election: 35.6% Democrat (Joe Biden); 61.2% Republican (Donald Trump)
- Popular vote split in 2016 election: 32.2% Democrat (Hillary Clinton); 59.0% Republican (Donald Trump)
- Popular vote split in 2012 election: 40.4% Democrat (Barack Obama); 57.1% Republican (Mitt Romney)
- Popular vote split in 2008 election: 42.3% Democrat (Barack Obama); 55.7% Republican (John McCain)
- County population: 22,370
11. Ferry County
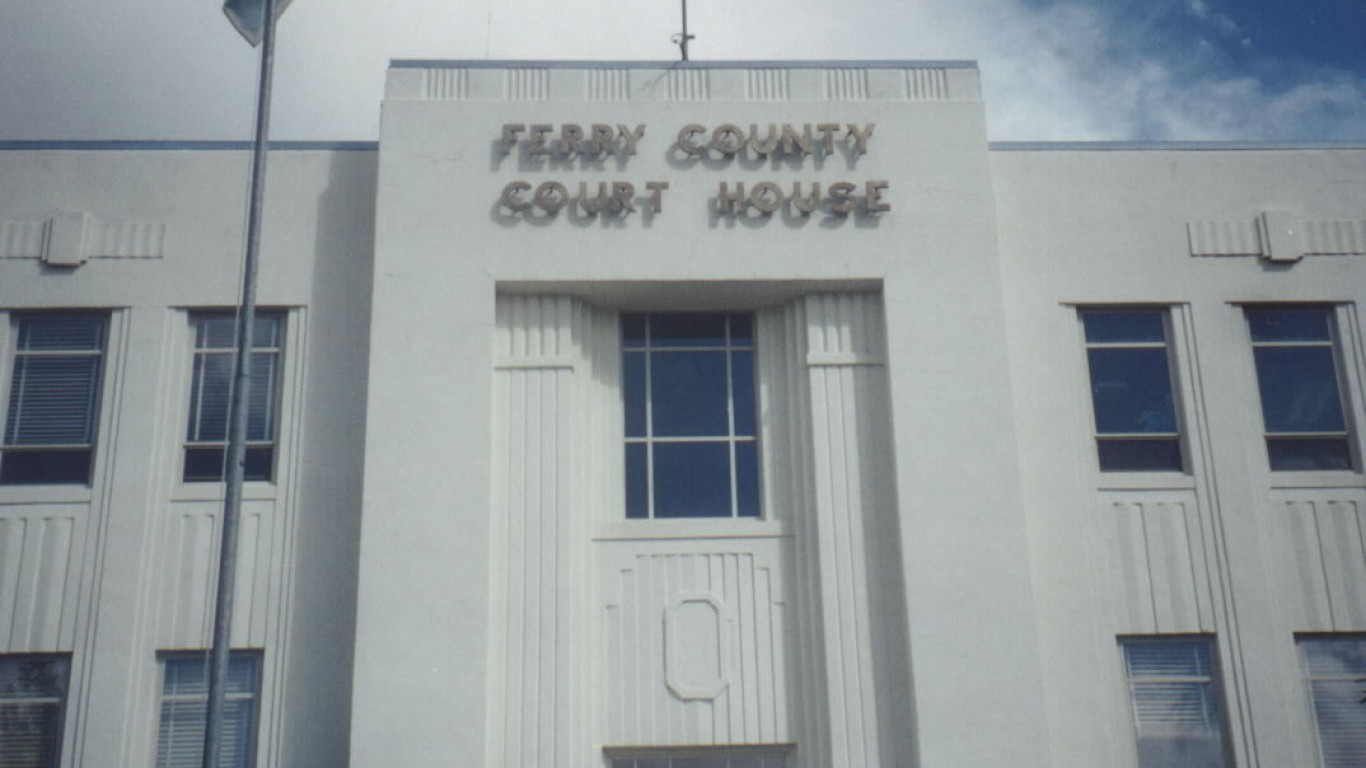
- Average popular vote split in last 4 presidential elections: 35.9% Democratic; 59.6% Republican
- Popular vote split in 2020 election: 34.0% Democrat (Joe Biden); 63.5% Republican (Donald Trump)
- Popular vote split in 2016 election: 30.5% Democrat (Hillary Clinton); 61.1% Republican (Donald Trump)
- Popular vote split in 2012 election: 37.6% Democrat (Barack Obama); 58.0% Republican (Mitt Romney)
- Popular vote split in 2008 election: 41.9% Democrat (Barack Obama); 54.7% Republican (John McCain)
- County population: 7,260
10. Benton County
- Average popular vote split in last 4 presidential elections: 35.6% Democratic; 60.3% Republican
- Popular vote split in 2020 election: 37.6% Democrat (Joe Biden); 58.6% Republican (Donald Trump)
- Popular vote split in 2016 election: 32.9% Democrat (Hillary Clinton); 59.0% Republican (Donald Trump)
- Popular vote split in 2012 election: 35.4% Democrat (Barack Obama); 62.2% Republican (Mitt Romney)
- Popular vote split in 2008 election: 36.1% Democrat (Barack Obama); 62.2% Republican (John McCain)
- County population: 207,560
9. Douglas County

- Average popular vote split in last 4 presidential elections: 35.4% Democratic; 61.3% Republican
- Popular vote split in 2020 election: 36.7% Democrat (Joe Biden); 60.8% Republican (Donald Trump)
- Popular vote split in 2016 election: 31.6% Democrat (Hillary Clinton); 61.8% Republican (Donald Trump)
- Popular vote split in 2012 election: 34.6% Democrat (Barack Obama); 63.1% Republican (Mitt Romney)
- Popular vote split in 2008 election: 38.5% Democrat (Barack Obama); 59.8% Republican (John McCain)
- County population: 43,189
8. Lewis County
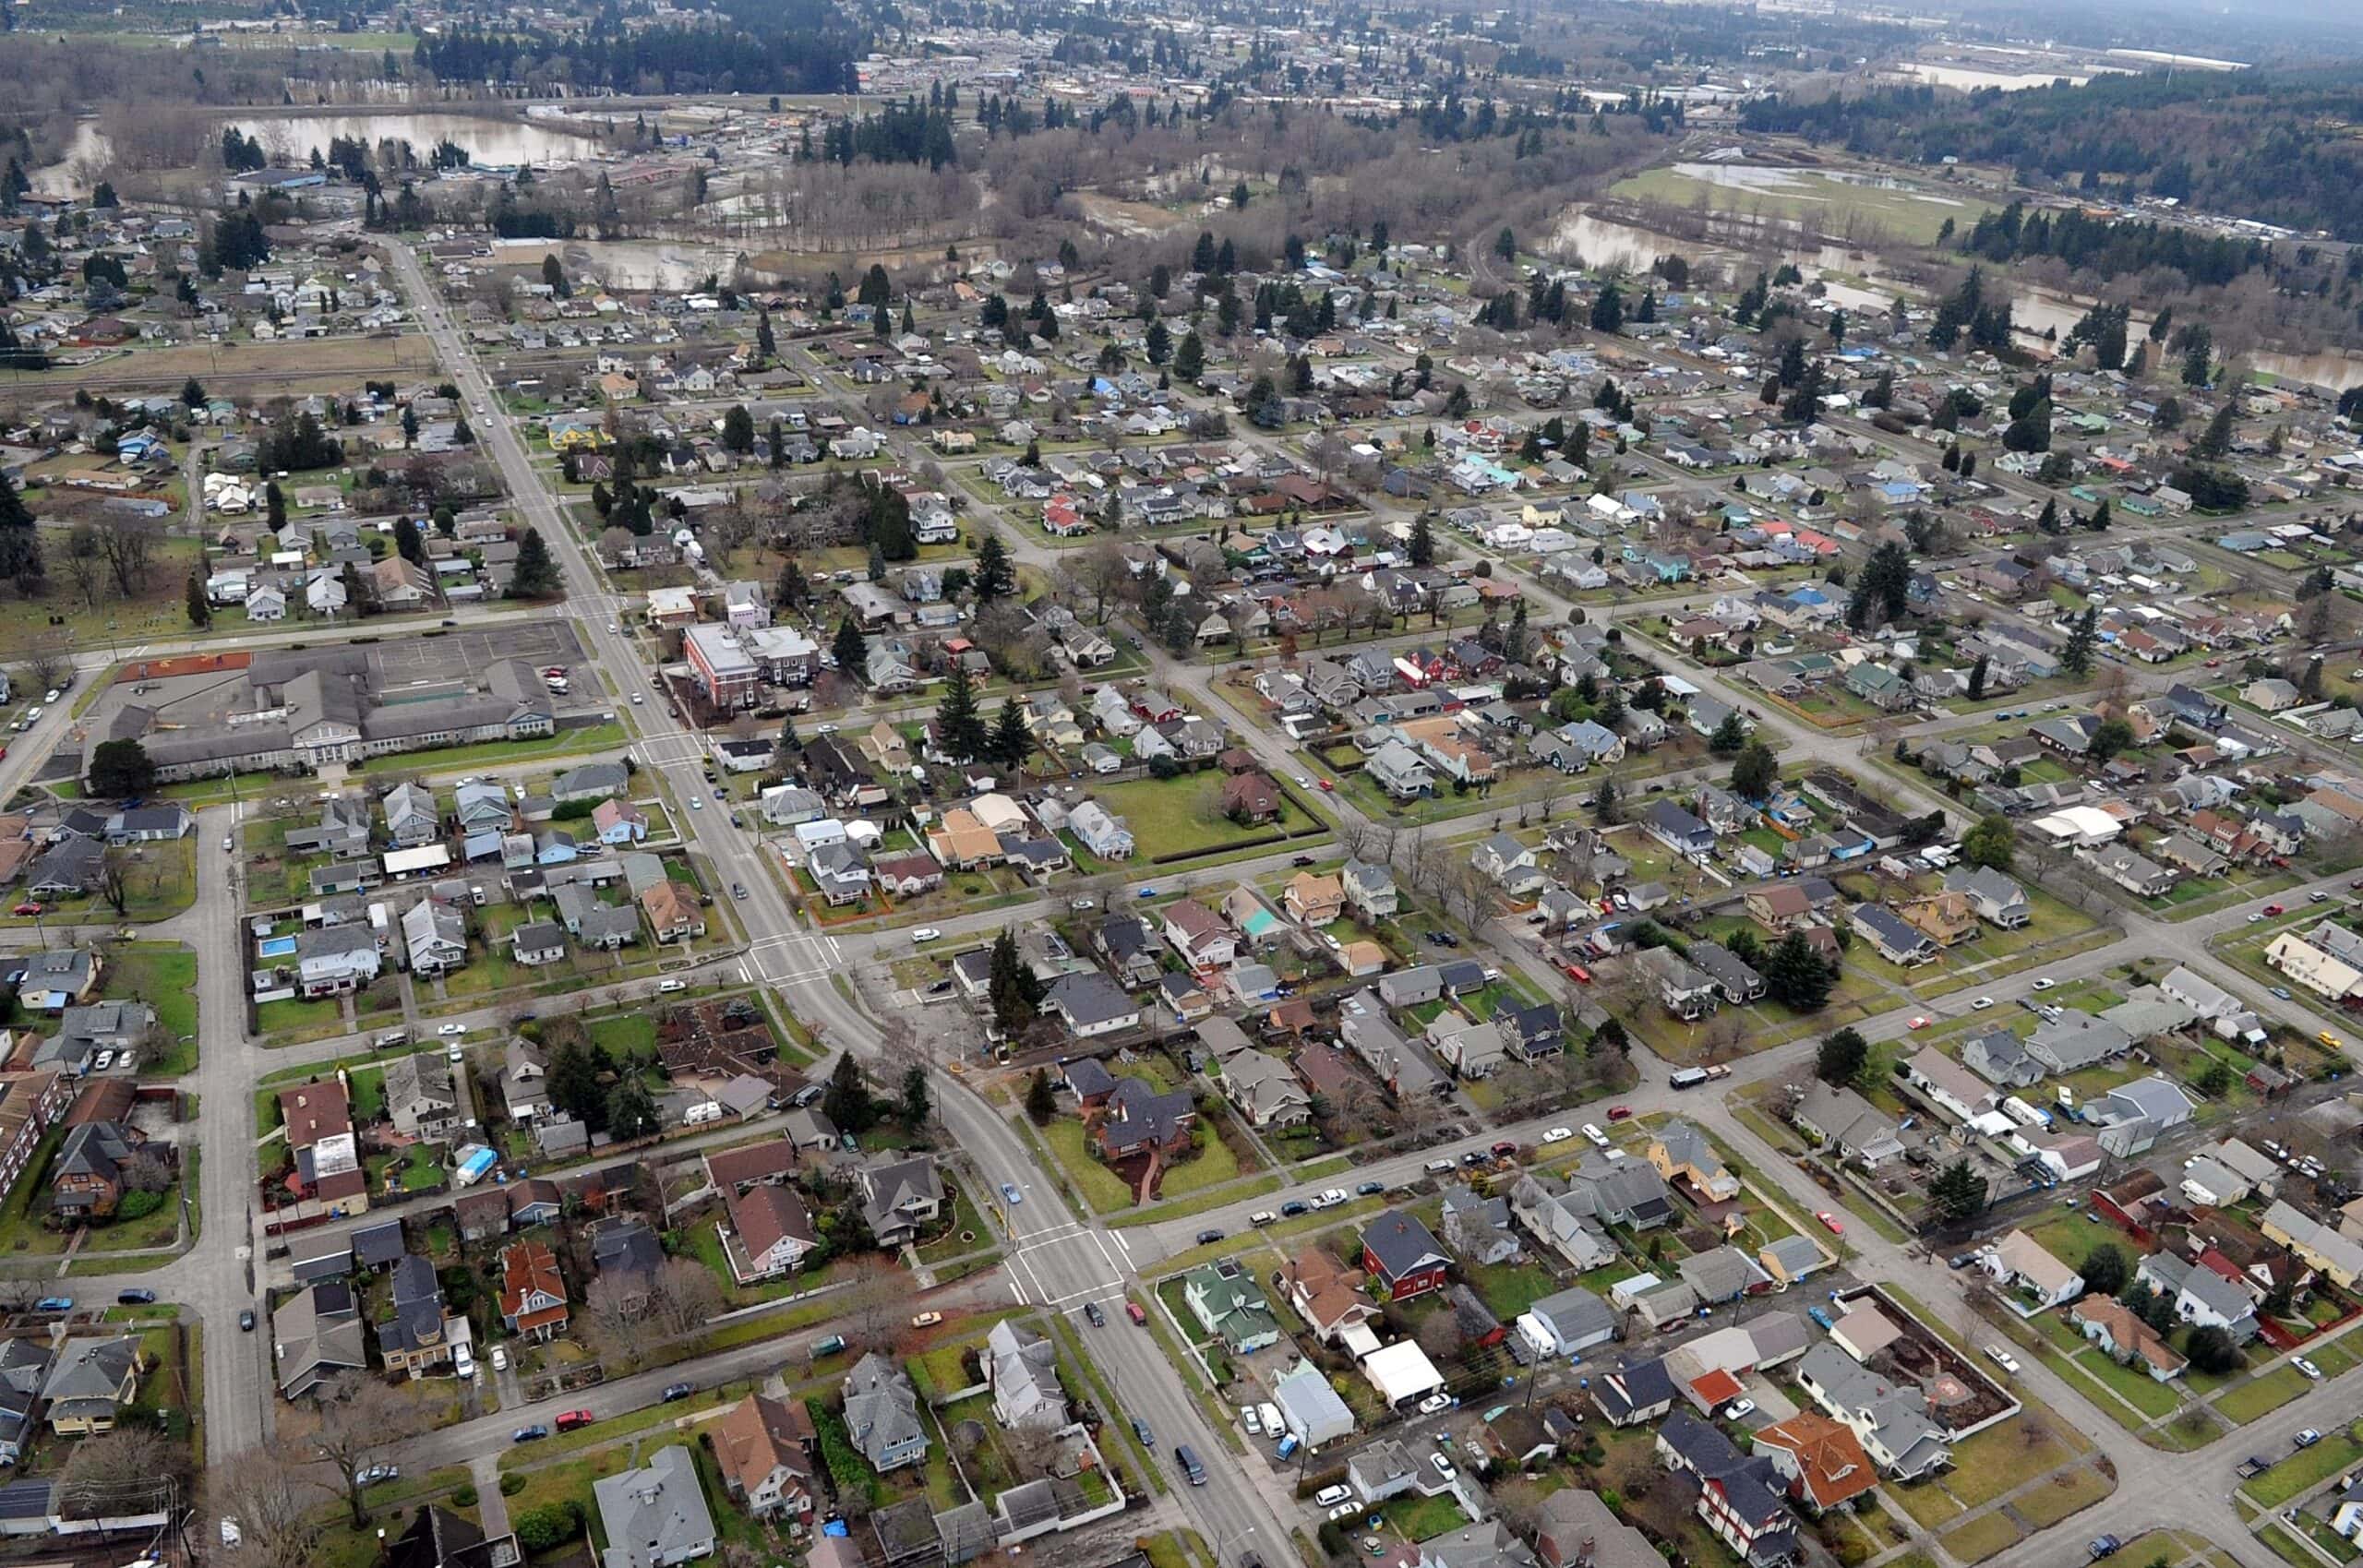
- Average popular vote split in last 4 presidential elections: 34.0% Democratic; 62.2% Republican
- Popular vote split in 2020 election: 32.0% Democrat (Joe Biden); 64.9% Republican (Donald Trump)
- Popular vote split in 2016 election: 28.3% Democrat (Hillary Clinton); 64.4% Republican (Donald Trump)
- Popular vote split in 2012 election: 37.2% Democrat (Barack Obama); 60.1% Republican (Mitt Romney)
- Popular vote split in 2008 election: 39.3% Democrat (Barack Obama); 58.4% Republican (John McCain)
- County population: 82,663
7. Pend Oreille County

- Average popular vote split in last 4 presidential elections: 33.6% Democratic; 62.2% Republican
- Popular vote split in 2020 election: 30.3% Democrat (Joe Biden); 67.0% Republican (Donald Trump)
- Popular vote split in 2016 election: 28.4% Democrat (Hillary Clinton); 64.3% Republican (Donald Trump)
- Popular vote split in 2012 election: 37.6% Democrat (Barack Obama); 59.3% Republican (Mitt Romney)
- Popular vote split in 2008 election: 39.1% Democrat (Barack Obama); 56.7% Republican (John McCain)
- County population: 13,570
6. Stevens County

- Average popular vote split in last 4 presidential elections: 31.2% Democratic; 64.6% Republican
- Popular vote split in 2020 election: 27.6% Democrat (Joe Biden); 69.7% Republican (Donald Trump)
- Popular vote split in 2016 election: 25.4% Democrat (Hillary Clinton); 66.9% Republican (Donald Trump)
- Popular vote split in 2012 election: 35.0% Democrat (Barack Obama); 61.8% Republican (Mitt Romney)
- Popular vote split in 2008 election: 38.0% Democrat (Barack Obama); 58.8% Republican (John McCain)
- County population: 46,774
5. Grant County
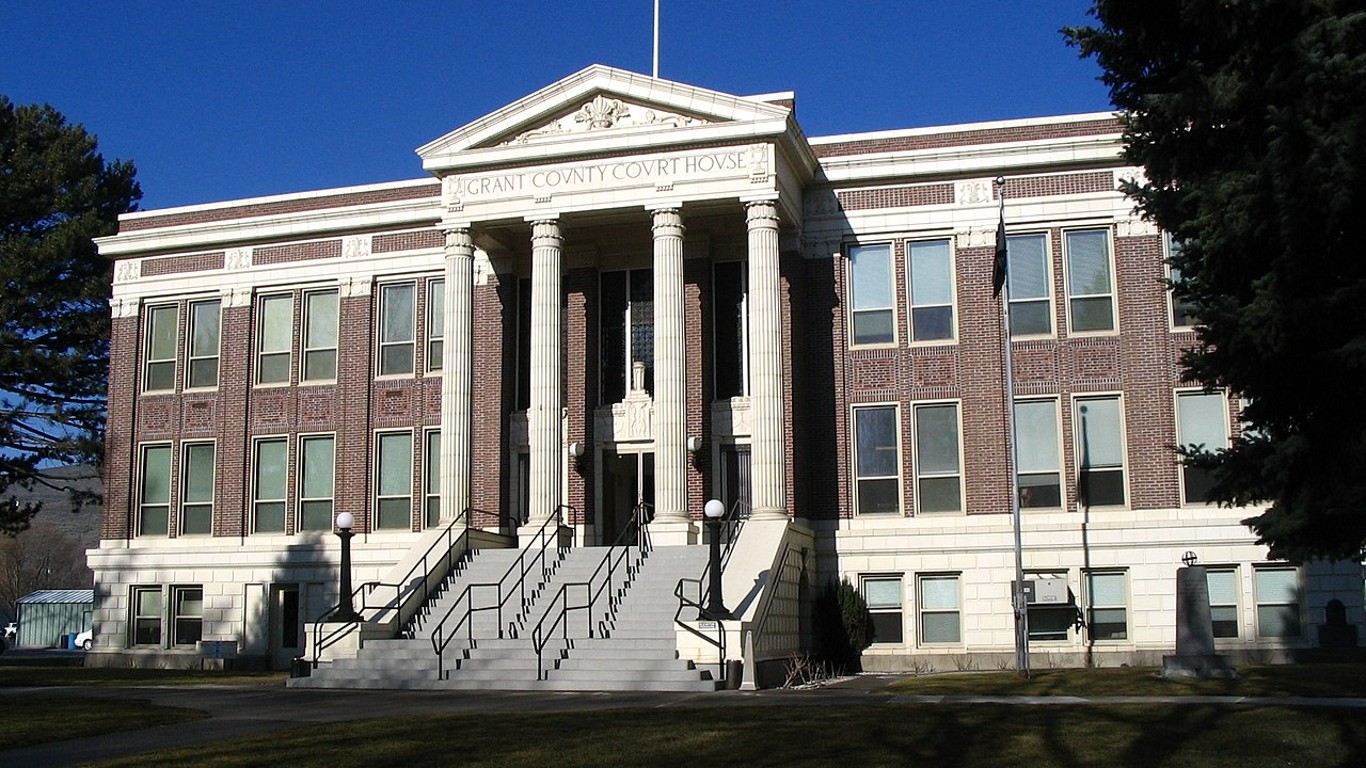
- Average popular vote split in last 4 presidential elections: 31.5% Democratic; 64.7% Republican
- Popular vote split in 2020 election: 31.4% Democrat (Joe Biden); 65.7% Republican (Donald Trump)
- Popular vote split in 2016 election: 27.6% Democrat (Hillary Clinton); 65.3% Republican (Donald Trump)
- Popular vote split in 2012 election: 32.5% Democrat (Barack Obama); 64.8% Republican (Mitt Romney)
- Popular vote split in 2008 election: 35.0% Democrat (Barack Obama); 62.5% Republican (John McCain)
- County population: 99,145
4. Adams County

- Average popular vote split in last 4 presidential elections: 30.8% Democratic; 66.4% Republican
- Popular vote split in 2020 election: 30.9% Democrat (Joe Biden); 66.6% Republican (Donald Trump)
- Popular vote split in 2016 election: 28.0% Democrat (Hillary Clinton); 66.4% Republican (Donald Trump)
- Popular vote split in 2012 election: 32.1% Democrat (Barack Obama); 66.2% Republican (Mitt Romney)
- Popular vote split in 2008 election: 31.9% Democrat (Barack Obama); 66.3% Republican (John McCain)
- County population: 20,557
3. Columbia County
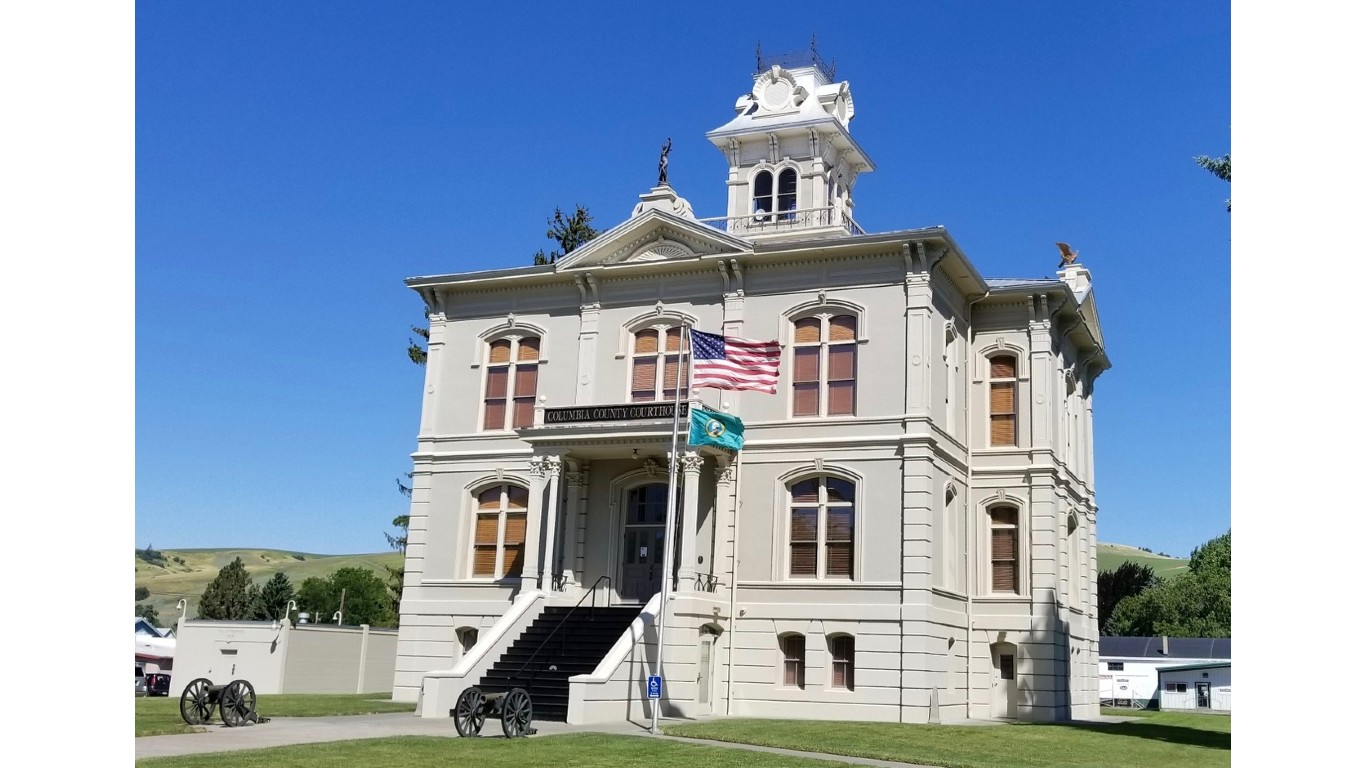
- Average popular vote split in last 4 presidential elections: 27.6% Democratic; 68.9% Republican
- Popular vote split in 2020 election: 26.8% Democrat (Joe Biden); 70.3% Republican (Donald Trump)
- Popular vote split in 2016 election: 24.1% Democrat (Hillary Clinton); 68.6% Republican (Donald Trump)
- Popular vote split in 2012 election: 28.6% Democrat (Barack Obama); 69.4% Republican (Mitt Romney)
- Popular vote split in 2008 election: 30.8% Democrat (Barack Obama); 67.3% Republican (John McCain)
- County population: 3,980
2. Lincoln County

- Average popular vote split in last 4 presidential elections: 27.1% Democratic; 69.6% Republican
- Popular vote split in 2020 election: 24.4% Democrat (Joe Biden); 73.2% Republican (Donald Trump)
- Popular vote split in 2016 election: 21.8% Democrat (Hillary Clinton); 71.9% Republican (Donald Trump)
- Popular vote split in 2012 election: 28.5% Democrat (Barack Obama); 69.2% Republican (Mitt Romney)
- Popular vote split in 2008 election: 34.0% Democrat (Barack Obama); 63.6% Republican (John McCain)
- County population: 11,036
1. Garfield County

- Average popular vote split in last 4 presidential elections: 25.4% Democratic; 70.6% Republican
- Popular vote split in 2020 election: 24.6% Democrat (Joe Biden); 71.8% Republican (Donald Trump)
- Popular vote split in 2016 election: 22.4% Democrat (Hillary Clinton); 68.3% Republican (Donald Trump)
- Popular vote split in 2012 election: 26.3% Democrat (Barack Obama); 71.4% Republican (Mitt Romney)
- Popular vote split in 2008 election: 28.0% Democrat (Barack Obama); 70.5% Republican (John McCain)
- County population: 2,310
The Average American Has No Idea How Much Money You Can Make Today (Sponsor)
The last few years made people forget how much banks and CD’s can pay. Meanwhile, interest rates have spiked and many can afford to pay you much more, but most are keeping yields low and hoping you won’t notice.
But there is good news. To win qualified customers, some accounts are paying almost 10x the national average! That’s an incredible way to keep your money safe and earn more at the same time. Our top pick for high yield savings accounts includes other benefits as well. You can earn up to 3.80% with a Checking & Savings Account today Sign up and get up to $300 with direct deposit. No account fees. FDIC Insured.
Click here to see how much more you could be earning on your savings today. It takes just a few minutes to open an account to make your money work for you.
Our top pick for high yield savings accounts includes other benefits as well. You can earn up to 4.00% with a Checking & Savings Account from Sofi. Sign up and get up to $300 with direct deposit. No account fees. FDIC Insured.
Thank you for reading! Have some feedback for us?
Contact the 24/7 Wall St. editorial team.

Our expert who first called NVIDIA in 2009 is predicting 2025 will see a historic AI breakthrough.
You can follow him investing $500,000 of his own money on our top AI stocks for free.