24/7 Wall St. Insights
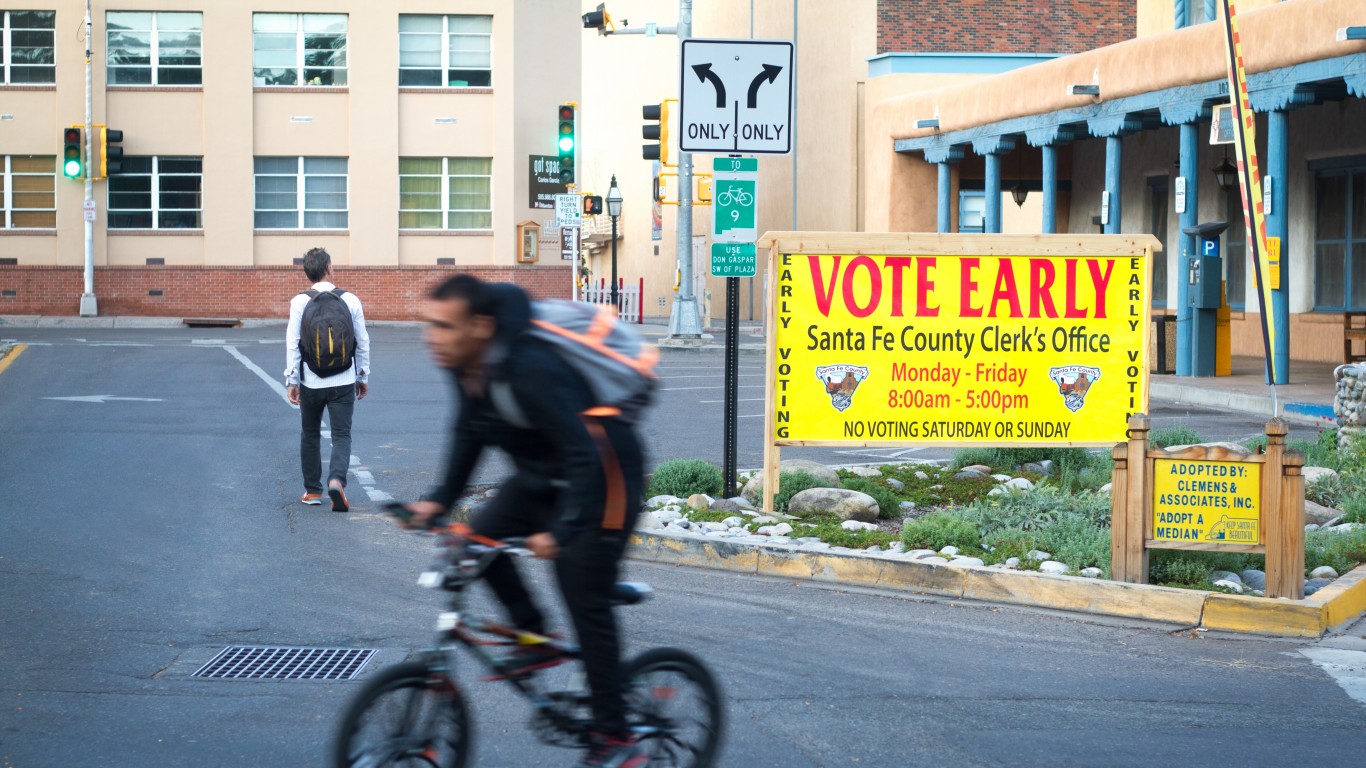
- This election cycle, Harris and Trump campaigns are focusing their resources on a handful of key swing-states, where the election will likely be decided.
- In most of the rest of the country, including New Mexico, the outcome of the race is widely seen as predetermined.
- However, New Mexico’s status as a blue state is an oversimplification that belies a much more nuanced reality.
- Also: 2 Dividend Legends to Hold Forever
The 2024 presidential race will likely be decided by voters in seven closely contested swing-states, places where both major party candidates have a reasonable chance of winning. In most of the 43 remaining states, however, the outcome on Election Day is far more predictable.
So-called blue states, like Massachusetts and Vermont, are places that Kamala Harris, a Democrat, can reliably count on taking in November. Meanwhile, Donald Trump, the Republican candidate, is expected to handily win red states like Idaho and Wyoming. (This is how Trump and Harris are polling in every key swing state.)
These and other non-swing states are often seen as political monoliths, home to populations of like-minded voters with similar values and priorities. This, however, is an oversimplification that belies a much more nuanced reality.
In New Mexico, now considered a blue state, an average of 53.2% of voters have supported the Democratic candidate across the last four presidential elections. In fact, New Mexico has gone to the Democratic candidate in every presidential election since 2004, when George W. Bush, the GOP candidate, defeated Democrat John Kerry. Barring an unforeseen shakeup, New Mexico is expected to align with historical voting patterns once again in 2024 and go to Harris. (Here is a look at the 15 least popular presidents, according to Millennials.)
Despite its status as a Democratic stronghold, there are several parts of the state that have consistently broken with the prevailing political ideology in recent elections. According to voting records, there are 15 counties in New Mexico where an average of at least 50% of voters have supported the Republican candidate across the last four presidential elections. In three of these counties, an average over 70% of voters cast ballots for the Republican candidate over the same four general elections.
These are the most Republican counties in New Mexico. All historical, county-level, voting statistics are from the MIT Election Data and Science Lab’s County Presidential Election Returns 2000-2020 database, as compiled in the Harvard Dataverse, V13.
Why It Matters

Because of the electoral college system, the outcome of presidential elections often comes down to voters in just a handful of closely contested states. In contrast to these battleground states, most of the country has reliably voted either Democratic or Republican in recent presidential elections. These states include New Mexico, which is widely expected to go to Harris in 2024. Still, New Mexico is not the partisan monolith it is often perceived to be.
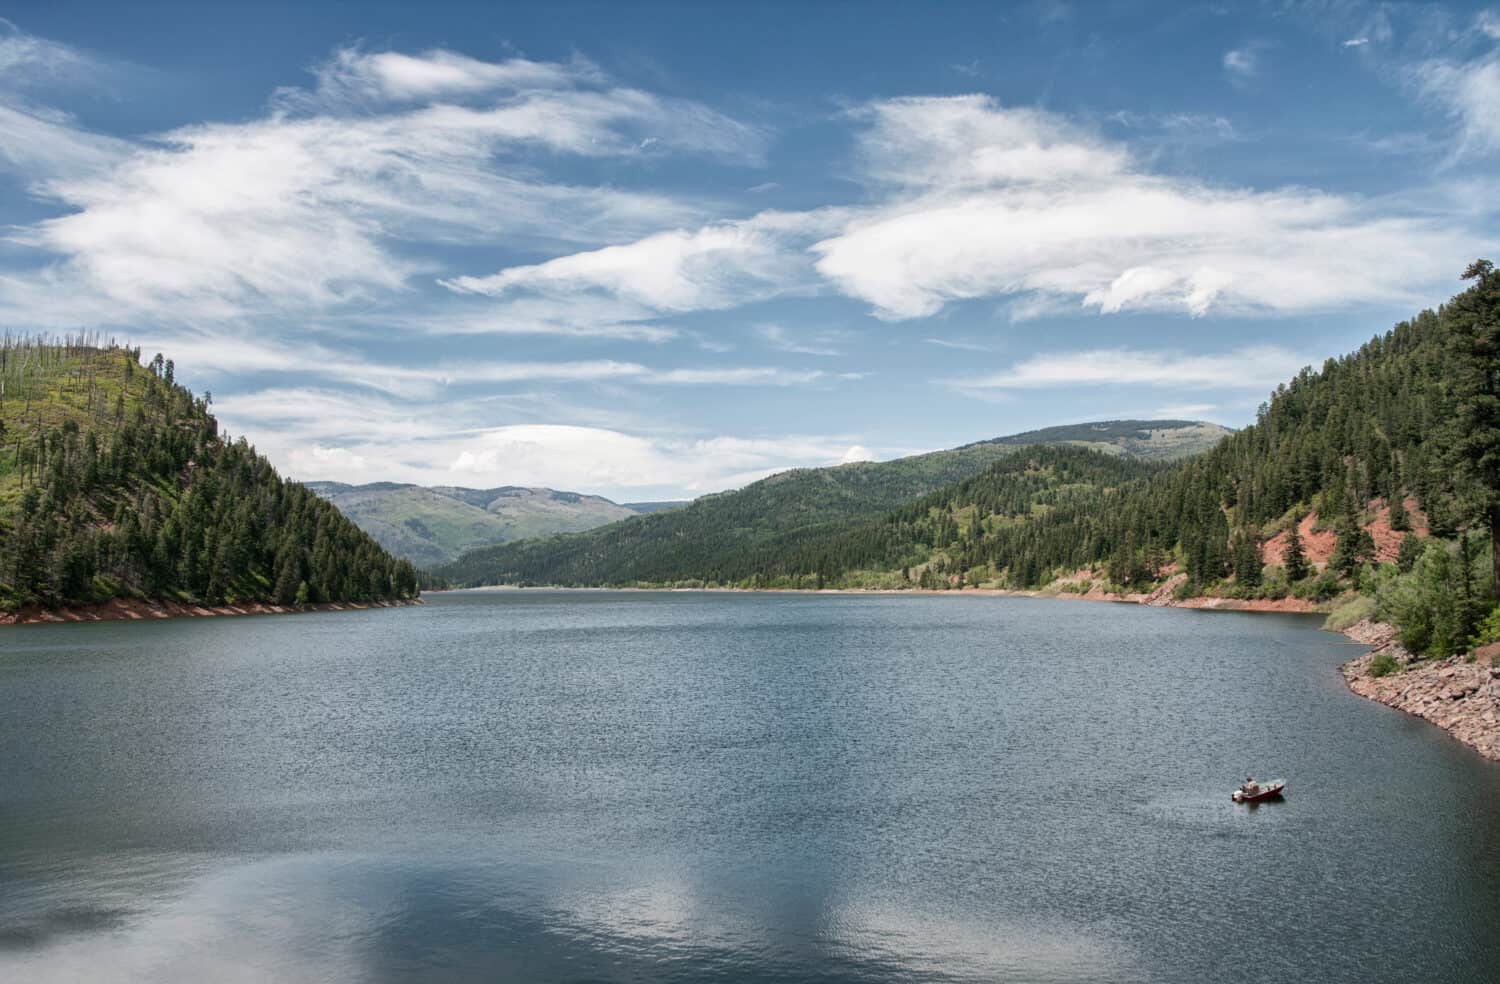
15. Sierra County

- Average popular vote split in last 4 presidential elections: 37.7% Democratic; 57.6% Republican
- Popular vote split in 2020 election: 38.1% Democrat (Joe Biden); 59.6% Republican (Donald Trump)
- Popular vote split in 2016 election: 31.1% Democrat (Hillary Clinton); 58.1% Republican (Donald Trump)
- Popular vote split in 2012 election: 38.5% Democrat (Barack Obama); 57.4% Republican (Mitt Romney)
- Popular vote split in 2008 election: 42.9% Democrat (Barack Obama); 55.0% Republican (John McCain)
- County population: 11,506
14. Harding County
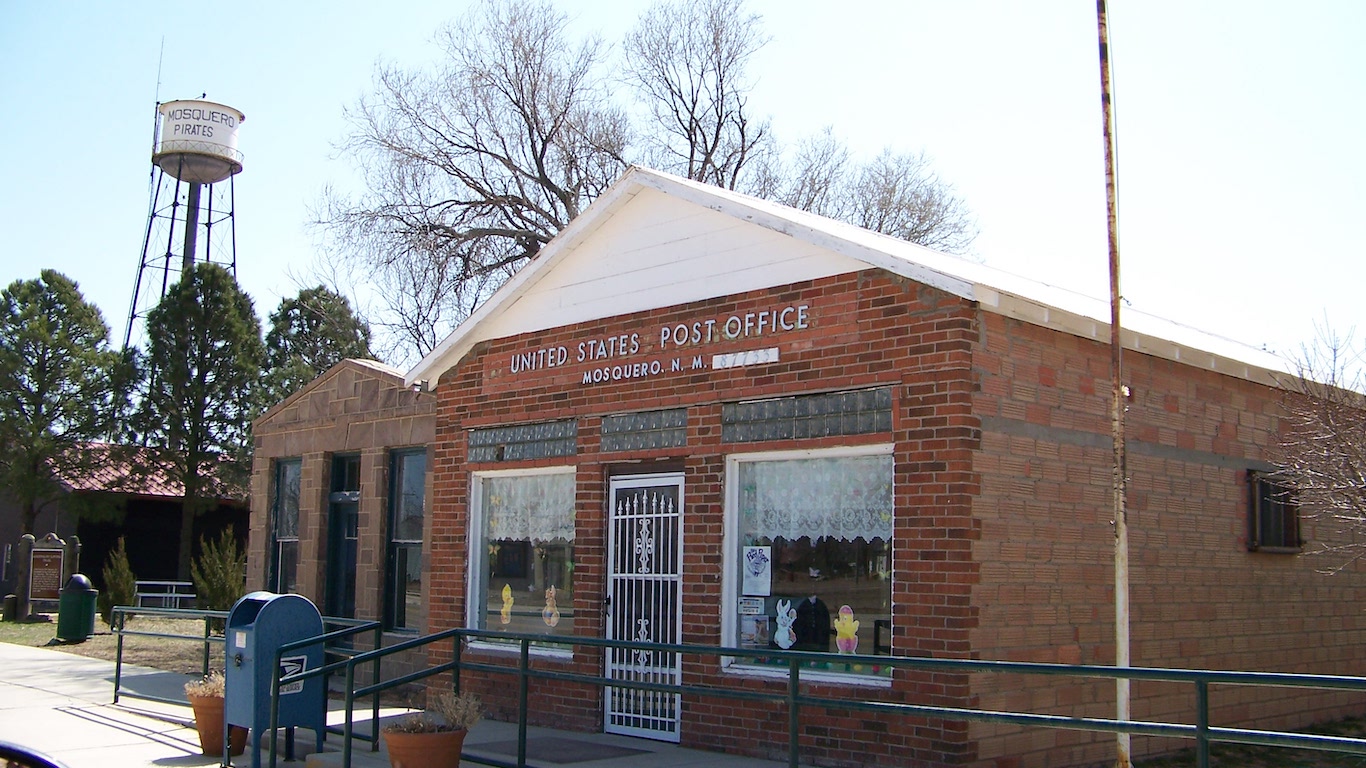
- Average popular vote split in last 4 presidential elections: 37.8% Democratic; 58.2% Republican
- Popular vote split in 2020 election: 35.4% Democrat (Joe Biden); 63.2% Republican (Donald Trump)
- Popular vote split in 2016 election: 29.6% Democrat (Hillary Clinton); 59.0% Republican (Donald Trump)
- Popular vote split in 2012 election: 43.3% Democrat (Barack Obama); 54.4% Republican (Mitt Romney)
- Popular vote split in 2008 election: 41.5% Democrat (Barack Obama); 57.2% Republican (John McCain)
- County population: 671
13. Torrance County
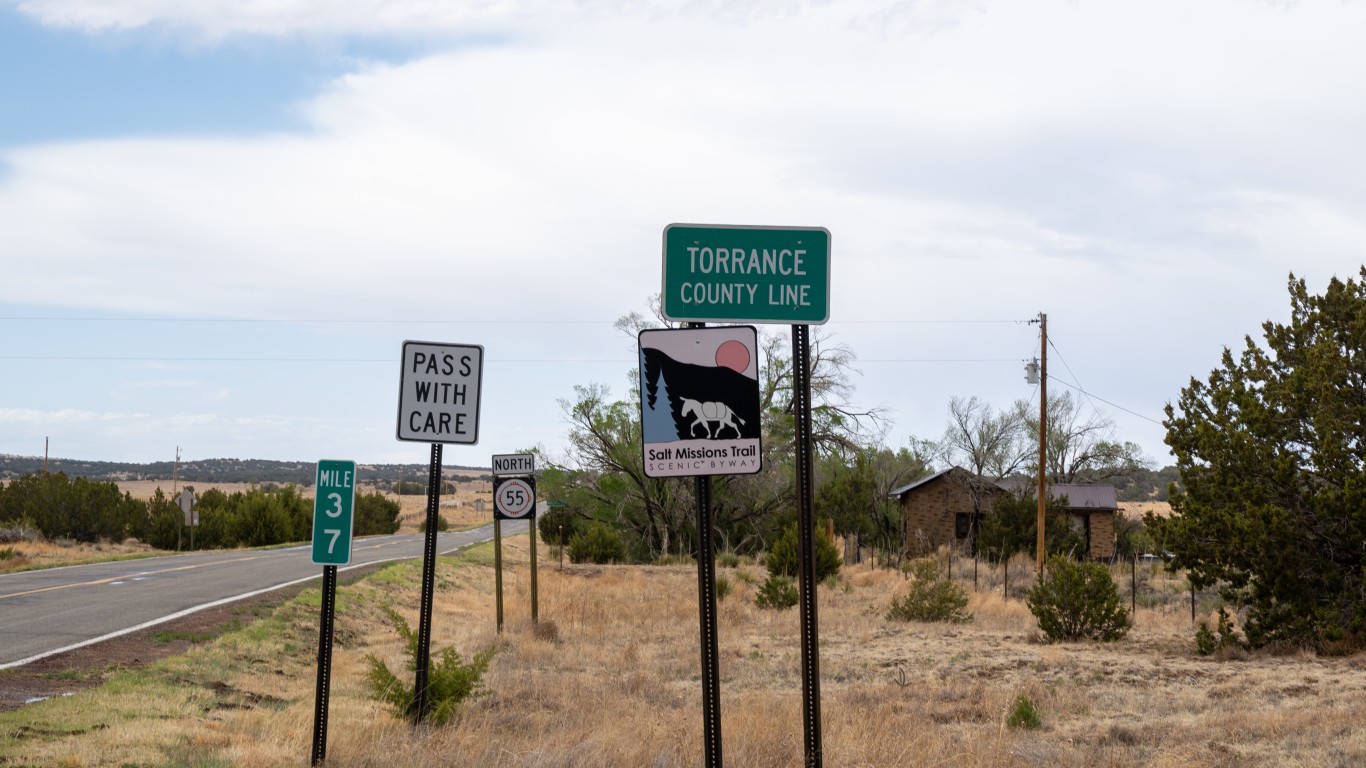
- Average popular vote split in last 4 presidential elections: 35.8% Democratic; 58.4% Republican
- Popular vote split in 2020 election: 32.2% Democrat (Joe Biden); 65.5% Republican (Donald Trump)
- Popular vote split in 2016 election: 28.2% Democrat (Hillary Clinton); 58.7% Republican (Donald Trump)
- Popular vote split in 2012 election: 37.9% Democrat (Barack Obama); 55.1% Republican (Mitt Romney)
- Popular vote split in 2008 election: 44.5% Democrat (Barack Obama); 53.8% Republican (John McCain)
- County population: 15,203
12. Otero County

- Average popular vote split in last 4 presidential elections: 35.2% Democratic; 60.5% Republican
- Popular vote split in 2020 election: 36.0% Democrat (Joe Biden); 61.6% Republican (Donald Trump)
- Popular vote split in 2016 election: 30.5% Democrat (Hillary Clinton); 59.3% Republican (Donald Trump)
- Popular vote split in 2012 election: 34.1% Democrat (Barack Obama); 62.2% Republican (Mitt Romney)
- Popular vote split in 2008 election: 39.6% Democrat (Barack Obama); 58.8% Republican (John McCain)
- County population: 67,850
11. San Juan County
- Average popular vote split in last 4 presidential elections: 33.9% Democratic; 61.5% Republican
- Popular vote split in 2020 election: 34.6% Democrat (Joe Biden); 62.9% Republican (Donald Trump)
- Popular vote split in 2016 election: 27.9% Democrat (Hillary Clinton); 60.6% Republican (Donald Trump)
- Popular vote split in 2012 election: 34.3% Democrat (Barack Obama); 62.4% Republican (Mitt Romney)
- Popular vote split in 2008 election: 38.8% Democrat (Barack Obama); 59.9% Republican (John McCain)
- County population: 121,798
10. Quay County

- Average popular vote split in last 4 presidential elections: 33.8% Democratic; 62.2% Republican
- Popular vote split in 2020 election: 30.2% Democrat (Joe Biden); 68.0% Republican (Donald Trump)
- Popular vote split in 2016 election: 28.5% Democrat (Hillary Clinton); 61.9% Republican (Donald Trump)
- Popular vote split in 2012 election: 37.3% Democrat (Barack Obama); 59.4% Republican (Mitt Romney)
- Popular vote split in 2008 election: 38.7% Democrat (Barack Obama); 59.2% Republican (John McCain)
- County population: 8,641
9. Chaves County
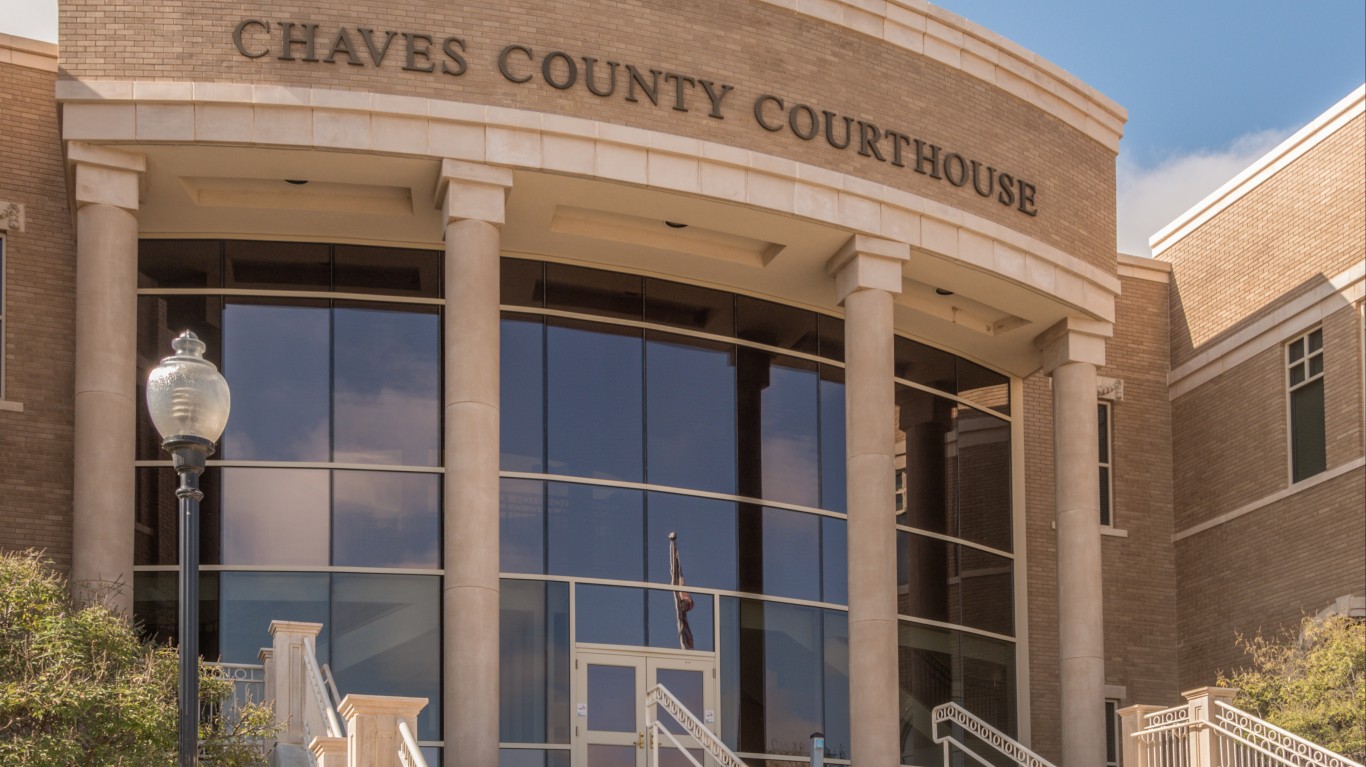
- Average popular vote split in last 4 presidential elections: 31.4% Democratic; 64.9% Republican
- Popular vote split in 2020 election: 28.4% Democrat (Joe Biden); 69.8% Republican (Donald Trump)
- Popular vote split in 2016 election: 27.3% Democrat (Hillary Clinton); 63.5% Republican (Donald Trump)
- Popular vote split in 2012 election: 32.5% Democrat (Barack Obama); 64.5% Republican (Mitt Romney)
- Popular vote split in 2008 election: 37.1% Democrat (Barack Obama); 61.7% Republican (John McCain)
- County population: 64,701
8. Lincoln County
- Average popular vote split in last 4 presidential elections: 31.5% Democratic; 65.0% Republican
- Popular vote split in 2020 election: 31.0% Democrat (Joe Biden); 67.4% Republican (Donald Trump)
- Popular vote split in 2016 election: 26.2% Democrat (Hillary Clinton); 66.2% Republican (Donald Trump)
- Popular vote split in 2012 election: 31.8% Democrat (Barack Obama); 64.5% Republican (Mitt Romney)
- Popular vote split in 2008 election: 36.5% Democrat (Barack Obama); 61.9% Republican (John McCain)
- County population: 20,222
7. Roosevelt County

- Average popular vote split in last 4 presidential elections: 28.9% Democratic; 66.8% Republican
- Popular vote split in 2020 election: 27.3% Democrat (Joe Biden); 70.1% Republican (Donald Trump)
- Popular vote split in 2016 election: 24.4% Democrat (Hillary Clinton); 65.3% Republican (Donald Trump)
- Popular vote split in 2012 election: 28.9% Democrat (Barack Obama); 67.7% Republican (Mitt Romney)
- Popular vote split in 2008 election: 34.3% Democrat (Barack Obama); 64.2% Republican (John McCain)
- County population: 19,142
6. De Baca County

- Average popular vote split in last 4 presidential elections: 28.5% Democratic; 67.6% Republican
- Popular vote split in 2020 election: 25.6% Democrat (Joe Biden); 72.8% Republican (Donald Trump)
- Popular vote split in 2016 election: 21.2% Democrat (Hillary Clinton); 68.1% Republican (Donald Trump)
- Popular vote split in 2012 election: 31.8% Democrat (Barack Obama); 65.0% Republican (Mitt Romney)
- Popular vote split in 2008 election: 34.4% Democrat (Barack Obama); 64.8% Republican (John McCain)
- County population: 1,695
5. Eddy County
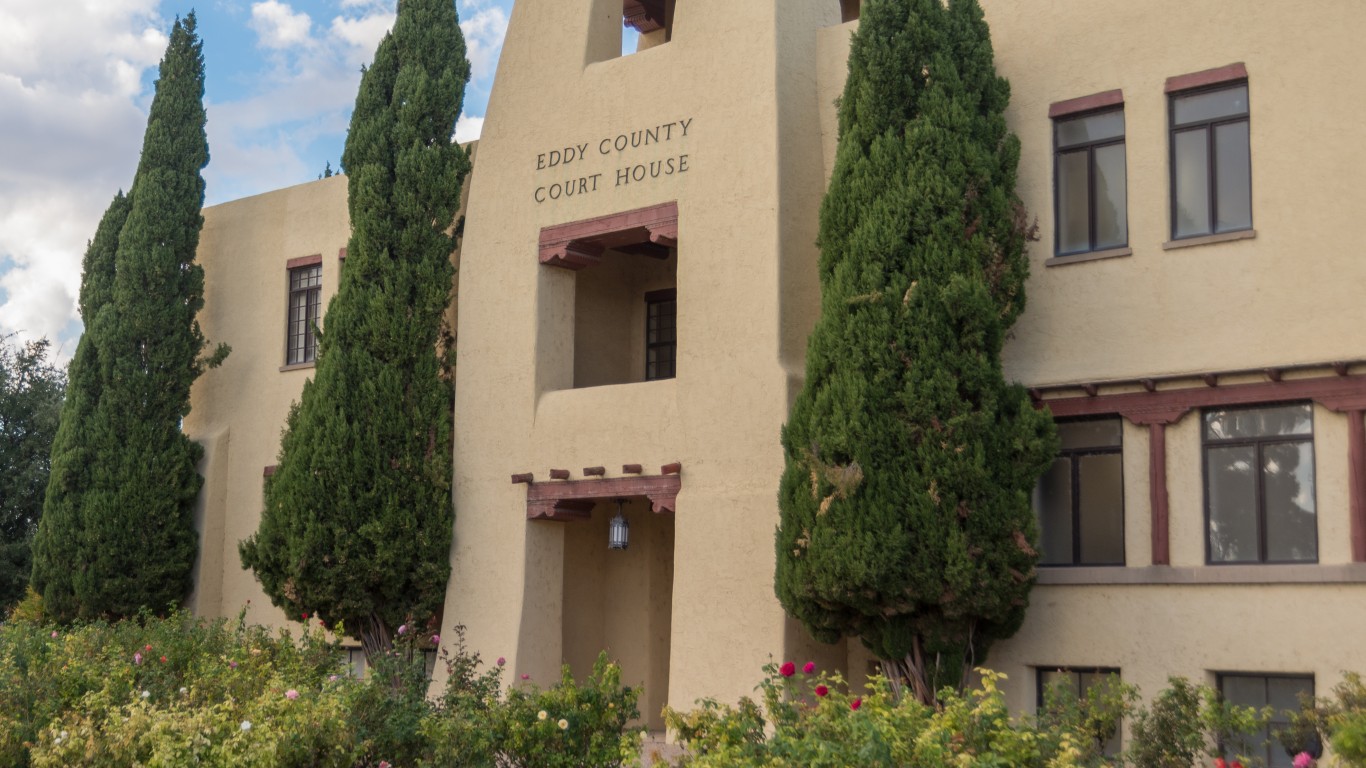
- Average popular vote split in last 4 presidential elections: 29.1% Democratic; 67.7% Republican
- Popular vote split in 2020 election: 23.4% Democrat (Joe Biden); 75.2% Republican (Donald Trump)
- Popular vote split in 2016 election: 25.6% Democrat (Hillary Clinton); 66.8% Republican (Donald Trump)
- Popular vote split in 2012 election: 31.9% Democrat (Barack Obama); 65.3% Republican (Mitt Romney)
- Popular vote split in 2008 election: 36.6% Democrat (Barack Obama); 62.2% Republican (John McCain)
- County population: 61,264
4. Curry County
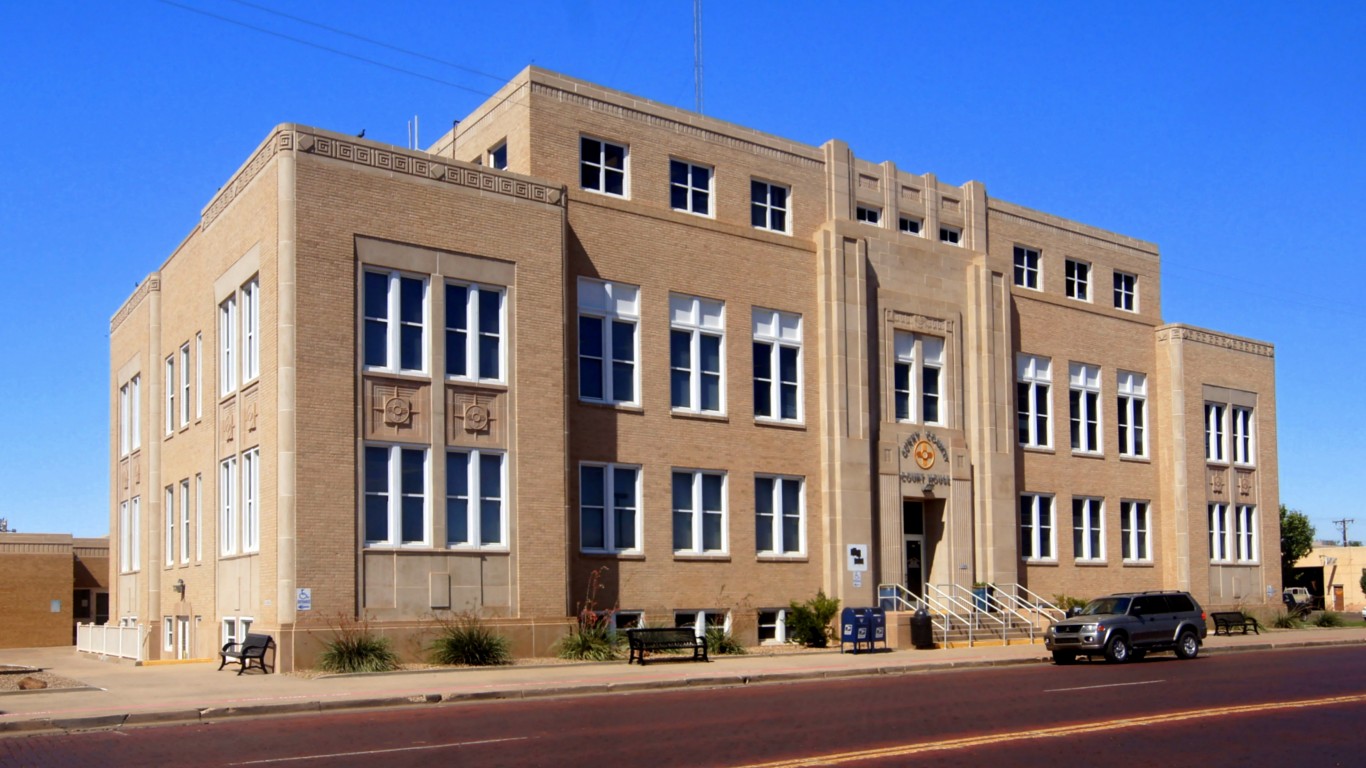
- Average popular vote split in last 4 presidential elections: 28.5% Democratic; 67.8% Republican
- Popular vote split in 2020 election: 28.5% Democrat (Joe Biden); 69.2% Republican (Donald Trump)
- Popular vote split in 2016 election: 23.3% Democrat (Hillary Clinton); 67.6% Republican (Donald Trump)
- Popular vote split in 2012 election: 29.5% Democrat (Barack Obama); 67.9% Republican (Mitt Romney)
- Popular vote split in 2008 election: 32.3% Democrat (Barack Obama); 66.5% Republican (John McCain)
- County population: 48,327
3. Catron County

- Average popular vote split in last 4 presidential elections: 26.1% Democratic; 70.3% Republican
- Popular vote split in 2020 election: 25.6% Democrat (Joe Biden); 73.0% Republican (Donald Trump)
- Popular vote split in 2016 election: 20.8% Democrat (Hillary Clinton); 71.4% Republican (Donald Trump)
- Popular vote split in 2012 election: 26.4% Democrat (Barack Obama); 70.4% Republican (Mitt Romney)
- Popular vote split in 2008 election: 31.4% Democrat (Barack Obama); 66.2% Republican (John McCain)
- County population: 3,635
2. Union County
- Average popular vote split in last 4 presidential elections: 23.8% Democratic; 72.5% Republican
- Popular vote split in 2020 election: 21.4% Democrat (Joe Biden); 77.6% Republican (Donald Trump)
- Popular vote split in 2016 election: 18.8% Democrat (Hillary Clinton); 71.4% Republican (Donald Trump)
- Popular vote split in 2012 election: 26.8% Democrat (Barack Obama); 70.3% Republican (Mitt Romney)
- Popular vote split in 2008 election: 28.2% Democrat (Barack Obama); 70.4% Republican (John McCain)
- County population: 4,074
1. Lea County
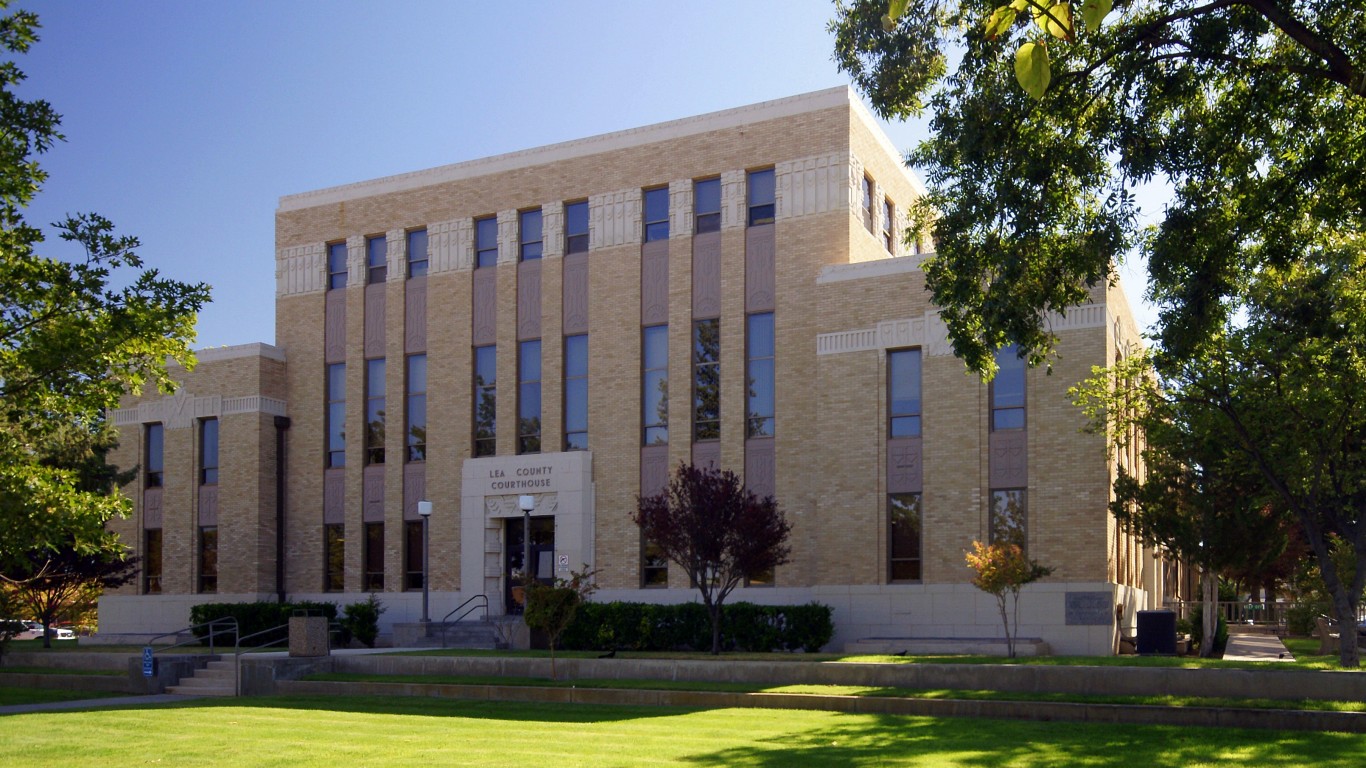
- Average popular vote split in last 4 presidential elections: 23.1% Democratic; 73.9% Republican
- Popular vote split in 2020 election: 19.4% Democrat (Joe Biden); 79.0% Republican (Donald Trump)
- Popular vote split in 2016 election: 22.2% Democrat (Hillary Clinton); 70.5% Republican (Donald Trump)
- Popular vote split in 2012 election: 24.0% Democrat (Barack Obama); 73.7% Republican (Mitt Romney)
- Popular vote split in 2008 election: 27.4% Democrat (Barack Obama); 71.6% Republican (John McCain)
- County population: 73,103
Are You Ahead, or Behind on Retirement? (sponsor)
If you’re one of the over 4 Million Americans set to retire this year, you may want to pay attention.
Finding a financial advisor who puts your interest first can be the difference between a rich retirement and barely getting by, and today it’s easier than ever. SmartAsset’s free tool matches you with up to three fiduciary financial advisors that serve your area in minutes. Each advisor has been carefully vetted, and must act in your best interests. Start your search now.
Don’t waste another minute; get started right here and help your retirement dreams become a retirement reality.
Thank you for reading! Have some feedback for us?
Contact the 24/7 Wall St. editorial team.

Our expert who first called NVIDIA in 2009 is predicting 2025 will see a historic AI breakthrough.
You can follow him investing $500,000 of his own money on our top AI stocks for free.