Population and Social Characteristics
Americans are Flocking to Pennsylvania From These States

Published:

Americans are more likely to move to a new state than they have been in years. According to the latest estimates from the U.S. Census Bureau’s American Community Survey, 8.2 million people moved between states in 2022, more than in any year in over a decade.
While reasons for moving vary from person to person, historically high rates of interstate mobility may be tied to recent changes in the labor market — specifically, the sweeping adoption of remote work policies in the wake of the COVID-19 pandemic. Census data shows that more than 24 million Americans worked from home in 2022, compared to fewer than 9 million in 2019, the year before the pandemic.
Without needing to be within commuting distance of their office, larger shares of the population are free to choose a place to live based on other factors, including housing, climate, cost of living, and family. Whatever the explanations may be, census data shows that some states are far more popular destinations than others — and Pennsylvania is drawing in more new residents from other parts of the country than the vast majority of states.
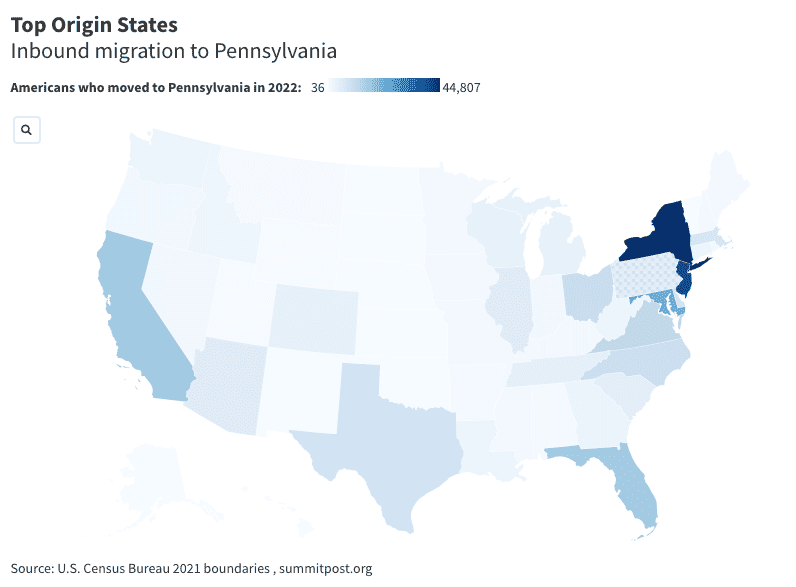
An estimated 262,700 Americans relocated to Pennsylvania in 2022, the ninth most of any state. Inbound moves to Pennsylvania originated from every state and Washington, D.C in 2022, with the exception of North Dakota.
The number of Americans who moved to Pennsylvania in 2022 ranges from about 40 to more than 44,800, depending on the state. Not surprisingly, the states reporting the largest outflow of residents to Pennsylvania include many of the most populous states in the country, as well as several states that share a border with Pennsylvania.


| Rank | Geography | Residents who moved to Pennsylvania in 2022 | Pct. all inbound moves to Pennsylvania |
|---|---|---|---|
| 50 | North Dakota | – | 0.00 |
| 49 | South Dakota | 36 | 0.01 |
| 48 | Kansas | 63 | 0.02 |
| 47 | Nebraska | 75 | 0.03 |
| 46 | Hawaii | 193 | 0.07 |
| 45 | Wyoming | 229 | 0.09 |
| 44 | Vermont | 247 | 0.09 |
| 43 | Oklahoma | 263 | 0.10 |
| 42 | Utah | 293 | 0.11 |
| 41 | New Mexico | 386 | 0.15 |
| 40 | Alaska | 519 | 0.20 |
| 39 | Montana | 593 | 0.23 |
| 38 | Arkansas | 624 | 0.24 |
| 37 | Alabama | 775 | 0.30 |
| 36 | Iowa | 1,051 | 0.40 |
| 35 | Mississippi | 1,141 | 0.43 |
| 34 | Missouri | 1,160 | 0.44 |
| 33 | Maine | 1,205 | 0.46 |
| 32 | Rhode Island | 1,206 | 0.46 |
| 31 | Minnesota | 1,239 | 0.47 |
| 30 | New Hampshire | 1,260 | 0.48 |
| 29 | Kentucky | 1,371 | 0.52 |
| 28 | Indiana | 1,498 | 0.57 |
| 27 | Oregon | 1,530 | 0.58 |
| 26 | Nevada | 1,555 | 0.59 |
| 25 | District of Columbia | 1,664 | 0.63 |
| 24 | Idaho | 1,962 | 0.75 |
| 23 | West Virginia | 2,442 | 0.93 |
| 22 | Washington | 2,687 | 1.02 |
| 21 | Louisiana | 2,744 | 1.04 |
| 20 | Connecticut | 2,816 | 1.07 |
| 19 | Georgia | 2,982 | 1.14 |
| 18 | Michigan | 3,322 | 1.26 |
| 17 | Wisconsin | 3,401 | 1.29 |
| 16 | Colorado | 3,840 | 1.46 |
| 15 | Tennessee | 4,227 | 1.61 |
| 14 | South Carolina | 4,706 | 1.79 |
| 13 | Arizona | 5,561 | 2.12 |
| 12 | Illinois | 5,659 | 2.15 |
| 11 | Massachusetts | 7,541 | 2.87 |
| 10 | Delaware | 8,158 | 3.11 |
| 9 | Texas | 8,544 | 3.25 |
| 8 | North Carolina | 9,687 | 3.69 |
| 7 | Ohio | 10,436 | 3.97 |
| 6 | Virginia | 11,888 | 4.53 |
| 5 | Florida | 16,014 | 6.10 |
| 4 | California | 16,336 | 6.22 |
| 3 | Maryland | 22,247 | 8.47 |
| 2 | New Jersey | 40,517 | 15.42 |
| 1 | New York | 44,807 | 17.06 |
Credit card companies are pulling out all the stops, with the issuers are offering insane travel rewards and perks.
We’re talking huge sign-up bonuses, points on every purchase, and benefits like lounge access, travel credits, and free hotel nights. For travelers, these rewards can add up to thousands of dollars in flights, upgrades, and luxury experiences every year.
It’s like getting paid to travel — and it’s available to qualified borrowers who know where to look.
We’ve rounded up some of the best travel credit cards on the market. Click here to see the list. Don’t miss these offers — they won’t be this good forever.
Thank you for reading! Have some feedback for us?
Contact the 24/7 Wall St. editorial team.