Population and Social Characteristics
America's Most Diverse Neighborhoods
Published:

The overall racial and ethnic diversity of the United States has increased since 2010, according to 2020 Census analyses. But what makes the U.S. more diverse? Simply having more people of different backgrounds is not necessarily diversity as groups of different ethnicities or racial backgrounds can live in separate neighborhoods. To better represent diversity, therefore, the Census developed an index that measures the chance that two people chosen at random will be from different race and ethnicity groups.
24/7 Wall St. used the idea to determine more specifically the most diverse neighborhoods in the U.S. Reviewing five-year data on race and ethnicity from the U.S. Census Bureau’s 2022 American Community Survey, neighborhoods were ranked based on the probability that two residents picked at random will be of different race or ethnicity. Racial and ethnic groups include white, Black or African American, American Indian and Alaska Native, Asian, Native Hawaiian and other Pacific Islander, Hispanic or Latino, some other race alone, and two or more races.
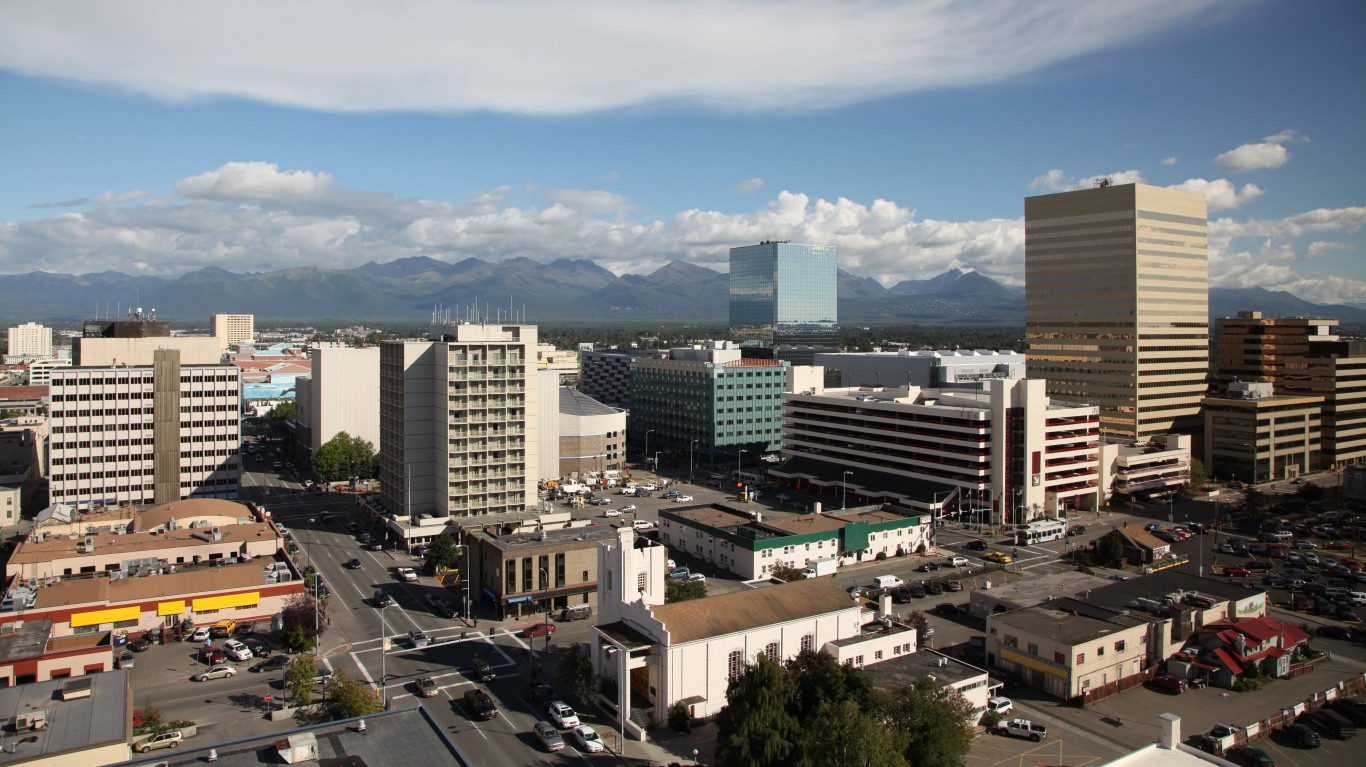
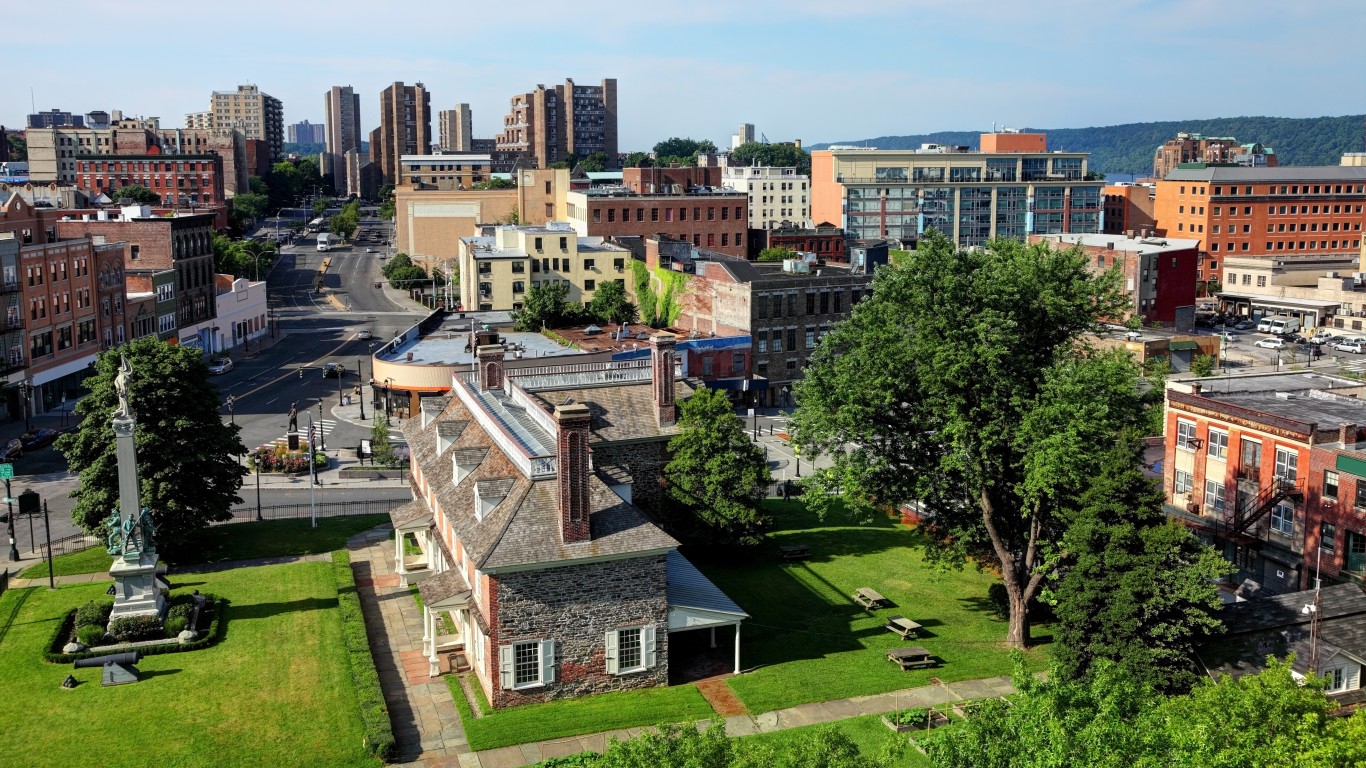
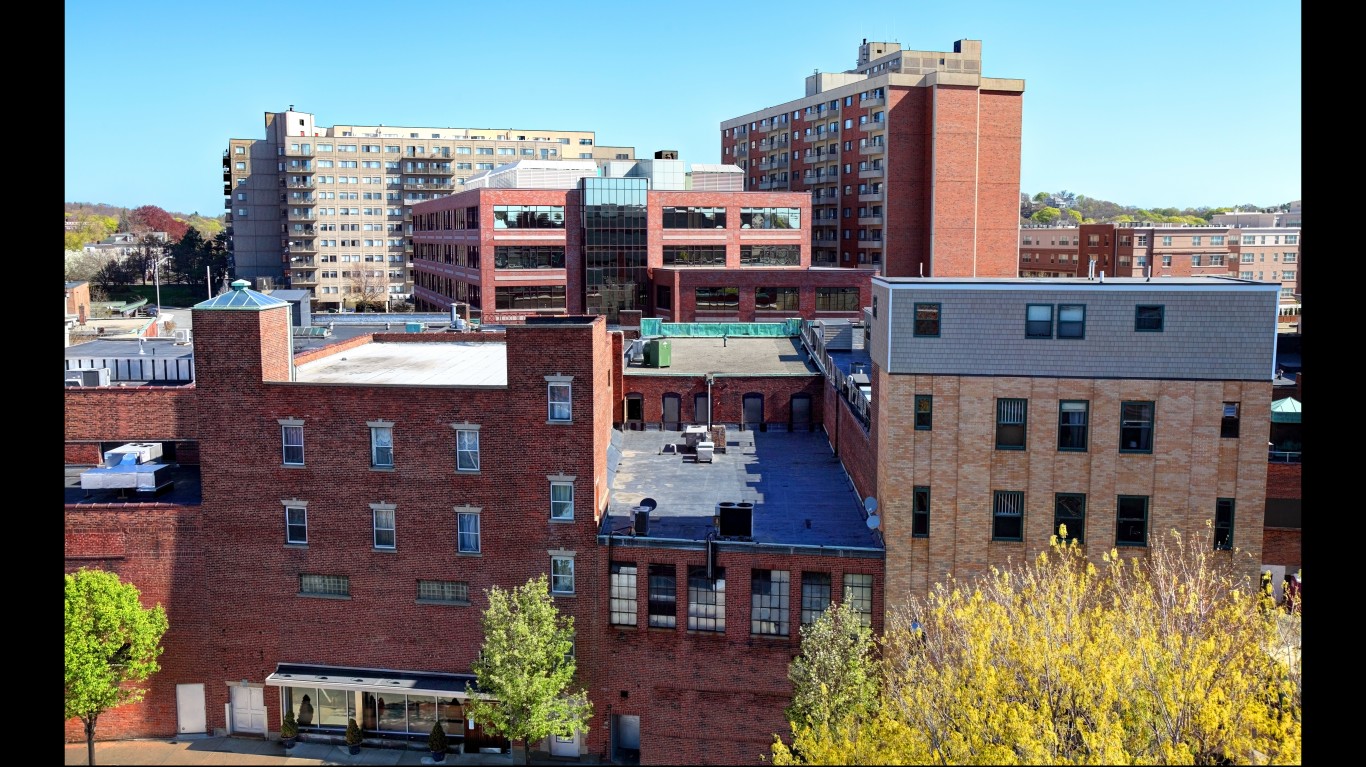
The West region dominates the list, with 29 of the neighborhoods in cities in California alone, including 10 in Sacramento and five in Oakland. Seven more neighborhoods on the list are in cities in Washington state and three in cities in Alaska. Next, the Northeast has the most neighborhoods on the list, with seven in New York state cities, one in Massachusetts, and one in Pennsylvania. Finally, the Midwest has two cities on the list. (Also see: The Top City to Live in Each State.)
While diversity might often give the impression of diversity in housing, most of the neighborhoods on the list have expensive homes. Based on Zillow data, only 10 neighborhoods, including the two in Minnesota, the three in Schenectady, New York, and the three in Alaska have typical home values less than the U.S. typical home value in November 2023 of $342,099. On the other hand, in 28 neighborhoods, typical home prices are above $500,000, including one with prices about $1 million.
To determine the most diverse neighborhoods, 24/7 Wall St. reviewed five-year data on race and ethnicity from the U.S. Census Bureau’s 2022 American Community Survey. Neighborhoods were ranked based on the probability that two residents picked at random will be of different race or ethnicity. Racial and ethnic groups include white, Black or African American, American Indian and Alaska Native, Asian, Native Hawaiian and other Pacific Islander, Hispanic or Latino, some other race alone, and two or more races. The probability that any two residents picked at random will belong to a different racial or ethnic category is equivalent to the sum of the squares of each group’s share of the population, subtracted from 1. The same method is used in the USA Today Diversity Index as well as the racial and ethnic diversity index of the Disseminating Diversity Working Group of the Census Bureau.
Data on population by race and ethnicity were aggregated from the census tract level to the neighborhood level using 2022 census tract boundary definitions from the U.S. Census Bureau and 2017 neighborhood boundary definitions from Zillow. Census tracts with at least 50% spatial overlap within the neighborhood boundary were included in population aggregation. Data on estimated median home value is the November 2023 Zillow Home Value Index, a measure of typical home values for homes in the 35th to 65th percentile range.








































Want retirement to come a few years earlier than you’d planned? Or are you ready to retire now, but want an extra set of eyes on your finances?
Now you can speak with up to 3 financial experts in your area for FREE. By simply clicking here you can begin to match with financial professionals who can help you build your plan to retire early. And the best part? The first conversation with them is free.
Click here to match with up to 3 financial pros who would be excited to help you make financial decisions.
Have questions about retirement or personal finance? Email us at [email protected]!
By emailing your questions to 24/7 Wall St., you agree to have them published anonymously on a673b.bigscoots-temp.com.
By submitting your story, you understand and agree that we may use your story, or versions of it, in all media and platforms, including via third parties.
Thank you for reading! Have some feedback for us?
Contact the 24/7 Wall St. editorial team.