“When you’re alone and life is making you lonely, You can always go downtown,” Petula Clark famously sang in Tony Hatch’s song “Downtown.” But of course, for that you need a booming and happening downtown, and not all cities have one.
To determine the 40 cities with booming downtowns, 24/7 Wall St. ranked cities based on the percentage change in population in their downtown census tracts from 2012 to 2022, using Census Bureau data.
Some Midwestern cities on the list have known decades of economic struggles and their populations have generally been declining — yet their downtowns are booming as the populations have been shifting to the downtown areas. For example, while the downtown census tracts of Cleveland and Detroit are growing (populations hae grown by 20% and 42%, respectively, in the past decade), the non-downtown tracts of these cities are shrinking.
On the other hand, some metropolitan areas are growing overall, and this is also being reflected in their downtown core, such as the case with Palm Coast, Florida. (Also see: America’s Most Dangerous City.)
Another indication of a booming downtown can be gleaned from the income per capita in these census tracts. In some of the downtown areas on the list, income per capita grew by more than 50%. In fact, in a few, income per capita in the downtown areas grew considerably more than in the non-downtown areas. For example, in Phoenix, income per capita in downtown rose by 74% in the past decade compared to 22% in the non-downtown areas. Similarly, in Nashville, down income per capita grew by 87% compared to a 25% growth in non-downtown areas.
Full methodology
To determine the cities with booming downtowns, 24/7 Wall St. reviewed five-year data on population change from the U.S. Census Bureau’s 2022 American Community Survey. Cities were ranked based on the percentage change in population in their downtown census tracts from 2012 to 2022. Downtown areas were defined as the census tracts that fall at least 50% within the 1.8-mile radius around a city hall. Non-downtown areas were defined as the census tracts that fall at least 50% within a city’s boundaries, yet less than 50% within the 1.8-mile radius around city hall. Boundary definitions are from the U.S. Census Bureau and are for 2022. Only principal cities of metropolitan statistical areas were considered. City hall coordinates as well as supplemental data on income are also from the Census Bureau.
40. Salinas, California
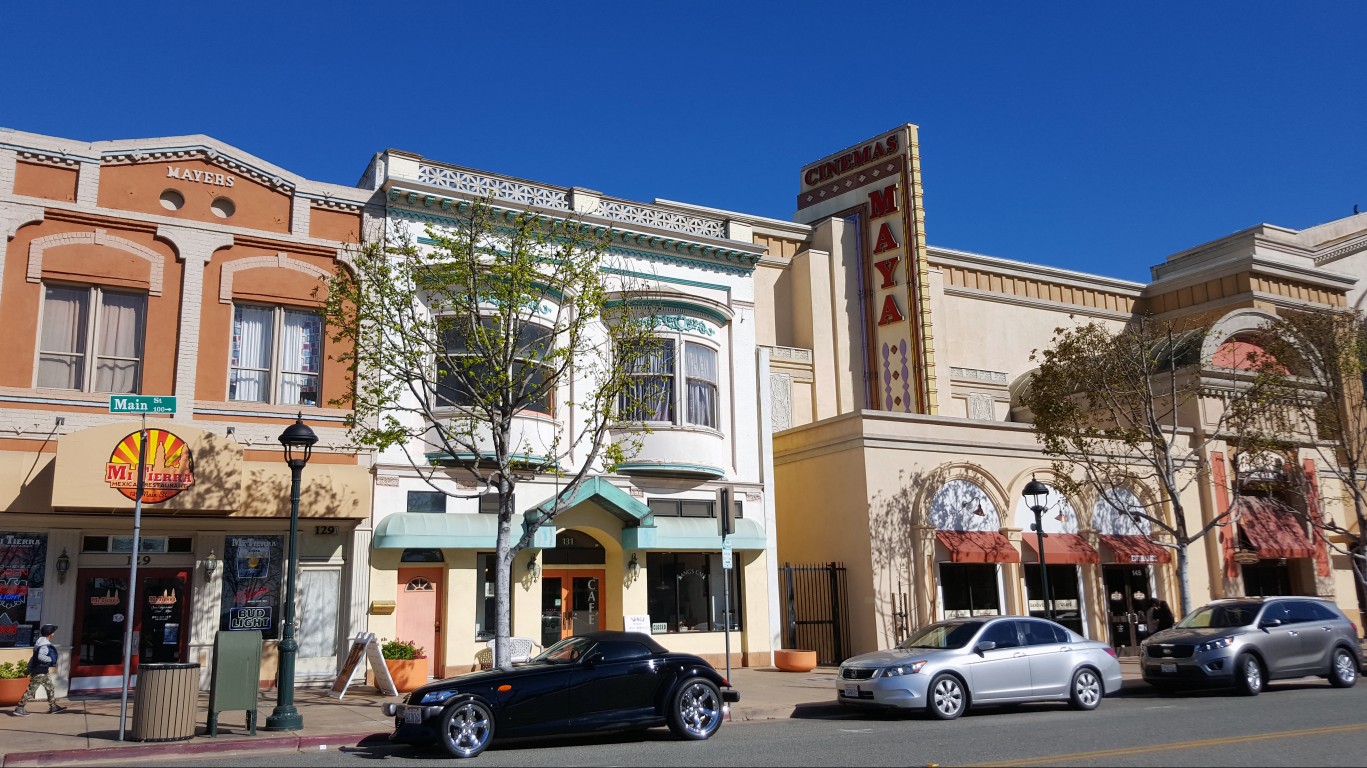
- Population change in downtown tracts, 2012 to 2022: +14.5%
- Population change of non-downtown tracts, 2012 to 2022: +5.9%
- Per capita income change in downtown tracts, 2012 to 2022: +7.8%
- Per capita income change in non-downtown tracts, 2012 to 2022: +21.5%
39. Longview, Washington
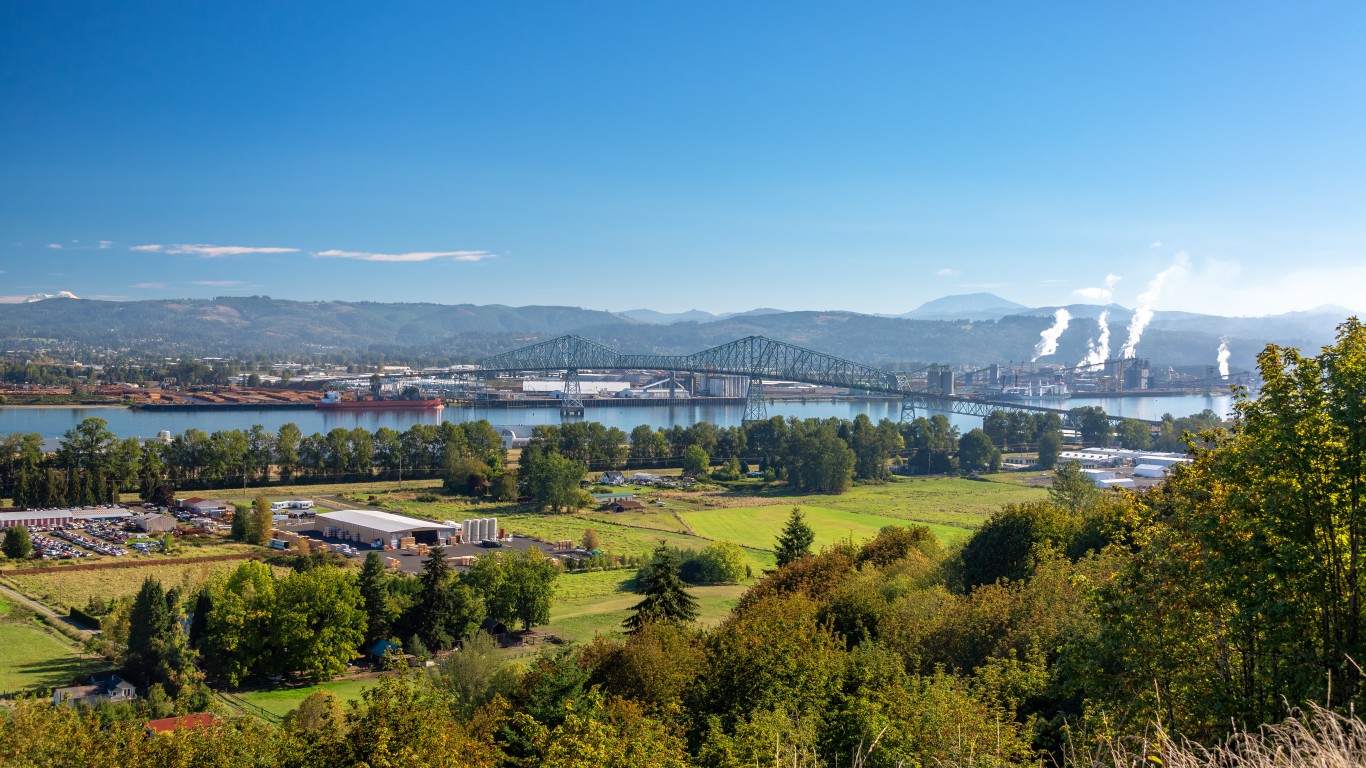
- Population change in downtown tracts, 2012 to 2022: +14.7%
- Population change of non-downtown tracts, 2012 to 2022: -3.4%
- Per capita income change in downtown tracts, 2012 to 2022: +24.6%
- Per capita income change in non-downtown tracts, 2012 to 2022: +30.1%
38. Eugene, Oregon
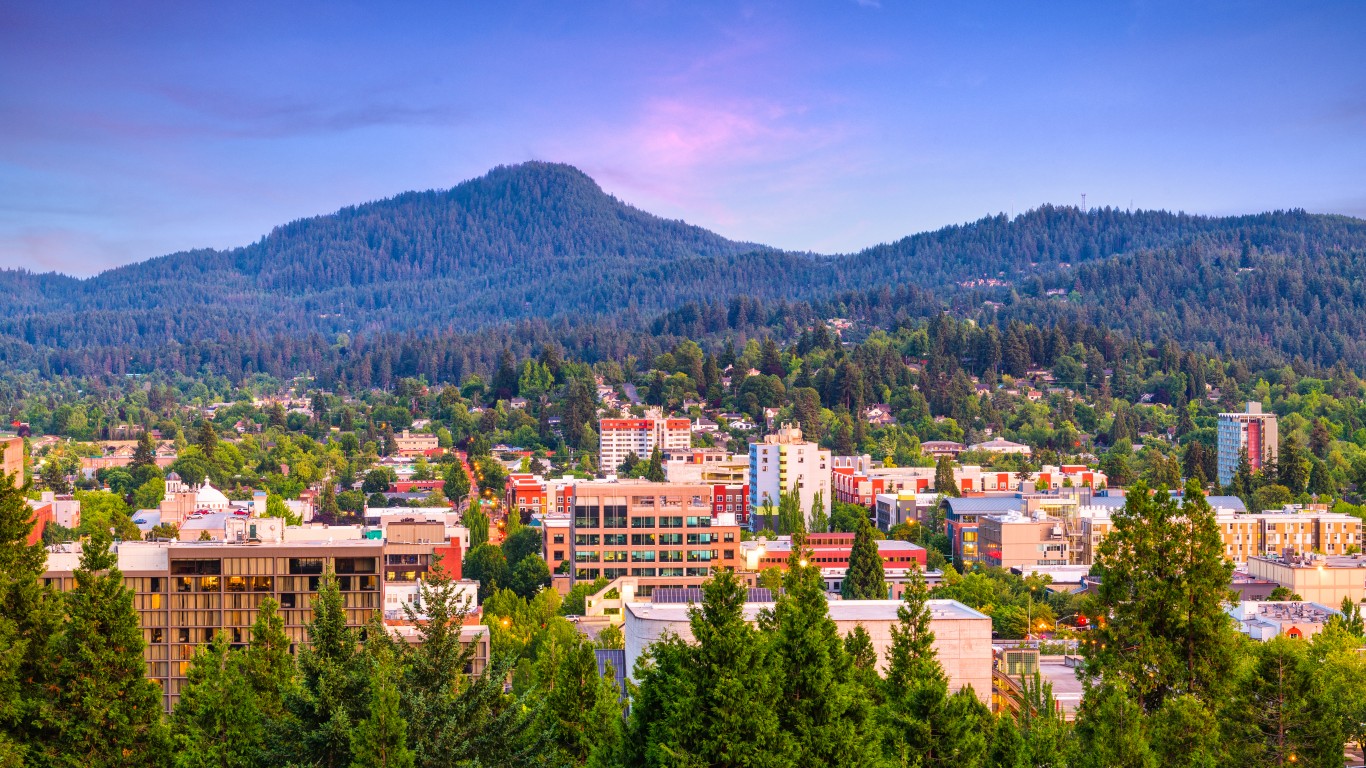
- Population change in downtown tracts, 2012 to 2022: +14.8%
- Population change of non-downtown tracts, 2012 to 2022: +7.9%
- Per capita income change in downtown tracts, 2012 to 2022: +16.8%
- Per capita income change in non-downtown tracts, 2012 to 2022: +18.7%
37. Salem, Oregon
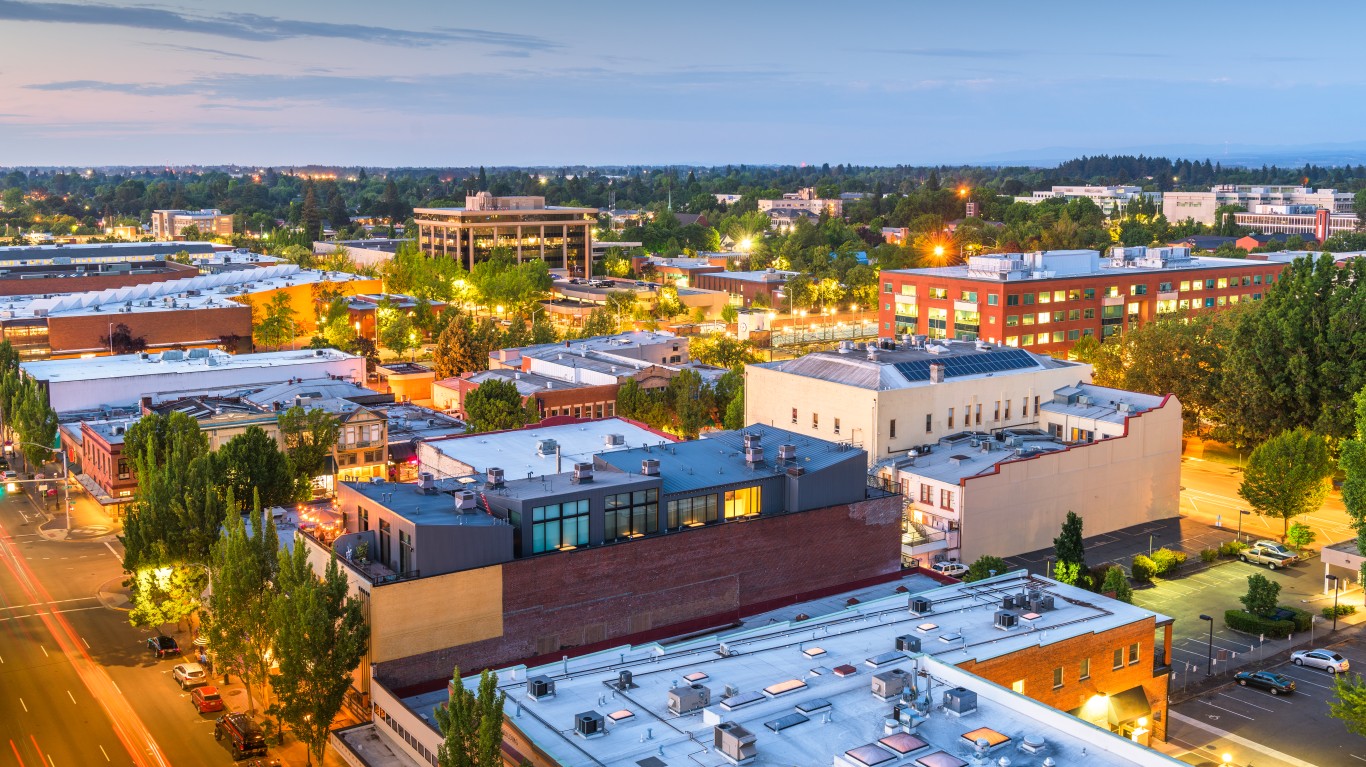
- Population change in downtown tracts, 2012 to 2022: +15.4%
- Population change of non-downtown tracts, 2012 to 2022: +9.7%
- Per capita income change in downtown tracts, 2012 to 2022: +19.5%
- Per capita income change in non-downtown tracts, 2012 to 2022: +17.8%
36. Gainesville, Florida
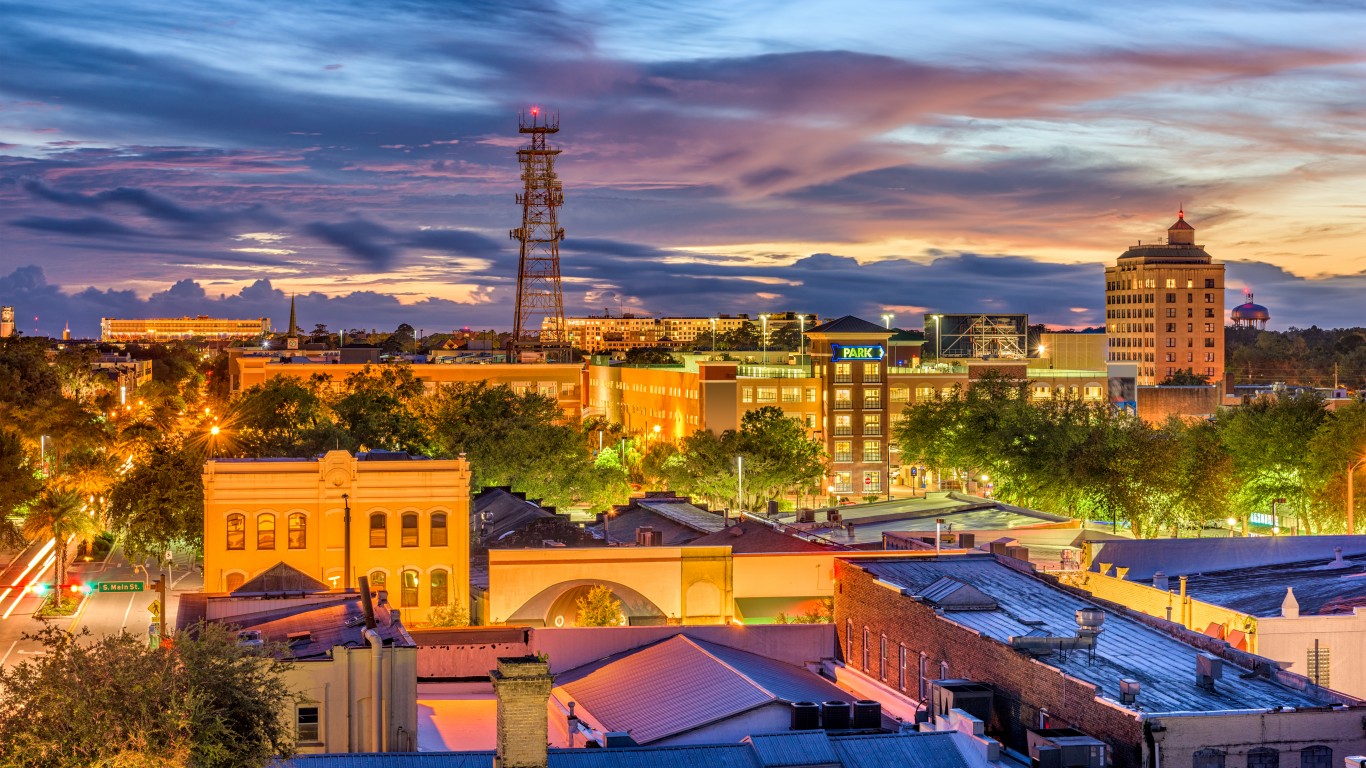
- Population change in downtown tracts, 2012 to 2022: +15.4%
- Population change of non-downtown tracts, 2012 to 2022: +9.6%
- Per capita income change in downtown tracts, 2012 to 2022: +19.4%
- Per capita income change in non-downtown tracts, 2012 to 2022: +0.2%
35. Charlottesville, Virginia

- Population change in downtown tracts, 2012 to 2022: +15.9%
- Population change of non-downtown tracts, 2012 to 2022: -5.7%
- Per capita income change in downtown tracts, 2012 to 2022: +31.0%
- Per capita income change in non-downtown tracts, 2012 to 2022: +49.1%
34. Salt Lake City, Utah
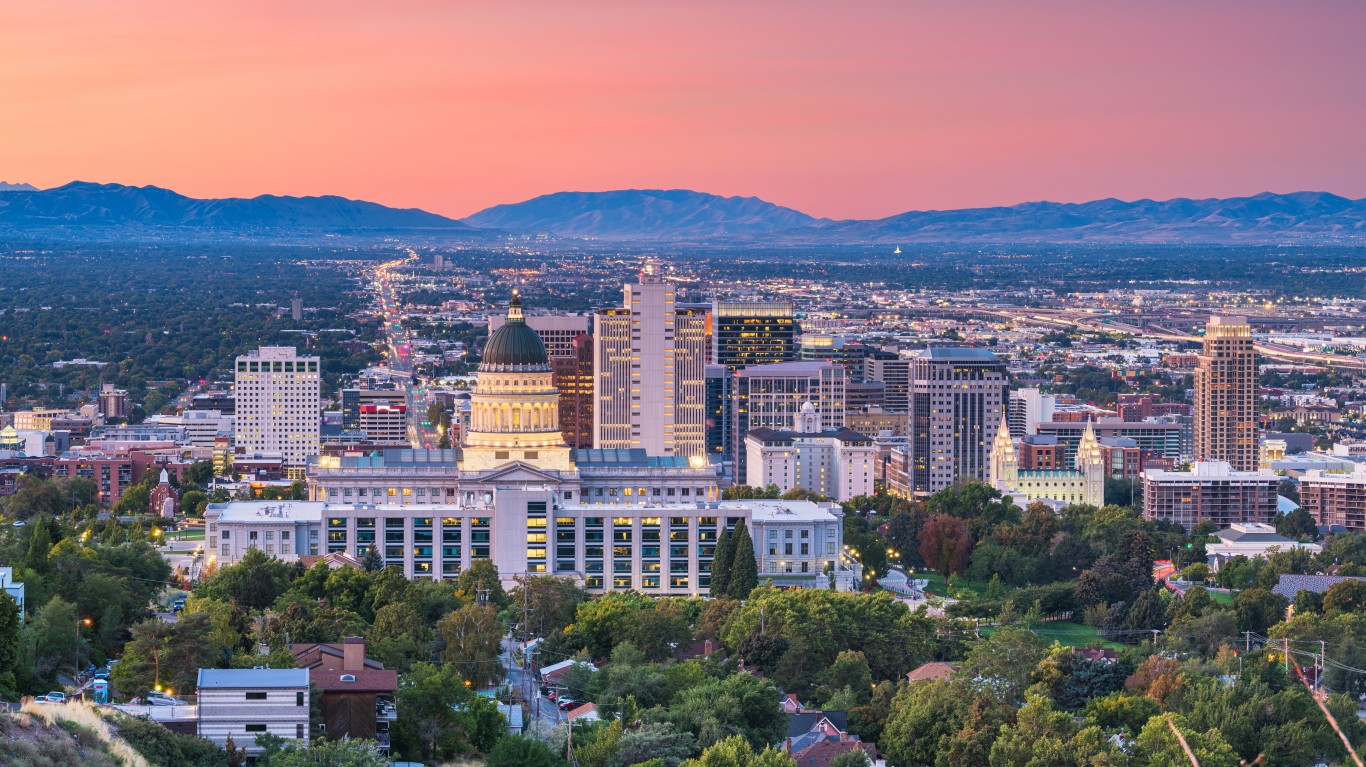
- Population change in downtown tracts, 2012 to 2022: +16.0%
- Population change of non-downtown tracts, 2012 to 2022: +5.1%
- Per capita income change in downtown tracts, 2012 to 2022: +43.4%
- Per capita income change in non-downtown tracts, 2012 to 2022: +32.9%
33. Palm Coast, Florida
- Population change in downtown tracts, 2012 to 2022: +16.4%
- Population change of non-downtown tracts, 2012 to 2022: +26.9%
- Per capita income change in downtown tracts, 2012 to 2022: +77.3%
- Per capita income change in non-downtown tracts, 2012 to 2022: +23.2%
32. Phoenix, Arizona
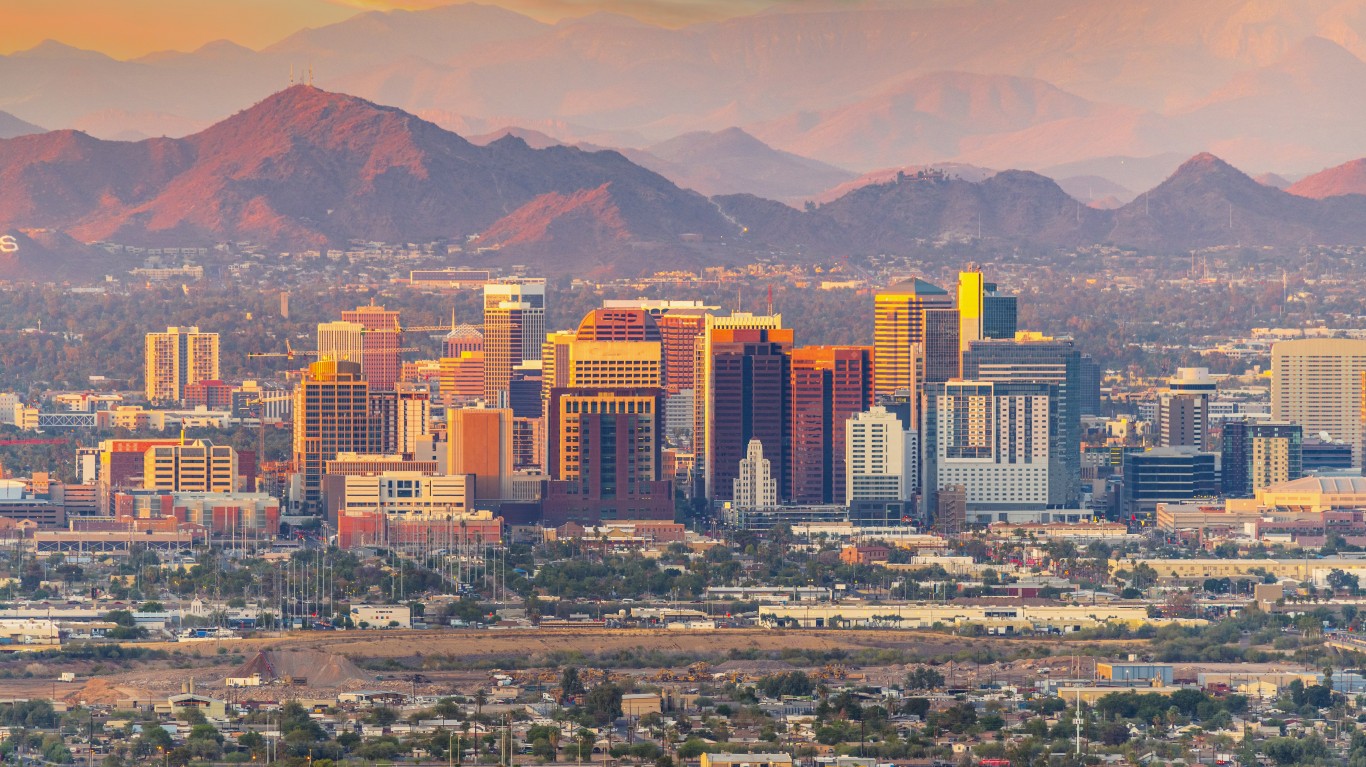
- Population change in downtown tracts, 2012 to 2022: +17.6%
- Population change of non-downtown tracts, 2012 to 2022: +7.1%
- Per capita income change in downtown tracts, 2012 to 2022: +74.4%
- Per capita income change in non-downtown tracts, 2012 to 2022: +21.6%
31. Philadelphia, Pennsylvania

- Population change in downtown tracts, 2012 to 2022: +17.8%
- Population change of non-downtown tracts, 2012 to 2022: +2.5%
- Per capita income change in downtown tracts, 2012 to 2022: +32.4%
- Per capita income change in non-downtown tracts, 2012 to 2022: +21.7%
30. Redding, California
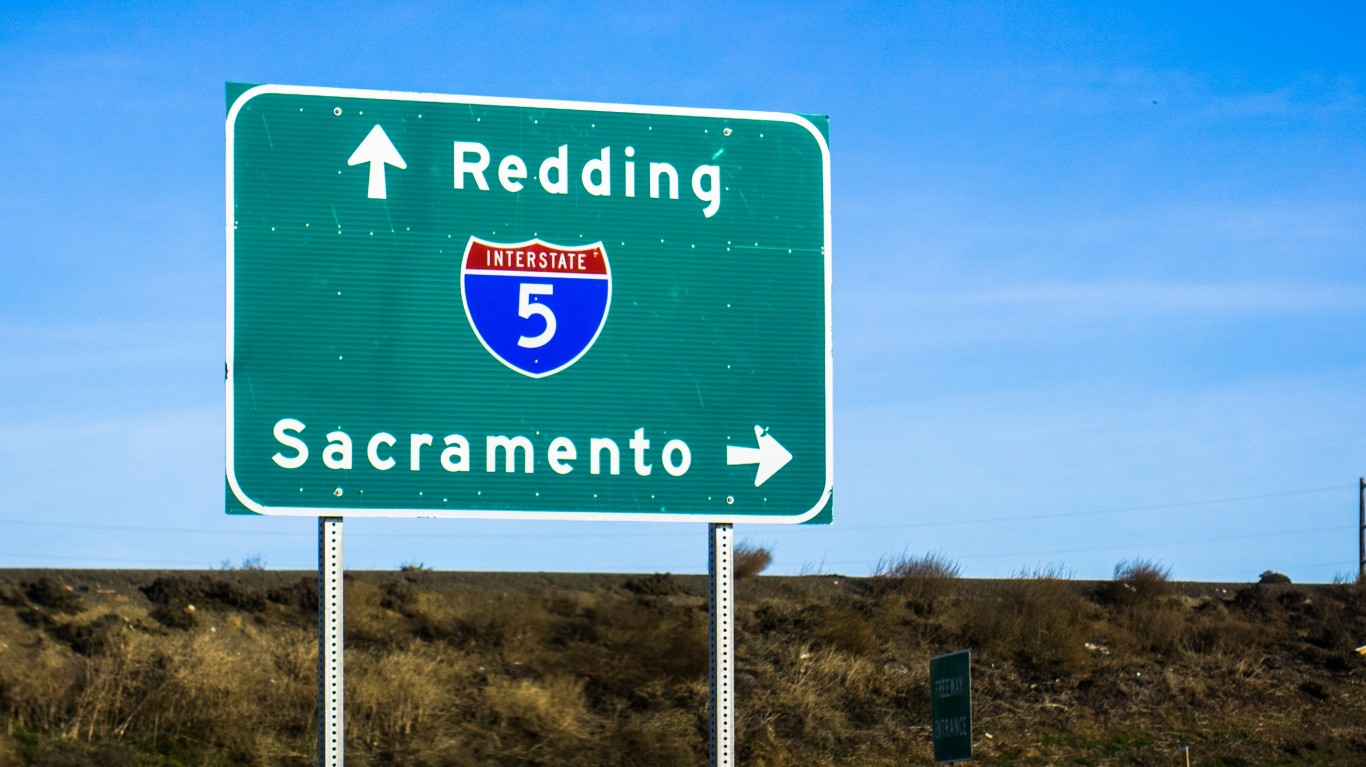
- Population change in downtown tracts, 2012 to 2022: +18.0%
- Population change of non-downtown tracts, 2012 to 2022: +1.3%
- Per capita income change in downtown tracts, 2012 to 2022: +2.0%
- Per capita income change in non-downtown tracts, 2012 to 2022: +21.8%
29. Bremerton, Washington
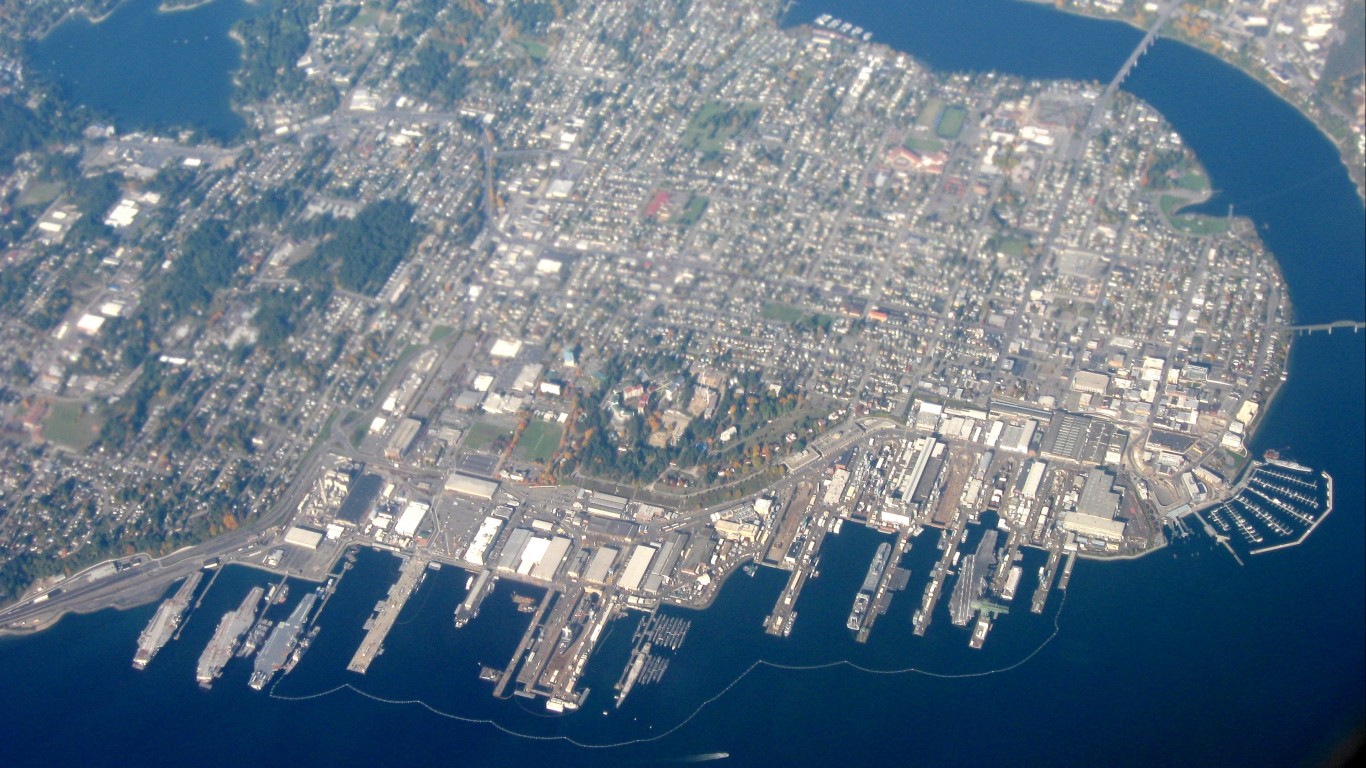
- Population change in downtown tracts, 2012 to 2022: +18.1%
- Population change of non-downtown tracts, 2012 to 2022: +6.6%
- Per capita income change in downtown tracts, 2012 to 2022: +31.0%
- Per capita income change in non-downtown tracts, 2012 to 2022: +26.5%
28. Punta Gorda, Florida
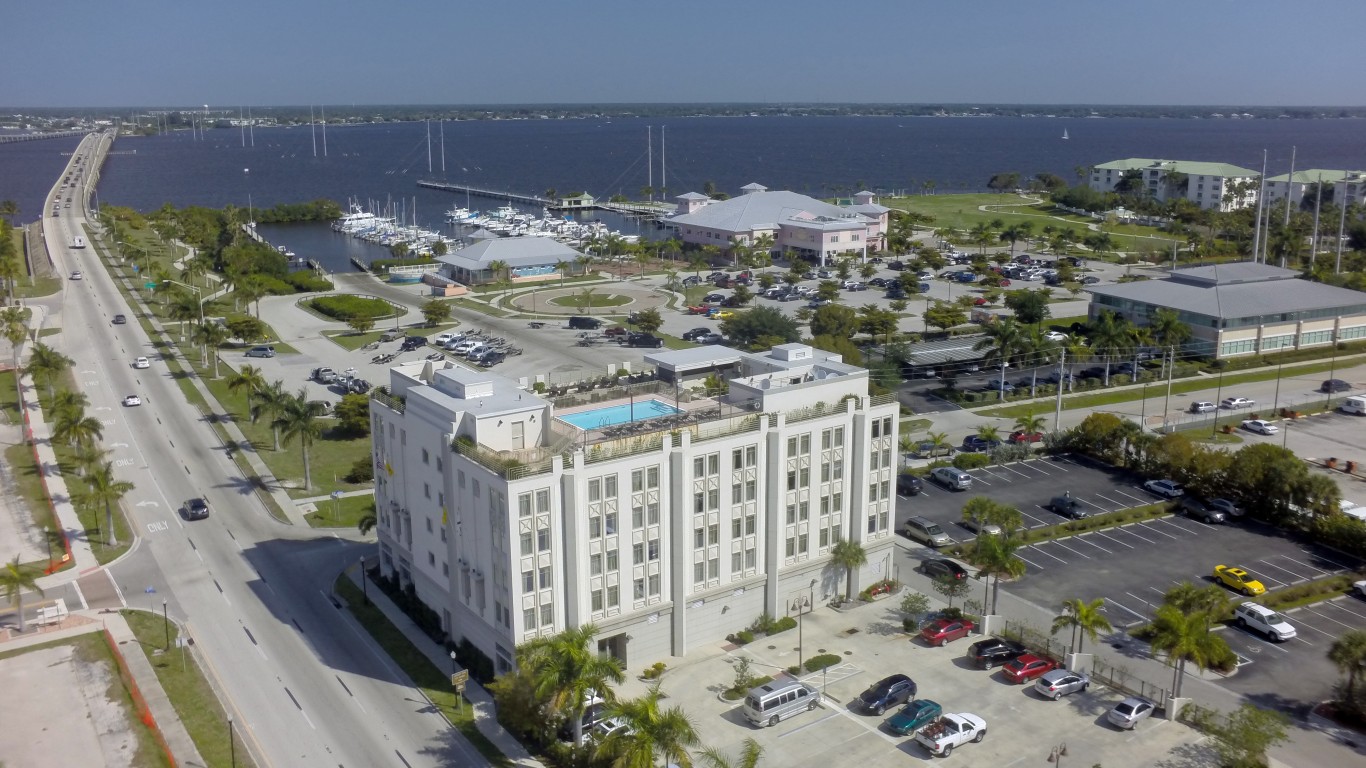
- Population change in downtown tracts, 2012 to 2022: +18.4%
- Population change of non-downtown tracts, 2012 to 2022: +5.5%
- Per capita income change in downtown tracts, 2012 to 2022: -8.4%
- Per capita income change in non-downtown tracts, 2012 to 2022: +36.2%
27. Sacramento, California
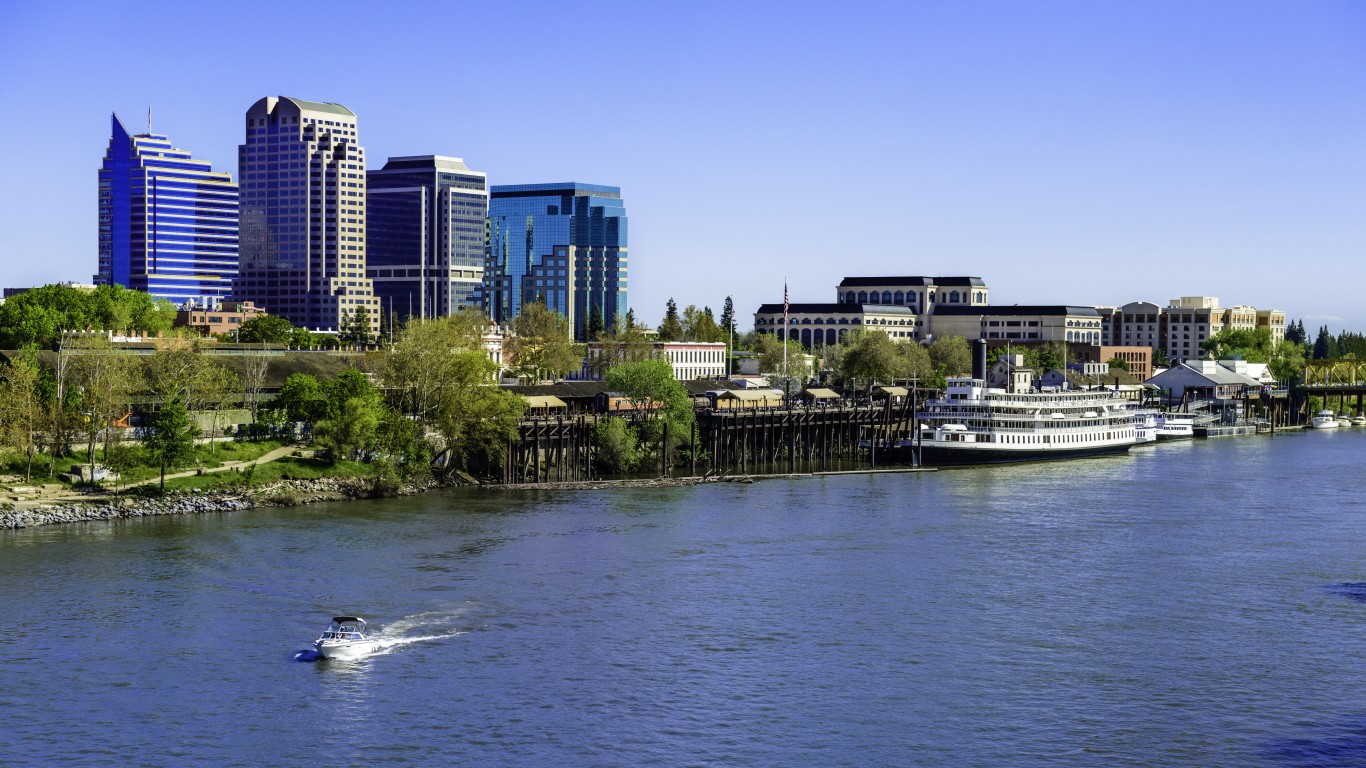
- Population change in downtown tracts, 2012 to 2022: +19.2%
- Population change of non-downtown tracts, 2012 to 2022: +9.0%
- Per capita income change in downtown tracts, 2012 to 2022: +37.7%
- Per capita income change in non-downtown tracts, 2012 to 2022: +21.5%
26. Cincinnati, Ohio
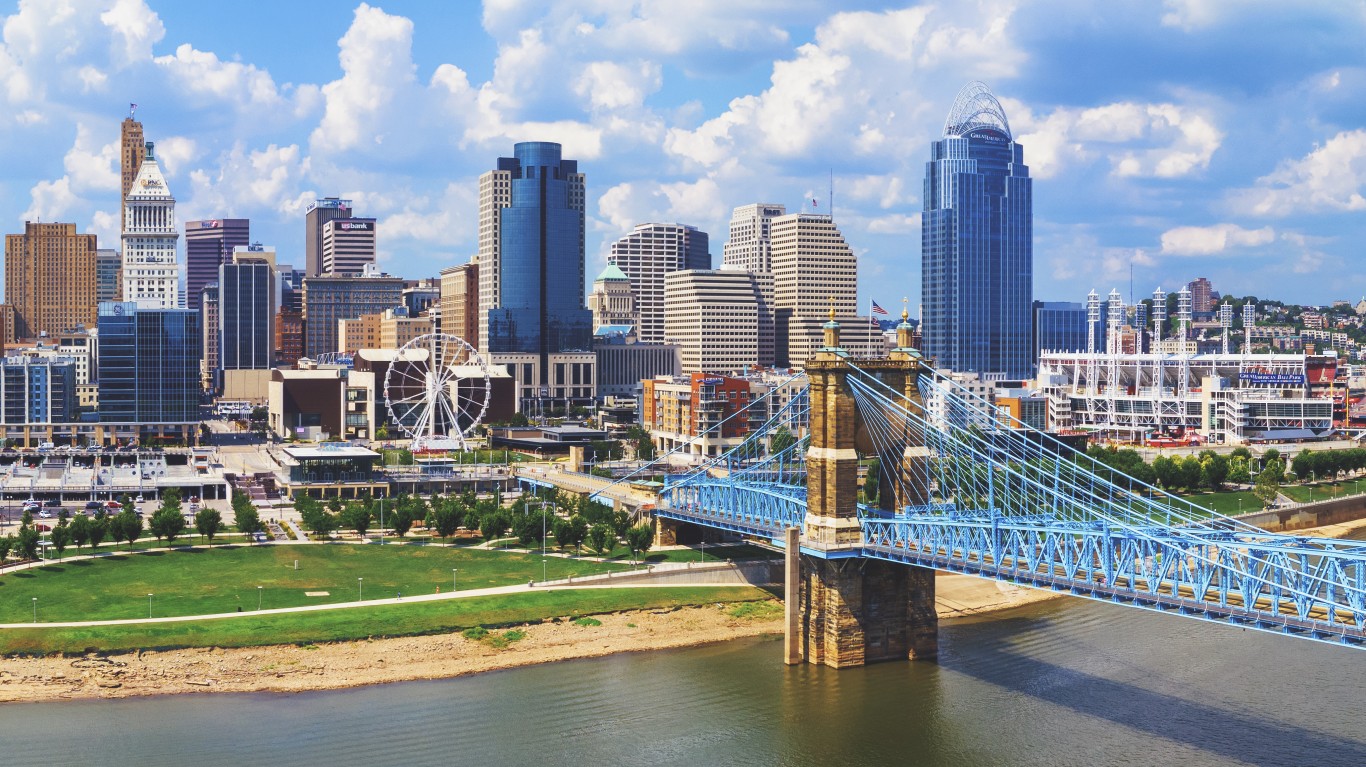
- Population change in downtown tracts, 2012 to 2022: +19.9%
- Population change of non-downtown tracts, 2012 to 2022: +3.0%
- Per capita income change in downtown tracts, 2012 to 2022: +55.2%
- Per capita income change in non-downtown tracts, 2012 to 2022: +13.9%
25. Winston-Salem, North Carolina
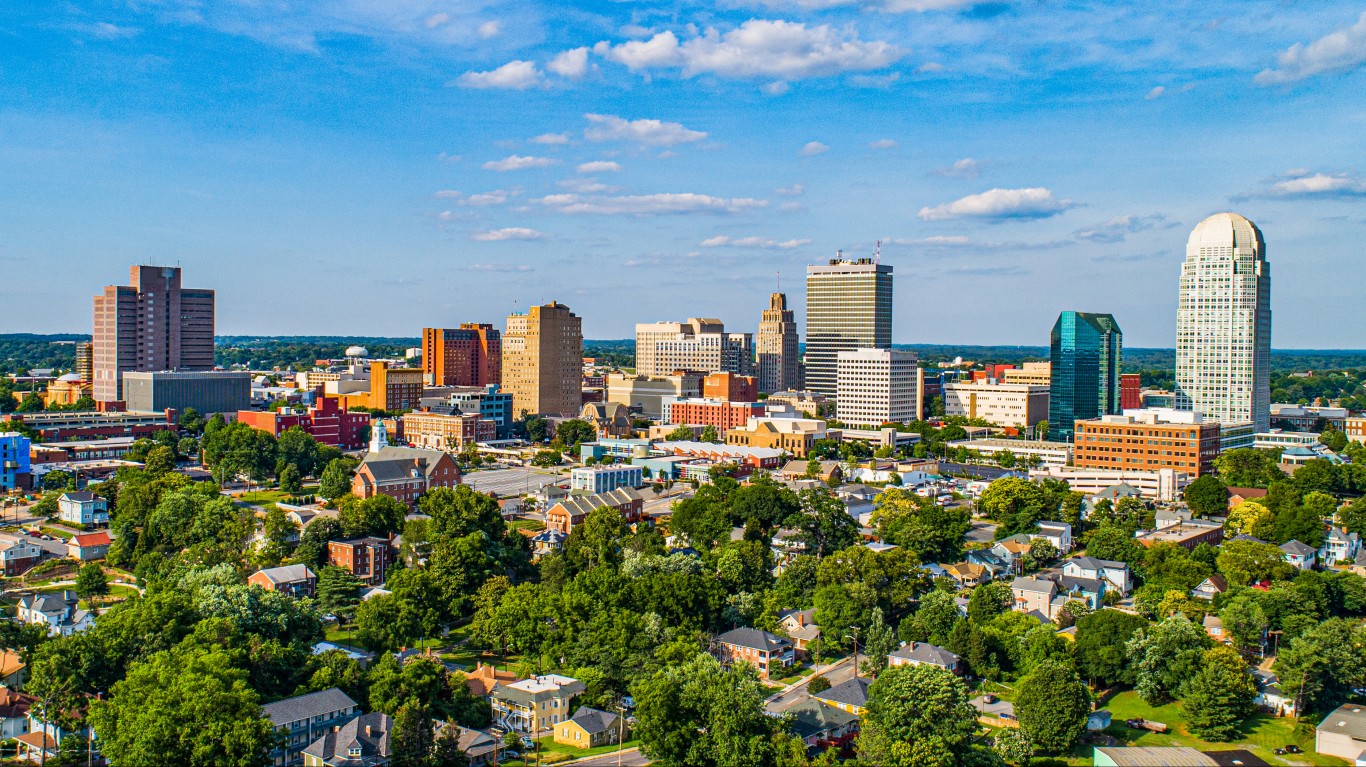
- Population change in downtown tracts, 2012 to 2022: +20.5%
- Population change of non-downtown tracts, 2012 to 2022: +7.1%
- Per capita income change in downtown tracts, 2012 to 2022: +35.8%
- Per capita income change in non-downtown tracts, 2012 to 2022: +5.2%
24. Detroit, Michigan
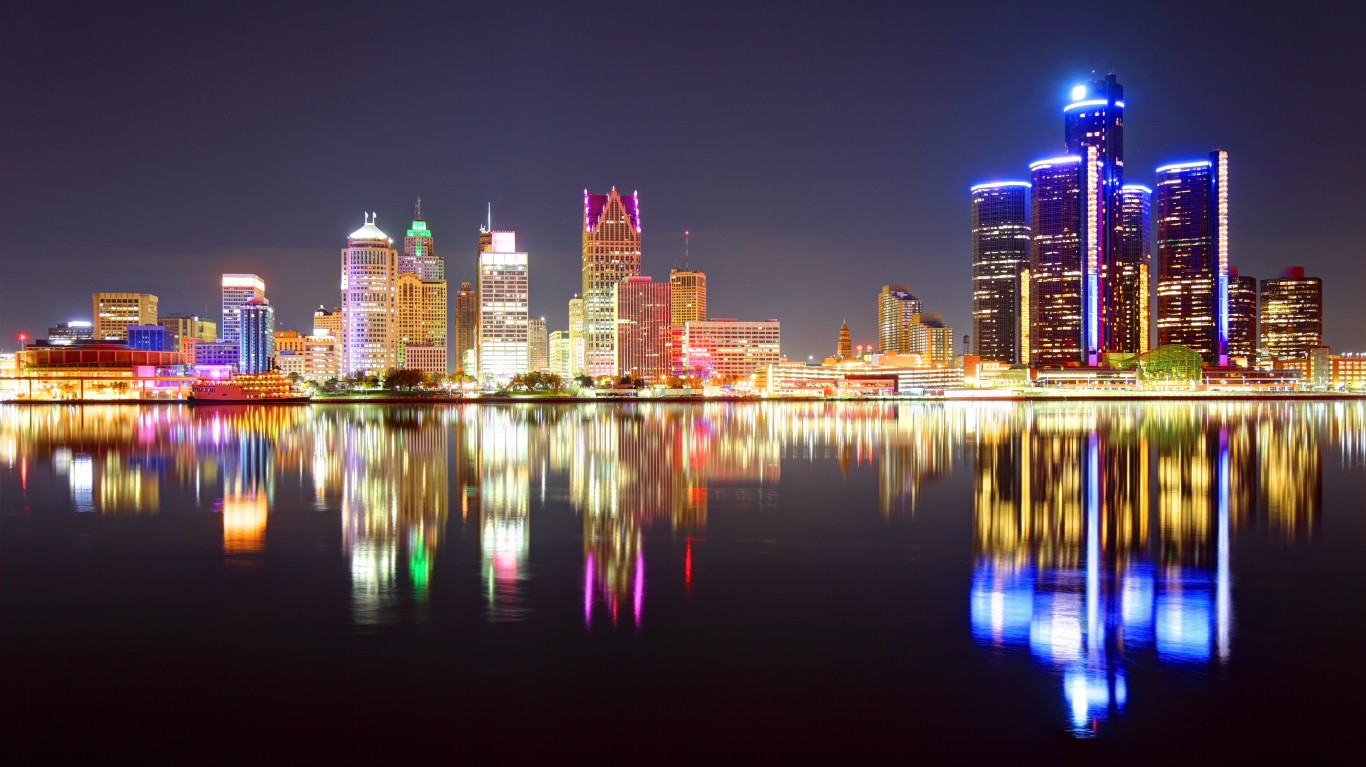
- Population change in downtown tracts, 2012 to 2022: +20.8%
- Population change of non-downtown tracts, 2012 to 2022: -11.3%
- Per capita income change in downtown tracts, 2012 to 2022: +67.8%
- Per capita income change in non-downtown tracts, 2012 to 2022: +17.1%
23. Greensboro, North Carolina
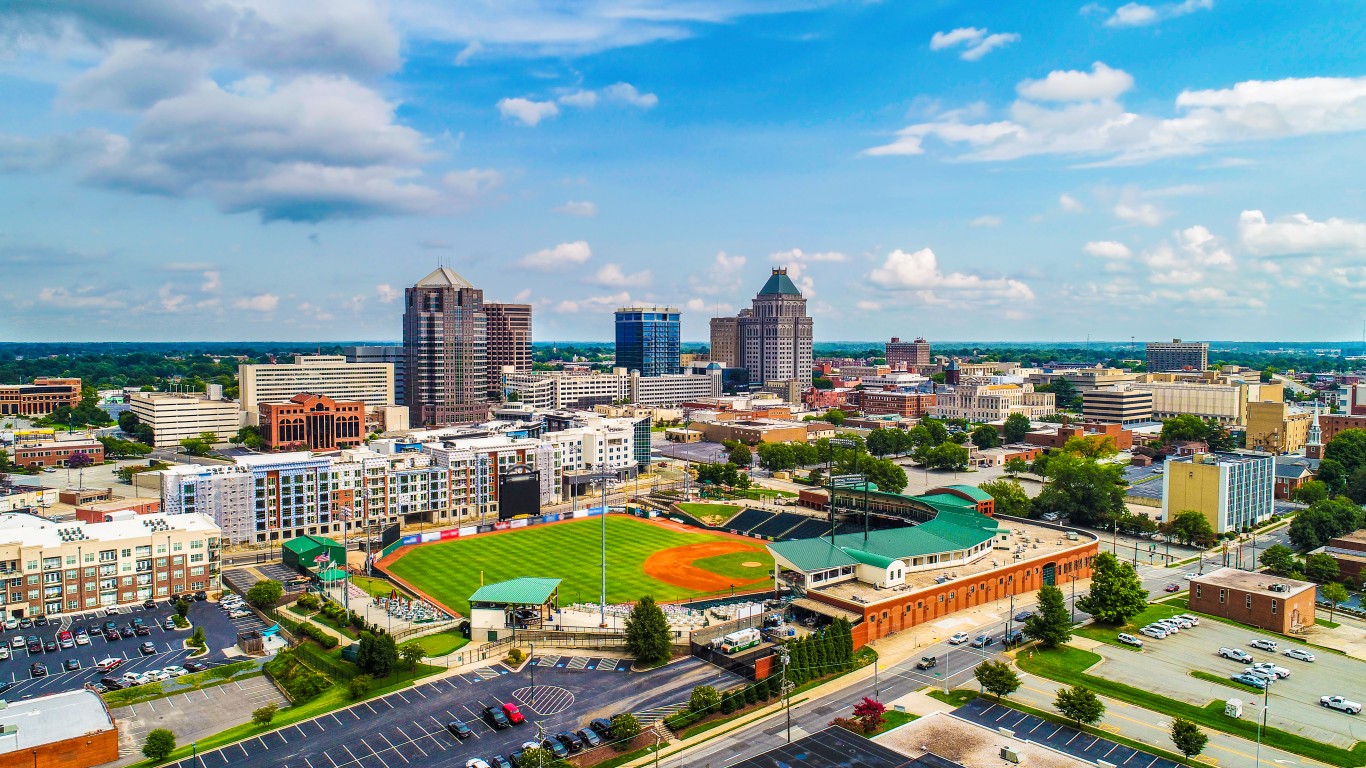
- Population change in downtown tracts, 2012 to 2022: +21.6%
- Population change of non-downtown tracts, 2012 to 2022: +4.0%
- Per capita income change in downtown tracts, 2012 to 2022: +17.4%
- Per capita income change in non-downtown tracts, 2012 to 2022: +6.2%
22. Columbus, Ohio

- Population change in downtown tracts, 2012 to 2022: +23.0%
- Population change of non-downtown tracts, 2012 to 2022: +11.6%
- Per capita income change in downtown tracts, 2012 to 2022: +34.3%
- Per capita income change in non-downtown tracts, 2012 to 2022: +17.8%
21. Atlanta, Georgia
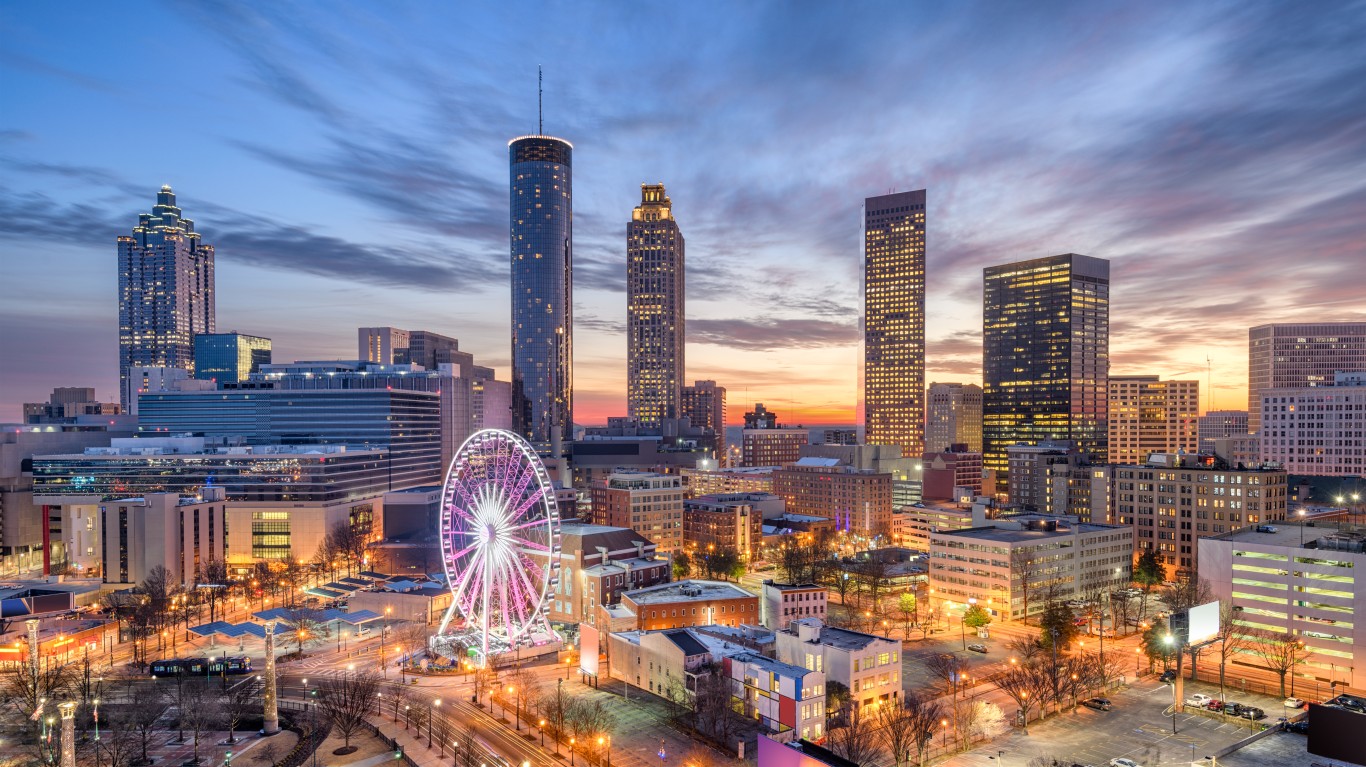
- Population change in downtown tracts, 2012 to 2022: +23.4%
- Population change of non-downtown tracts, 2012 to 2022: +5.3%
- Per capita income change in downtown tracts, 2012 to 2022: +31.3%
- Per capita income change in non-downtown tracts, 2012 to 2022: +38.6%
20. Lewiston, Idaho
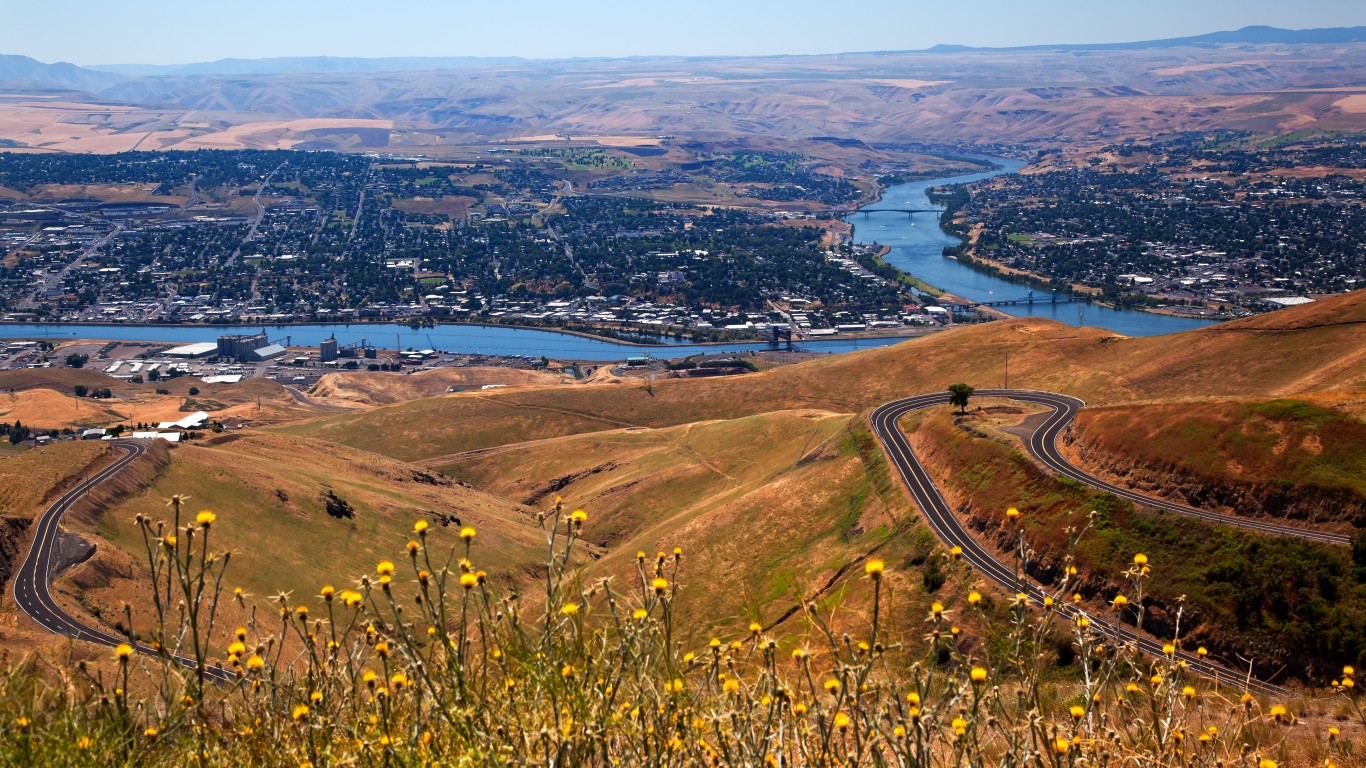
- Population change in downtown tracts, 2012 to 2022: +23.8%
- Population change of non-downtown tracts, 2012 to 2022: +2.7%
- Per capita income change in downtown tracts, 2012 to 2022: -9.4%
- Per capita income change in non-downtown tracts, 2012 to 2022: +23.5%
19. Denver, Colorado
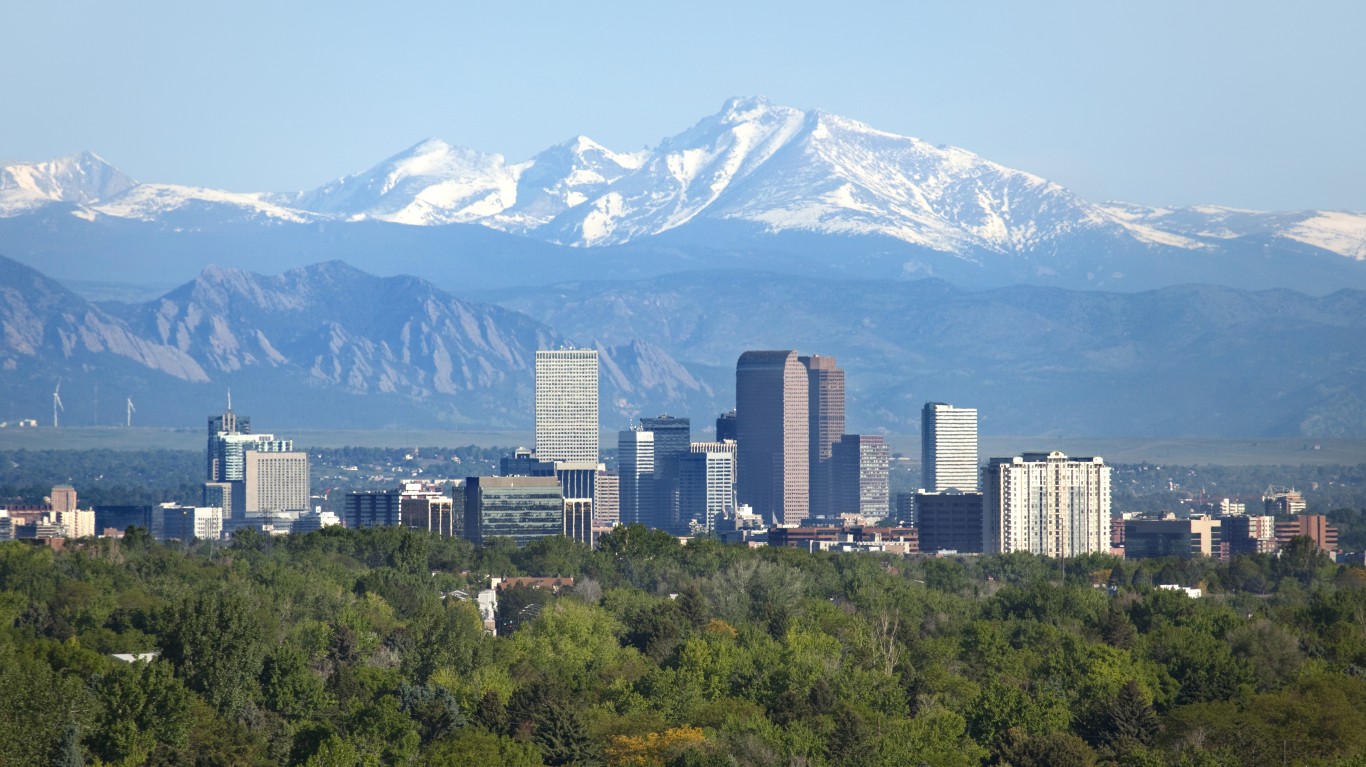
- Population change in downtown tracts, 2012 to 2022: +23.8%
- Population change of non-downtown tracts, 2012 to 2022: +11.0%
- Per capita income change in downtown tracts, 2012 to 2022: +26.2%
- Per capita income change in non-downtown tracts, 2012 to 2022: +35.8%
18. Columbus, Indiana
- Population change in downtown tracts, 2012 to 2022: +24.1%
- Population change of non-downtown tracts, 2012 to 2022: -0.2%
- Per capita income change in downtown tracts, 2012 to 2022: +26.7%
- Per capita income change in non-downtown tracts, 2012 to 2022: +9.0%
17. Ocala, Florida

- Population change in downtown tracts, 2012 to 2022: +24.2%
- Population change of non-downtown tracts, 2012 to 2022: +5.2%
- Per capita income change in downtown tracts, 2012 to 2022: -2.6%
- Per capita income change in non-downtown tracts, 2012 to 2022: +14.4%
16. Chattanooga, Tennessee
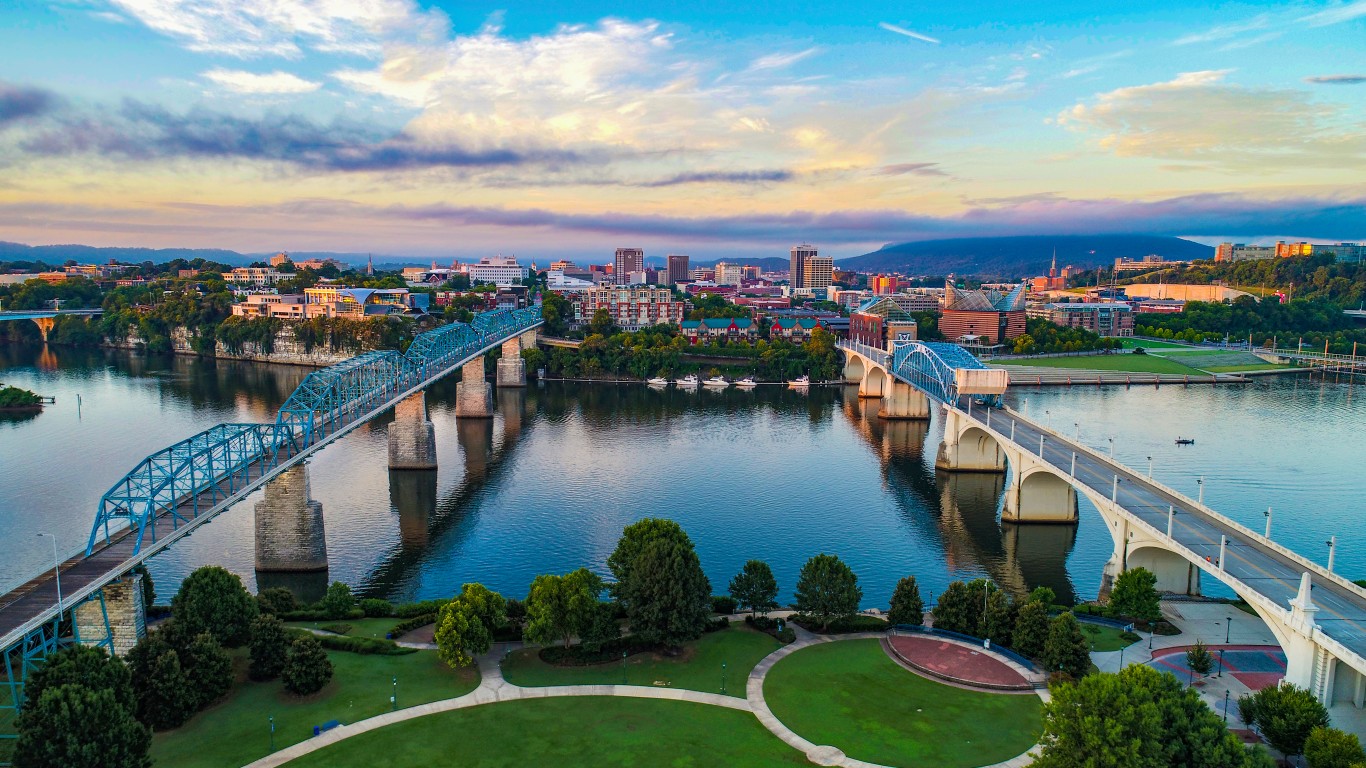
- Population change in downtown tracts, 2012 to 2022: +25.3%
- Population change of non-downtown tracts, 2012 to 2022: +3.6%
- Per capita income change in downtown tracts, 2012 to 2022: +89.9%
- Per capita income change in non-downtown tracts, 2012 to 2022: +19.1%
15. Greenville, South Carolina
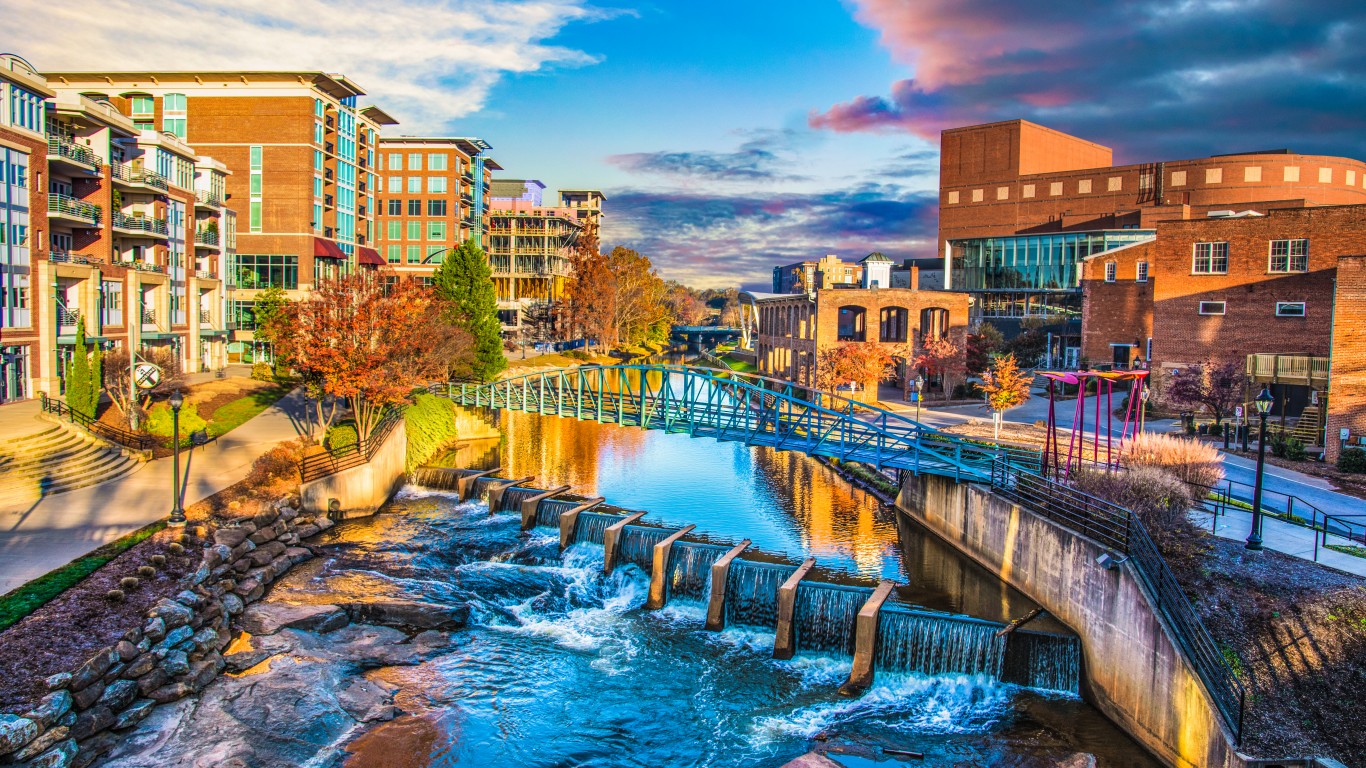
- Population change in downtown tracts, 2012 to 2022: +26.1%
- Population change of non-downtown tracts, 2012 to 2022: +10.3%
- Per capita income change in downtown tracts, 2012 to 2022: +49.1%
- Per capita income change in non-downtown tracts, 2012 to 2022: +37.4%
14. Tampa, Florida
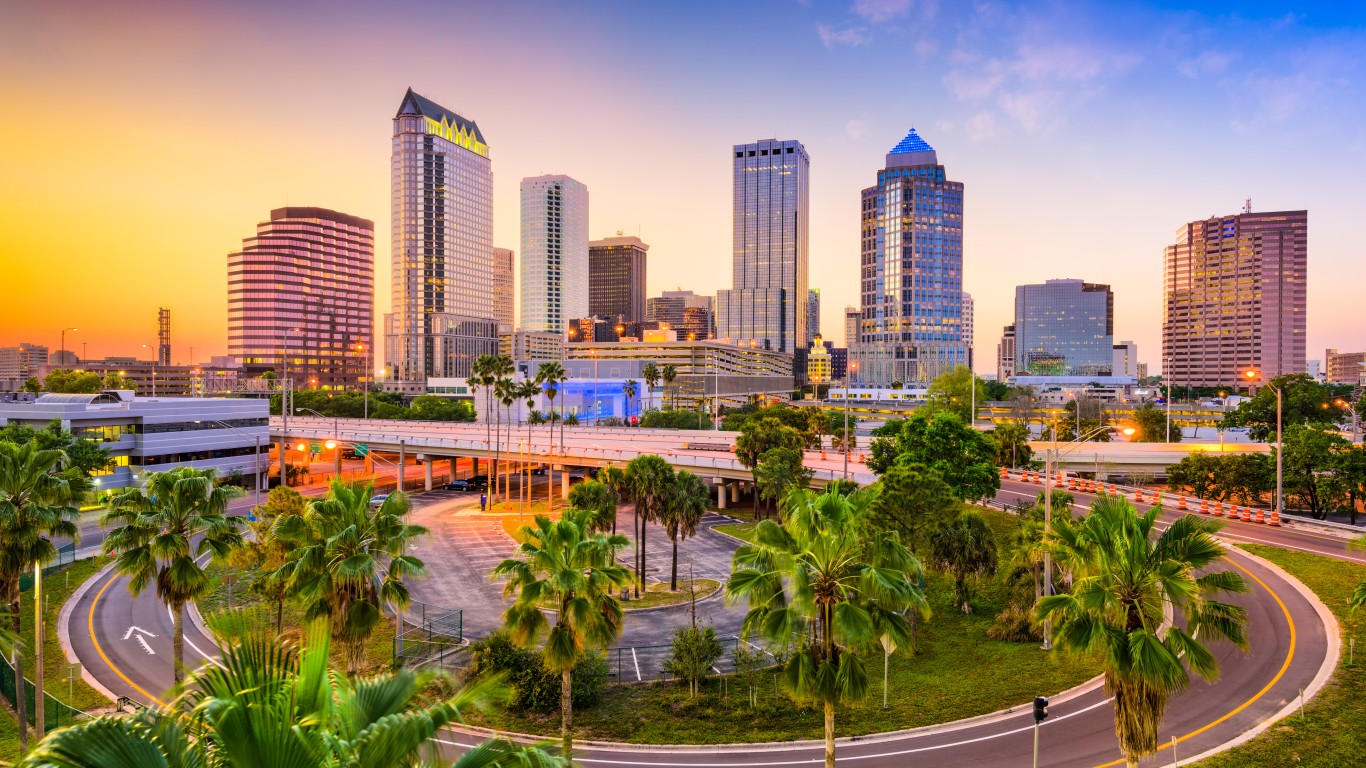
- Population change in downtown tracts, 2012 to 2022: +27.1%
- Population change of non-downtown tracts, 2012 to 2022: +10.5%
- Per capita income change in downtown tracts, 2012 to 2022: +39.8%
- Per capita income change in non-downtown tracts, 2012 to 2022: +21.2%
13. Kansas City, Missouri
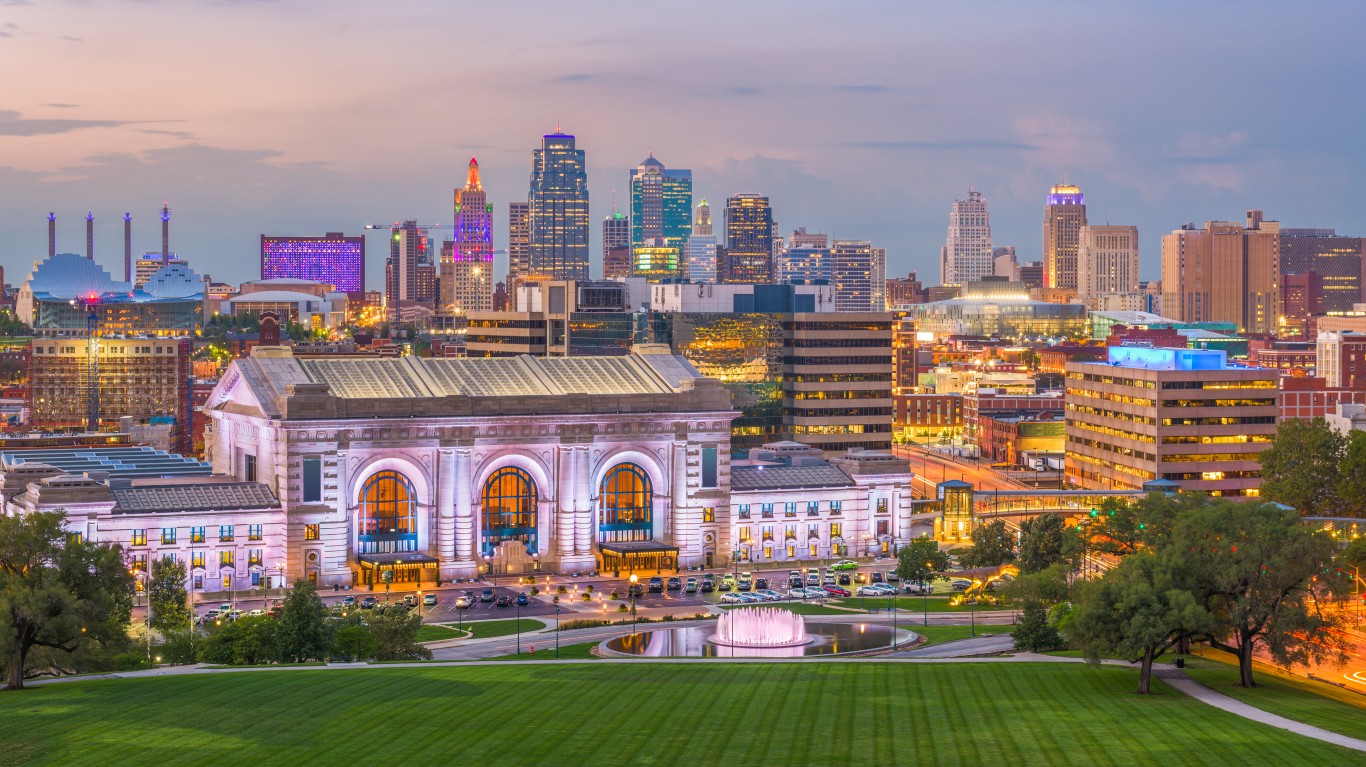
- Population change in downtown tracts, 2012 to 2022: +27.3%
- Population change of non-downtown tracts, 2012 to 2022: +6.3%
- Per capita income change in downtown tracts, 2012 to 2022: +37.7%
- Per capita income change in non-downtown tracts, 2012 to 2022: +12.8%
12. Tuscaloosa, Alabama
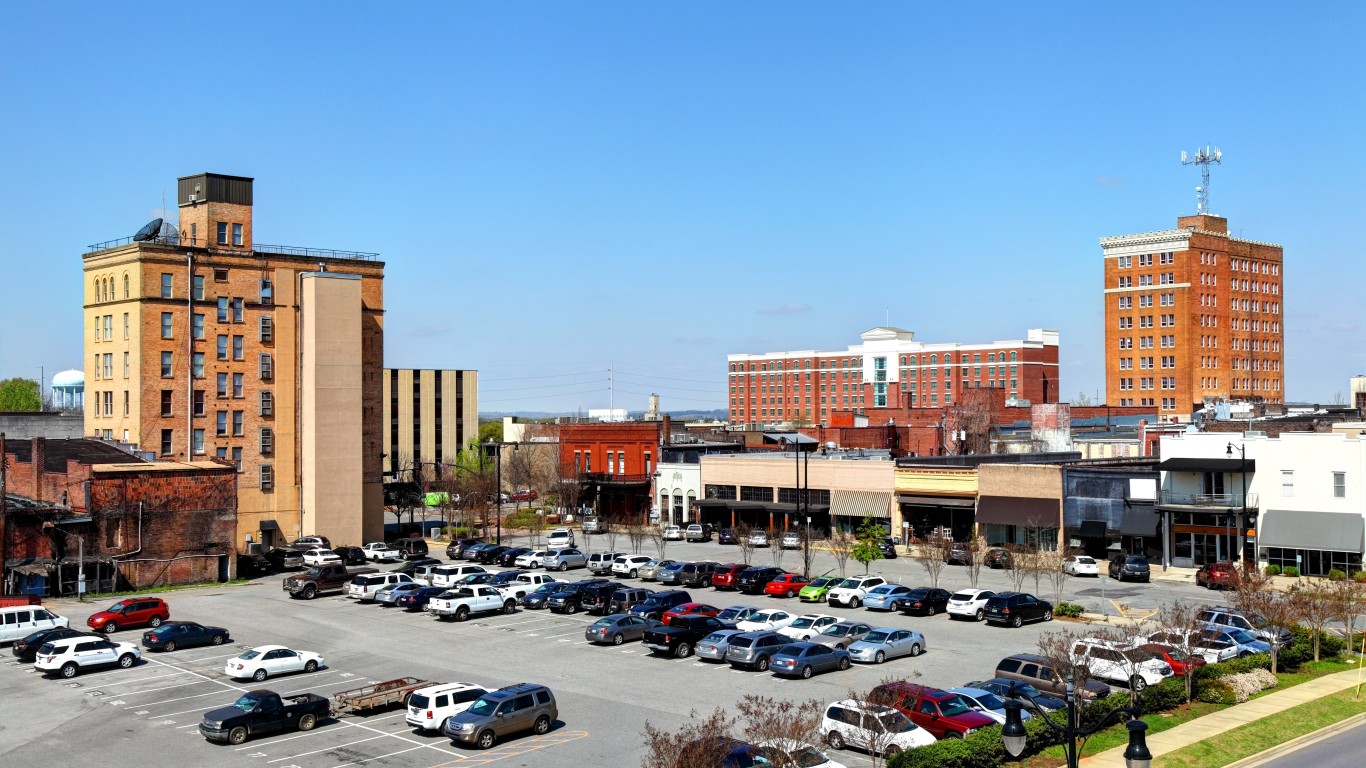
- Population change in downtown tracts, 2012 to 2022: +27.7%
- Population change of non-downtown tracts, 2012 to 2022: +27.9%
- Per capita income change in downtown tracts, 2012 to 2022: +27.1%
- Per capita income change in non-downtown tracts, 2012 to 2022: +9.0%
11. Durham, North Carolina
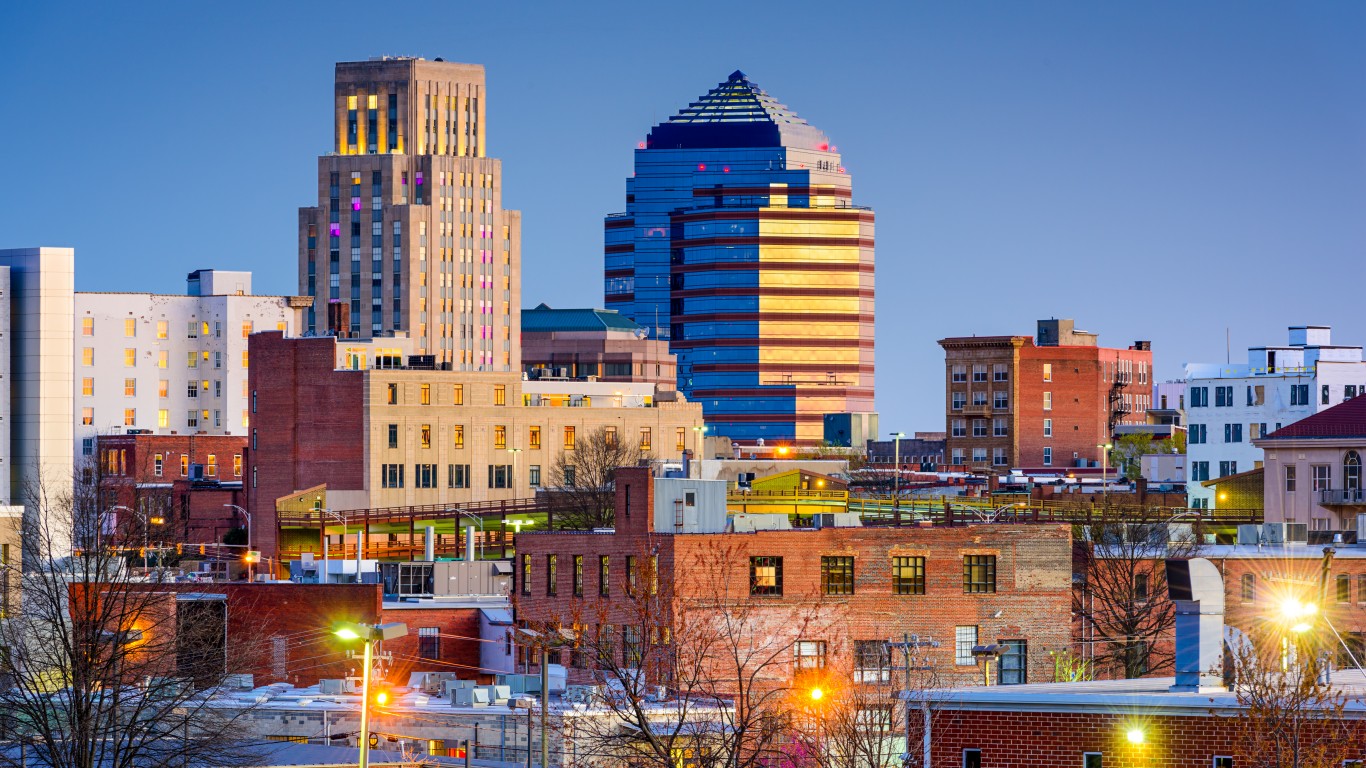
- Population change in downtown tracts, 2012 to 2022: +27.9%
- Population change of non-downtown tracts, 2012 to 2022: +14.4%
- Per capita income change in downtown tracts, 2012 to 2022: +52.9%
- Per capita income change in non-downtown tracts, 2012 to 2022: +18.9%
10. Seattle, Washington
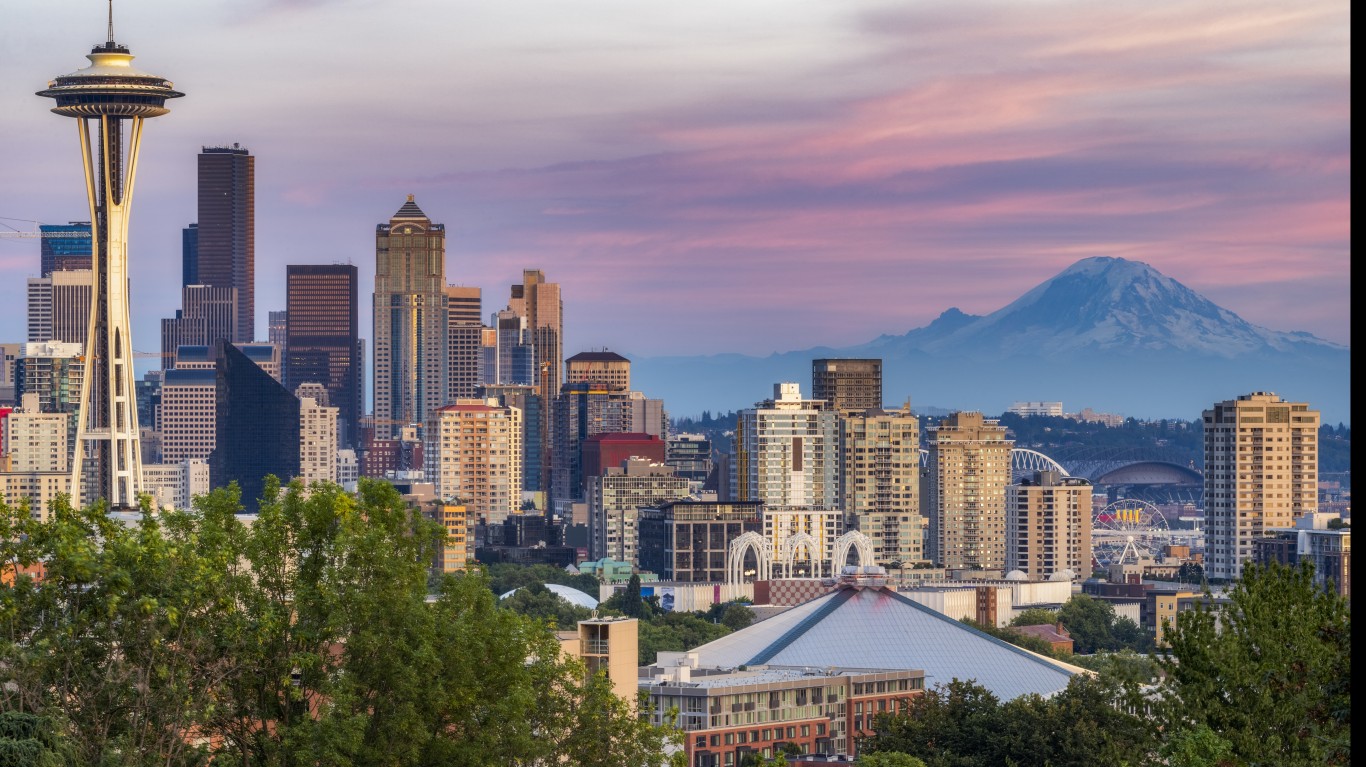
- Population change in downtown tracts, 2012 to 2022: +28.3%
- Population change of non-downtown tracts, 2012 to 2022: +12.9%
- Per capita income change in downtown tracts, 2012 to 2022: +64.5%
- Per capita income change in non-downtown tracts, 2012 to 2022: +39.7%
9. Madison, Wisconsin
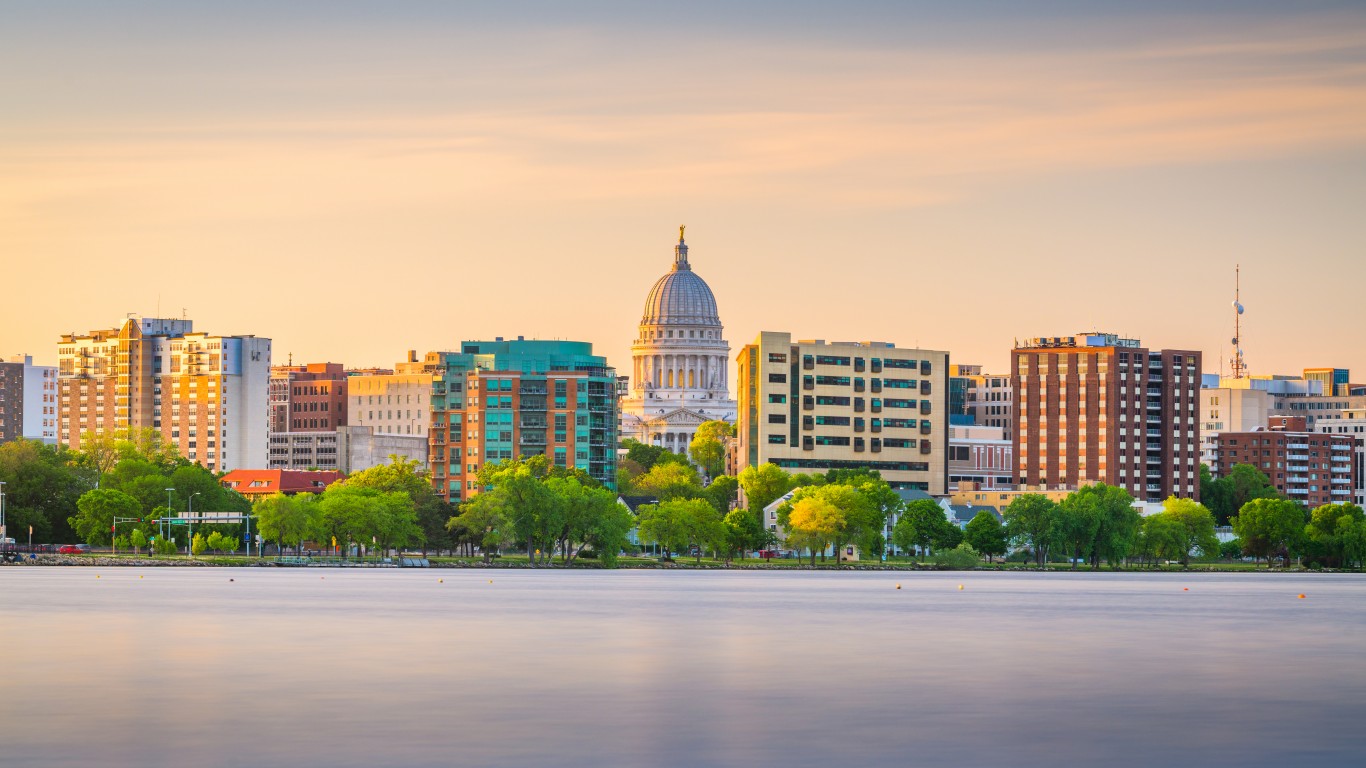
- Population change in downtown tracts, 2012 to 2022: +31.8%
- Population change of non-downtown tracts, 2012 to 2022: +5.6%
- Per capita income change in downtown tracts, 2012 to 2022: +28.4%
- Per capita income change in non-downtown tracts, 2012 to 2022: +12.4%
8. Little Rock, Arkansas

- Population change in downtown tracts, 2012 to 2022: +31.9%
- Population change of non-downtown tracts, 2012 to 2022: +2.3%
- Per capita income change in downtown tracts, 2012 to 2022: +69.6%
- Per capita income change in non-downtown tracts, 2012 to 2022: +10.8%
7. Dallas, Texas

- Population change in downtown tracts, 2012 to 2022: +33.3%
- Population change of non-downtown tracts, 2012 to 2022: +5.7%
- Per capita income change in downtown tracts, 2012 to 2022: +12.6%
- Per capita income change in non-downtown tracts, 2012 to 2022: +18.3%
6. Nashville, Tennessee

- Population change in downtown tracts, 2012 to 2022: +34.0%
- Population change of non-downtown tracts, 2012 to 2022: +10.5%
- Per capita income change in downtown tracts, 2012 to 2022: +87.2%
- Per capita income change in non-downtown tracts, 2012 to 2022: +24.9%
5. Chicago, Illinois
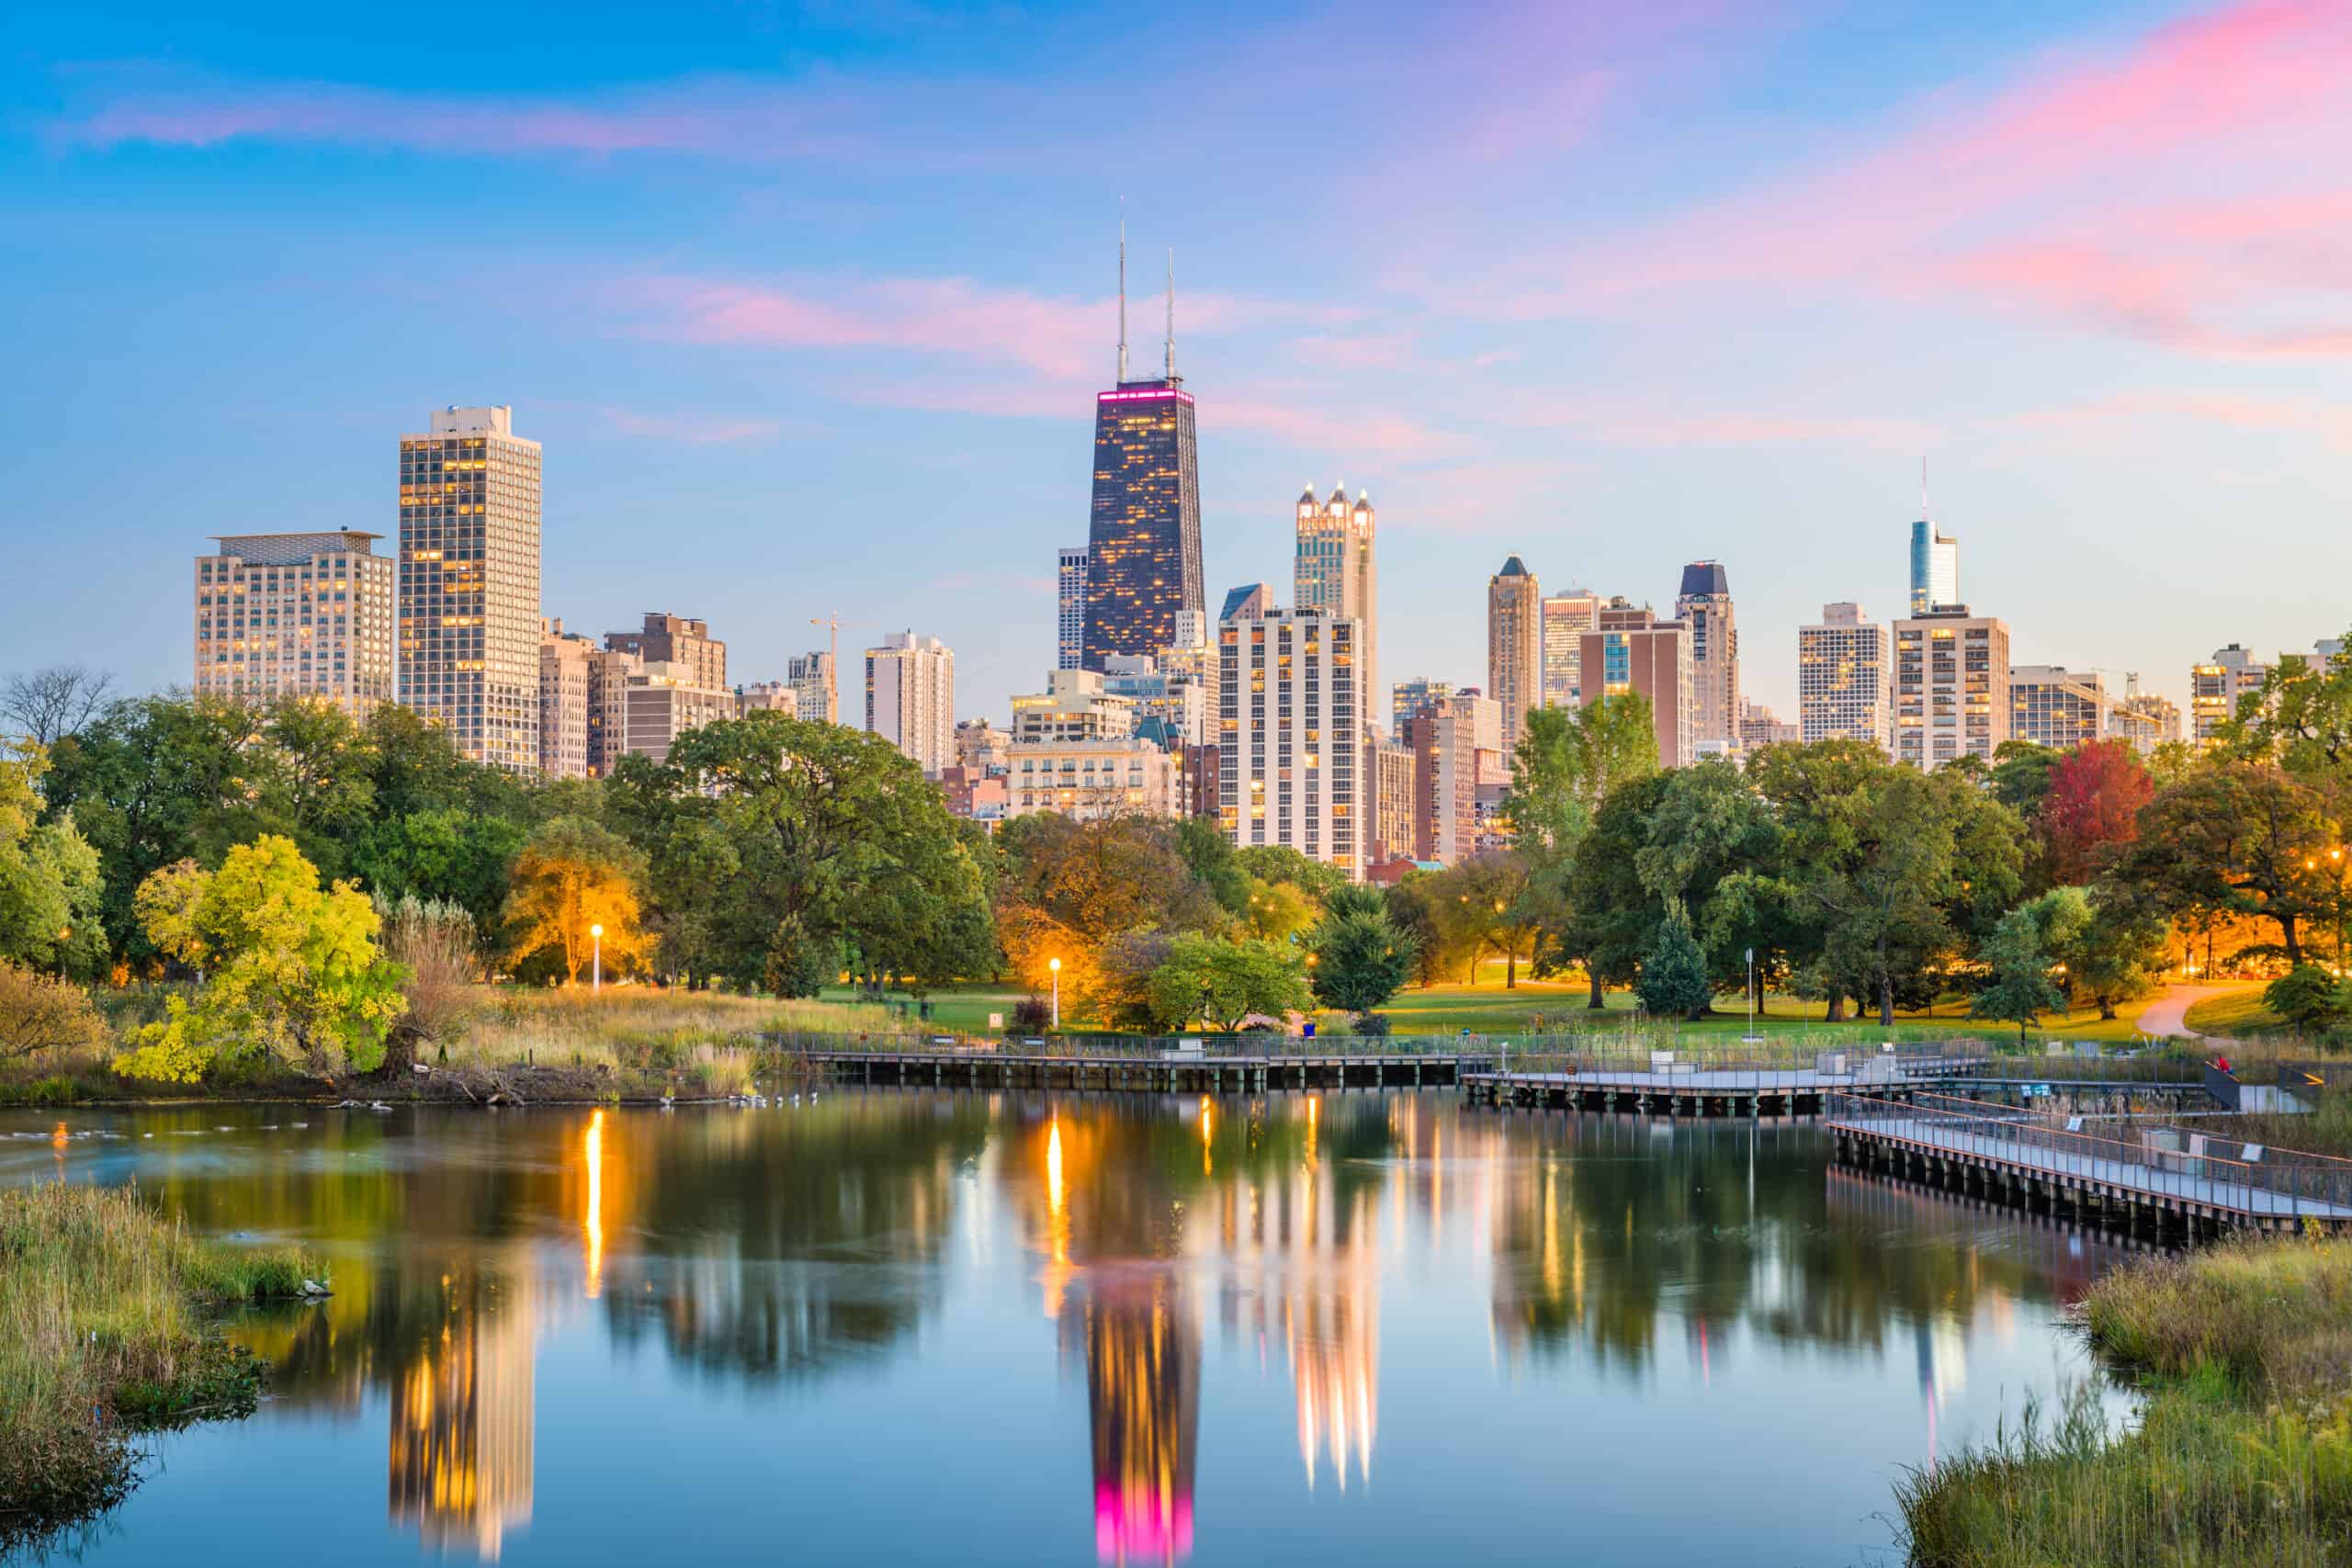
- Population change in downtown tracts, 2012 to 2022: +35.8%
- Population change of non-downtown tracts, 2012 to 2022: -1.3%
- Per capita income change in downtown tracts, 2012 to 2022: +5.0%
- Per capita income change in non-downtown tracts, 2012 to 2022: +27.2%
4. Barnstable Town, Massachusetts

- Population change in downtown tracts, 2012 to 2022: +37.7%
- Population change of non-downtown tracts, 2012 to 2022: +2.6%
- Per capita income change in downtown tracts, 2012 to 2022: +12.3%
- Per capita income change in non-downtown tracts, 2012 to 2022: +14.7%
3. Cleveland, Ohio
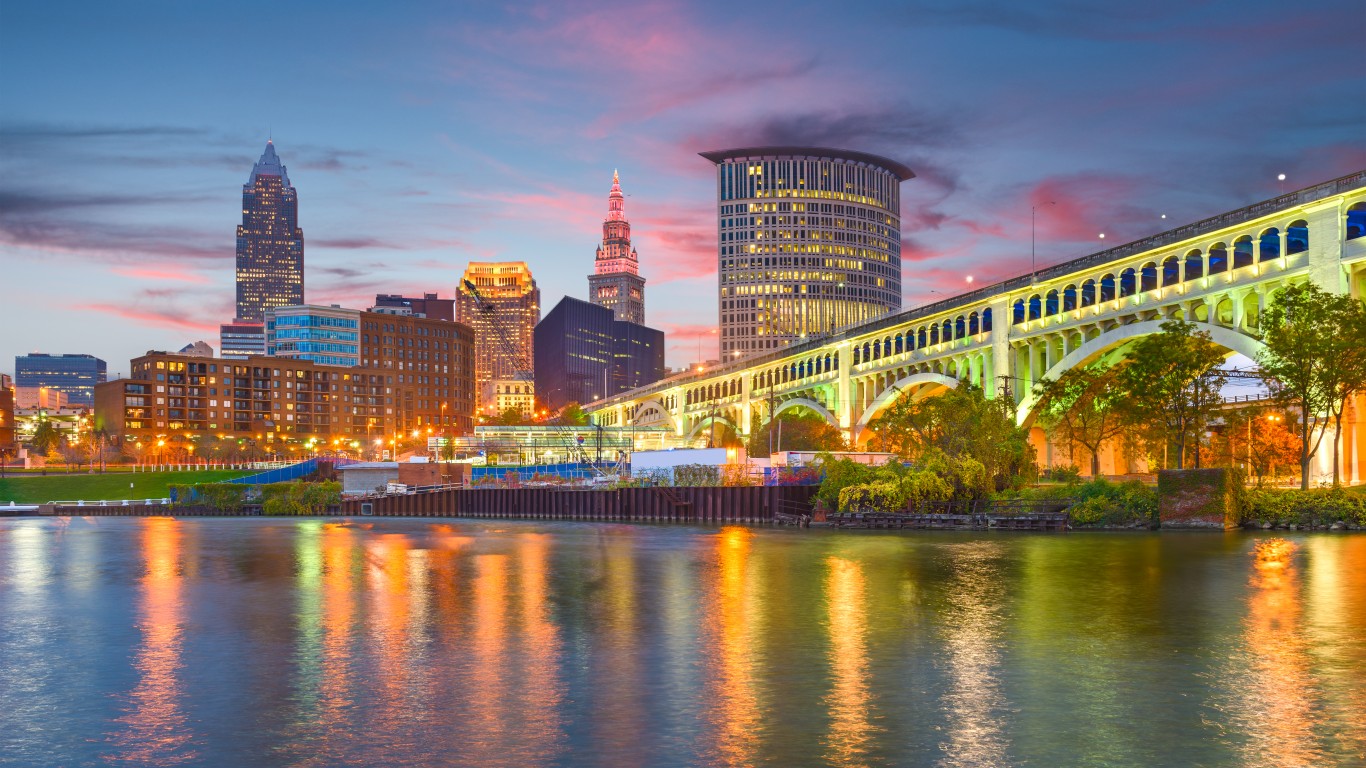
- Population change in downtown tracts, 2012 to 2022: +42.1%
- Population change of non-downtown tracts, 2012 to 2022: -8.4%
- Per capita income change in downtown tracts, 2012 to 2022: +17.9%
- Per capita income change in non-downtown tracts, 2012 to 2022: +15.5%
2. Charlotte, North Carolina
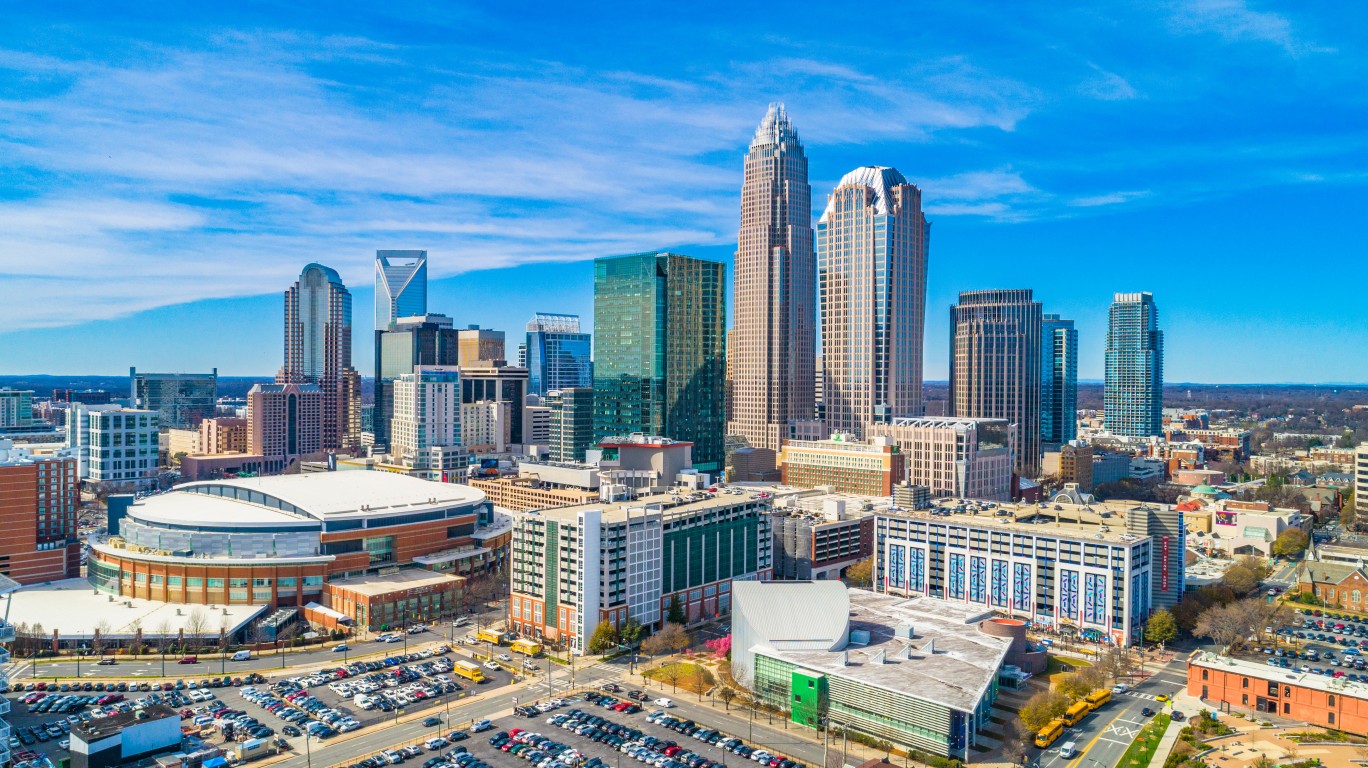
- Population change in downtown tracts, 2012 to 2022: +47.0%
- Population change of non-downtown tracts, 2012 to 2022: +11.8%
- Per capita income change in downtown tracts, 2012 to 2022: +29.7%
- Per capita income change in non-downtown tracts, 2012 to 2022: +19.3%
1. Flagstaff, Arizona
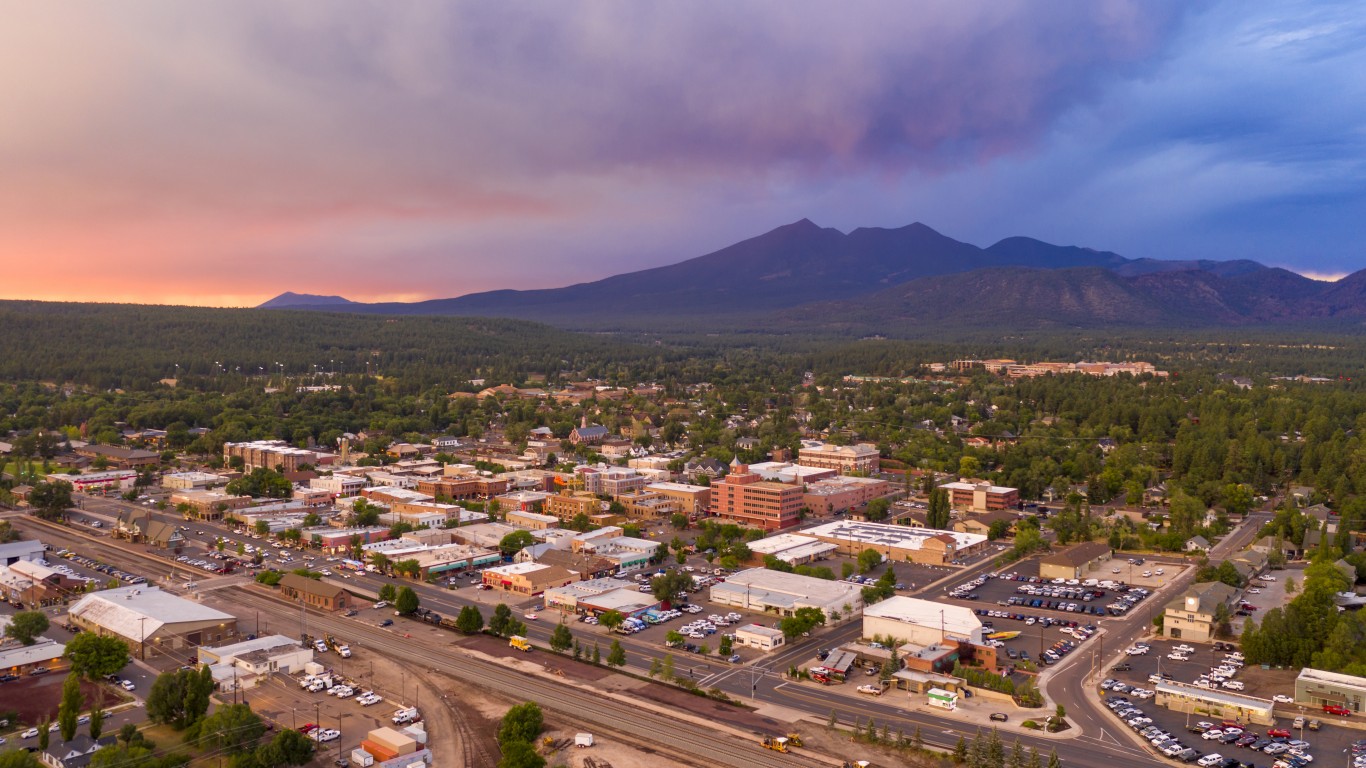
- Population change in downtown tracts, 2012 to 2022: +49.9%
- Population change of non-downtown tracts, 2012 to 2022: +1.3%
- Per capita income change in downtown tracts, 2012 to 2022: +8.4%
- Per capita income change in non-downtown tracts, 2012 to 2022: +22.0%
Want to Retire Early? Start Here (Sponsor)
Want retirement to come a few years earlier than you’d planned? Or are you ready to retire now, but want an extra set of eyes on your finances?
Now you can speak with up to 3 financial experts in your area for FREE. By simply clicking here you can begin to match with financial professionals who can help you build your plan to retire early. And the best part? The first conversation with them is free.
Click here to match with up to 3 financial pros who would be excited to help you make financial decisions.
Thank you for reading! Have some feedback for us?
Contact the 24/7 Wall St. editorial team.
Latest from 24/7