
Every year in the United States, tens of millions of Americans move to a new home. According to the U.S. Census Bureau, the bulk of these moves are motivated by personal circumstances, often relating to housing, family, or employment. But when it comes to deciding on a place to live, it can also be helpful to weigh other, less subjective factors.
As a means of gauging and comparing degrees of development between countries — beyond standard measures like gross domestic product and economic growth — the United Nations created the Human Development Index. By accounting for factors related to health and well-being, educational attainment, and standards of living, the HDI offers an assessment of overall quality of life at the individual level within a given geography.
When applied to communities within the United States, the core principles of the HDI reveal that some parts of the country are far better places to live than others.
Using an index inspired by the HDI, 24/7 Wall St. identified the best counties in Georgia to live in. Counties are ranked on a combination of three measures – average life expectancy at birth, the share of adults with a bachelor’s degree or higher, and the poverty rate. Of the 158 counties in Georgia with sufficient data, we ranked the 30 with the highest HDI score.
Across all of Georgia, average life expectancy at birth is 77.3 years. Additionally, 13.5% of the population live below the poverty line and 33.6% of adults have a bachelor’s degree or higher. Of the 30 counties on this list, 11 compare favorably to the state as a whole in each of these metrics.
Among these 30 Georgia counties, average life expectancy at birth ranges from 75.4 years to 82.3 years. Meanwhile, poverty rates vary between 4.5% and 26.6%, and bachelor’s degree attainment rates range from about 23% to over 55%.
Data used to calculate rankings are from the U.S. Census Bureau’s 2022 American Community Survey and County Health Rankings & Roadmaps, a joint program of the Robert Wood Johnson Foundation and the University of Wisconsin Population Health Institute. All ACS data are five-year averages.
Why It Matters

Many of the most commonly cited economic indicators — including unemployment, GDP, and industrial output — are useful gauges of prosperity and productive capacity in a given area. But when it comes to measuring overall quality of life, any single metric inevitably falls short. To address these shortcomings, the HDI combines three key social and economic measures into a single index score, allowing for objective comparisons between communities across the United States.
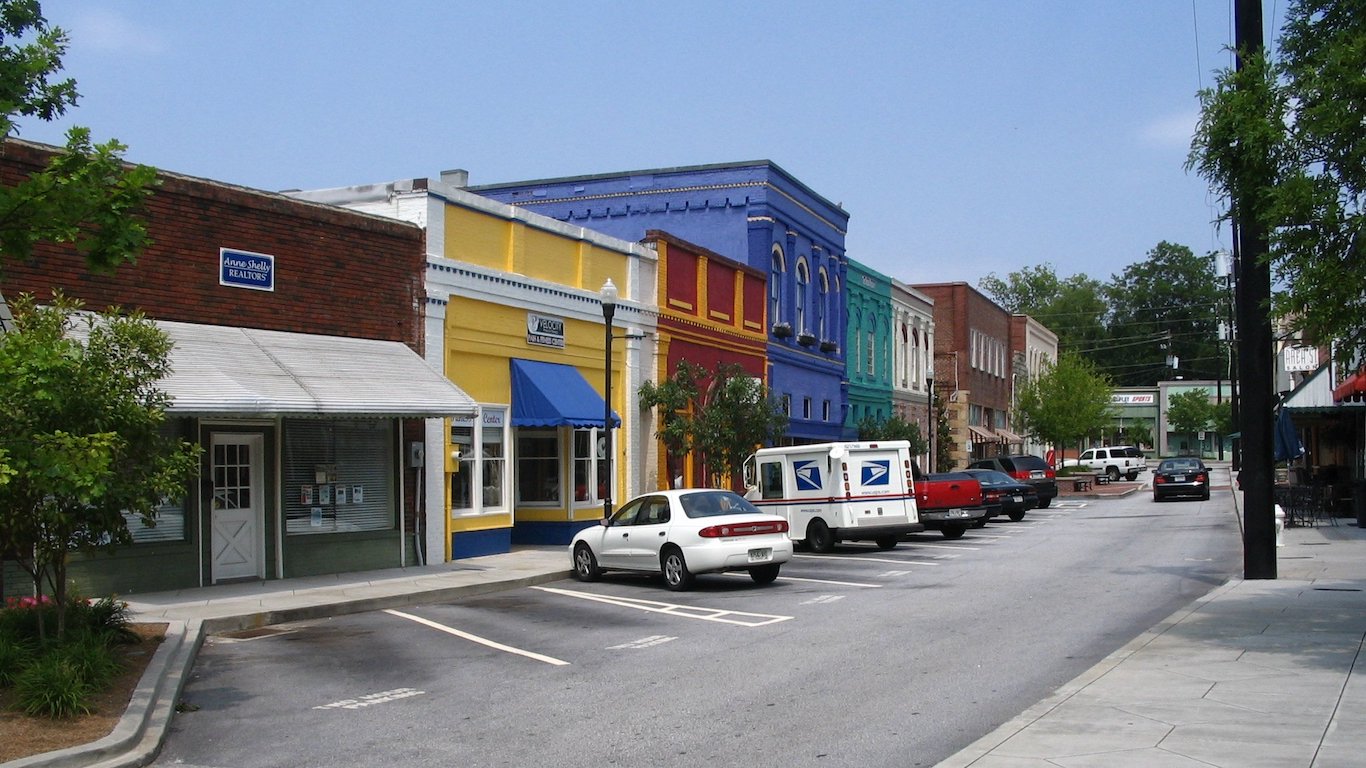
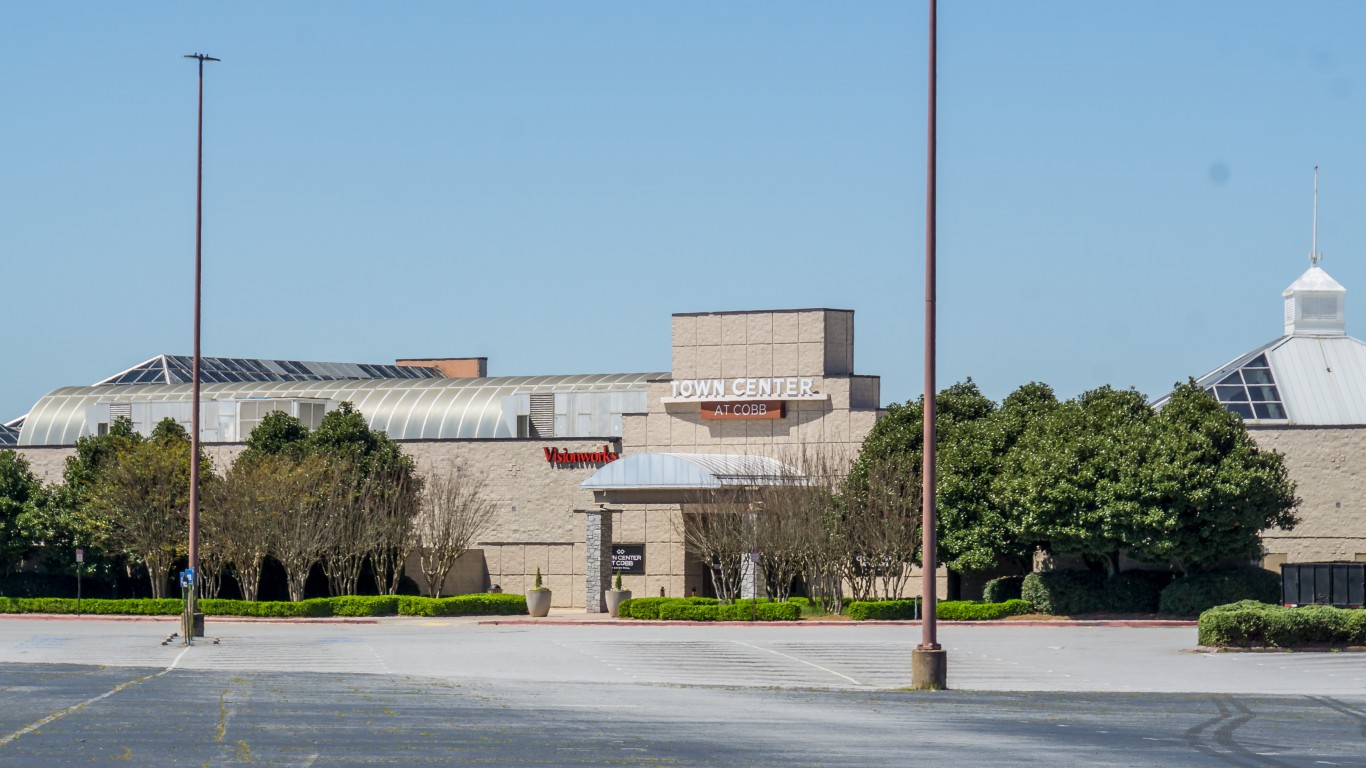
30. Hall County

- Avg. life expectancy at birth: 78.8 years
- Poverty rate: 13.5%
- Adults with a bachelor’s degree: 25.5%
- Median household income: $74,153
- Population: 204,953
29. Rockdale County
- Avg. life expectancy at birth: 76.7 years
- Poverty rate: 11.4%
- Adults with a bachelor’s degree: 28.1%
- Median household income: $68,999
- Population: 93,641
28. Catoosa County

- Avg. life expectancy at birth: 77.8 years
- Poverty rate: 8.9%
- Adults with a bachelor’s degree: 23.2%
- Median household income: $68,896
- Population: 68,052
27. Union County

- Avg. life expectancy at birth: 78.9 years
- Poverty rate: 11.7%
- Adults with a bachelor’s degree: 25.5%
- Median household income: $59,783
- Population: 24,880
26. Lumpkin County
- Avg. life expectancy at birth: 77.5 years
- Poverty rate: 14.5%
- Adults with a bachelor’s degree: 32.0%
- Median household income: $67,592
- Population: 33,405
25. Towns County

- Avg. life expectancy at birth: 79.0 years
- Poverty rate: 15.3%
- Adults with a bachelor’s degree: 32.0%
- Median household income: $55,574
- Population: 12,546
24. Douglas County

- Avg. life expectancy at birth: 77.1 years
- Poverty rate: 11.6%
- Adults with a bachelor’s degree: 29.9%
- Median household income: $76,930
- Population: 144,735
23. Clarke County

- Avg. life expectancy at birth: 79.1 years
- Poverty rate: 26.6%
- Adults with a bachelor’s degree: 47.9%
- Median household income: $48,692
- Population: 128,864
22. Jackson County

- Avg. life expectancy at birth: 76.6 years
- Poverty rate: 8.1%
- Adults with a bachelor’s degree: 26.5%
- Median household income: $82,056
- Population: 77,033
21. Effingham County

- Avg. life expectancy at birth: 76.7 years
- Poverty rate: 6.6%
- Adults with a bachelor’s degree: 25.2%
- Median household income: $79,474
- Population: 65,314
20. Henry County
- Avg. life expectancy at birth: 76.9 years
- Poverty rate: 8.4%
- Adults with a bachelor’s degree: 27.5%
- Median household income: $79,663
- Population: 240,853
19. Greene County

- Avg. life expectancy at birth: 78.3 years
- Poverty rate: 12.9%
- Adults with a bachelor’s degree: 33.4%
- Median household income: $77,527
- Population: 19,020
18. Chatham County

- Avg. life expectancy at birth: 77.6 years
- Poverty rate: 14.0%
- Adults with a bachelor’s degree: 36.1%
- Median household income: $66,171
- Population: 296,266
17. Houston County

- Avg. life expectancy at birth: 76.5 years
- Poverty rate: 9.7%
- Adults with a bachelor’s degree: 32.0%
- Median household income: $76,968
- Population: 164,117
16. Morgan County

- Avg. life expectancy at birth: 77.1 years
- Poverty rate: 8.6%
- Adults with a bachelor’s degree: 29.9%
- Median household income: $81,524
- Population: 20,171
15. Lee County
- Avg. life expectancy at birth: 75.4 years
- Poverty rate: 8.8%
- Adults with a bachelor’s degree: 32.6%
- Median household income: $83,632
- Population: 32,968
14. Paulding County

- Avg. life expectancy at birth: 78.5 years
- Poverty rate: 6.7%
- Adults with a bachelor’s degree: 26.5%
- Median household income: $89,237
- Population: 169,898
13. Bryan County

- Avg. life expectancy at birth: 75.6 years
- Poverty rate: 7.2%
- Adults with a bachelor’s degree: 33.9%
- Median household income: $90,627
- Population: 44,995
12. Dawson County

- Avg. life expectancy at birth: 77.4 years
- Poverty rate: 9.6%
- Adults with a bachelor’s degree: 35.5%
- Median household income: $84,516
- Population: 27,355
11. Coweta County

- Avg. life expectancy at birth: 78.4 years
- Poverty rate: 8.3%
- Adults with a bachelor’s degree: 34.1%
- Median household income: $90,031
- Population: 147,449
10. Harris County

- Avg. life expectancy at birth: 79.2 years
- Poverty rate: 7.5%
- Adults with a bachelor’s degree: 32.4%
- Median household income: $85,936
- Population: 34,914
9. Gwinnett County

- Avg. life expectancy at birth: 80.6 years
- Poverty rate: 10.1%
- Adults with a bachelor’s degree: 38.9%
- Median household income: $82,296
- Population: 957,977
8. Columbia County

- Avg. life expectancy at birth: 80.1 years
- Poverty rate: 7.2%
- Adults with a bachelor’s degree: 37.4%
- Median household income: $92,571
- Population: 156,921
7. DeKalb County

- Avg. life expectancy at birth: 79.9 years
- Poverty rate: 13.4%
- Adults with a bachelor’s degree: 46.7%
- Median household income: $76,044
- Population: 761,209
6. Cherokee County

- Avg. life expectancy at birth: 80.2 years
- Poverty rate: 6.6%
- Adults with a bachelor’s degree: 39.5%
- Median household income: $100,824
- Population: 268,567
5. Fulton County

- Avg. life expectancy at birth: 79.0 years
- Poverty rate: 12.5%
- Adults with a bachelor’s degree: 57.1%
- Median household income: $86,267
- Population: 1,061,944
4. Cobb County
- Avg. life expectancy at birth: 80.3 years
- Poverty rate: 8.3%
- Adults with a bachelor’s degree: 49.7%
- Median household income: $94,244
- Population: 765,813
3. Fayette County

- Avg. life expectancy at birth: 80.7 years
- Poverty rate: 5.3%
- Adults with a bachelor’s degree: 47.2%
- Median household income: $105,910
- Population: 119,259
2. Oconee County
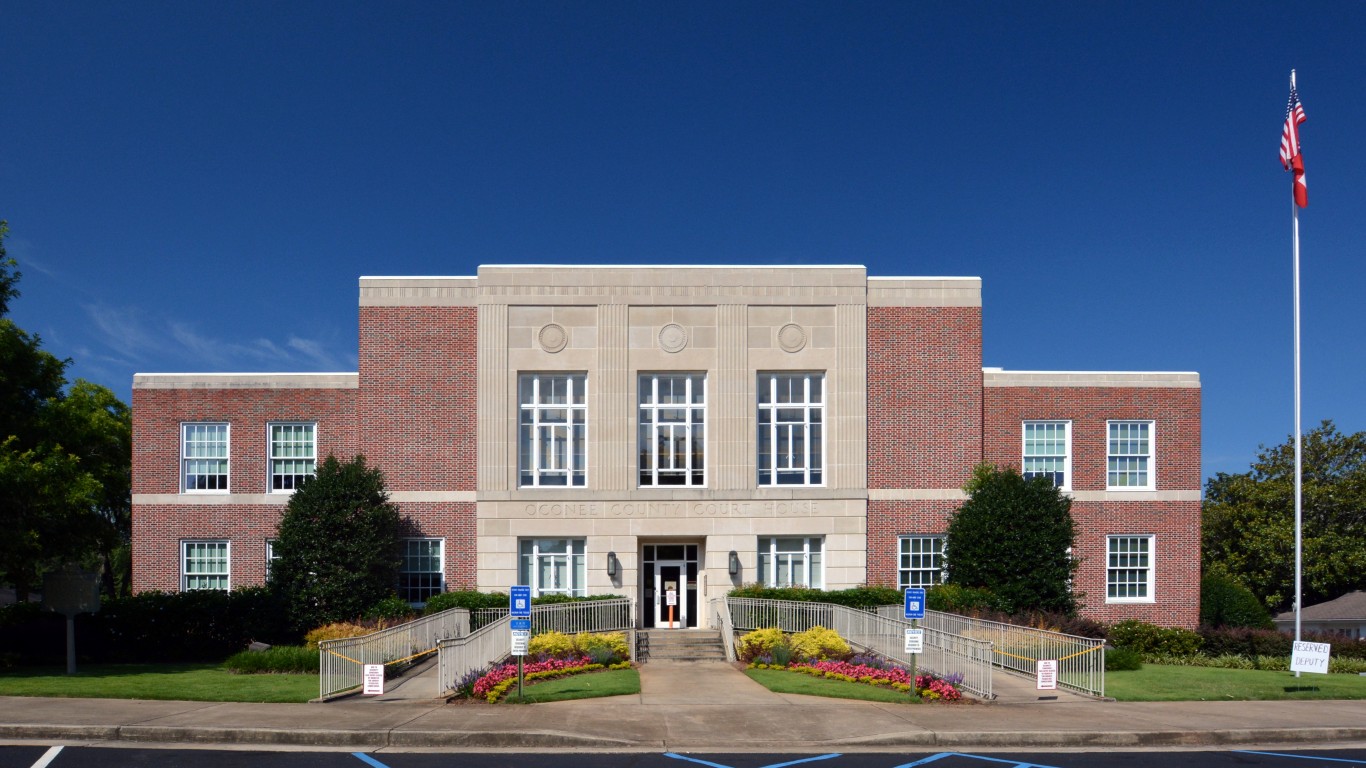
- Avg. life expectancy at birth: 80.6 years
- Poverty rate: 4.5%
- Adults with a bachelor’s degree: 53.5%
- Median household income: $116,221
- Population: 41,978
1. Forsyth County
- Avg. life expectancy at birth: 82.3 years
- Poverty rate: 4.6%
- Adults with a bachelor’s degree: 56.2%
- Median household income: $131,660
- Population: 253,225
| Rank | County | Avg. life expectancy at birth (yrs.) | Adults with a bachelor’s degree (%) | Poverty rate (%) | Population |
|---|---|---|---|---|---|
| 1 | Forsyth, Georgia | 82.3 | 56.2 | 4.6 | 253,225 |
| 2 | Oconee, Georgia | 80.6 | 53.5 | 4.5 | 41,978 |
| 3 | Fayette, Georgia | 80.7 | 47.2 | 5.3 | 119,259 |
| 4 | Cobb, Georgia | 80.3 | 49.7 | 8.3 | 765,813 |
| 5 | Fulton, Georgia | 79.0 | 57.1 | 12.5 | 1,061,944 |
| 6 | Cherokee, Georgia | 80.2 | 39.5 | 6.6 | 268,567 |
| 7 | DeKalb, Georgia | 79.9 | 46.7 | 13.4 | 761,209 |
| 8 | Columbia, Georgia | 80.1 | 37.4 | 7.2 | 156,921 |
| 9 | Gwinnett, Georgia | 80.6 | 38.9 | 10.1 | 957,977 |
| 10 | Harris, Georgia | 79.2 | 32.4 | 7.5 | 34,914 |
| 11 | Coweta, Georgia | 78.4 | 34.1 | 8.3 | 147,449 |
| 12 | Dawson, Georgia | 77.4 | 35.5 | 9.6 | 27,355 |
| 13 | Bryan, Georgia | 75.6 | 33.9 | 7.2 | 44,995 |
| 14 | Paulding, Georgia | 78.5 | 26.5 | 6.7 | 169,898 |
| 15 | Lee, Georgia | 75.4 | 32.6 | 8.8 | 32,968 |
| 16 | Morgan, Georgia | 77.1 | 29.9 | 8.6 | 20,171 |
| 17 | Houston, Georgia | 76.5 | 32.0 | 9.7 | 164,117 |
| 18 | Chatham, Georgia | 77.6 | 36.1 | 14.0 | 296,266 |
| 19 | Greene, Georgia | 78.3 | 33.4 | 12.9 | 19,020 |
| 20 | Henry, Georgia | 76.9 | 27.5 | 8.4 | 240,853 |
| 21 | Effingham, Georgia | 76.7 | 25.2 | 6.6 | 65,314 |
| 22 | Jackson, Georgia | 76.6 | 26.5 | 8.1 | 77,033 |
| 23 | Clarke, Georgia | 79.1 | 47.9 | 26.6 | 128,864 |
| 24 | Douglas, Georgia | 77.1 | 29.9 | 11.6 | 144,735 |
| 25 | Towns, Georgia | 79.0 | 32.0 | 15.3 | 12,546 |
| 26 | Lumpkin, Georgia | 77.5 | 32.0 | 14.5 | 33,405 |
| 27 | Union, Georgia | 78.9 | 25.5 | 11.7 | 24,880 |
| 28 | Catoosa, Georgia | 77.8 | 23.2 | 8.9 | 68,052 |
| 29 | Rockdale, Georgia | 76.7 | 28.1 | 11.4 | 93,641 |
| 30 | Hall, Georgia | 78.8 | 25.5 | 13.5 | 204,953 |
Thank you for reading! Have some feedback for us?
Contact the 24/7 Wall St. editorial team.
Latest from 24/7


Our expert who first called NVIDIA in 2009 is predicting 2025 will see a historic AI breakthrough.
You can follow him investing $500,000 of his own money on our top AI stocks for free.