
In a tight presidential election race, every vote counts, yet the gap in voter turnout between Black and white Americans has been growing consistently over the past decade, reversing a decades-long trend of the gap decreasing, according to a recently released study. The gap in voter turnout is especially growing in jurisdictions that lost federal voting protection following a Supreme Court decision in 2013.
What other disparities exist between Black and white Americans, and where are the gaps widest? To answer that and determine the worst cities for Black Americans, 24/7 Wall St. examined data in eight socioeconomic measures in each of the nation’s 384 metropolitan areas. For each city we evaluated the gap between white and Black residents in poverty, high school and college education, income, homeownership, unemployment, mortality, and incarceration.
Nationwide, Black households earn $50,901 annually, or just 63.6% of white households’ median income of $80,042 a year. Similarly, Black Americans are more than twice as likely to live below the poverty line (21.5% vs. 10.1%) or be unemployed (9.2% vs. 4.6%) as white Americans and are nearly five times as likely to be incarcerated (1,020.4 per 100,000 Black Americans vs 217.7 per 100,000 white Americans). (Also see: The Worst States for Black Americans: Every State Ranked.)
In the cities on the list, the gaps are even wider. In all the cities, Black households earn less than 60% of white households, including nine cities where Black households earn less than half of white households. Similarly, in 22 cities, the Black poverty rate is over 20%, including 13 where the poverty rate is over 30%. The lowest Black poverty rate is 15.6% in the Bridgeport, Connecticut, metro area, where the white poverty rate is 6.6%. In all, among white residents of the cities on the list, the poverty rate is in the single digits in 18 cities and does not exceed 13.2%.
Why This Matters

Full Methodology

For each measure, we constructed an index of the gaps between Black and white Americans. The index was standardized using min-max normalization. We excluded metro areas where Black residents comprise less than 5% of the population.
Within the index, we considered five-year data from the U.S. Census Bureau’s 2022 American Community Survey on median household income, poverty, adult high school and bachelor’s degree attainment, homeownership, and unemployment for each racial group.
Data on the number of prisoners in state or federal correctional facilities within a state by race are for 2021 and came from the Bureau of Justice Statistics. These figures were adjusted for population using ACS data. Because states, rather than metro areas, are responsible for the prison population, incarceration rates are for the state where the metro area is located. If a metro area spans more than one state, we used the state in which the metro area’s principal city is located.
We also included mortality rates for the years 2019 to 2021 from the Centers For Disease Control and Prevention. We aggregated mortality rates from the county to the metropolitan level using boundary definitions from the Census Bureau. Incarceration and mortality rates are per 100,000 residents.
25. Decatur, IL

- Median household income, 2022: $32,570 (Black); $67,048 (white)
- Homeownership rate, 2022: 35.2% (Black); 76.4% (white)
- Unemployment rate, 2022: 18.9% (Black); 5.6% (white)
- Black population, 2022: 17,530 (16.9% of total)
24. Erie, PA
- Median household income, 2022: $26,626 (Black); $63,010 (white)
- Homeownership rate, 2022: 33.6% (Black); 71.8% (white)
- Unemployment rate, 2022: 9.3% (Black); 5.2% (white)
- Black population, 2022: 18,087 (6.7% of total)
23. Champaign-Urbana, IL
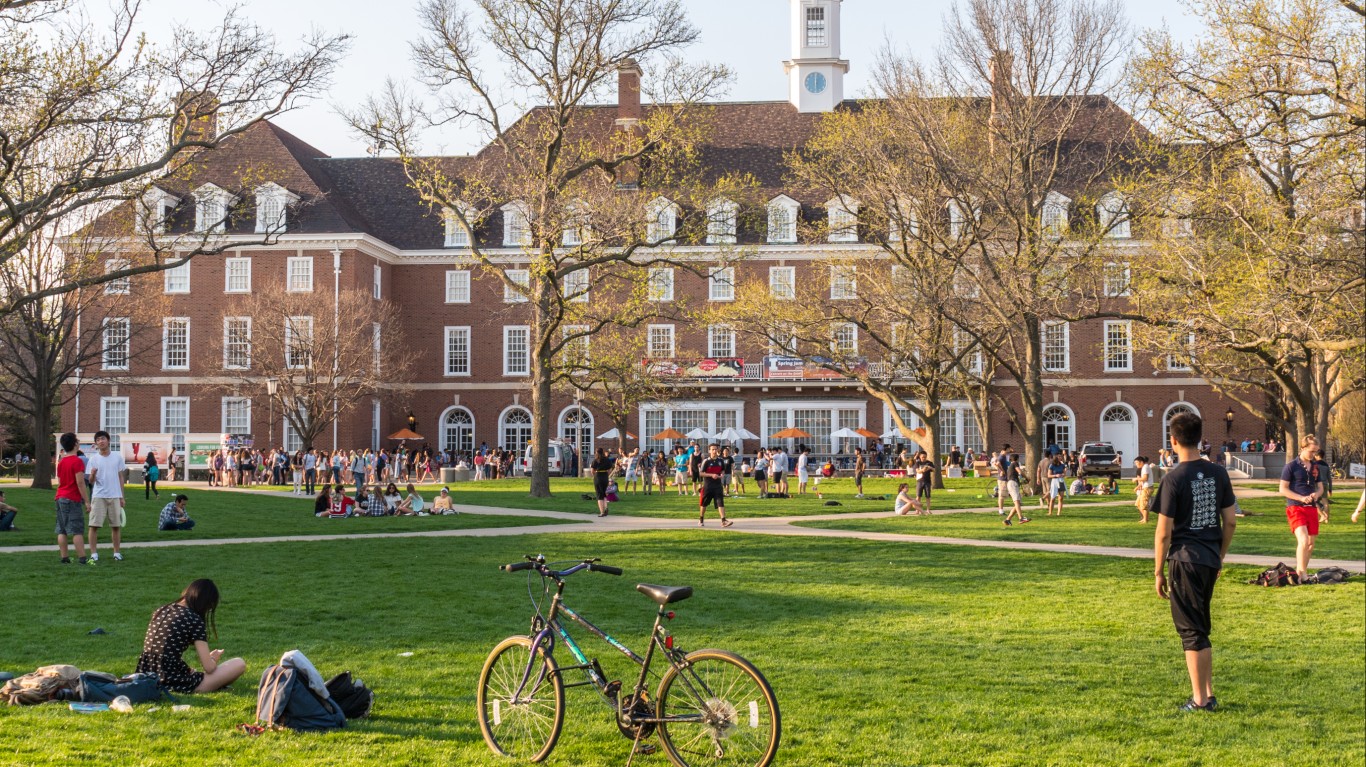
- Median household income, 2022: $37,241 (Black); $73,120 (white)
- Homeownership rate, 2022: 26.6% (Black); 65.4% (white)
- Unemployment rate, 2022: 12.5% (Black); 4.0% (white)
- Black population, 2022: 27,057 (12.1% of total)
22. Bridgeport-Stamford-Norwalk, CT

- Median household income, 2022: $70,129 (Black); $122,437 (white)
- Homeownership rate, 2022: 40.1% (Black); 74.7% (white)
- Unemployment rate, 2022: 8.5% (Black); 5.7% (white)
- Black population, 2022: 95,447 (10.0% of total)
21. Buffalo-Cheektowaga, NY
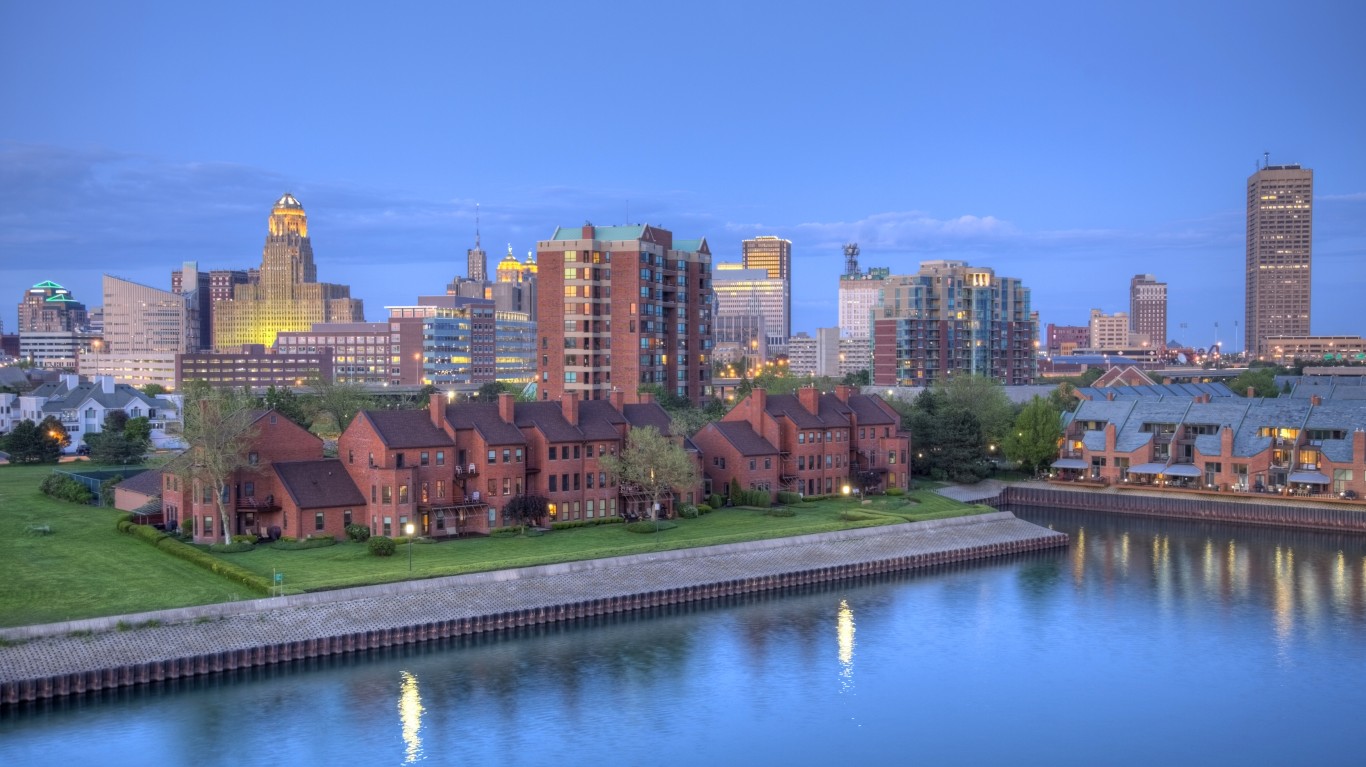
- Median household income, 2022: $39,461 (Black); $74,245 (white)
- Homeownership rate, 2022: 37.6% (Black); 72.2% (white)
- Unemployment rate, 2022: 9.8% (Black); 4.5% (white)
- Black population, 2022: 132,849 (11.4% of total)
20. Rockford, IL
- Median household income, 2022: $34,676 (Black); $69,224 (white)
- Homeownership rate, 2022: 28.0% (Black); 74.4% (white)
- Unemployment rate, 2022: 16.5% (Black); 6.6% (white)
- Black population, 2022: 38,033 (11.3% of total)
19. Albany-Schenectady-Troy, NY

- Median household income, 2022: $45,681 (Black); $88,060 (white)
- Homeownership rate, 2022: 25.1% (Black); 68.9% (white)
- Unemployment rate, 2022: 10.8% (Black); 4.2% (white)
- Black population, 2022: 65,586 (7.3% of total)
18. Omaha-Council Bluffs, NE-IA

- Median household income, 2022: $43,856 (Black); $84,385 (white)
- Homeownership rate, 2022: 31.9% (Black); 70.6% (white)
- Unemployment rate, 2022: 8.8% (Black); 3.0% (white)
- Black population, 2022: 70,849 (7.3% of total)
17. Peoria, IL

- Median household income, 2022: $34,891 (Black); $70,355 (white)
- Homeownership rate, 2022: 33.4% (Black); 76.5% (white)
- Unemployment rate, 2022: 15.6% (Black); 4.5% (white)
- Black population, 2022: 34,545 (8.6% of total)
16. Minneapolis-St. Paul-Bloomington, MN-WI
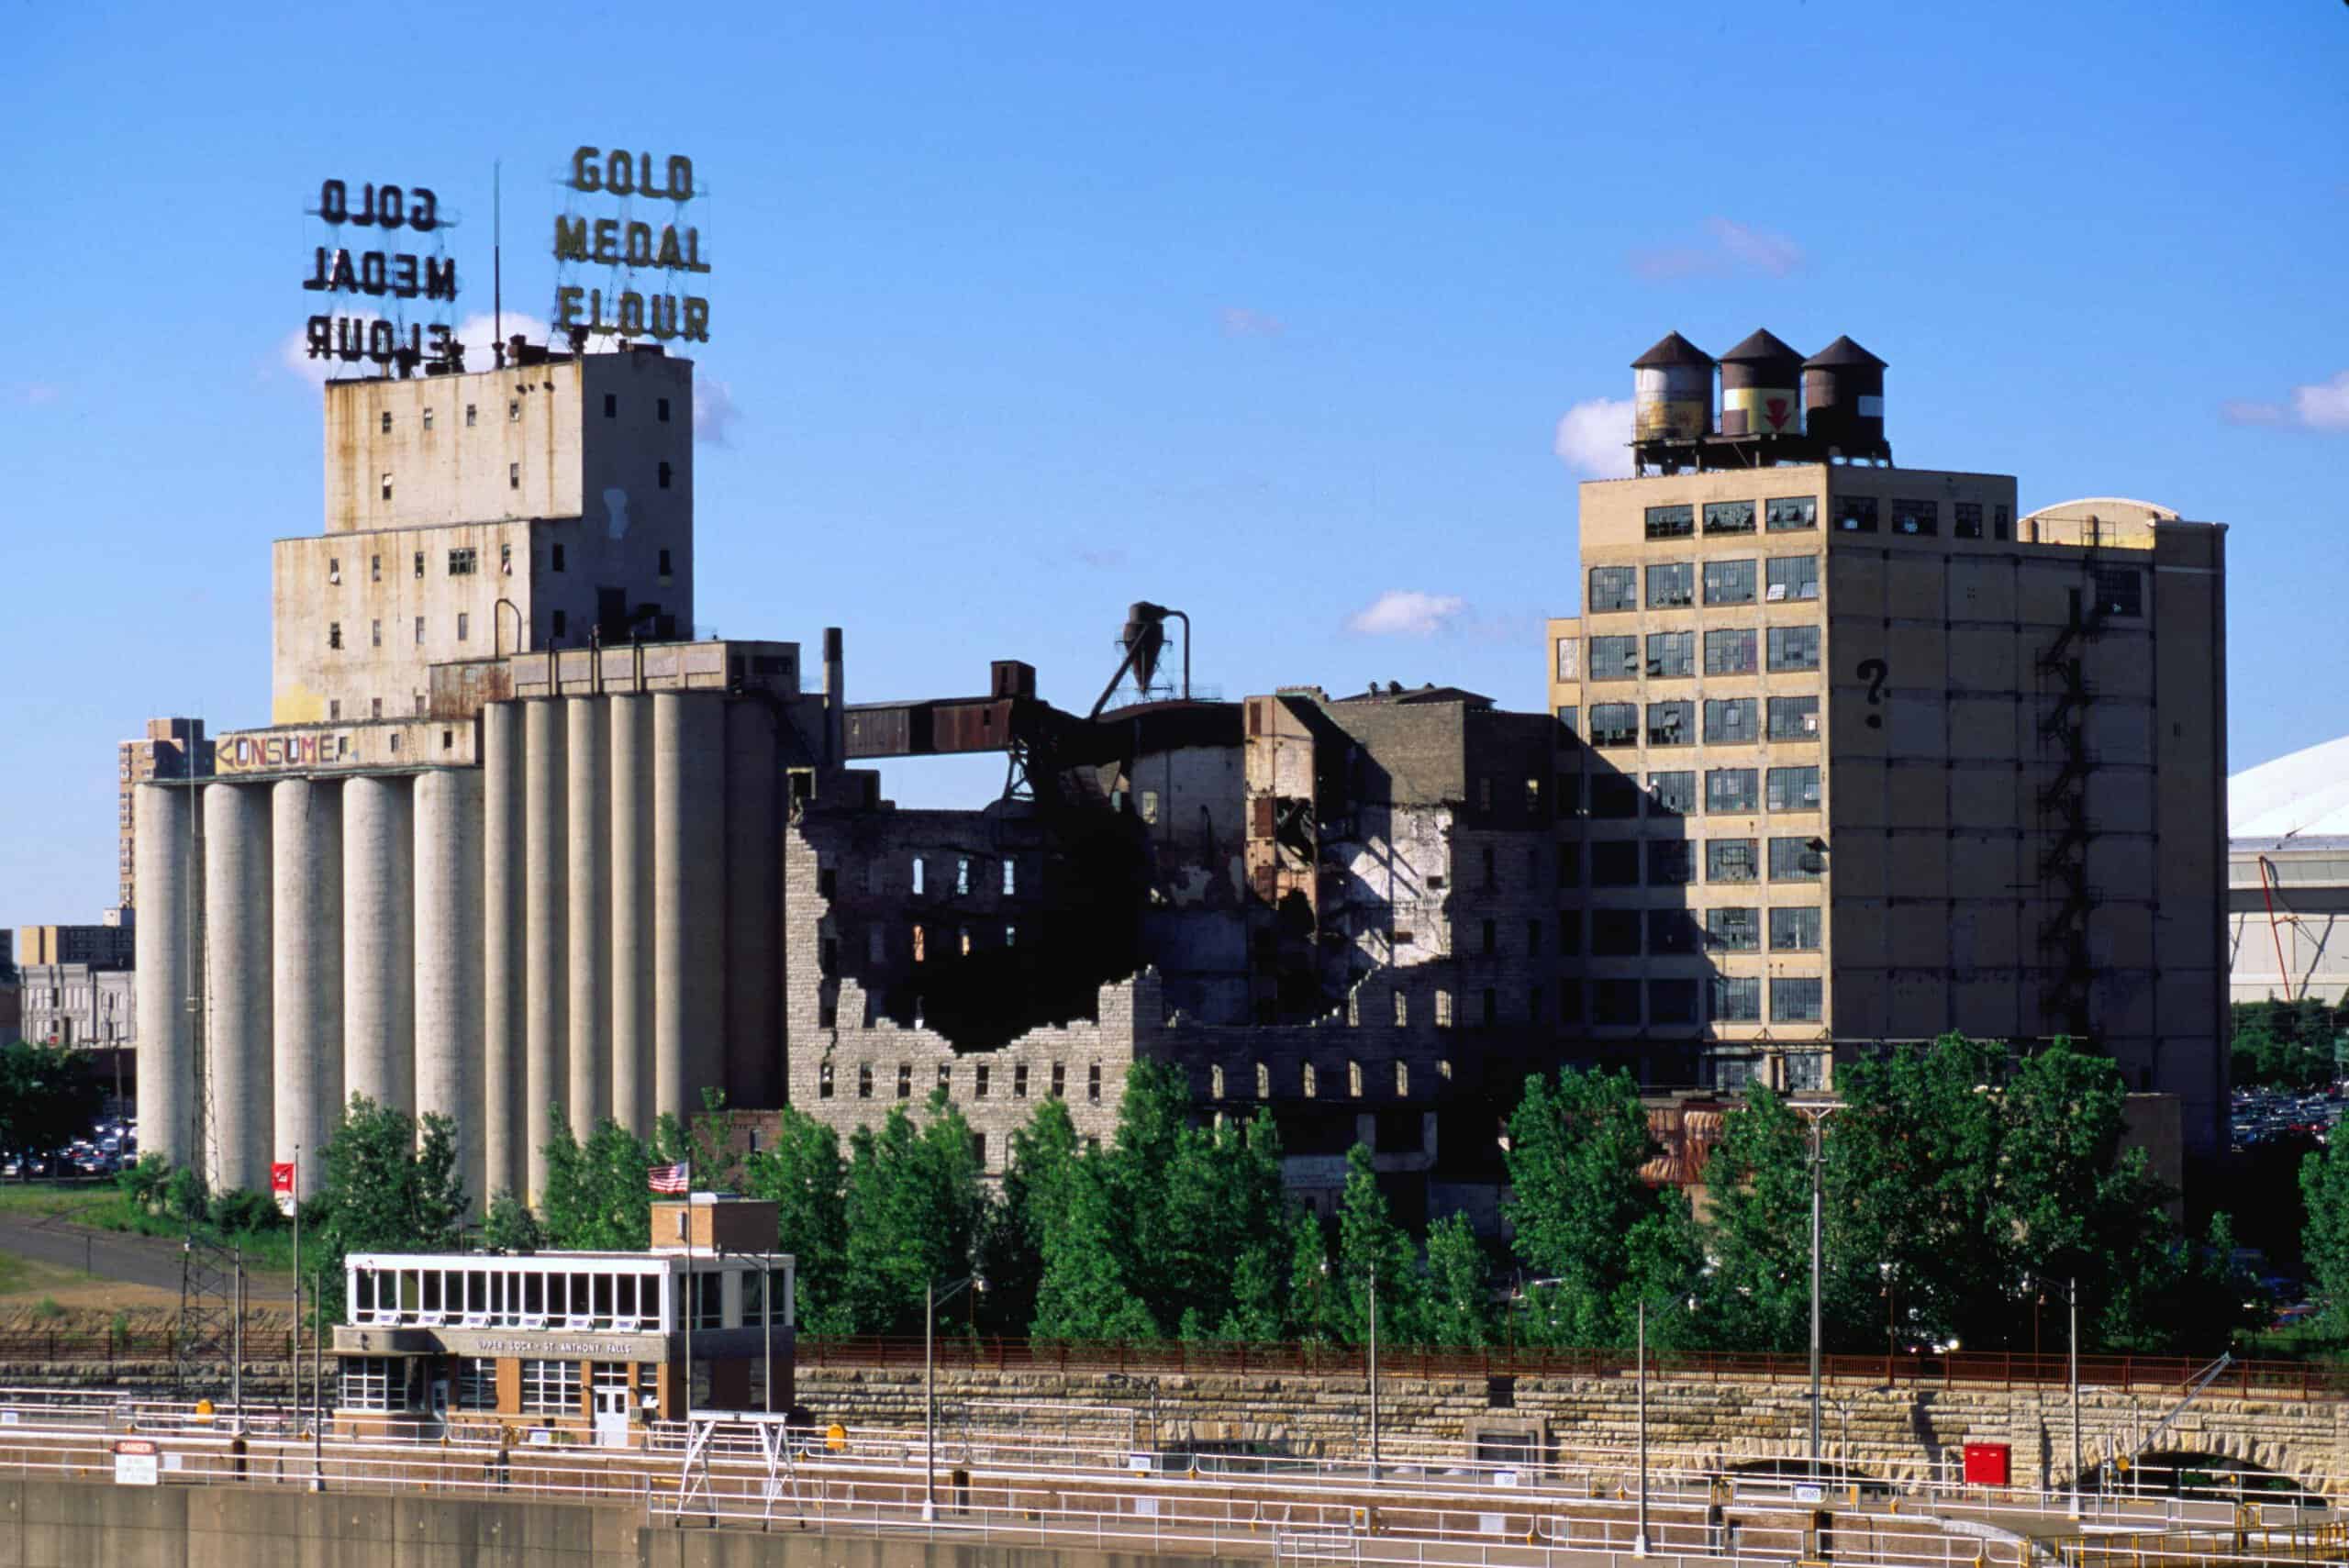
- Median household income, 2022: $51,321 (Black); $100,582 (white)
- Homeownership rate, 2022: 29.9% (Black); 76.4% (white)
- Unemployment rate, 2022: 8.2% (Black); 3.3% (white)
- Black population, 2022: 320,181 (8.7% of total)
15. Niles, MI

- Median household income, 2022: $29,073 (Black); $67,707 (white)
- Homeownership rate, 2022: 38.3% (Black); 79.2% (white)
- Unemployment rate, 2022: 15.4% (Black); 5.0% (white)
- Black population, 2022: 21,433 (13.9% of total)
14. Des Moines-West Des Moines, IA
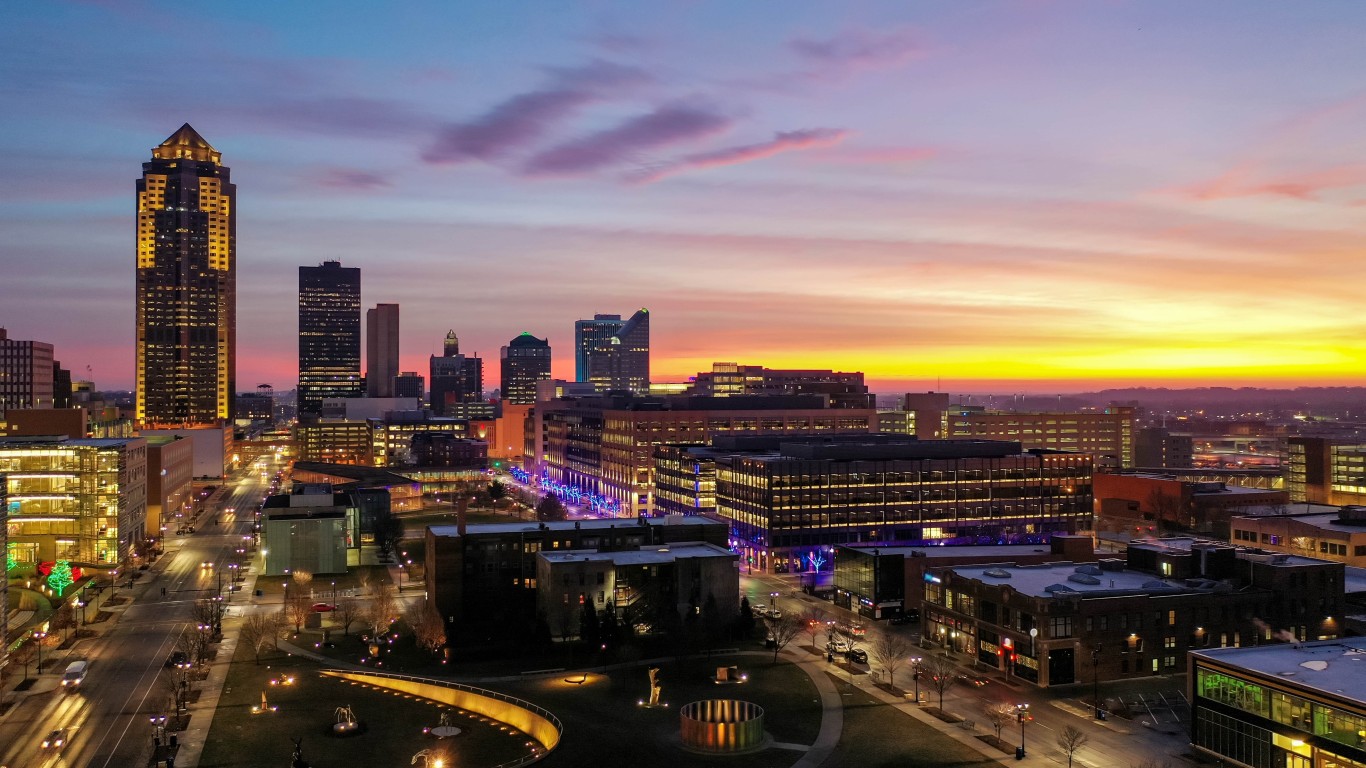
- Median household income, 2022: $45,529 (Black); $83,994 (white)
- Homeownership rate, 2022: 30.2% (Black); 73.0% (white)
- Unemployment rate, 2022: 8.9% (Black); 3.6% (white)
- Black population, 2022: 38,739 (5.4% of total)
13. Atlantic City-Hammonton, NJ
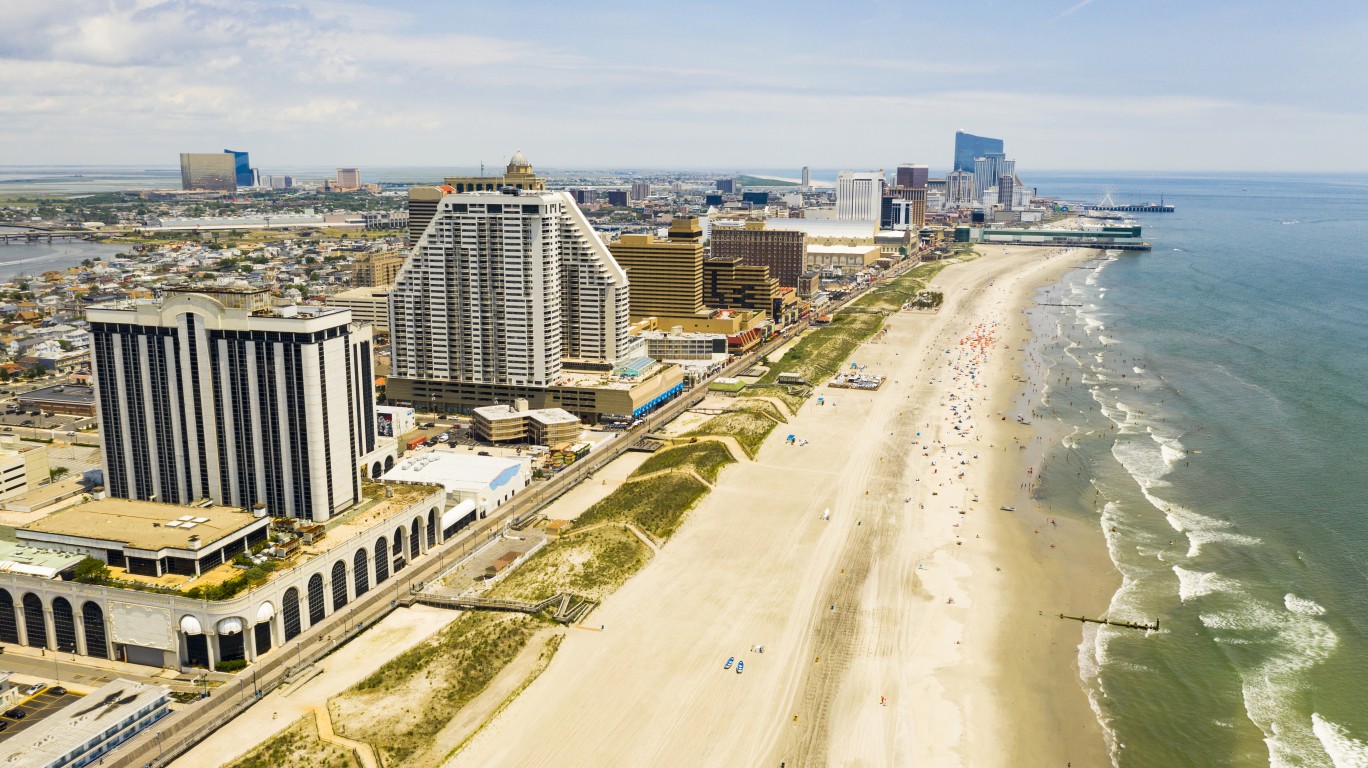
- Median household income, 2022: $49,658 (Black); $83,877 (white)
- Homeownership rate, 2022: 42.1% (Black); 76.8% (white)
- Unemployment rate, 2022: 11.3% (Black); 6.9% (white)
- Black population, 2022: 35,485 (12.9% of total)
12. Rochester, NY

- Median household income, 2022: $40,670 (Black); $77,124 (white)
- Homeownership rate, 2022: 35.0% (Black); 73.3% (white)
- Unemployment rate, 2022: 10.7% (Black); 4.1% (white)
- Black population, 2022: 114,029 (10.5% of total)
11. Chicago-Naperville-Elgin, IL-IN-WI
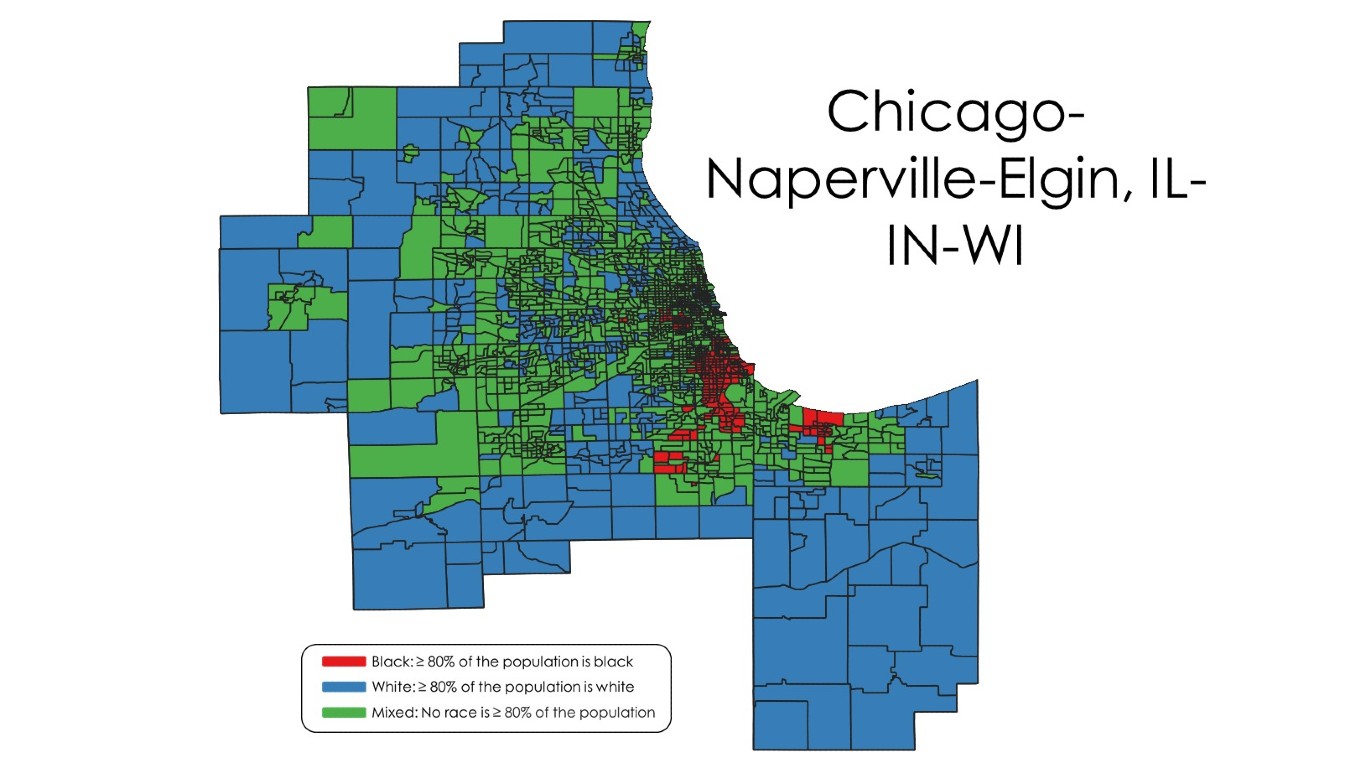
- Median household income, 2022: $49,194 (Black); $97,568 (white)
- Homeownership rate, 2022: 41.6% (Black); 73.5% (white)
- Unemployment rate, 2022: 13.7% (Black); 4.8% (white)
- Black population, 2022: 1,522,030 (15.9% of total)
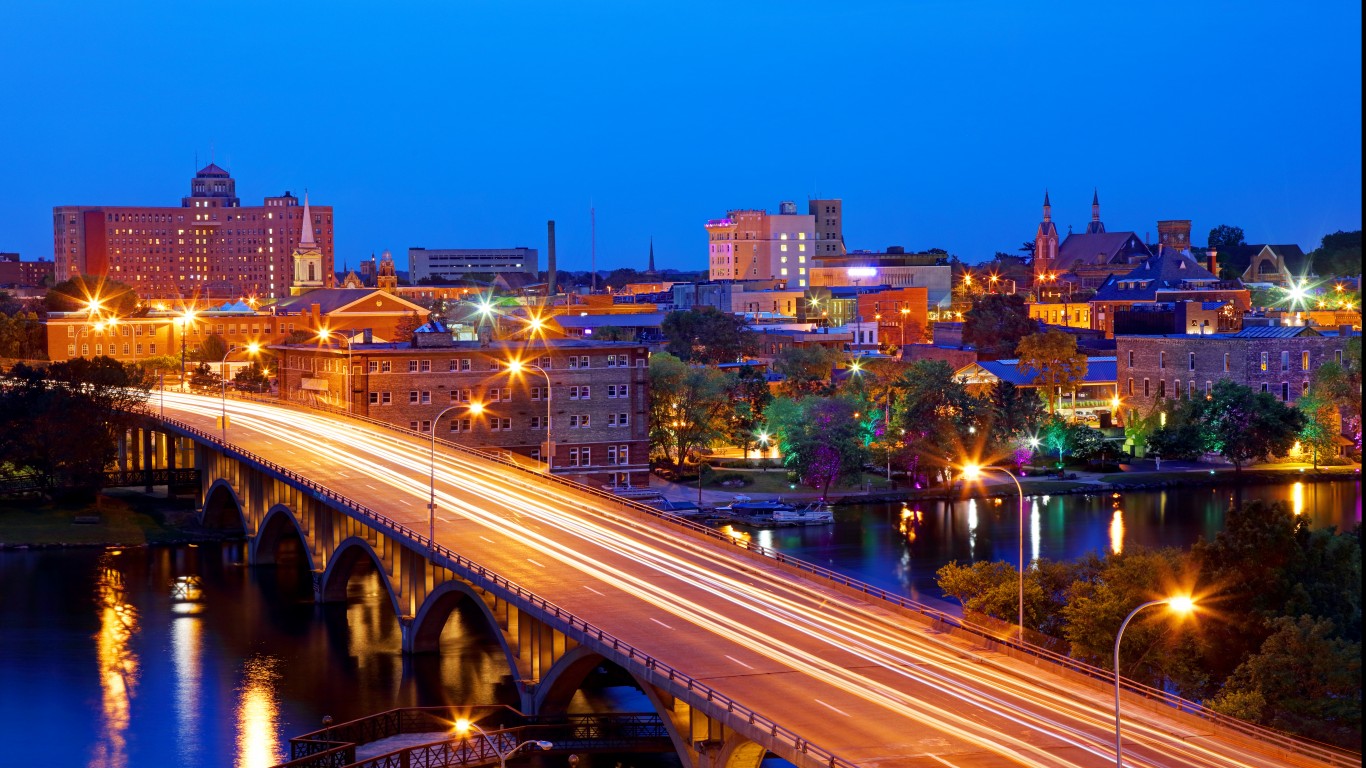
10. Syracuse, NY

- Median household income, 2022: $37,127 (Black); $74,176 (white)
- Homeownership rate, 2022: 30.2% (Black); 72.6% (white)
- Unemployment rate, 2022: 12.5% (Black); 5.3% (white)
- Black population, 2022: 51,468 (7.8% of total)
9. Davenport-Moline-Rock Island, IA-IL
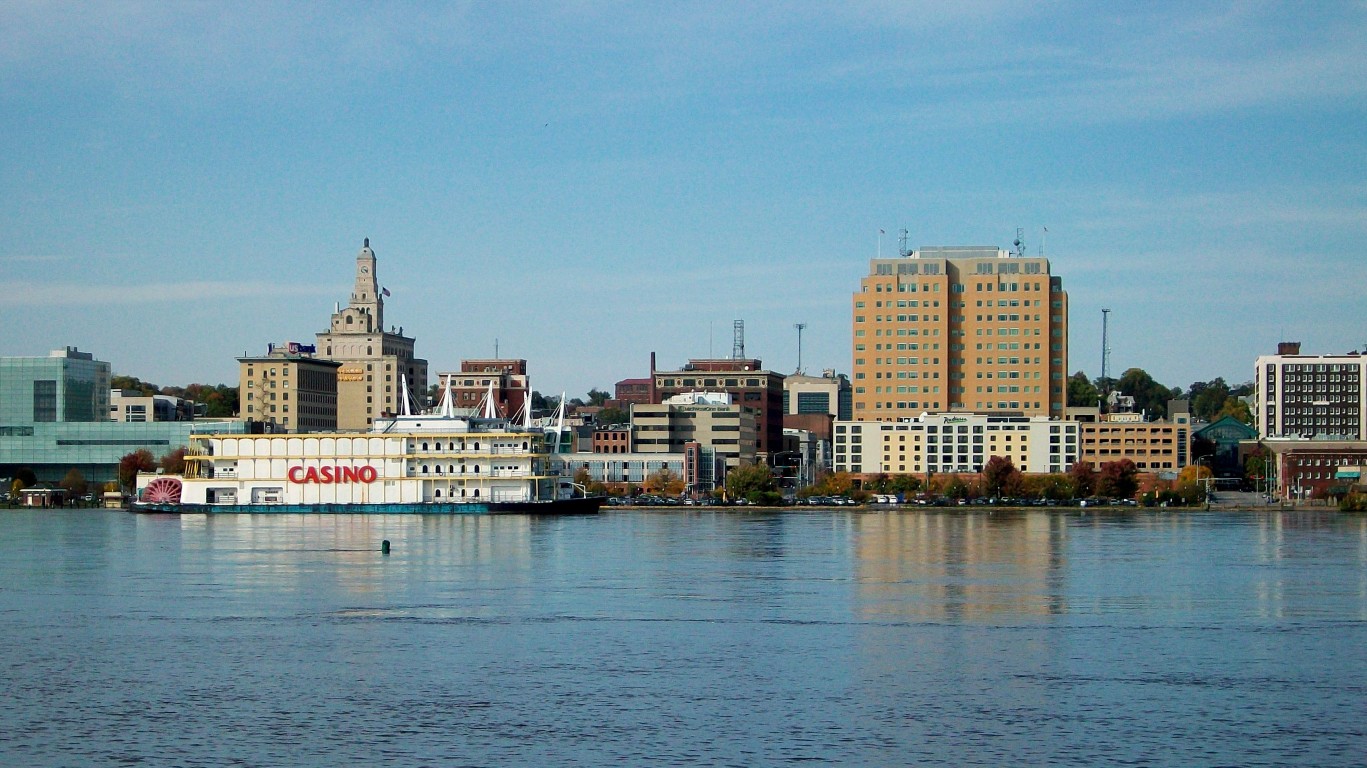
- Median household income, 2022: $40,288 (Black); $71,697 (white)
- Homeownership rate, 2022: 30.9% (Black); 74.6% (white)
- Unemployment rate, 2022: 16.2% (Black); 4.0% (white)
- Black population, 2022: 27,796 (7.3% of total)
8. Waterloo-Cedar Falls, IA

- Median household income, 2022: $34,268 (Black); $70,413 (white)
- Homeownership rate, 2022: 31.7% (Black); 73.4% (white)
- Unemployment rate, 2022: 18.1% (Black); 3.4% (white)
- Black population, 2022: 12,996 (7.7% of total)
7. San Francisco-Oakland-Berkeley, CA

- Median household income, 2022: $70,119 (Black); $145,999 (white)
- Homeownership rate, 2022: 35.1% (Black); 60.0% (white)
- Unemployment rate, 2022: 9.2% (Black); 4.8% (white)
- Black population, 2022: 326,676 (7.0% of total)
6. Trenton-Princeton, NJ
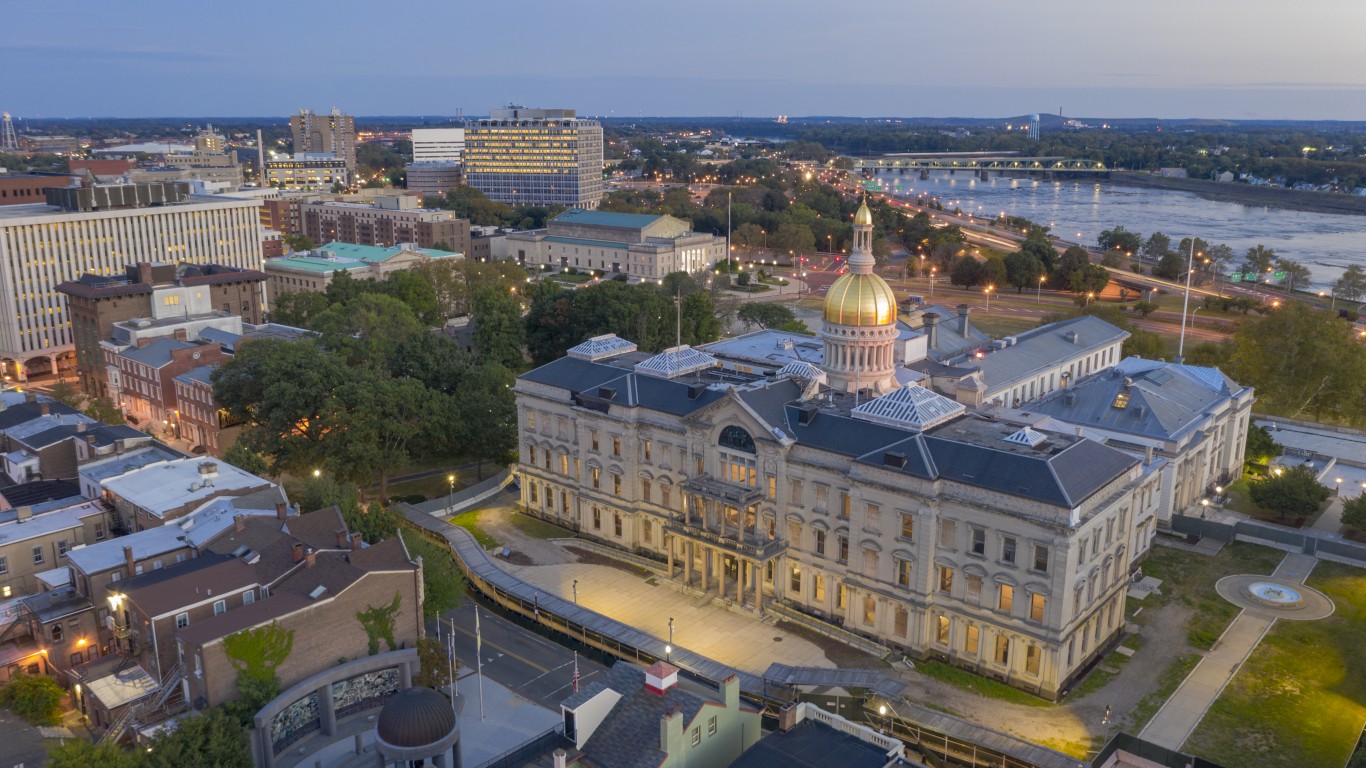
- Median household income, 2022: $56,828 (Black); $103,481 (white)
- Homeownership rate, 2022: 40.1% (Black); 71.7% (white)
- Unemployment rate, 2022: 10.0% (Black); 5.6% (white)
- Black population, 2022: 73,261 (19.1% of total)
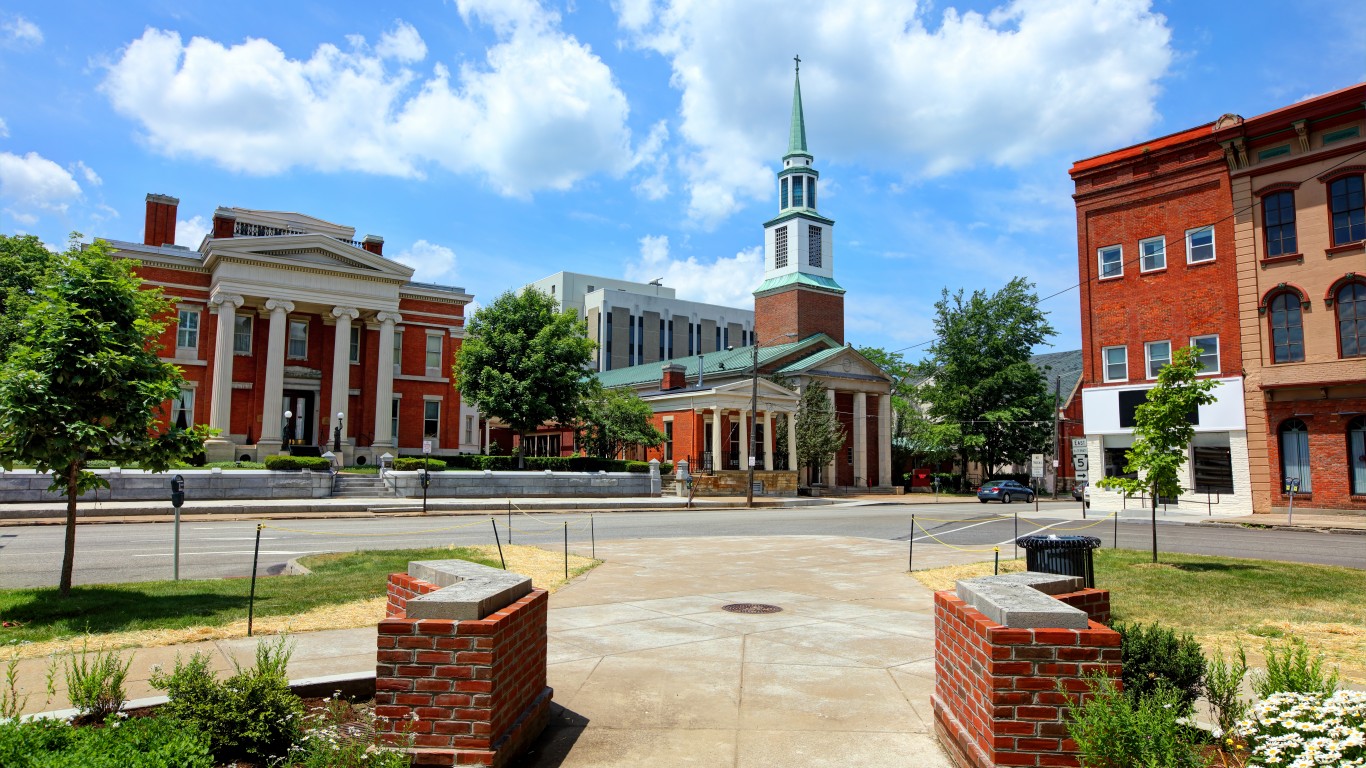
5. Springfield, IL

- Median household income, 2022: $29,482 (Black); $78,904 (white)
- Homeownership rate, 2022: 27.8% (Black); 77.3% (white)
- Unemployment rate, 2022: 15.8% (Black); 3.9% (white)
- Black population, 2022: 24,804 (11.9% of total)
4. Racine, WI

- Median household income, 2022: $41,458 (Black); $79,477 (white)
- Homeownership rate, 2022: 29.6% (Black); 76.3% (white)
- Unemployment rate, 2022: 7.6% (Black); 3.4% (white)
- Black population, 2022: 21,090 (10.7% of total)
3. Rochester, MN
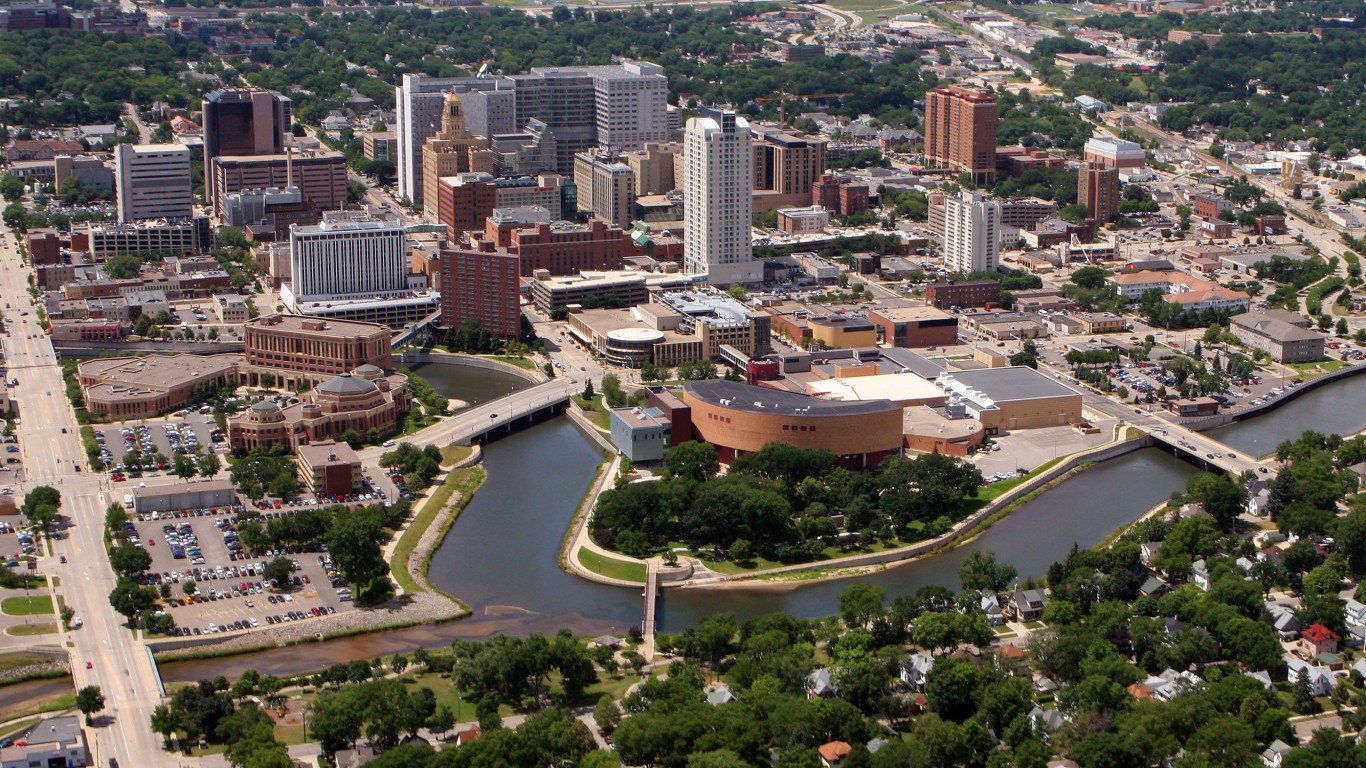
- Median household income, 2022: $38,617 (Black); $90,820 (white)
- Homeownership rate, 2022: 20.8% (Black); 78.1% (white)
- Unemployment rate, 2022: 9.2% (Black); 2.8% (white)
- Black population, 2022: 11,618 (5.1% of total)
2. St. Cloud, MN

- Median household income, 2022: $44,597 (Black); $76,223 (white)
- Homeownership rate, 2022: 11.5% (Black); 72.5% (white)
- Unemployment rate, 2022: 16.3% (Black); 3.6% (white)
- Black population, 2022: 15,003 (7.5% of total)
1. Milwaukee-Waukesha, WI

- Median household income, 2022: $37,182 (Black); $84,267 (white)
- Homeownership rate, 2022: 27.5% (Black); 69.0% (white)
- Unemployment rate, 2022: 8.5% (Black); 3.0% (white)
- Black population, 2022: 248,989 (15.9% of total)
Travel Cards Are Getting Too Good To Ignore (sponsored)
Credit card companies are pulling out all the stops, with the issuers are offering insane travel rewards and perks.
We’re talking huge sign-up bonuses, points on every purchase, and benefits like lounge access, travel credits, and free hotel nights. For travelers, these rewards can add up to thousands of dollars in flights, upgrades, and luxury experiences every year.
It’s like getting paid to travel — and it’s available to qualified borrowers who know where to look.
We’ve rounded up some of the best travel credit cards on the market. Click here to see the list. Don’t miss these offers — they won’t be this good forever.
Thank you for reading! Have some feedback for us?
Contact the 24/7 Wall St. editorial team.
Latest from 24/7


Our expert who first called NVIDIA in 2009 is predicting 2025 will see a historic AI breakthrough.
You can follow him investing $500,000 of his own money on our top AI stocks for free.