
Every year in the United States, tens of millions of Americans move to a new home. According to the U.S. Census Bureau, the bulk of these moves are motivated by personal circumstances, often relating to housing, family, or employment. But when it comes to deciding on a place to live, it can also be helpful to weigh other, less subjective factors.
As a means of gauging and comparing degrees of development between countries — beyond standard measures like gross domestic product and economic growth — the United Nations created the Human Development Index. By accounting for factors related to health and well-being, educational attainment, and standards of living, the HDI offers an assessment of overall quality of life at the individual level within a given geography.
When applied to communities within the United States, the core principles of the HDI reveal that some parts of the country are far better places to live than others.
Using an index inspired by the HDI, 24/7 Wall St. identified the best counties in Ohio to live in. Counties are ranked on a combination of three measures – average life expectancy at birth, the share of adults with a bachelor’s degree or higher, and the poverty rate. Of the 88 counties in Ohio, we ranked the 30 with the highest HDI score.
Across all of Ohio, average life expectancy at birth is 76.5 years. Additionally, 13.3% of the population live below the poverty line and 30.4% of adults have a bachelor’s degree or higher. Of the 30 counties on this list, 10 compare favorably to the state as a whole in each of these metrics.
Among these 30 Ohio counties, average life expectancy at birth ranges from 76.2 years to 81.7 years. Meanwhile, poverty rates vary between 4.5% and 16.5%, and bachelor’s degree attainment rates range from about 18% to over 50%.
Data used to calculate rankings are from the U.S. Census Bureau’s 2022 American Community Survey and County Health Rankings & Roadmaps, a joint program of the Robert Wood Johnson Foundation and the University of Wisconsin Population Health Institute. All ACS data are five-year averages.
Why It Matters

Many of the most commonly cited economic indicators — including unemployment, GDP, and industrial output — are useful gauges of prosperity and productive capacity in a given area. But when it comes to measuring overall quality of life, any single metric inevitably falls short. To address these shortcomings, the HDI combines three key social and economic measures into a single index score, allowing for objective comparisons between communities across the United States.
30. Madison County

- Avg. life expectancy at birth: 77.5 years
- Poverty rate: 10.2%
- Adults with a bachelor’s degree: 20.4%
- Median household income: $77,062
- Population: 43,961
29. Fulton County
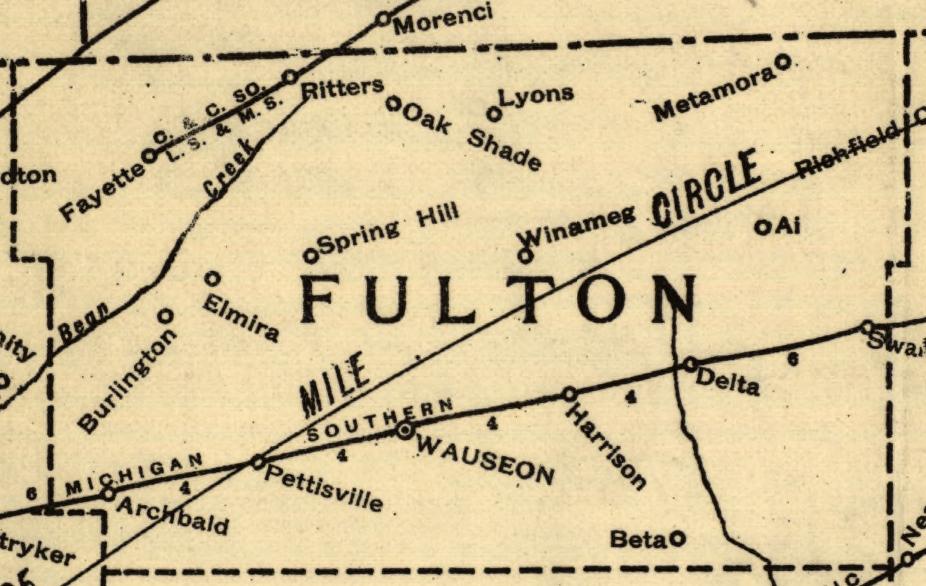
- Avg. life expectancy at birth: 77.6 years
- Poverty rate: 8.5%
- Adults with a bachelor’s degree: 18.3%
- Median household income: $71,453
- Population: 42,602
28. Knox County

- Avg. life expectancy at birth: 78.1 years
- Poverty rate: 12.9%
- Adults with a bachelor’s degree: 23.7%
- Median household income: $71,246
- Population: 62,657
27. Lorain County

- Avg. life expectancy at birth: 77.5 years
- Poverty rate: 13.5%
- Adults with a bachelor’s degree: 27.2%
- Median household income: $67,272
- Population: 313,101
26. Erie County
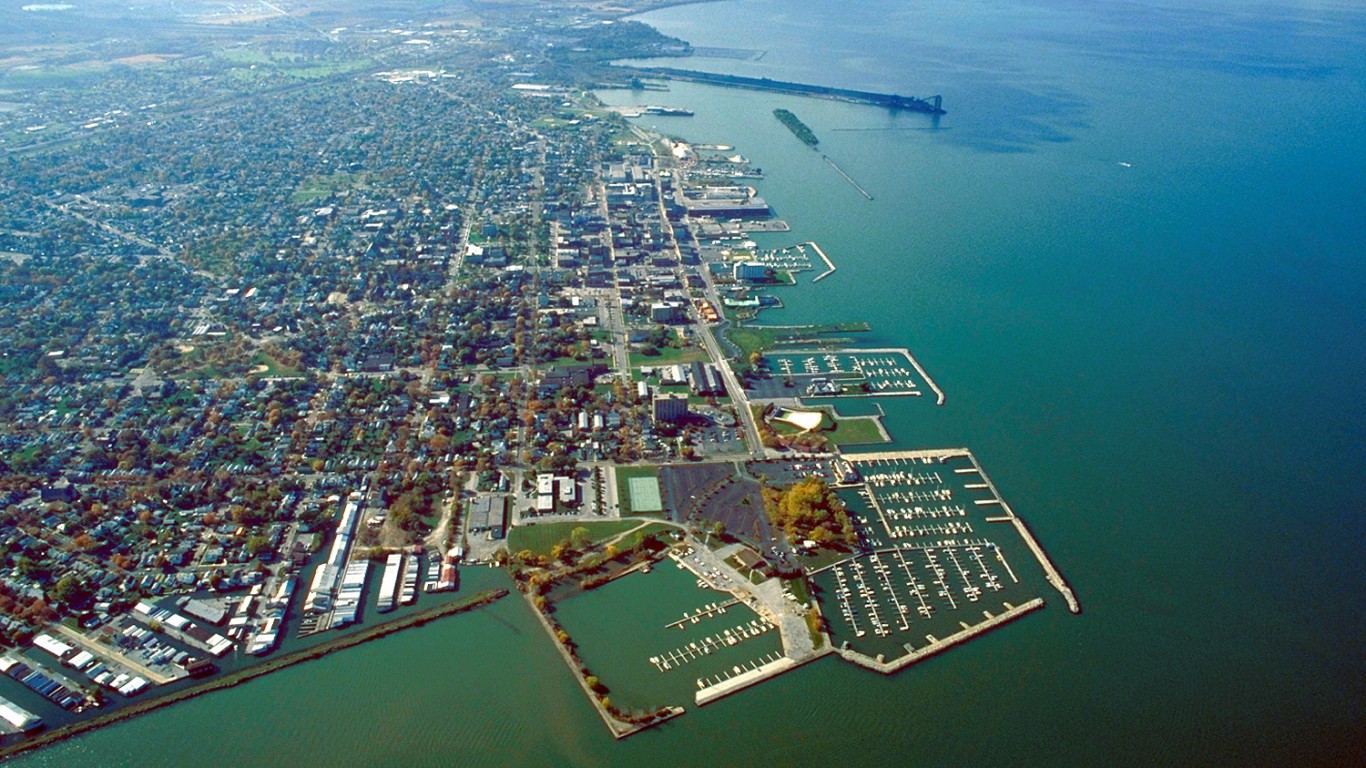
- Avg. life expectancy at birth: 76.2 years
- Poverty rate: 11.5%
- Adults with a bachelor’s degree: 26.5%
- Median household income: $65,171
- Population: 75,299
25. Wyandot County
- Avg. life expectancy at birth: 76.7 years
- Poverty rate: 6.9%
- Adults with a bachelor’s degree: 21.2%
- Median household income: $68,552
- Population: 21,818
24. Cuyahoga County

- Avg. life expectancy at birth: 76.5 years
- Poverty rate: 16.5%
- Adults with a bachelor’s degree: 35.2%
- Median household income: $60,074
- Population: 1,256,620
23. Wayne County
- Avg. life expectancy at birth: 77.5 years
- Poverty rate: 8.8%
- Adults with a bachelor’s degree: 24.0%
- Median household income: $70,320
- Population: 116,680
22. Auglaize County
- Avg. life expectancy at birth: 77.9 years
- Poverty rate: 6.6%
- Adults with a bachelor’s degree: 20.7%
- Median household income: $75,231
- Population: 46,263
21. Miami County

- Avg. life expectancy at birth: 77.4 years
- Poverty rate: 8.5%
- Adults with a bachelor’s degree: 24.7%
- Median household income: $71,440
- Population: 108,818
20. Mercer County

- Avg. life expectancy at birth: 78.5 years
- Poverty rate: 6.4%
- Adults with a bachelor’s degree: 20.4%
- Median household income: $73,278
- Population: 42,321
19. Butler County

- Avg. life expectancy at birth: 76.4 years
- Poverty rate: 11.8%
- Adults with a bachelor’s degree: 31.9%
- Median household income: $77,062
- Population: 388,327
18. Hancock County

- Avg. life expectancy at birth: 77.5 years
- Poverty rate: 10.5%
- Adults with a bachelor’s degree: 28.5%
- Median household income: $67,006
- Population: 75,072
17. Ottawa County

- Avg. life expectancy at birth: 77.8 years
- Poverty rate: 8.8%
- Adults with a bachelor’s degree: 26.9%
- Median household income: $69,515
- Population: 40,367
16. Licking County

- Avg. life expectancy at birth: 77.1 years
- Poverty rate: 9.8%
- Adults with a bachelor’s degree: 29.5%
- Median household income: $78,505
- Population: 178,844
15. Summit County

- Avg. life expectancy at birth: 76.8 years
- Poverty rate: 12.4%
- Adults with a bachelor’s degree: 34.6%
- Median household income: $68,360
- Population: 539,361
14. Portage County
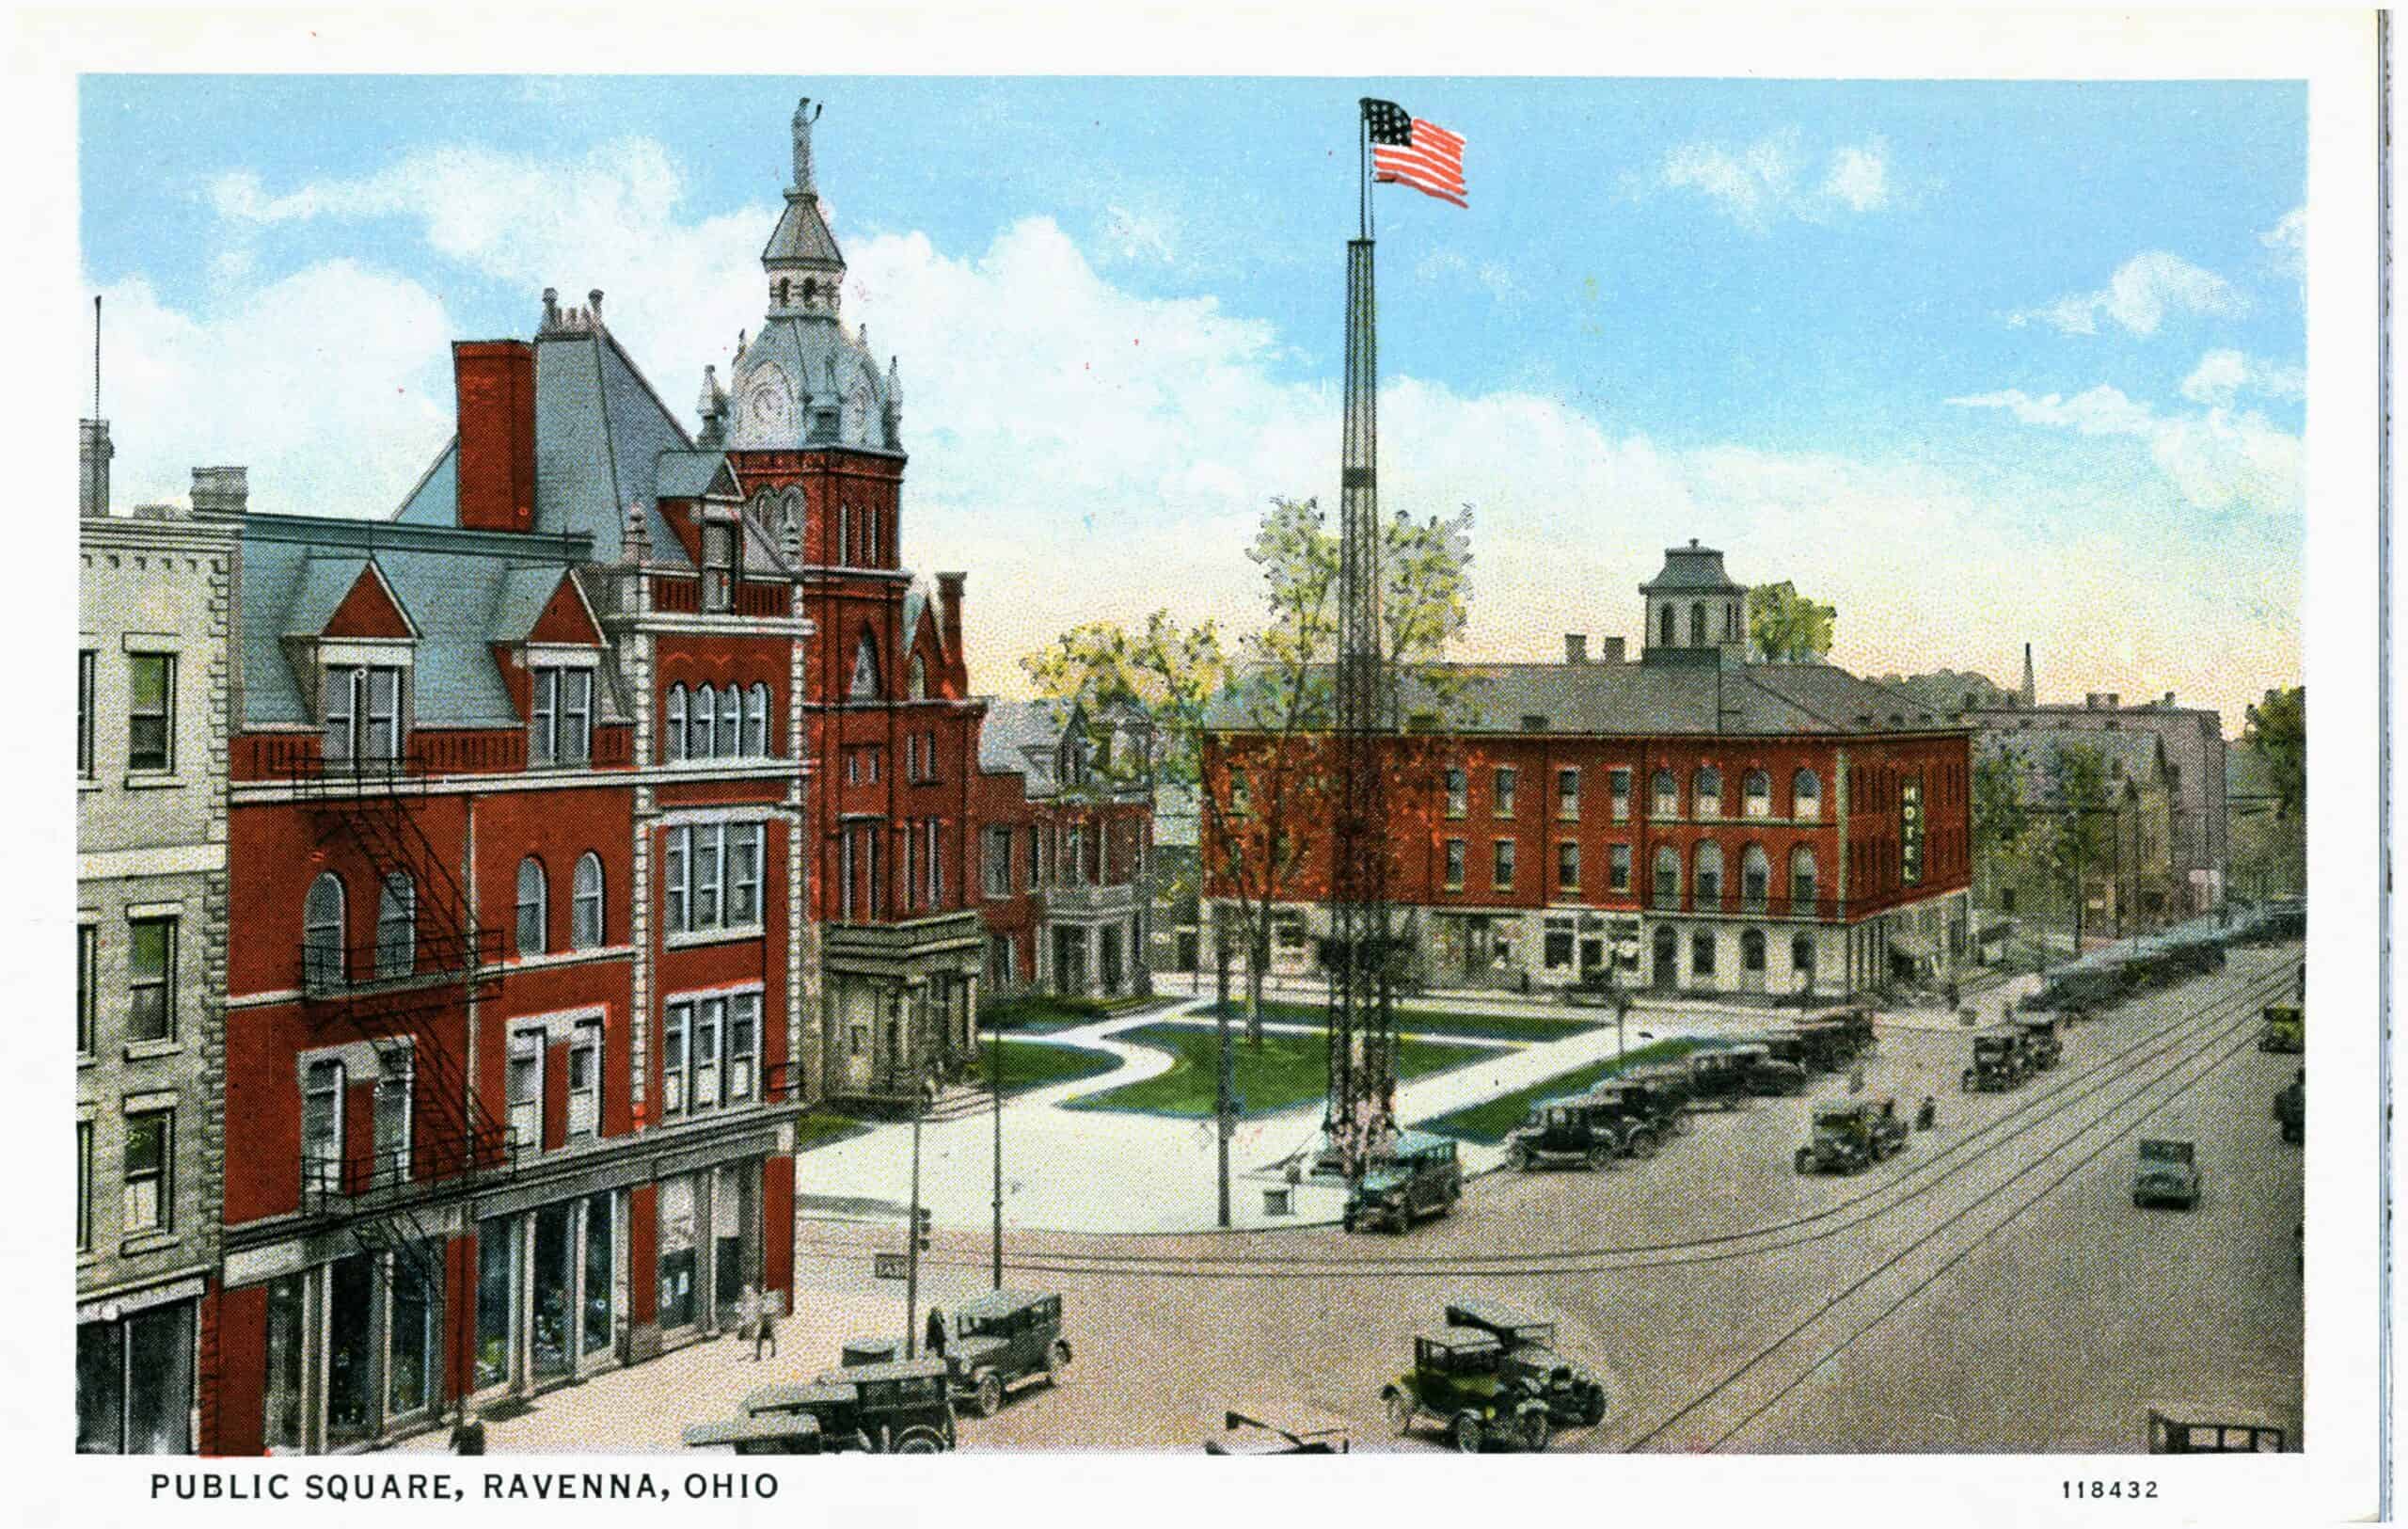
- Avg. life expectancy at birth: 77.8 years
- Poverty rate: 11.3%
- Adults with a bachelor’s degree: 31.7%
- Median household income: $69,796
- Population: 161,217
13. Hamilton County

- Avg. life expectancy at birth: 76.4 years
- Poverty rate: 14.9%
- Adults with a bachelor’s degree: 40.3%
- Median household income: $68,249
- Population: 827,671
12. Clermont County

- Avg. life expectancy at birth: 77.5 years
- Poverty rate: 8.4%
- Adults with a bachelor’s degree: 30.2%
- Median household income: $79,573
- Population: 208,851
11. Fairfield County

- Avg. life expectancy at birth: 77.7 years
- Poverty rate: 8.7%
- Adults with a bachelor’s degree: 31.1%
- Median household income: $82,969
- Population: 159,371
10. Putnam County
- Avg. life expectancy at birth: 79.8 years
- Poverty rate: 6.6%
- Adults with a bachelor’s degree: 25.9%
- Median household income: $79,453
- Population: 34,400
9. Lake County

- Avg. life expectancy at birth: 78.2 years
- Poverty rate: 7.6%
- Adults with a bachelor’s degree: 29.9%
- Median household income: $76,835
- Population: 232,236
8. Franklin County

- Avg. life expectancy at birth: 76.7 years
- Poverty rate: 14.5%
- Adults with a bachelor’s degree: 41.7%
- Median household income: $71,070
- Population: 1,318,149
7. Wood County
- Avg. life expectancy at birth: 78.3 years
- Poverty rate: 12.9%
- Adults with a bachelor’s degree: 37.5%
- Median household income: $70,537
- Population: 131,564
6. Greene County

- Avg. life expectancy at birth: 78.5 years
- Poverty rate: 10.6%
- Adults with a bachelor’s degree: 41.2%
- Median household income: $81,243
- Population: 167,567
5. Medina County

- Avg. life expectancy at birth: 80.0 years
- Poverty rate: 6.0%
- Adults with a bachelor’s degree: 35.9%
- Median household income: $89,968
- Population: 182,347
4. Union County

- Avg. life expectancy at birth: 78.9 years
- Poverty rate: 5.2%
- Adults with a bachelor’s degree: 39.3%
- Median household income: $104,496
- Population: 63,411
3. Geauga County

- Avg. life expectancy at birth: 80.9 years
- Poverty rate: 5.8%
- Adults with a bachelor’s degree: 39.4%
- Median household income: $97,162
- Population: 95,455
2. Warren County

- Avg. life expectancy at birth: 79.2 years
- Poverty rate: 5.1%
- Adults with a bachelor’s degree: 44.7%
- Median household income: $103,128
- Population: 243,189
1. Delaware County

- Avg. life expectancy at birth: 81.7 years
- Poverty rate: 4.5%
- Adults with a bachelor’s degree: 57.4%
- Median household income: $123,995
- Population: 216,074
| Rank | County | Avg. life expectancy at birth (yrs.) | Adults with a bachelor’s degree (%) | Poverty rate (%) | Population |
|---|---|---|---|---|---|
| 1 | Delaware, Ohio | 81.7 | 57.4 | 4.5 | 216,074 |
| 2 | Warren, Ohio | 79.2 | 44.7 | 5.1 | 243,189 |
| 3 | Geauga, Ohio | 80.9 | 39.4 | 5.8 | 95,455 |
| 4 | Union, Ohio | 78.9 | 39.3 | 5.2 | 63,411 |
| 5 | Medina, Ohio | 80.0 | 35.9 | 6.0 | 182,347 |
| 6 | Greene, Ohio | 78.5 | 41.2 | 10.6 | 167,567 |
| 7 | Wood, Ohio | 78.3 | 37.5 | 12.9 | 131,564 |
| 8 | Franklin, Ohio | 76.7 | 41.7 | 14.5 | 1,318,149 |
| 9 | Lake, Ohio | 78.2 | 29.9 | 7.6 | 232,236 |
| 10 | Putnam, Ohio | 79.8 | 25.9 | 6.6 | 34,400 |
| 11 | Fairfield, Ohio | 77.7 | 31.1 | 8.7 | 159,371 |
| 12 | Clermont, Ohio | 77.5 | 30.2 | 8.4 | 208,851 |
| 13 | Hamilton, Ohio | 76.4 | 40.3 | 14.9 | 827,671 |
| 14 | Portage, Ohio | 77.8 | 31.7 | 11.3 | 161,217 |
| 15 | Summit, Ohio | 76.8 | 34.6 | 12.4 | 539,361 |
| 16 | Licking, Ohio | 77.1 | 29.5 | 9.8 | 178,844 |
| 17 | Ottawa, Ohio | 77.8 | 26.9 | 8.8 | 40,367 |
| 18 | Hancock, Ohio | 77.5 | 28.5 | 10.5 | 75,072 |
| 19 | Butler, Ohio | 76.4 | 31.9 | 11.8 | 388,327 |
| 20 | Mercer, Ohio | 78.5 | 20.4 | 6.4 | 42,321 |
| 21 | Miami, Ohio | 77.4 | 24.7 | 8.5 | 108,818 |
| 22 | Auglaize, Ohio | 77.9 | 20.7 | 6.6 | 46,263 |
| 23 | Wayne, Ohio | 77.5 | 24.0 | 8.8 | 116,680 |
| 24 | Cuyahoga, Ohio | 76.5 | 35.2 | 16.5 | 1,256,620 |
| 25 | Wyandot, Ohio | 76.7 | 21.2 | 6.9 | 21,818 |
| 26 | Erie, Ohio | 76.2 | 26.5 | 11.5 | 75,299 |
| 27 | Lorain, Ohio | 77.5 | 27.2 | 13.5 | 313,101 |
| 28 | Knox, Ohio | 78.1 | 23.7 | 12.9 | 62,657 |
| 29 | Fulton, Ohio | 77.6 | 18.3 | 8.5 | 42,602 |
| 30 | Madison, Ohio | 77.5 | 20.4 | 10.2 | 43,961 |
It’s Your Money, Your Future—Own It (sponsor)
Retirement can be daunting, but it doesn’t need to be.
Imagine having an expert in your corner to help you with your financial goals. Someone to help you determine if you’re ahead, behind, or right on track. With SmartAsset, that’s not just a dream—it’s reality. This free tool connects you with pre-screened financial advisors who work in your best interests. It’s quick, it’s easy, so take the leap today and start planning smarter!
Don’t waste another minute; get started right here and help your retirement dreams become a retirement reality.
Thank you for reading! Have some feedback for us?
Contact the 24/7 Wall St. editorial team.

Our expert who first called NVIDIA in 2009 is predicting 2025 will see a historic AI breakthrough.
You can follow him investing $500,000 of his own money on our top AI stocks for free.