Life expectancy at birth has climbed sharply in recent decades. Due in large part to improved living standards and advances in medicine, average life expectancy rose globally from 51 in 1960 to 71 in 2021, according to the World Bank. While unambiguously positive, this trend — in conjunction with other recent demographic changes — is fueling an impending crisis in much of the world.
As people are living longer, healthier lives, they are also having fewer kids. Since the early 1960s, the global fertility rate — or the average number of children women have in their lifetime — has fallen by over 50%. Partially as a result, the global population is aging rapidly.
In any given country, an aging population often means workers will be retiring faster than job vacancies can be filled by those entering the labor force. As retirement-age populations grow, health care and pension systems are strained — not only by rising demand for benefits and services, but also by the smaller pool of workers paying into social safety net programs.
As recently as 2003, there were an estimated 457.4 million people aged 65 and up worldwide, or about 7% of the world population. As of 2022, there were over 779.6 million people 65 or older, equal to about 10% of the population. In some countries, the growth in retirement-age populations over the last 20 years has been far more pronounced.
Using data from the World Bank, 24/7 Wall St. identified the countries that are aging the fastest. Countries are ranked on the percentage point change in the share of the population aged 65 and up between 2003 to 2022. Data on median age by country is from the CIA World Factbook and is for the most recent available year. All other supplementary data is from the World Bank and is also for the most recent available year.
Globally, the share of people aged 65 and up increased by 2.6 percentage points between 2003 and 2022. Among the countries on this list, retirement-age residents as a share of the total population climbed by anywhere from about 5 percentage points to more than 13 percentage points over the same period. Now, the share of the population older than 64 in these countries ranges from 11.5% to 35.9%.
Most countries on this list are relatively wealthy. In all but a handful, gross domestic product per capita exceeds the $12,688 global average. Health outcomes tend to be better in high-income areas, and in each of these countries, life expectancy at birth exceeds the 71.3 year global average — by over a decade in some cases. (Here is a look at the countries with the most millionaires.)
Birth rates have also historically trended lower in wealthier countries. For a country to maintain a steady population size — immigration notwithstanding — the average fertility rate should stand at around 2.1 children per woman. In every country on this list with available data, fertility rates are below that threshold. (Here is a look at the countries with devastatingly low birth rates.)
Why It Matters
Demographic trends, like an aging population, can have far-reaching consequences. In any given country, more older residents can mean fewer people to fill essential jobs, and fewer workers to support a growing number of retirees. The problem is expected to get worse before it gets better. There were over 700 million people aged 65 and older worldwide in 2020, and according to U.N. estimates, that number is expected to double by mid-century.
31. United States
20-yr. change in pct. of pop. aged 65+: +4.9 ppt. (12.3% in 2003, 17.1% in 2022)
65 and older population in 2022: 57,085,895 (+60.3% from 2003)
Avg. life expectancy at birth: 76.3 years
Median age in 2022: 38.9 years
Fertility rate: Avg. of 1.7 children per woman over lifetime
GDP per capita: $76,330
Region: North America
30. Italy
20-yr. change in pct. of pop. aged 65+: +4.9 ppt. (19.1% in 2003, 24.1% in 2022)
65 and older population in 2022: 14,177,282 (+29.3% from 2003)
Avg. life expectancy at birth: 82.8 years
Median age in 2024: 48.4 years
Fertility rate: Avg. of 1.3 children per woman over lifetime
GDP per capita: $34,776
Region: Europe
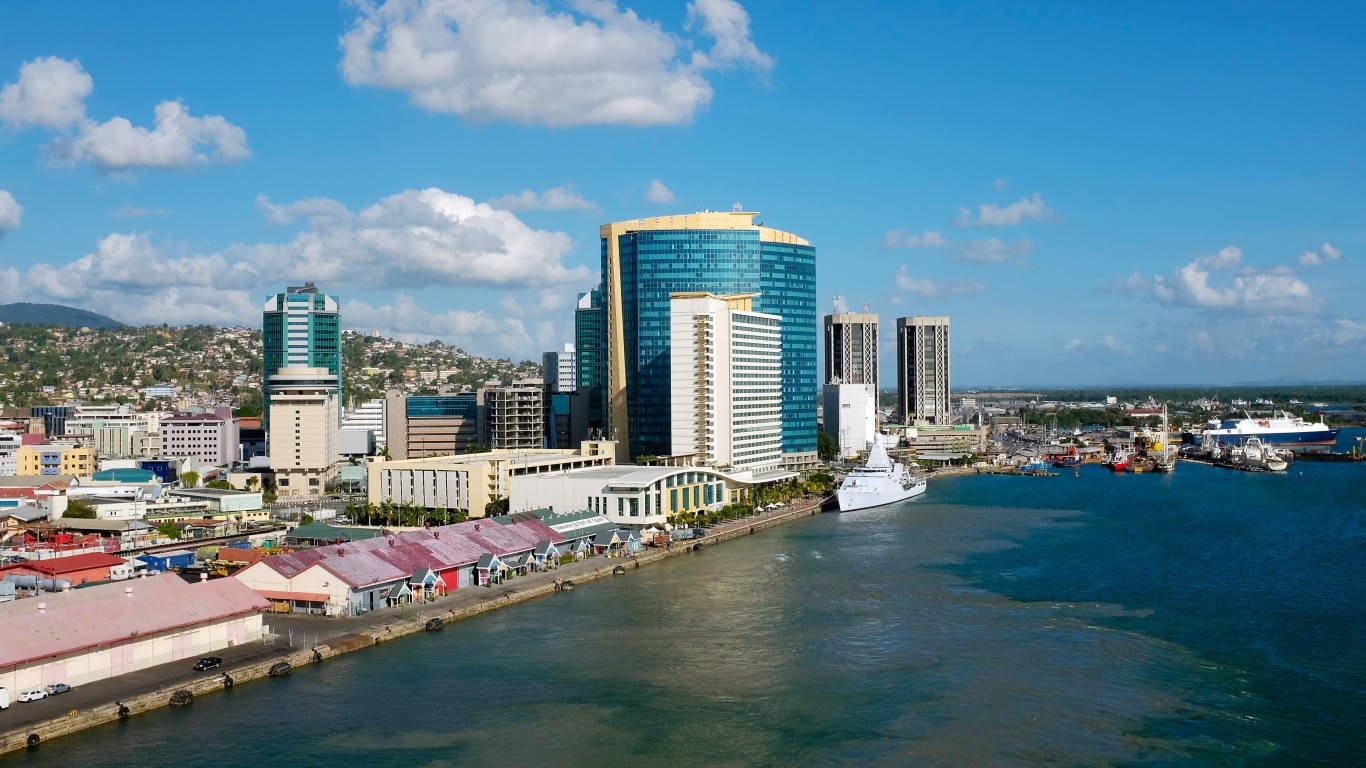
29. Barbados
20-yr. change in pct. of pop. aged 65+: +5.0 ppt. (11.3% in 2003, 16.3% in 2022)
65 and older population in 2022: 45,840 (+51.3% from 2003)
Avg. life expectancy at birth: 77.6 years
Median age in 2024: 41.4 years
Fertility rate: Avg. of 1.6 children per woman over lifetime
GDP per capita: $20,239
Region: Central America and the Caribbean
28. Bulgaria
20-yr. change in pct. of pop. aged 65+: +5.0 ppt. (17.4% in 2003, 22.4% in 2022)
65 and older population in 2022: 1,446,752 (+7.0% from 2003)
Avg. life expectancy at birth: 71.5 years
Median age in 2024: 45.1 years
Fertility rate: Avg. of 1.6 children per woman over lifetime
20-yr. change in pct. of pop. aged 65+: +8.6 ppt. (10.7% in 2003, 19.4% in 2022)
65 and older population in 2022: 7,616 (+109.0% from 2003)
Avg. life expectancy at birth: 84.4 years
Median age in 2024: 44.2 years
Fertility rate: Avg. of 1.5 children per woman over lifetime
GDP per capita: $197,505
Region: Europe
3. South Korea
20-yr. change in pct. of pop. aged 65+: +9.2 ppt. (8.3% in 2003, 17.5% in 2022)
65 and older population in 2022: 9,030,344 (+128.2% from 2003)
Avg. life expectancy at birth: 83.5 years
Median age in 2024: 45.5 years
Fertility rate: Avg. of 0.8 children per woman over lifetime
GDP per capita: $32,423
Region: East and Southeast Asia
2. Japan
20-yr. change in pct. of pop. aged 65+: +10.4 ppt. (19.6% in 2003, 29.9% in 2022)
65 and older population in 2022: 37,443,104 (+49.8% from 2003)
Avg. life expectancy at birth: 84.4 years
Median age in 2024: 49.9 years
Fertility rate: Avg. of 1.3 children per woman over lifetime
GDP per capita: $34,017
Region: East and Southeast Asia
1. Monaco
20-yr. change in pct. of pop. aged 65+: +13.3 ppt. (22.6% in 2003, 35.9% in 2022)
65 and older population in 2022: 13,099 (+79.5% from 2003)
Avg. life expectancy at birth: N/A
Median age in 2024: 56.9 years
Fertility rate: N/A
GDP per capita: $240,862
Region: Europe
In 20 Years, I Haven’t Seen A Cash Back Card This Good
After two decades of reviewing financial products I haven’t seen anything like this. Credit card companies are at war, handing out free rewards and benefits to win the best customers.
A good cash back card can be worth thousands of dollars a year in free money, not to mention other perks like travel, insurance, and access to fancy lounges.
Flywheel Publishing has partnered with CardRatings for our coverage of credit card products. Flywheel Publishing and CardRatings may receive a commission from card issuers.