
Florida had the highest increase in net migration nationwide, meaning more people moved into the state than moved out of it compared to all other states. At least two people that made the move to Florida recently aren’t happy about it. The two, employees of Disney, are suing the company, alleging it misrepresented its plans about a project that would move 2,000 jobs to the state. As a result, many employees from California moved to Florida — only for the project to be canceled.
Disney employees aside, Florida continues to attract Americans from across the country, and its cities are among the top ones growing through net migration.
To determine the cities Americans are flocking to, 24/7 Wall St. reviewed data from the U.S. Census Bureau’s Population and Housing Unit Estimates program. Metropolitan statistical areas were ranked based on the percentage change in population due to net migration alone from July 1, 2022 to July 1, 2023, and we included the top 35 cities. Data on median home value came from the Census Bureau’s 2022 American Community and figures are one-year estimates. Unemployment rates for April 2024 came from the U.S. Bureau of Labor Statistics and are not seasonally adjusted.
Among the cities on the list, the population grew through net migration by 1.7% or more in one year alone. And while the U.S. population grew by 0.49% from July 2022 to July 2023, the total population growth among the cities on the list ranges from 1.2% to 4.7%.
Natural change (births minus deaths) contributed 0.15% to population growth nationwide, and immigration contributed 0.34%. In the cities on the list, natural change contributed anywhere from -1.4% (meaning it had a negative effect on population growth) to 1.2%.
Of the 35 cities that relatively attracted the most residents, a whopping 15 are in Florida, including four of the top five. Next are five cities in South Carolina. (On the flip side, also see: Cities Americans Are Abandoning in Droves.)
Several factors determine the attractiveness of a city, including subjective factors such as weather, community, and vibrancy, and more objective factors such as jobs, cost of living, and housing affordability. In the majority of the cities on the list either the unemployment rate is lower than the 3.5% national rate (in April), or the median home value is lower than the national value of $320,900 in 2022. Still, in some cities, including No. 1 — The Villages, Florida — this is not the case and these cities continues to attract residents regardless.
Why Are We Covering This

35. Greenville-Anderson-Greer, SC

- Population change due to migration, 2022-2023: 1.69% (16,216)
- Migration breakdown, 2022-2023: international: +2,335; domestic: +13,881
- Total population change, 2022-2023: +16,562 or +1.73% (#41 fastest growth)
- Population change due to migration, 2020-2023: 5.22% (#41 fastest growth)
- Unemployment rate, April 2024: 2.7% (Greenville-Anderson-Mauldin, SC)
- Median home value, 2022: $259,600 (Greenville-Anderson, SC)
- Total population, 2023: 975,480
34. Orlando-Kissimmee-Sanford, FL

- Population change due to migration, 2022-2023: 1.69% (46,794)
- Migration breakdown, 2022-2023: international: +29,343; domestic: +17,451
- Total population change, 2022-2023: +54,916 or +1.99% (#29 fastest growth)
- Population change due to migration, 2020-2023: 4.64% (#51 fastest growth)
- Unemployment rate, April 2024: 3.2%
- Median home value, 2022: $361,100
- Total population, 2023: 2,817,933
33. Hinesville, GA

- Population change due to migration, 2022-2023: 1.73% (1,493)
- Migration breakdown, 2022-2023: international: +187; domestic: +1,306
- Total population change, 2022-2023: +2,490 or +2.88% (#6 fastest growth)
- Population change due to migration, 2020-2023: 5.28% (#39 fastest growth)
- Unemployment rate, April 2024: 3.1%
- Median home value, 2022: $187,900
- Total population, 2023: 88,804
32. Gainesville, GA

- Population change due to migration, 2022-2023: 1.74% (3,698)
- Migration breakdown, 2022-2023: international: +671; domestic: +3,027
- Total population change, 2022-2023: +4,646 or +2.19% (#22 fastest growth)
- Population change due to migration, 2020-2023: 5.90% (#33 fastest growth)
- Unemployment rate, April 2024: 2.0%
- Median home value, 2022: $355,500
- Total population, 2023: 217,267
31. Fayetteville-Springdale-Rogers, AR

- Population change due to migration, 2022-2023: 1.77% (10,237)
- Migration breakdown, 2022-2023: international: +2,234; domestic: +8,003
- Total population change, 2022-2023: +13,370 or +2.32% (#18 fastest growth)
- Population change due to migration, 2020-2023: 6.40% (#30 fastest growth)
- Unemployment rate, April 2024: 4.3% (Fayetteville, NC)
- Median home value, 2022: $291,600
- Total population, 2023: 590,337
30. Midland, TX

- Population change due to migration, 2022-2023: 1.85% (3,274)
- Migration breakdown, 2022-2023: international: +731; domestic: +2,543
- Total population change, 2022-2023: +5,077 or +2.86% (#7 fastest growth)
- Population change due to migration, 2020-2023: 1.07% (#180 fastest growth)
- Unemployment rate, April 2024: 2.2%
- Median home value, 2022: $284,700
- Total population, 2023: 182,324
29. Helena, MT

- Population change due to migration, 2022-2023: 1.85% (1,750)
- Migration breakdown, 2022-2023: international: +61; domestic: +1,689
- Total population change, 2022-2023: +1,705 or +1.81% (#39 fastest growth)
- Population change due to migration, 2020-2023: 7.26% (#26 fastest growth)
- Unemployment rate, April 2024: N/A% {For metro J}
- Median home value, 2022: $383,500
- Total population, 2023: 96,091
28. Prescott Valley-Prescott, AZ

- Population change due to migration, 2022-2023: 1.90% (4,667)
- Migration breakdown, 2022-2023: international: +153; domestic: +4,514
- Total population change, 2022-2023: +2,851 or +1.16% (#73 fastest growth)
- Population change due to migration, 2020-2023: 8.42% (#20 fastest growth)
- Unemployment rate, April 2024: 2.4% (Prescott, AZ)
- Median home value, 2022: $434,700
- Total population, 2023: 249,081
27. Naples-Marco Island, FL
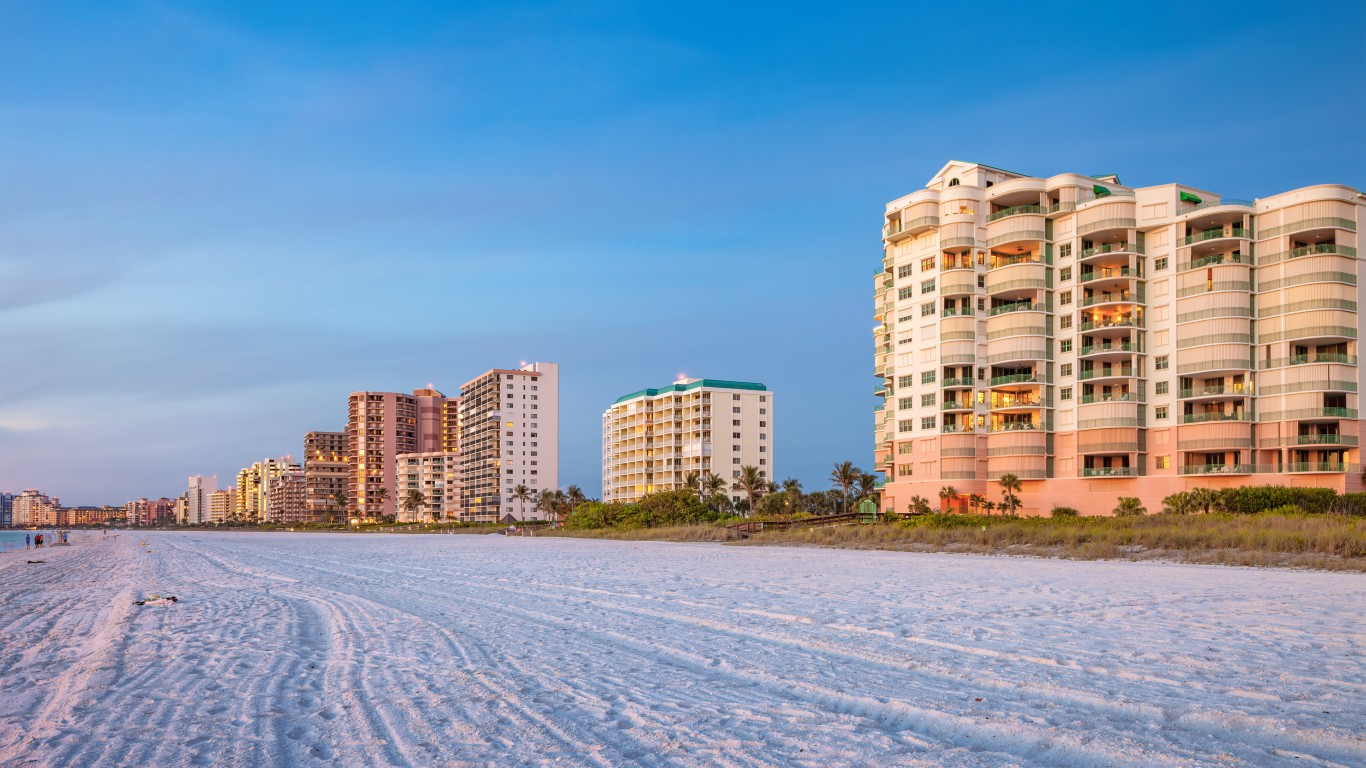
- Population change due to migration, 2022-2023: 1.91% (7,579)
- Migration breakdown, 2022-2023: international: +3,382; domestic: +4,197
- Total population change, 2022-2023: +6,794 or +1.71% (#42 fastest growth)
- Population change due to migration, 2020-2023: 8.56% (#18 fastest growth)
- Unemployment rate, April 2024: 2.9% (Naples-Immokalee-Marco Island, FL)
- Median home value, 2022: $541,500
- Total population, 2023: 404,310
26. Hilton Head Island-Bluffton-Port Royal, SC

- Population change due to migration, 2022-2023: 1.91% (4,353)
- Migration breakdown, 2022-2023: international: +504; domestic: +3,849
- Total population change, 2022-2023: +4,390 or +1.92% (#31 fastest growth)
- Population change due to migration, 2020-2023: 7.83% (#24 fastest growth)
- Unemployment rate, April 2024: 2.6% (Hilton Head Island-Bluffton-Beaufort, SC)
- Median home value, 2022: $447,700 (Hilton Head Island-Bluffton, SC)
- Total population, 2023: 232,523
25. Johnson City, TN

- Population change due to migration, 2022-2023: 1.93% (4,062)
- Migration breakdown, 2022-2023: international: +248; domestic: +3,814
- Total population change, 2022-2023: +2,975 or +1.42% (#58 fastest growth)
- Population change due to migration, 2020-2023: 4.73% (#46 fastest growth)
- Unemployment rate, April 2024: 2.7%
- Median home value, 2022: $221,400
- Total population, 2023: 213,198
24. Greeley, CO

- Population change due to migration, 2022-2023: 1.94% (6,781)
- Migration breakdown, 2022-2023: international: +527; domestic: +6,254
- Total population change, 2022-2023: +9,176 or +2.62% (#12 fastest growth)
- Population change due to migration, 2020-2023: 7.00% (#27 fastest growth)
- Unemployment rate, April 2024: 3.5% {For metro J}
- Median home value, 2022: $456,100
- Total population, 2023: 359,442
23. Charleston-North Charleston, SC

- Population change due to migration, 2022-2023: 1.94% (16,127)
- Migration breakdown, 2022-2023: international: +1,865; domestic: +14,262
- Total population change, 2022-2023: +19,065 or +2.30% (#19 fastest growth)
- Population change due to migration, 2020-2023: 5.22% (#40 fastest growth)
- Unemployment rate, April 2024: 2.4%
- Median home value, 2022: $363,000
- Total population, 2023: 849,417
22. Jacksonville, FL

- Population change due to migration, 2022-2023: 2.04% (34,143)
- Migration breakdown, 2022-2023: international: +6,679; domestic: +27,464
- Total population change, 2022-2023: +36,911 or +2.20% (#21 fastest growth)
- Population change due to migration, 2020-2023: 6.37% (#31 fastest growth)
- Unemployment rate, April 2024: 3.2%
- Median home value, 2022: $347,000
- Total population, 2023: 1,713,240
21. St. George, UT

- Population change due to migration, 2022-2023: 2.12% (4,196)
- Migration breakdown, 2022-2023: international: +173; domestic: +4,023
- Total population change, 2022-2023: +4,722 or +2.39% (#16 fastest growth)
- Population change due to migration, 2020-2023: 11.59% (#6 fastest growth)
- Unemployment rate, April 2024: 2.8%
- Median home value, 2022: $528,400
- Total population, 2023: 202,452
20. Morristown, TN

- Population change due to migration, 2022-2023: 2.22% (2,700)
- Migration breakdown, 2022-2023: international: +160; domestic: +2,540
- Total population change, 2022-2023: +2,227 or +1.83% (#37 fastest growth)
- Population change due to migration, 2020-2023: 5.70% (#35 fastest growth)
- Unemployment rate, April 2024: 2.8%
- Median home value, 2022: $203,500
- Total population, 2023: 124,054
19. Sebastian-Vero Beach-West Vero Corridor, FL
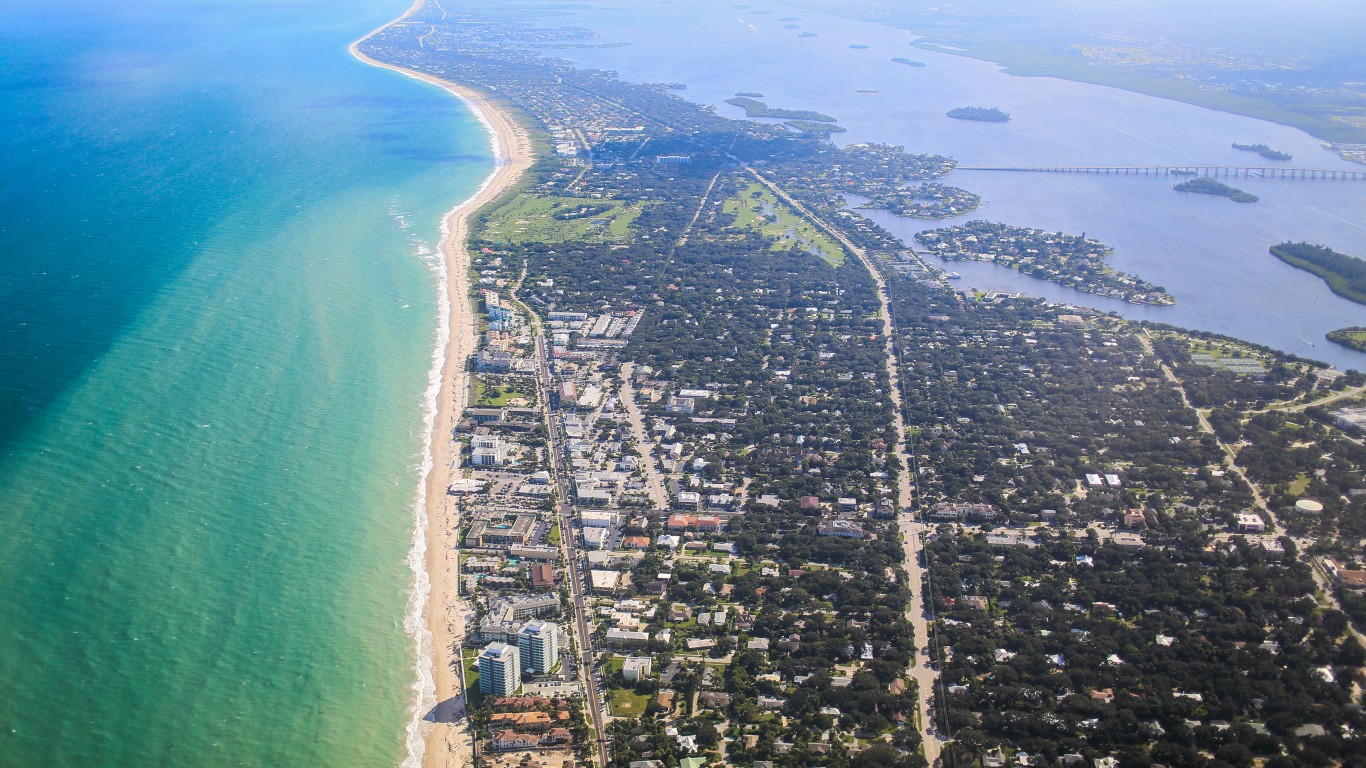
- Population change due to migration, 2022-2023: 2.25% (3,761)
- Migration breakdown, 2022-2023: international: +465; domestic: +3,296
- Total population change, 2022-2023: +2,528 or +1.51% (#53 fastest growth)
- Population change due to migration, 2020-2023: 9.05% (#15 fastest growth)
- Unemployment rate, April 2024: 3.7% (Sebastian-Vero Beach, FL)
- Median home value, 2022: $344,400 (Sebastian-Vero Beach, FL)
- Total population, 2023: 169,795
18. Lake Havasu City-Kingman, AZ

- Population change due to migration, 2022-2023: 2.28% (5,033)
- Migration breakdown, 2022-2023: international: +81; domestic: +4,952
- Total population change, 2022-2023: +2,777 or +1.26% (#68 fastest growth)
- Population change due to migration, 2020-2023: 8.68% (#16 fastest growth)
- Unemployment rate, April 2024: 3.2%
- Median home value, 2022: $290,800
- Total population, 2023: 223,682
17. Huntsville, AL

- Population change due to migration, 2022-2023: 2.29% (11,756)
- Migration breakdown, 2022-2023: international: +893; domestic: +10,863
- Total population change, 2022-2023: +12,781 or +2.48% (#15 fastest growth)
- Population change due to migration, 2020-2023: 6.83% (#29 fastest growth)
- Unemployment rate, April 2024: 2.2%
- Median home value, 2022: $292,700
- Total population, 2023: 527,254
16. Sherman-Denison, TX

- Population change due to migration, 2022-2023: 2.50% (3,573)
- Migration breakdown, 2022-2023: international: +132; domestic: +3,441
- Total population change, 2022-2023: +3,709 or +2.59% (#13 fastest growth)
- Population change due to migration, 2020-2023: 8.59% (#17 fastest growth)
- Unemployment rate, April 2024: 3.4%
- Median home value, 2022: $250,500
- Total population, 2023: 146,907
15. North Port-Bradenton-Sarasota, FL

- Population change due to migration, 2022-2023: 2.55% (22,777)
- Migration breakdown, 2022-2023: international: +2,951; domestic: +19,826
- Total population change, 2022-2023: +18,387 or +2.06% (#28 fastest growth)
- Population change due to migration, 2020-2023: 11.26% (#10 fastest growth)
- Unemployment rate, April 2024: 3.3% (North Port-Sarasota-Bradenton, FL)
- Median home value, 2022: $402,600 (North Port-Sarasota-Bradenton, FL)
- Total population, 2023: 910,108
14. Palm Bay-Melbourne-Titusville, FL

- Population change due to migration, 2022-2023: 2.59% (16,326)
- Migration breakdown, 2022-2023: international: +1,440; domestic: +14,886
- Total population change, 2022-2023: +13,272 or +2.10% (#25 fastest growth)
- Population change due to migration, 2020-2023: 8.11% (#22 fastest growth)
- Unemployment rate, April 2024: 3.3%
- Median home value, 2022: $336,800
- Total population, 2023: 643,979
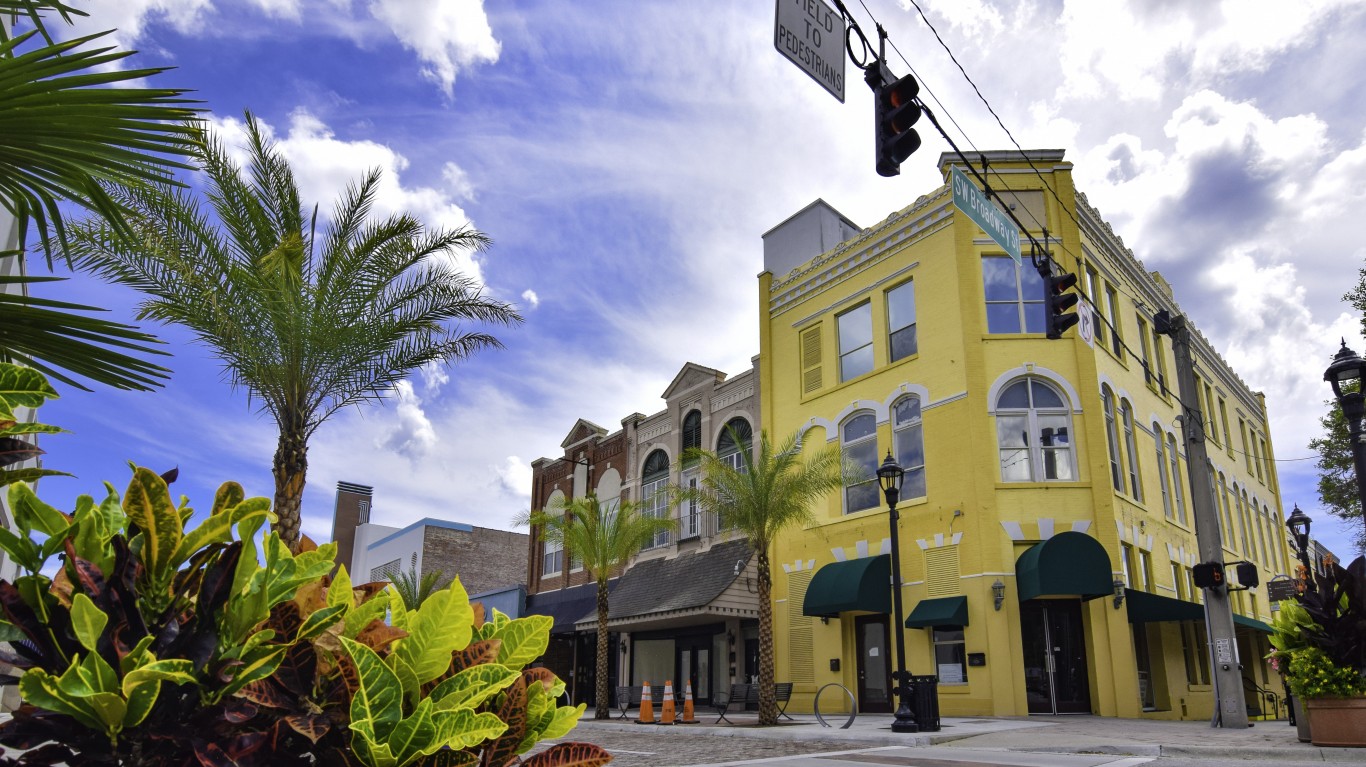
13. Deltona-Daytona Beach-Ormond Beach, FL
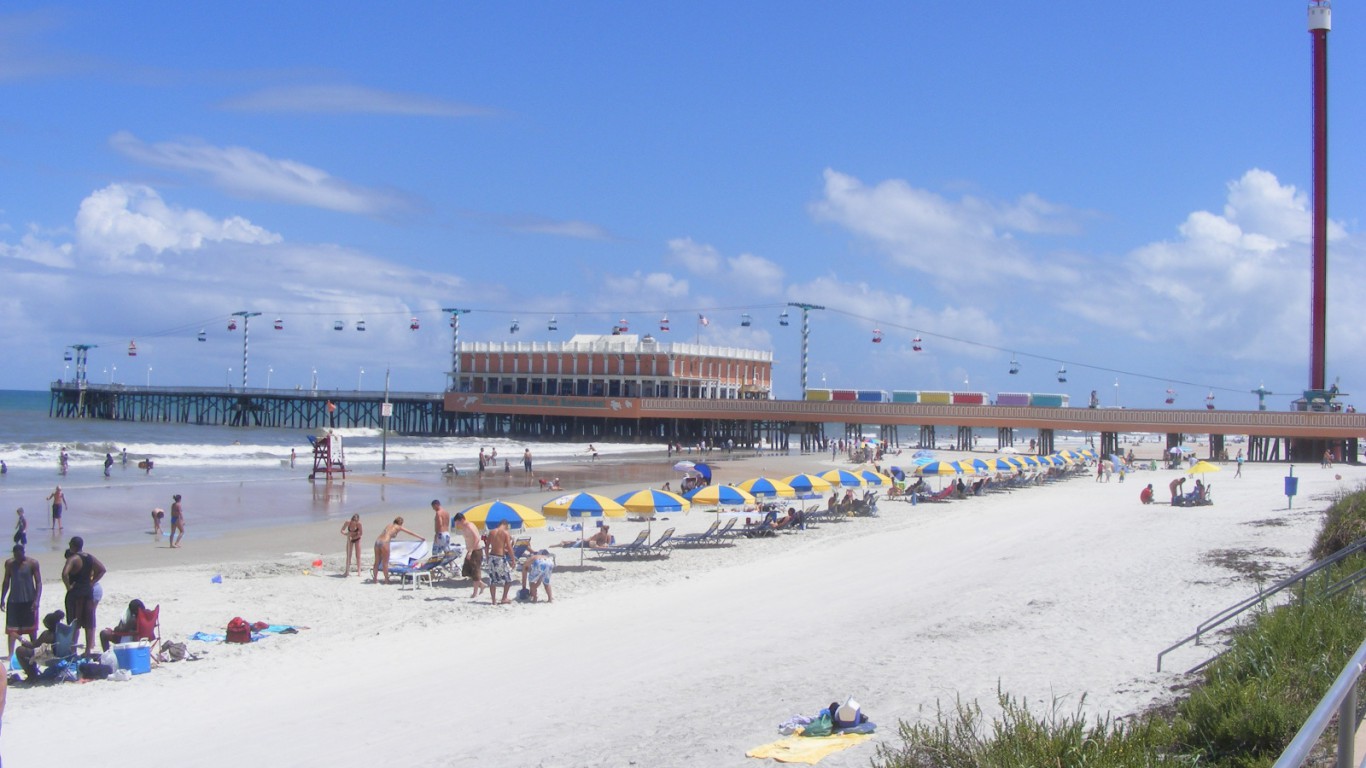
- Population change due to migration, 2022-2023: 2.72% (19,187)
- Migration breakdown, 2022-2023: international: +1,617; domestic: +17,570
- Total population change, 2022-2023: +15,373 or +2.18% (#23 fastest growth)
- Population change due to migration, 2020-2023: 10.13% (#12 fastest growth)
- Unemployment rate, April 2024: 3.6%
- Median home value, 2022: $320,200
- Total population, 2023: 721,796
12. Punta Gorda, FL
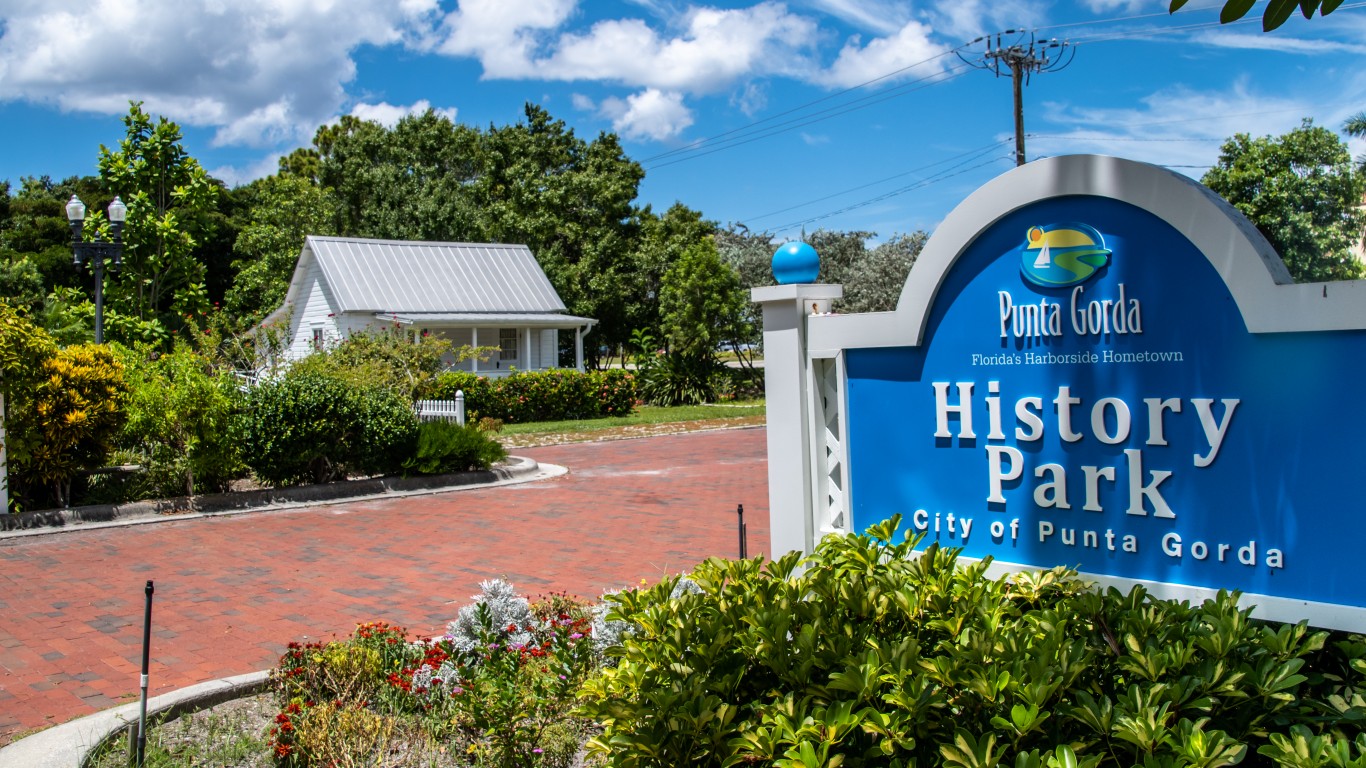
- Population change due to migration, 2022-2023: 2.74% (5,549)
- Migration breakdown, 2022-2023: international: +492; domestic: +5,057
- Total population change, 2022-2023: +3,552 or +1.75% (#40 fastest growth)
- Population change due to migration, 2020-2023: 14.20% (#3 fastest growth)
- Unemployment rate, April 2024: 3.7% {For metro J}
- Median home value, 2022: $342,700
- Total population, 2023: 206,134
11. Panama City-Panama City Beach, FL
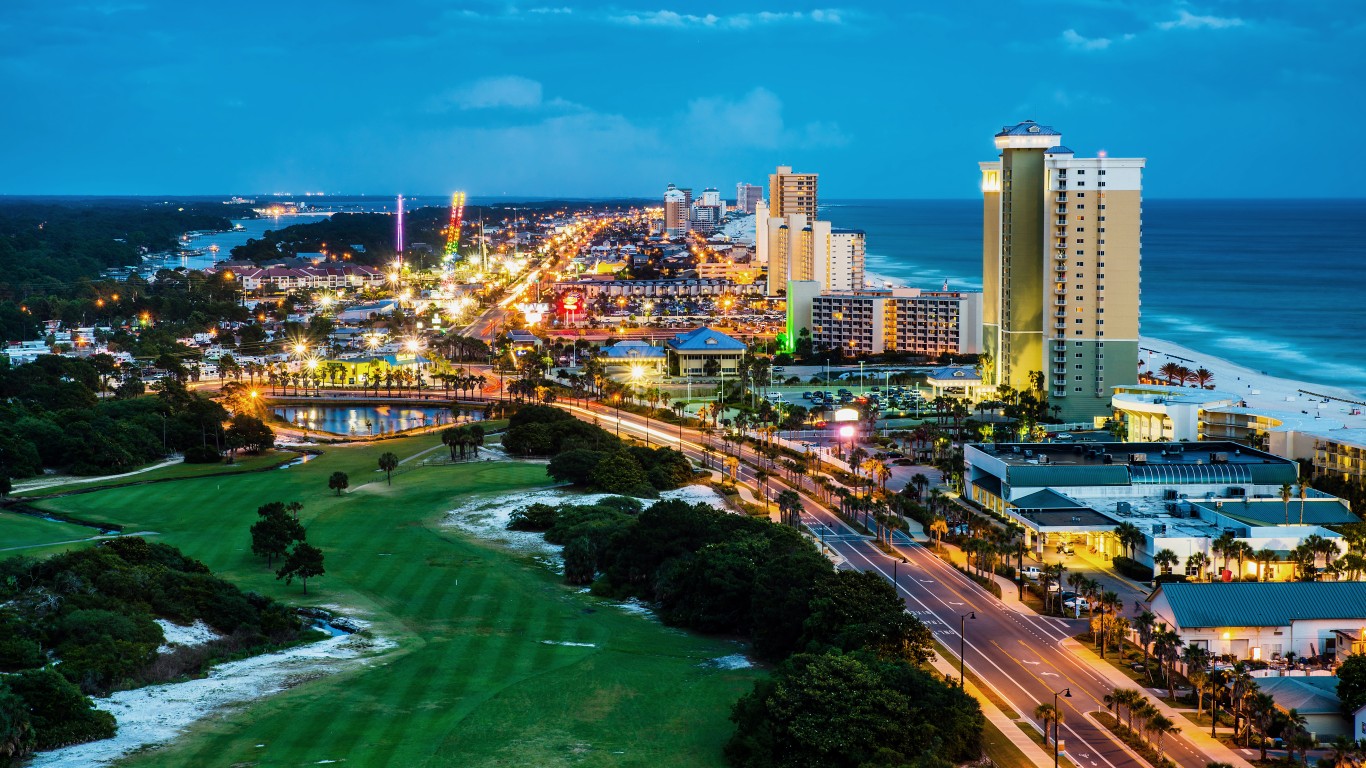
- Population change due to migration, 2022-2023: 2.80% (5,907)
- Migration breakdown, 2022-2023: international: +749; domestic: +5,158
- Total population change, 2022-2023: +5,756 or +2.73% (#11 fastest growth)
- Population change due to migration, 2020-2023: 8.51% (#19 fastest growth)
- Unemployment rate, April 2024: 3.0% (Panama City, FL)
- Median home value, 2022: $312,800 (Panama City, FL)
- Total population, 2023: 216,371
10. Sebring, FL
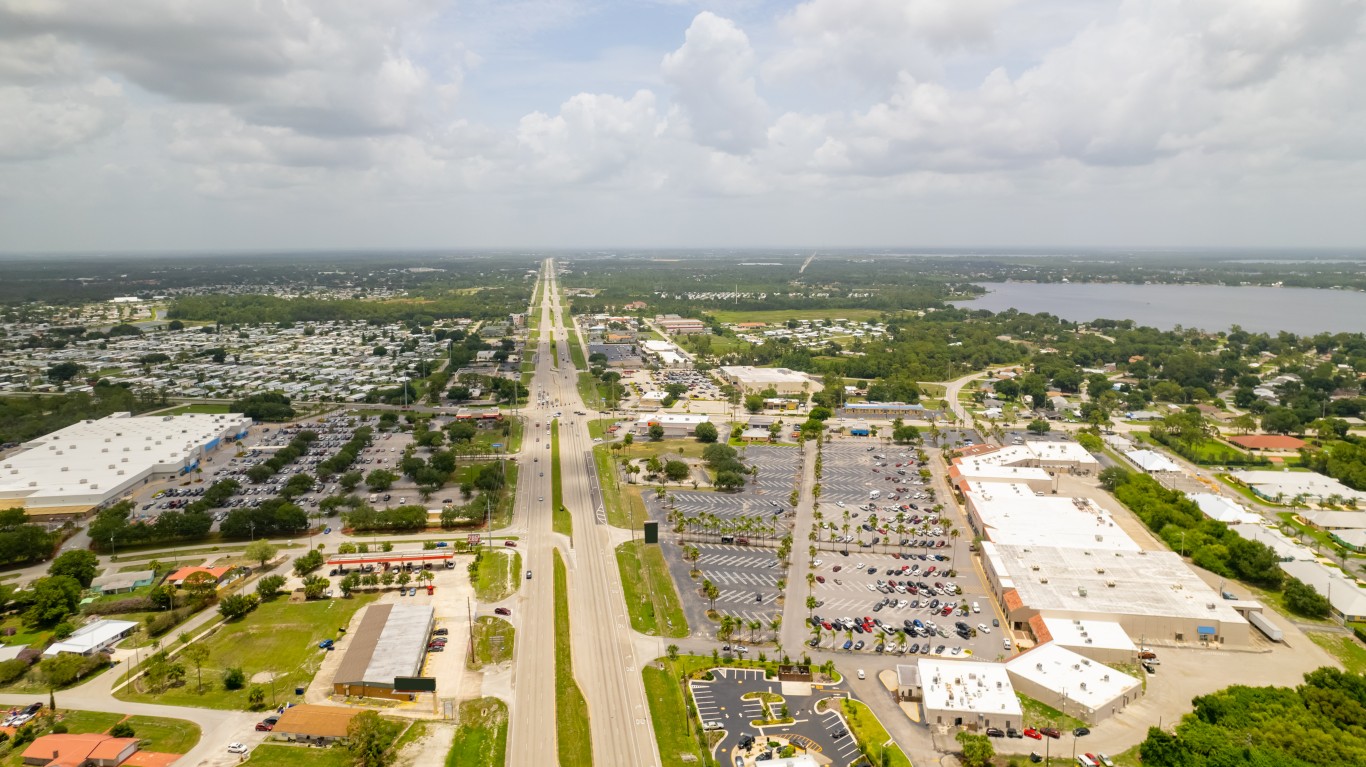
- Population change due to migration, 2022-2023: 2.85% (3,007)
- Migration breakdown, 2022-2023: international: +307; domestic: +2,700
- Total population change, 2022-2023: +1,965 or +1.86% (#34 fastest growth)
- Population change due to migration, 2020-2023: 10.07% (#13 fastest growth)
- Unemployment rate, April 2024: 4.6%
- Median home value, 2022: $176,900 (Sebring-Avon Park, FL)
- Total population, 2023: 107,614
9. Daphne-Fairhope-Foley, AL
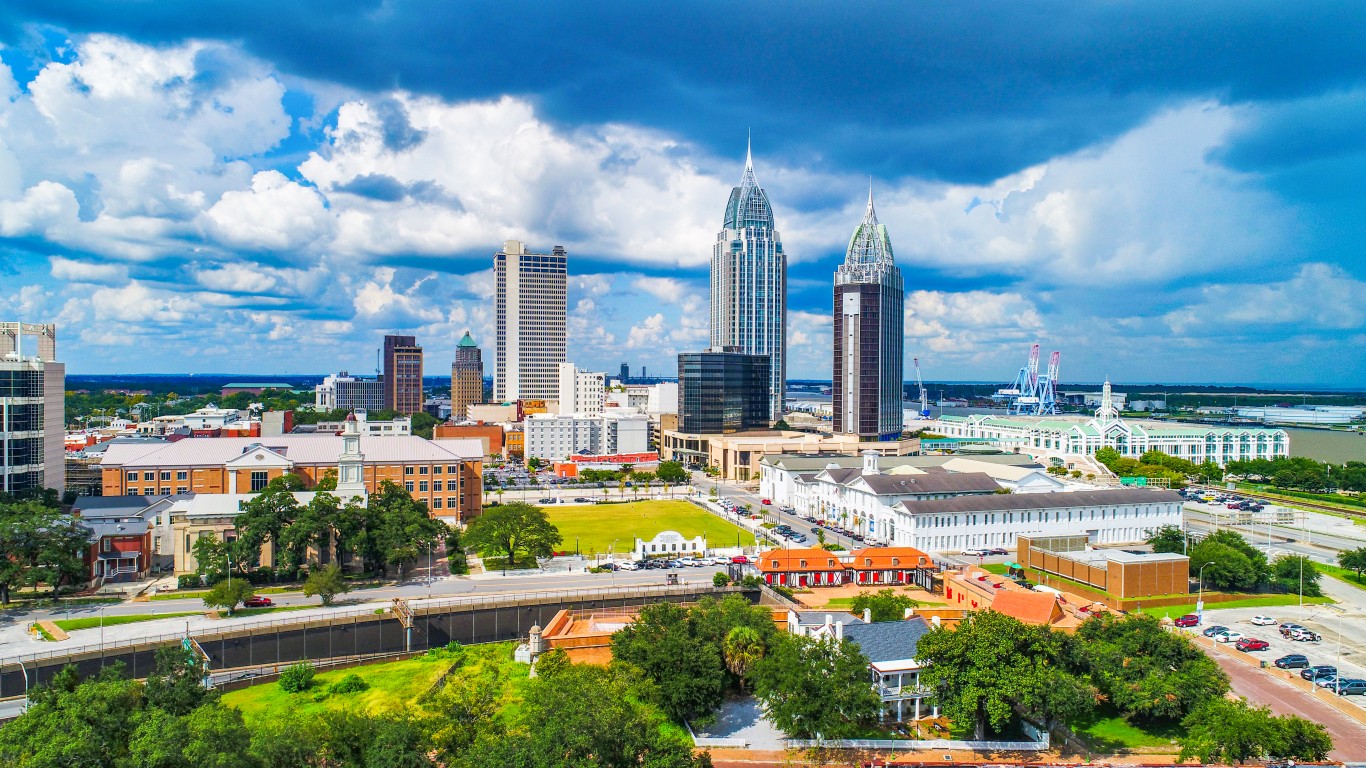
- Population change due to migration, 2022-2023: 2.88% (7,095)
- Migration breakdown, 2022-2023: international: +291; domestic: +6,804
- Total population change, 2022-2023: +6,976 or +2.83% (#10 fastest growth)
- Population change due to migration, 2020-2023: 9.90% (#14 fastest growth)
- Unemployment rate, April 2024: 2.5%
- Median home value, 2022: $304,600
- Total population, 2023: 253,507
8. Spartanburg, SC

- Population change due to migration, 2022-2023: 2.91% (10,855)
- Migration breakdown, 2022-2023: international: +660; domestic: +10,195
- Total population change, 2022-2023: +10,640 or +2.85% (#8 fastest growth)
- Population change due to migration, 2020-2023: 8.30% (#21 fastest growth)
- Unemployment rate, April 2024: 2.8%
- Median home value, 2022: $231,300
- Total population, 2023: 383,327
7. Wilmington, NC

- Population change due to migration, 2022-2023: 3.04% (13,801)
- Migration breakdown, 2022-2023: international: +459; domestic: +13,342
- Total population change, 2022-2023: +12,947 or +2.85% (#9 fastest growth)
- Population change due to migration, 2020-2023: 11.37% (#9 fastest growth)
- Unemployment rate, April 2024: 2.8%
- Median home value, 2022: $357,100
- Total population, 2023: 467,337
6. Port St. Lucie, FL
- Population change due to migration, 2022-2023: 3.34% (17,415)
- Migration breakdown, 2022-2023: international: +1,566; domestic: +15,849
- Total population change, 2022-2023: +16,028 or +3.08% (#5 fastest growth)
- Population change due to migration, 2020-2023: 11.39% (#8 fastest growth)
- Unemployment rate, April 2024: 3.6% {For metro J}
- Median home value, 2022: $363,600
- Total population, 2023: 536,901
5. Lakeland-Winter Haven, FL

- Population change due to migration, 2022-2023: 3.72% (29,364)
- Migration breakdown, 2022-2023: international: +3,335; domestic: +26,029
- Total population change, 2022-2023: +29,948 or +3.80% (#2 fastest growth)
- Population change due to migration, 2020-2023: 12.96% (#5 fastest growth)
- Unemployment rate, April 2024: 3.9%
- Median home value, 2022: $267,500
- Total population, 2023: 818,330
4. Homosassa Springs, FL

- Population change due to migration, 2022-2023: 3.87% (6,296)
- Migration breakdown, 2022-2023: international: +113; domestic: +6,183
- Total population change, 2022-2023: +4,188 or +2.58% (#14 fastest growth)
- Population change due to migration, 2020-2023: 13.26% (#4 fastest growth)
- Unemployment rate, April 2024: 4.9%
- Median home value, 2022: $239,700
- Total population, 2023: 166,696
3. Ocala, FL
- Population change due to migration, 2022-2023: 4.04% (16,015)
- Migration breakdown, 2022-2023: international: +848; domestic: +15,167
- Total population change, 2022-2023: +13,522 or +3.41% (#4 fastest growth)
- Population change due to migration, 2020-2023: 11.55% (#7 fastest growth)
- Unemployment rate, April 2024: 4.0%
- Median home value, 2022: $243,200
- Total population, 2023: 409,959
2. Myrtle Beach-Conway-North Myrtle Beach, SC
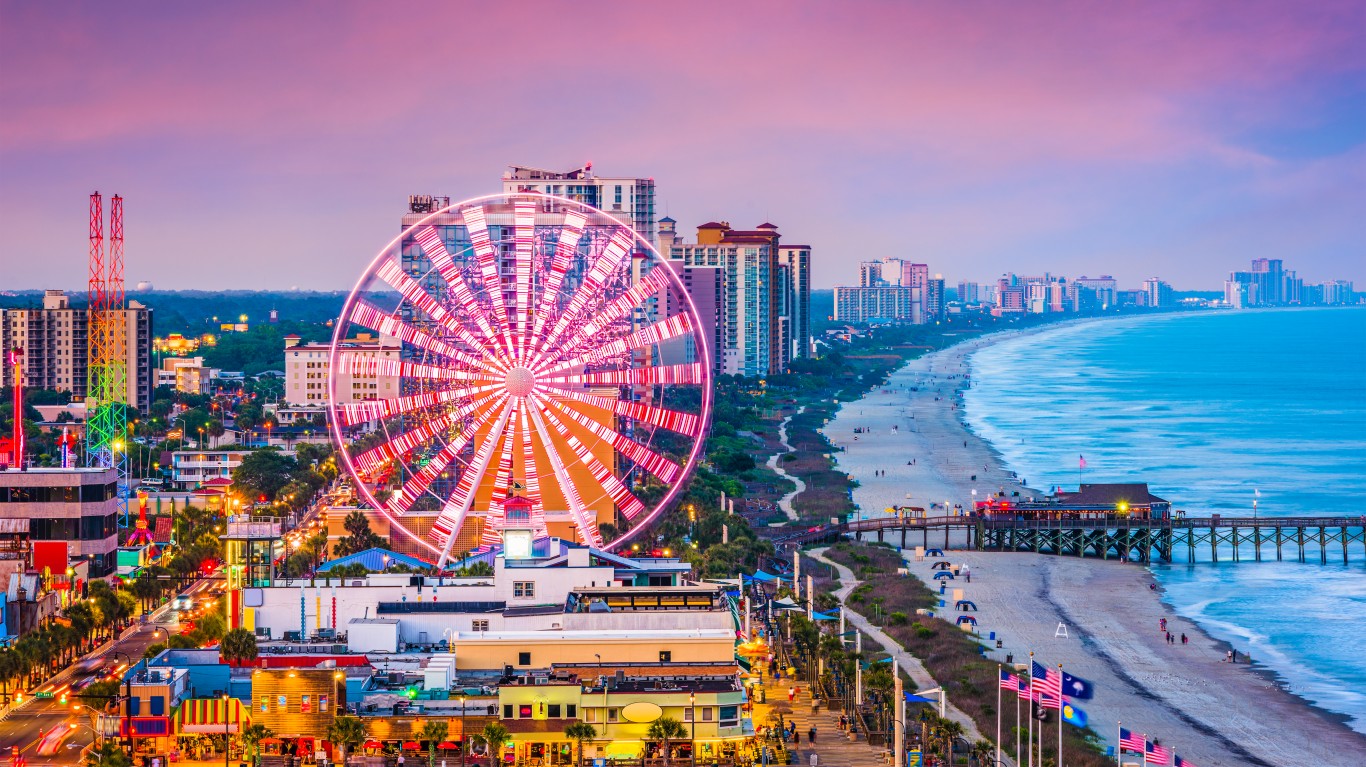
- Population change due to migration, 2022-2023: 4.10% (15,724)
- Migration breakdown, 2022-2023: international: +663; domestic: +15,061
- Total population change, 2022-2023: +14,331 or +3.74% (#3 fastest growth)
- Population change due to migration, 2020-2023: 14.75% (#2 fastest growth)
- Unemployment rate, April 2024: 3.3% (Myrtle Beach-Conway-North Myrtle Beach, SC-NC)
- Median home value, 2022: $299,300 (Myrtle Beach-Conway-North Myrtle Beach, SC-NC)
- Total population, 2023: 397,478
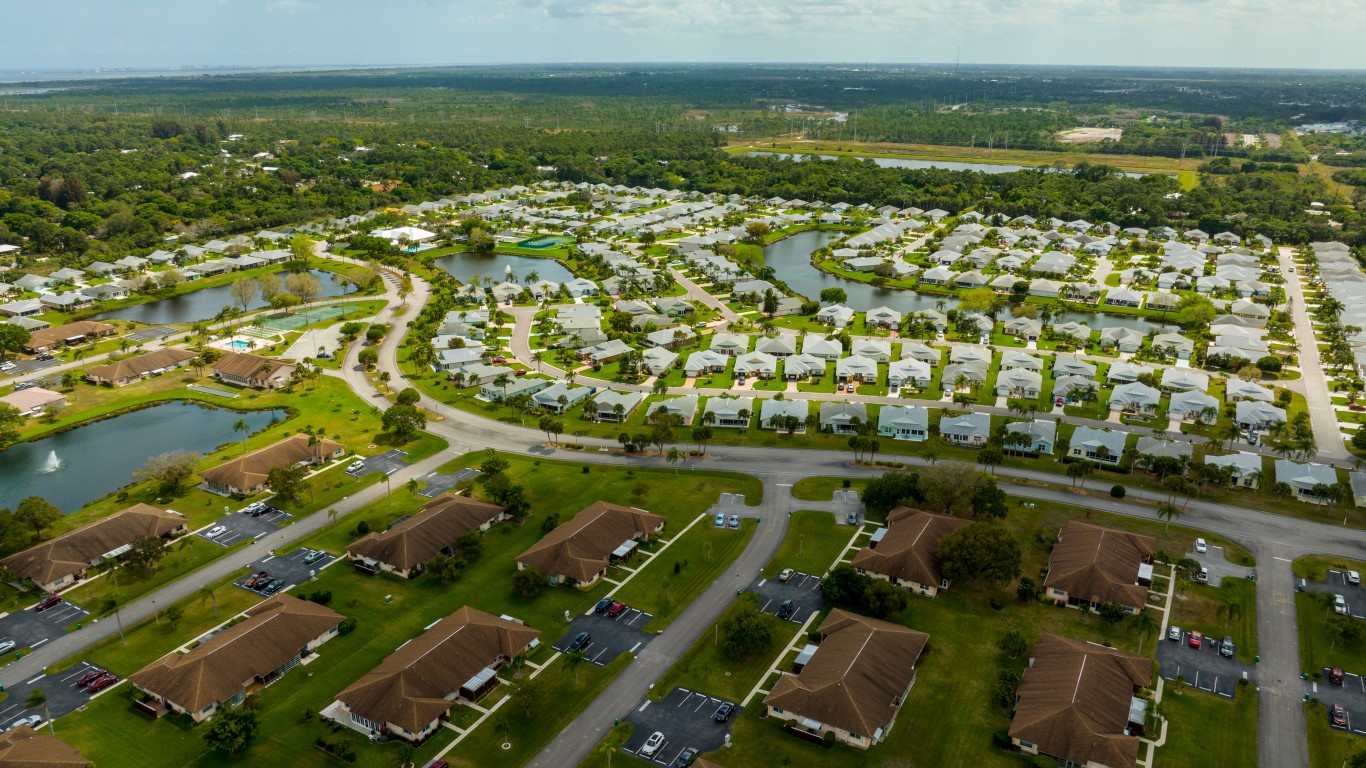
1. Wildwood-The Villages, FL
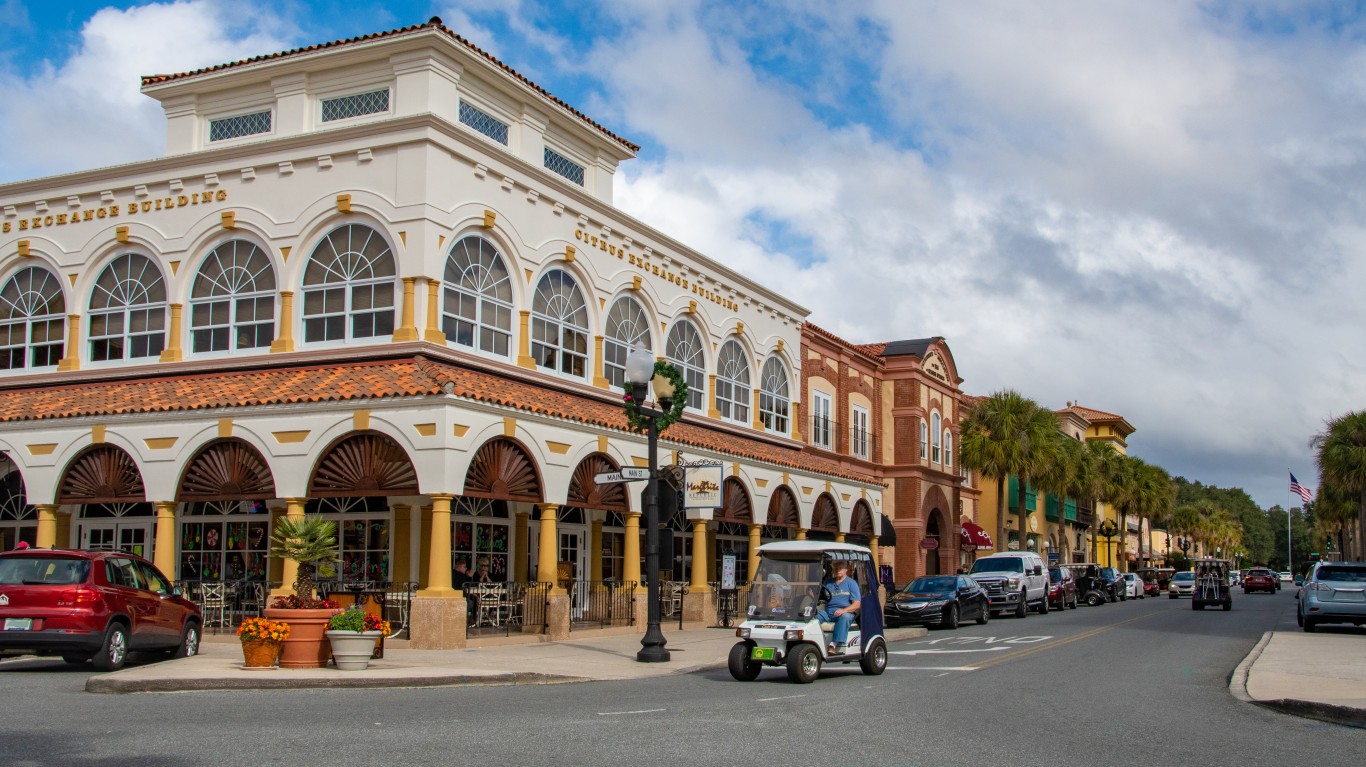
- Population change due to migration, 2022-2023: 6.07% (8,788)
- Migration breakdown, 2022-2023: international: +104; domestic: +8,684
- Total population change, 2022-2023: +6,798 or +4.70% (#1 fastest growth)
- Population change due to migration, 2020-2023: 21.95% (#1 fastest growth)
- Unemployment rate, April 2024: 4.7% (The Villages, FL)
- Median home value, 2022: $367,200 (The Villages, FL)
- Total population, 2023: 151,565
Are You Ahead, or Behind on Retirement? (sponsor)
If you’re one of the over 4 Million Americans set to retire this year, you may want to pay attention.
Finding a financial advisor who puts your interest first can be the difference between a rich retirement and barely getting by, and today it’s easier than ever. SmartAsset’s free tool matches you with up to three fiduciary financial advisors that serve your area in minutes. Each advisor has been carefully vetted, and must act in your best interests. Start your search now.
Don’t waste another minute; get started right here and help your retirement dreams become a retirement reality.
Thank you for reading! Have some feedback for us?
Contact the 24/7 Wall St. editorial team.
Latest from 24/7


Our expert who first called NVIDIA in 2009 is predicting 2025 will see a historic AI breakthrough.
You can follow him investing $500,000 of his own money on our top AI stocks for free.