Population and Social Characteristics

The Population of This US City Downtown Has Exploded by 50% in Just 10 Years

TriggerPhoto / iStock via Getty Images

Chicago’s downtown area has even more residents now than before the pandemic. Residents in the Loop (the city’s central business district) have grown by nearly 9% since 2020, according to the Chicago Loop Alliance. What’s more, Chicago is not the only American city with a thriving downtown.

To determine the cities with booming downtowns, 24/7 Wall St. reviewed five-year data on population change from the U.S. Census Bureau’s 2022 American Community Survey. Cities were ranked based on the percentage change in population in their downtown census tracts from 2012 to 2022. Downtown areas were defined as the census tracts that fall at least 50% within the 1.8-mile radius around a city hall. Non-downtown areas were defined as the census tracts that fall at least 50% within a city’s boundaries, yet less than 50% within the 1.8-mile radius around city hall. Boundary definitions are from the U.S. Census Bureau and are for 2022. Only principal cities of metropolitan statistical areas were considered. City hall coordinates as well as supplemental data on income are also from the Census Bureau.

For decades, some Midwestern cities on our list have suffered population decline and economic struggles overall. However, these same cities have watched their downtowns boom as populations have shifted from the suburbs to downtown. For example, Cleveland and Detroit are experiencing shrinking populations overall, yet their downtown areas have grown by 20% and 42%, respectively, in the past decade. On the contrary, some metro areas are growing overall, which is also reflected in the downtown core, as is the case in Palm Coast, Florida. (Also see: America’s Most Dangerous City.)

Another indication of a booming downtown can be gleaned from the income per capita in these census tracts. In some of the downtown areas on the list, income per capita grew by more than 50%. In fact, in a few, income per capita in the downtown areas grew considerably more than in the non-downtown areas. For example, in Phoenix, income per capita in downtown rose by 74% in the past decade compared to 22% in the non-downtown areas. Similarly, in Nashville, downtown income per capita grew by 87% compared to a 25% growth in non-downtown areas.

Why We’re Covering American Downtowns

Woman walking down a busy street in downtown Chicago on a cool autumn morning
Brendt A Petersen / Shutterstock.com

During the pandemic, many feared downtowns would shrink as residents fled for less populated areas. However, in one example, according to the Chicago Loop Alliance, Chicago’s downtown is flourishing with $481 million in annual economic impact on Loop businesses brought in directly by city residents. Cities with flourishing city centers reap economic and labor market benefits for the populace by reducing urban sprawl, keeping profits local, providing local jobs, attracting businesses, and improving property values. 
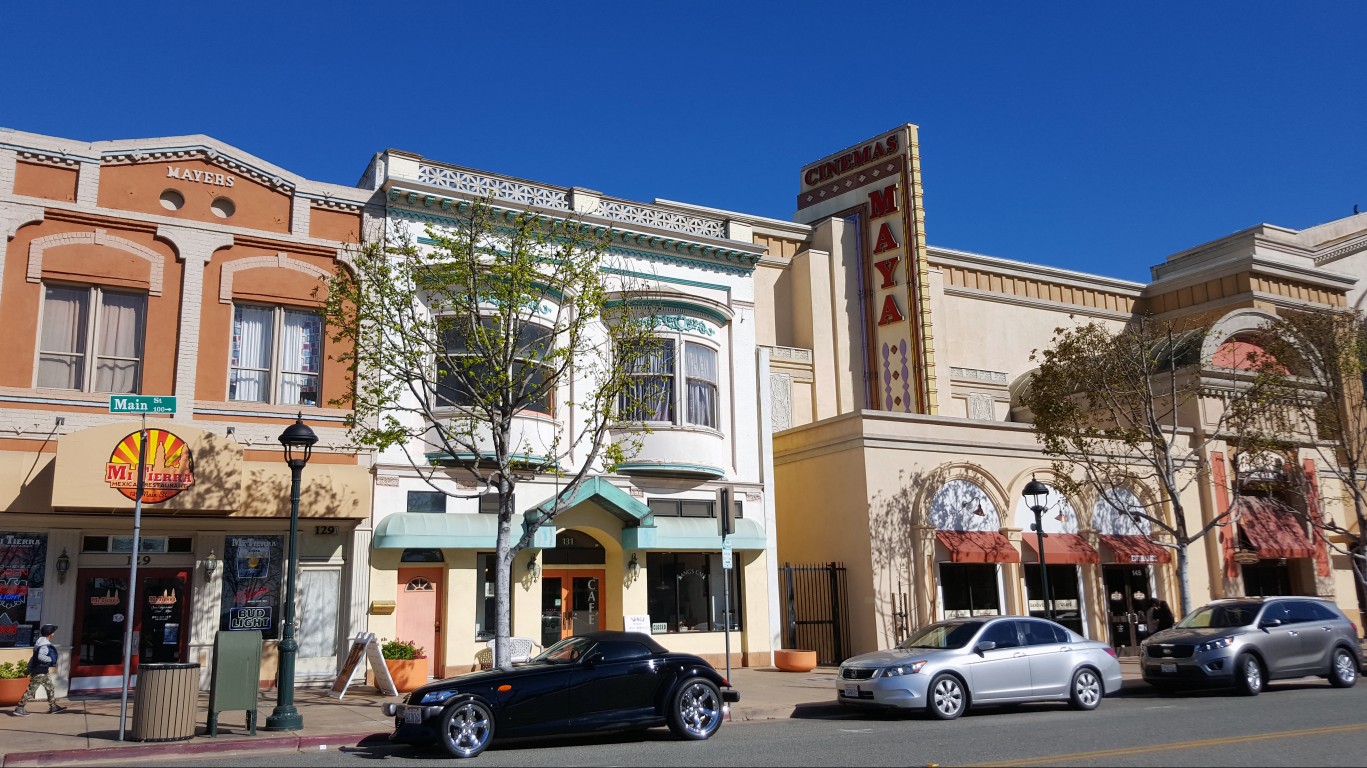
40. Salinas, California

Solidago / Getty Images
  • Population change in downtown tracts, 2012 to 2022: +14.5%
  • Population change of non-downtown tracts, 2012 to 2022: +5.9%
  • Per capita income change in downtown tracts, 2012 to 2022: +7.8%
  • Per capita income change in non-downtown tracts, 2012 to 2022: +21.5%

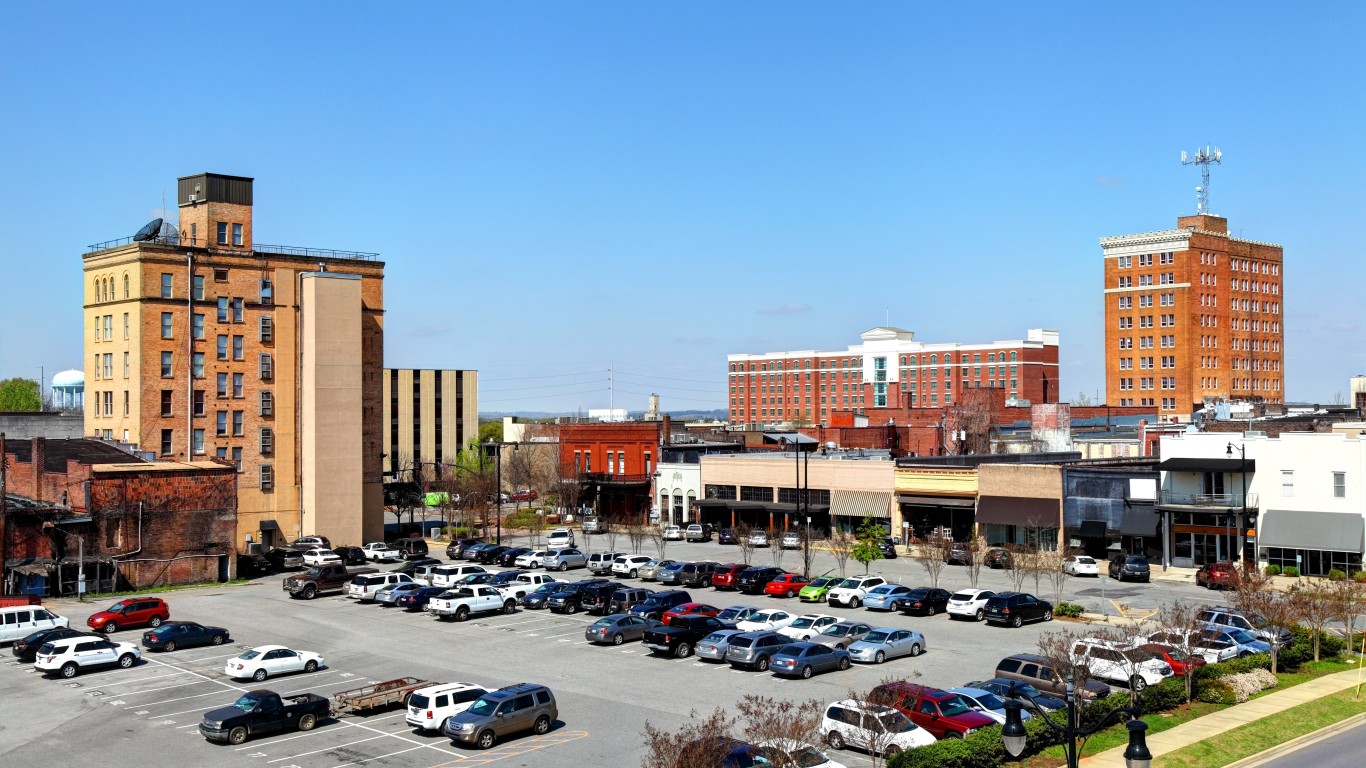
39. Longview, Washington

DC_Colombia / iStock via Getty Images
  • Population change in downtown tracts, 2012 to 2022: +14.7%
  • Population change of non-downtown tracts, 2012 to 2022: -3.4%
  • Per capita income change in downtown tracts, 2012 to 2022: +24.6%
  • Per capita income change in non-downtown tracts, 2012 to 2022: +30.1%

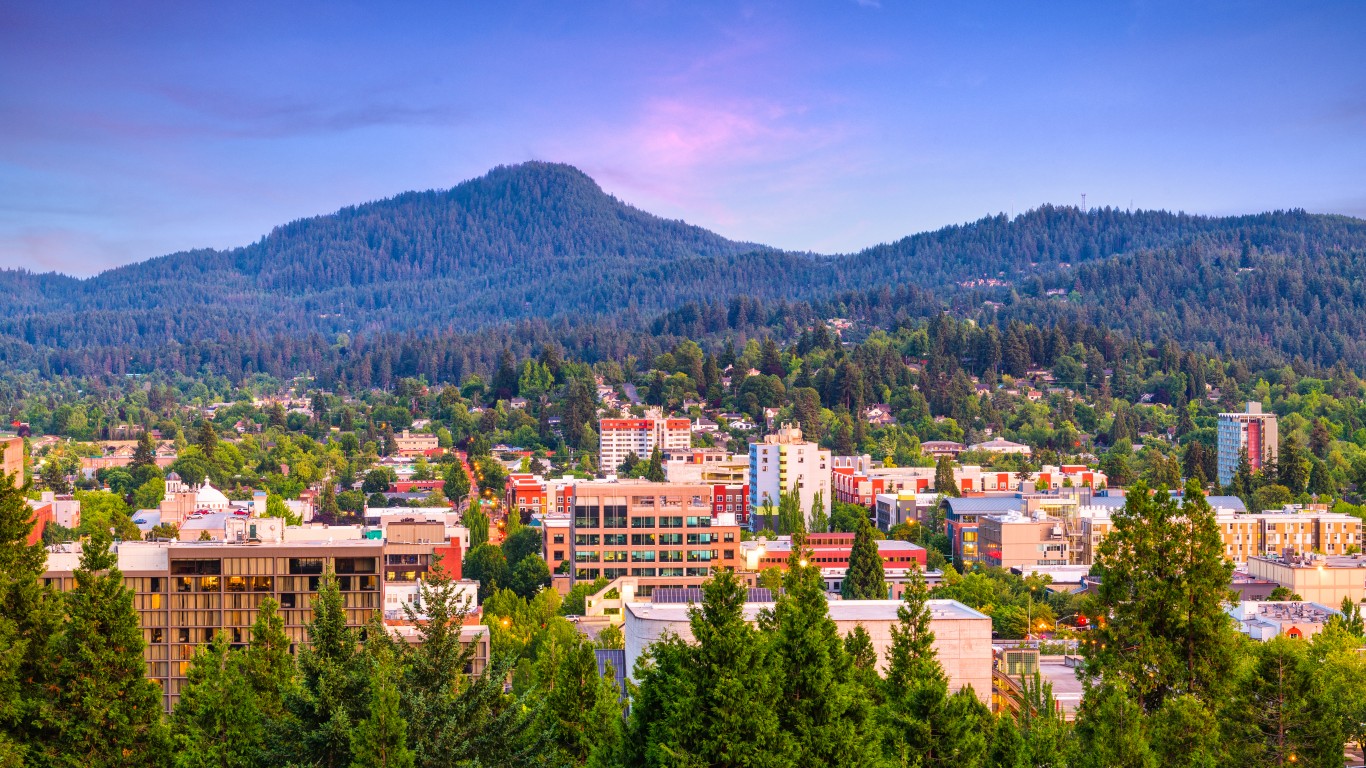
38. Eugene, Oregon

Sean Pavone / iStock via Getty Images
  • Population change in downtown tracts, 2012 to 2022: +14.8%
  • Population change of non-downtown tracts, 2012 to 2022: +7.9%
  • Per capita income change in downtown tracts, 2012 to 2022: +16.8%
  • Per capita income change in non-downtown tracts, 2012 to 2022: +18.7%

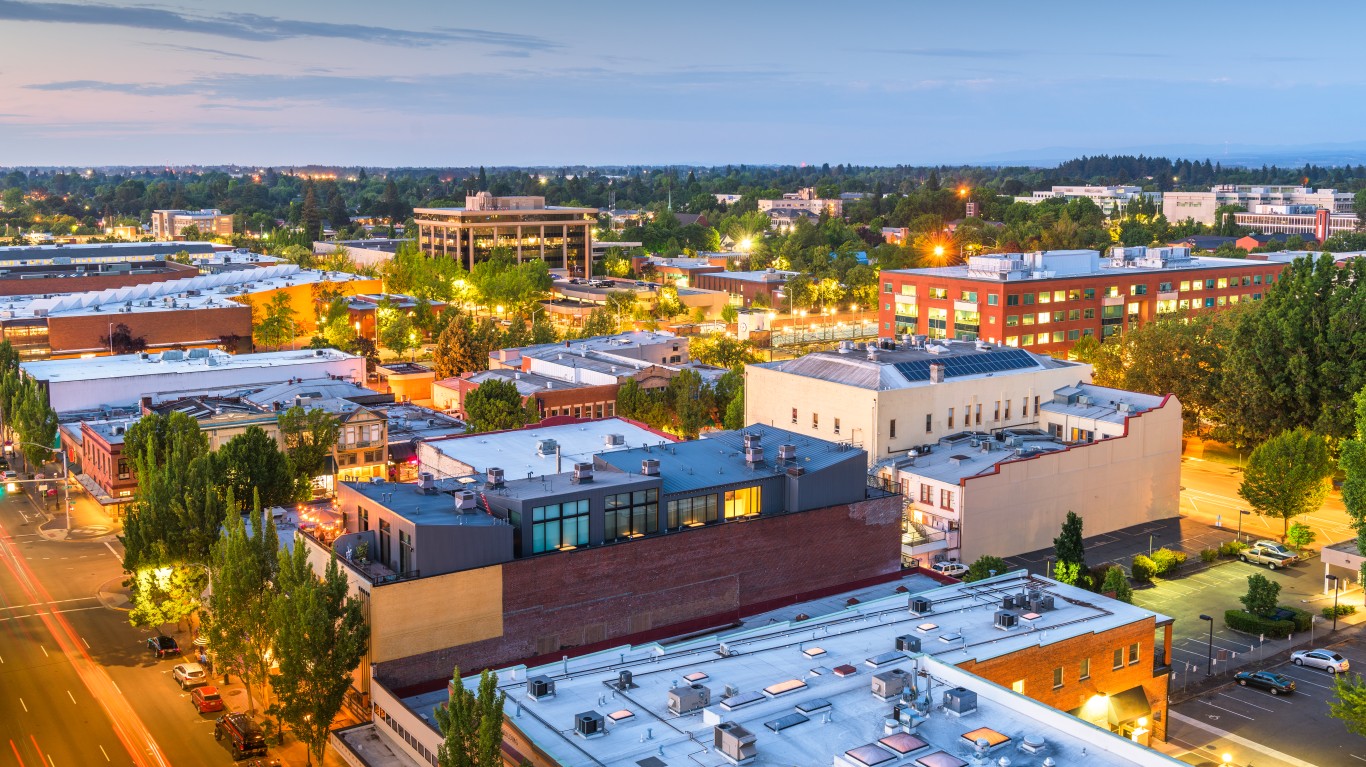
37. Salem, Oregon

Sean Pavone / iStock via Getty Images
  • Population change in downtown tracts, 2012 to 2022: +15.4%
  • Population change of non-downtown tracts, 2012 to 2022: +9.7%
  • Per capita income change in downtown tracts, 2012 to 2022: +19.5%
  • Per capita income change in non-downtown tracts, 2012 to 2022: +17.8%

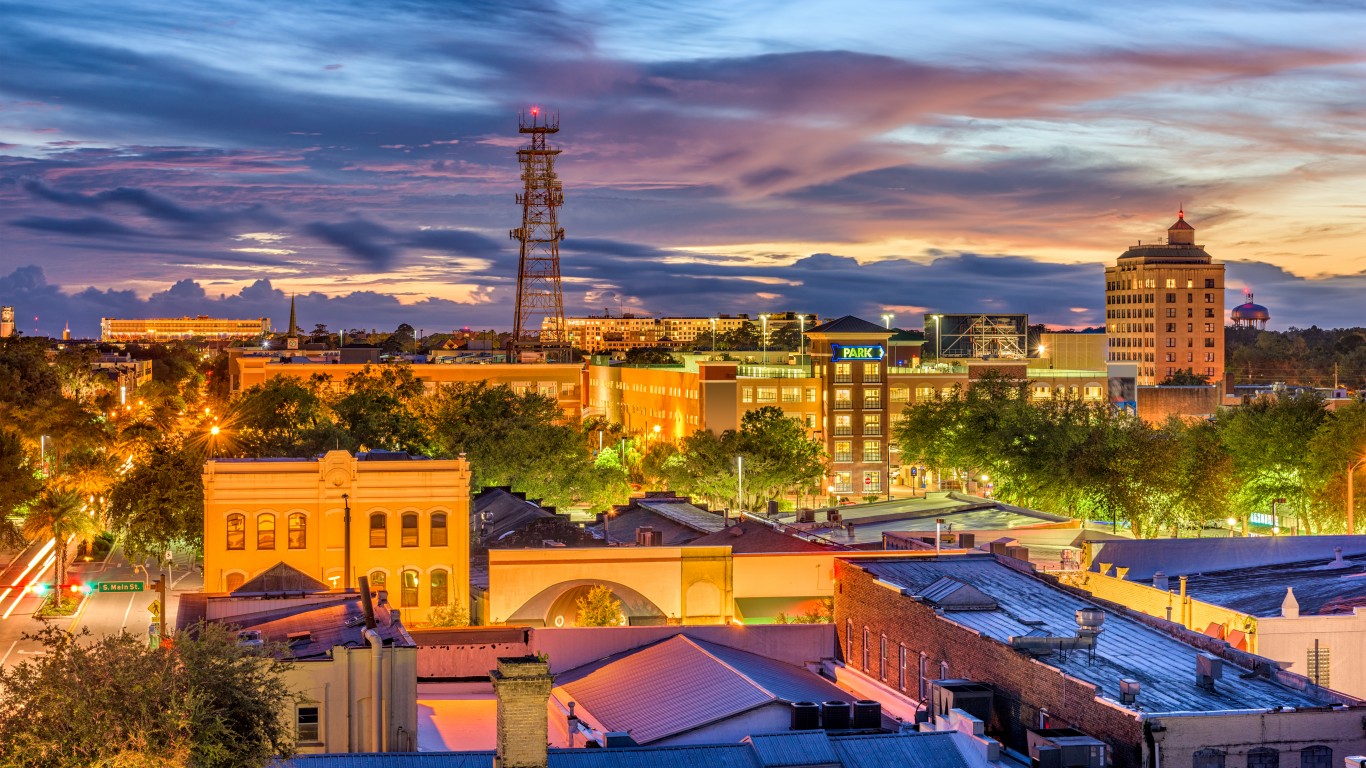
36. Gainesville, Florida

Sean Pavone / iStock via Getty Images
  • Population change in downtown tracts, 2012 to 2022: +15.4%
  • Population change of non-downtown tracts, 2012 to 2022: +9.6%
  • Per capita income change in downtown tracts, 2012 to 2022: +19.4%
  • Per capita income change in non-downtown tracts, 2012 to 2022: +0.2%

35. Charlottesville, Virginia

DenisTangneyJr / iStock via Getty Images
  • Population change in downtown tracts, 2012 to 2022: +15.9%
  • Population change of non-downtown tracts, 2012 to 2022: -5.7%
  • Per capita income change in downtown tracts, 2012 to 2022: +31.0%
  • Per capita income change in non-downtown tracts, 2012 to 2022: +49.1%

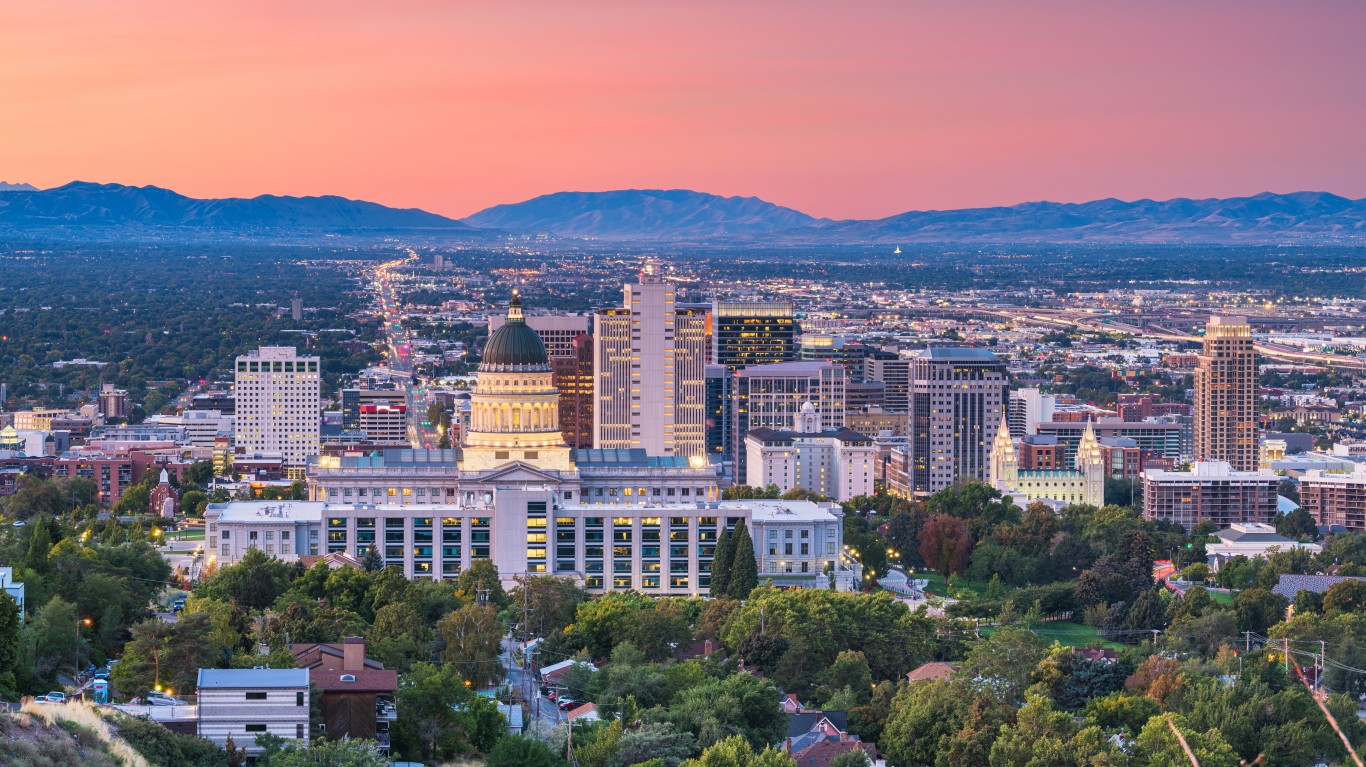
34. Salt Lake City, Utah

Sean Pavone / iStock via Getty Images
  • Population change in downtown tracts, 2012 to 2022: +16.0%
  • Population change of non-downtown tracts, 2012 to 2022: +5.1%
  • Per capita income change in downtown tracts, 2012 to 2022: +43.4%
  • Per capita income change in non-downtown tracts, 2012 to 2022: +32.9%

33. Palm Coast, Florida

Palm Coast. Florida. USA on a map
SevenMaps / Shutterstock.com
  • Population change in downtown tracts, 2012 to 2022: +16.4%
  • Population change of non-downtown tracts, 2012 to 2022: +26.9%
  • Per capita income change in downtown tracts, 2012 to 2022: +77.3%
  • Per capita income change in non-downtown tracts, 2012 to 2022: +23.2%

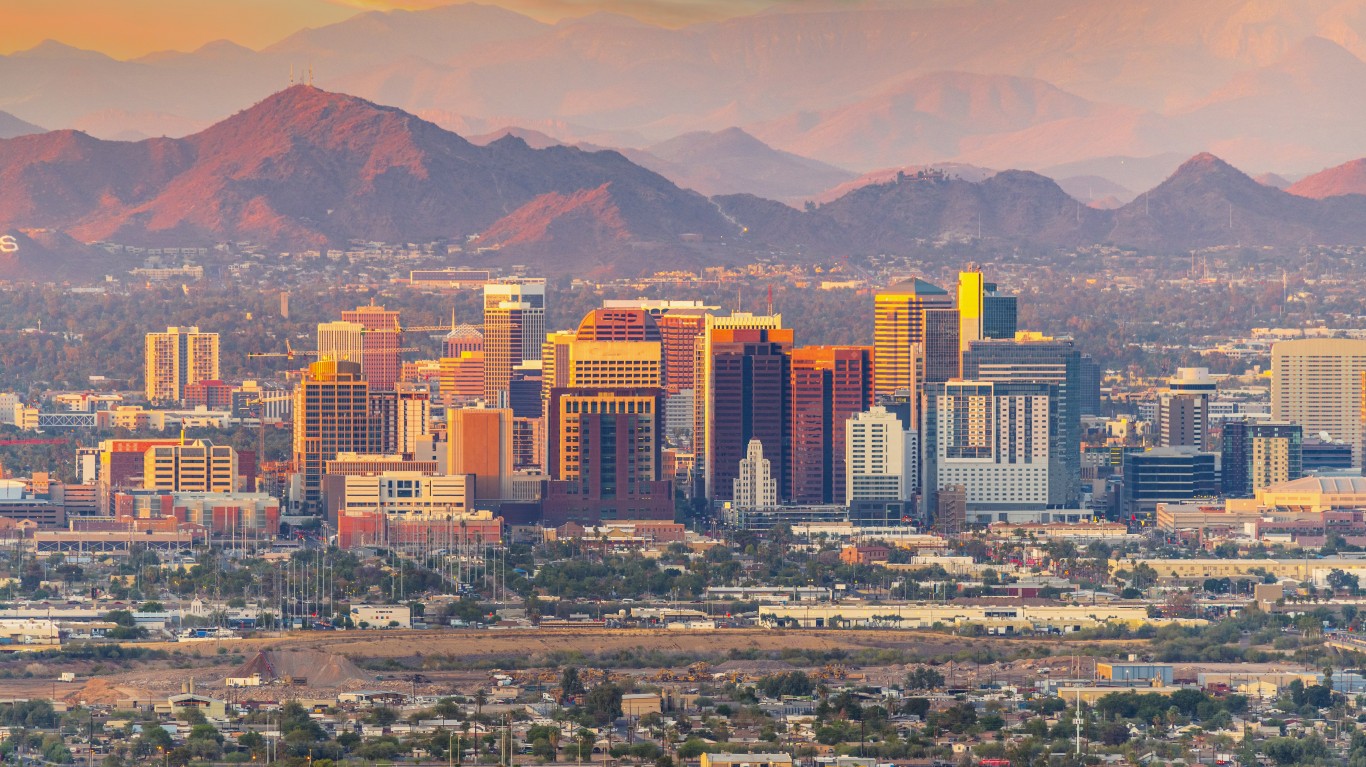
32. Phoenix, Arizona

4kodiak / E+ via Getty Images
  • Population change in downtown tracts, 2012 to 2022: +17.6%
  • Population change of non-downtown tracts, 2012 to 2022: +7.1%
  • Per capita income change in downtown tracts, 2012 to 2022: +74.4%
  • Per capita income change in non-downtown tracts, 2012 to 2022: +21.6%

31. Philadelphia, Pennsylvania

f11photo / iStock via Getty Images
  • Population change in downtown tracts, 2012 to 2022: +17.8%
  • Population change of non-downtown tracts, 2012 to 2022: +2.5%
  • Per capita income change in downtown tracts, 2012 to 2022: +32.4%
  • Per capita income change in non-downtown tracts, 2012 to 2022: +21.7%

30. Redding, California

Sundry Photography / iStock via Getty Images
  • Population change in downtown tracts, 2012 to 2022: +18.0%
  • Population change of non-downtown tracts, 2012 to 2022: +1.3%
  • Per capita income change in downtown tracts, 2012 to 2022: +2.0%
  • Per capita income change in non-downtown tracts, 2012 to 2022: +21.8%

29. Bremerton, Washington

Public Domain / Wikimedia Commons
  • Population change in downtown tracts, 2012 to 2022: +18.1%
  • Population change of non-downtown tracts, 2012 to 2022: +6.6%
  • Per capita income change in downtown tracts, 2012 to 2022: +31.0%
  • Per capita income change in non-downtown tracts, 2012 to 2022: +26.5%

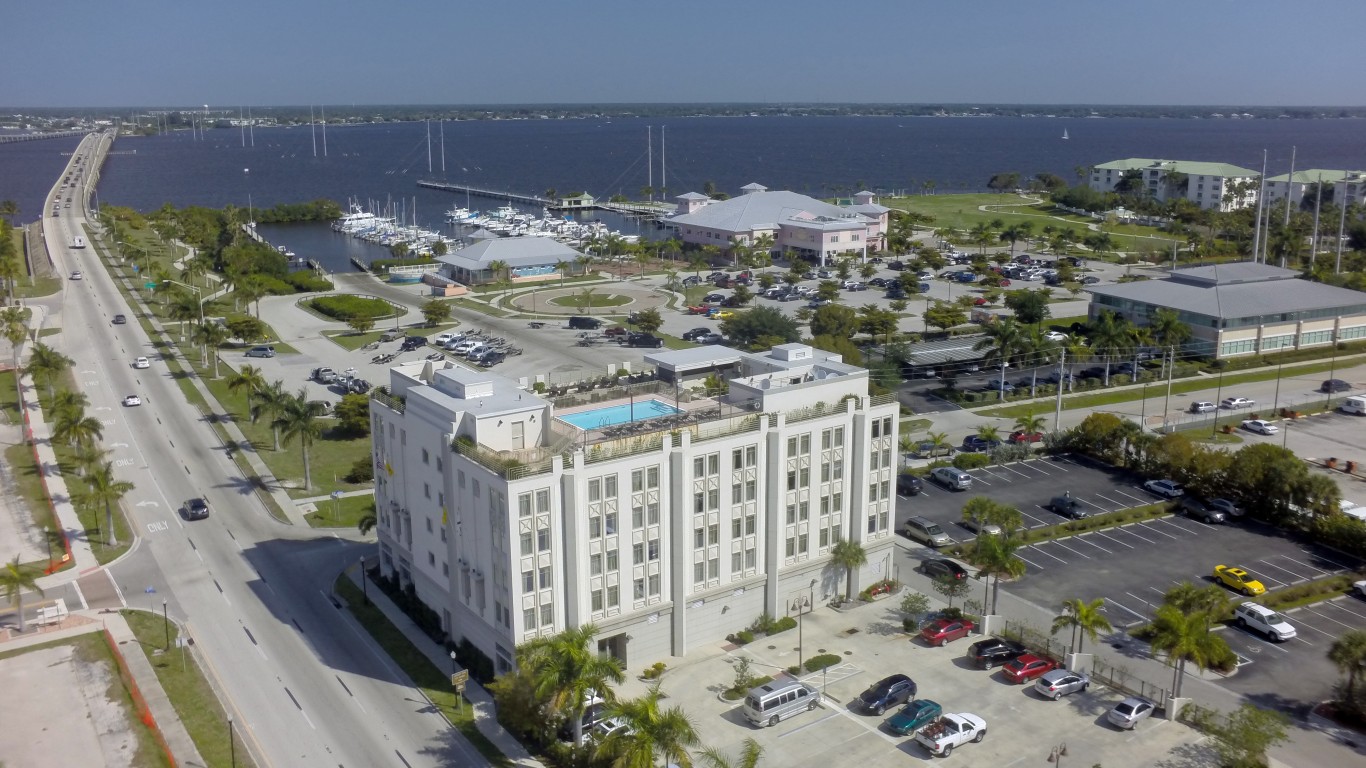
28. Punta Gorda, Florida

choicegraphx / iStock via Getty Images
  • Population change in downtown tracts, 2012 to 2022: +18.4%
  • Population change of non-downtown tracts, 2012 to 2022: +5.5%
  • Per capita income change in downtown tracts, 2012 to 2022: -8.4%
  • Per capita income change in non-downtown tracts, 2012 to 2022: +36.2%

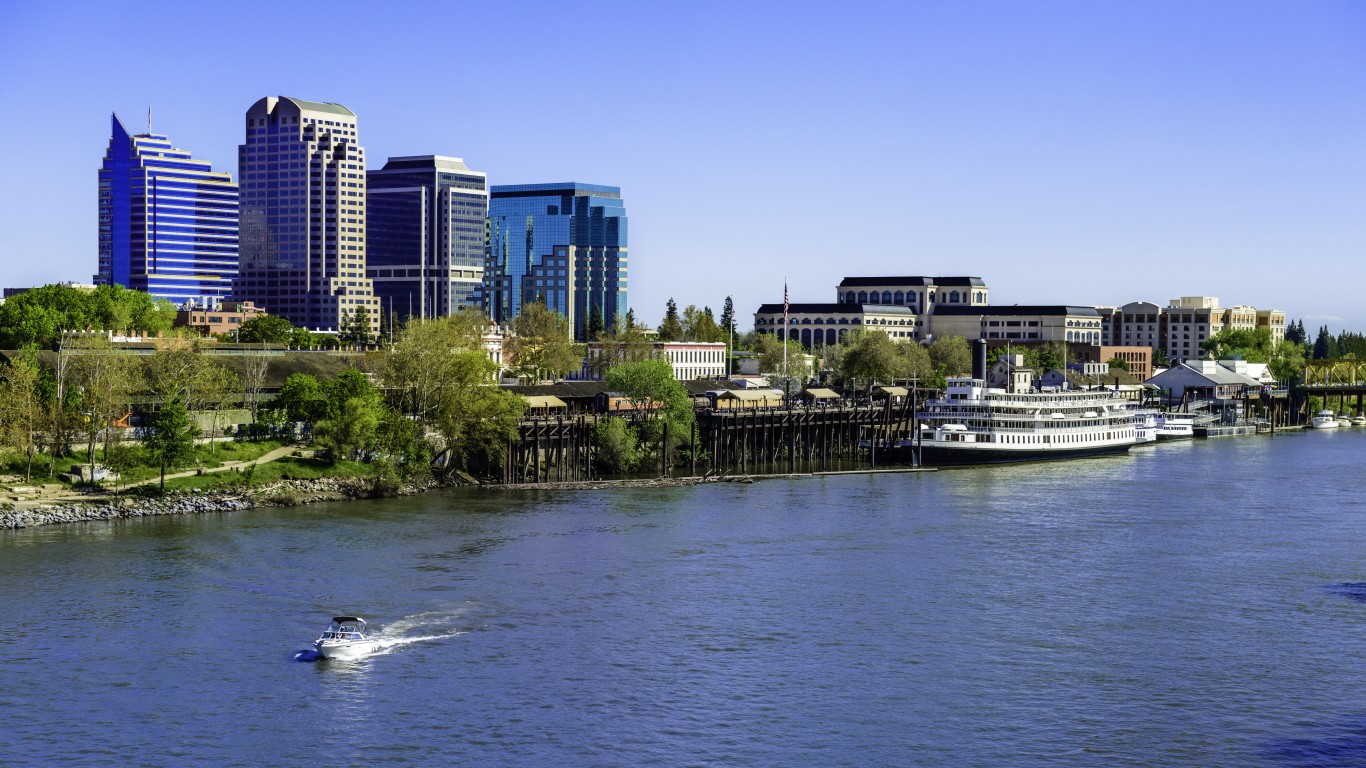
27. Sacramento, California

dszc / E+ via Getty Images
  • Population change in downtown tracts, 2012 to 2022: +19.2%
  • Population change of non-downtown tracts, 2012 to 2022: +9.0%
  • Per capita income change in downtown tracts, 2012 to 2022: +37.7%
  • Per capita income change in non-downtown tracts, 2012 to 2022: +21.5%

26. Cincinnati, Ohio

pawel.gaul / E+ via Getty Images
  • Population change in downtown tracts, 2012 to 2022: +19.9%
  • Population change of non-downtown tracts, 2012 to 2022: +3.0%
  • Per capita income change in downtown tracts, 2012 to 2022: +55.2%
  • Per capita income change in non-downtown tracts, 2012 to 2022: +13.9%

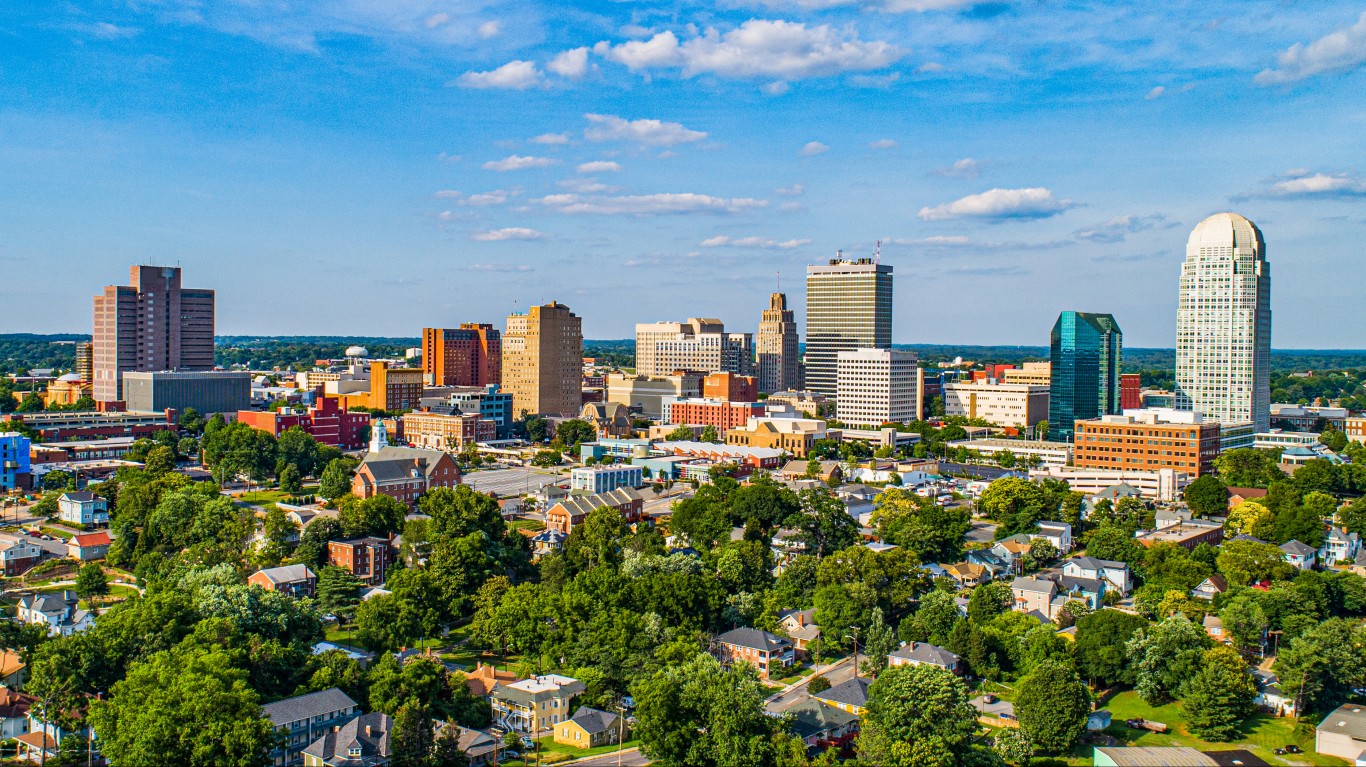
25. Winston-Salem, North Carolina

Kruck20 / iStock via Getty Images
  • Population change in downtown tracts, 2012 to 2022: +20.5%
  • Population change of non-downtown tracts, 2012 to 2022: +7.1%
  • Per capita income change in downtown tracts, 2012 to 2022: +35.8%
  • Per capita income change in non-downtown tracts, 2012 to 2022: +5.2%

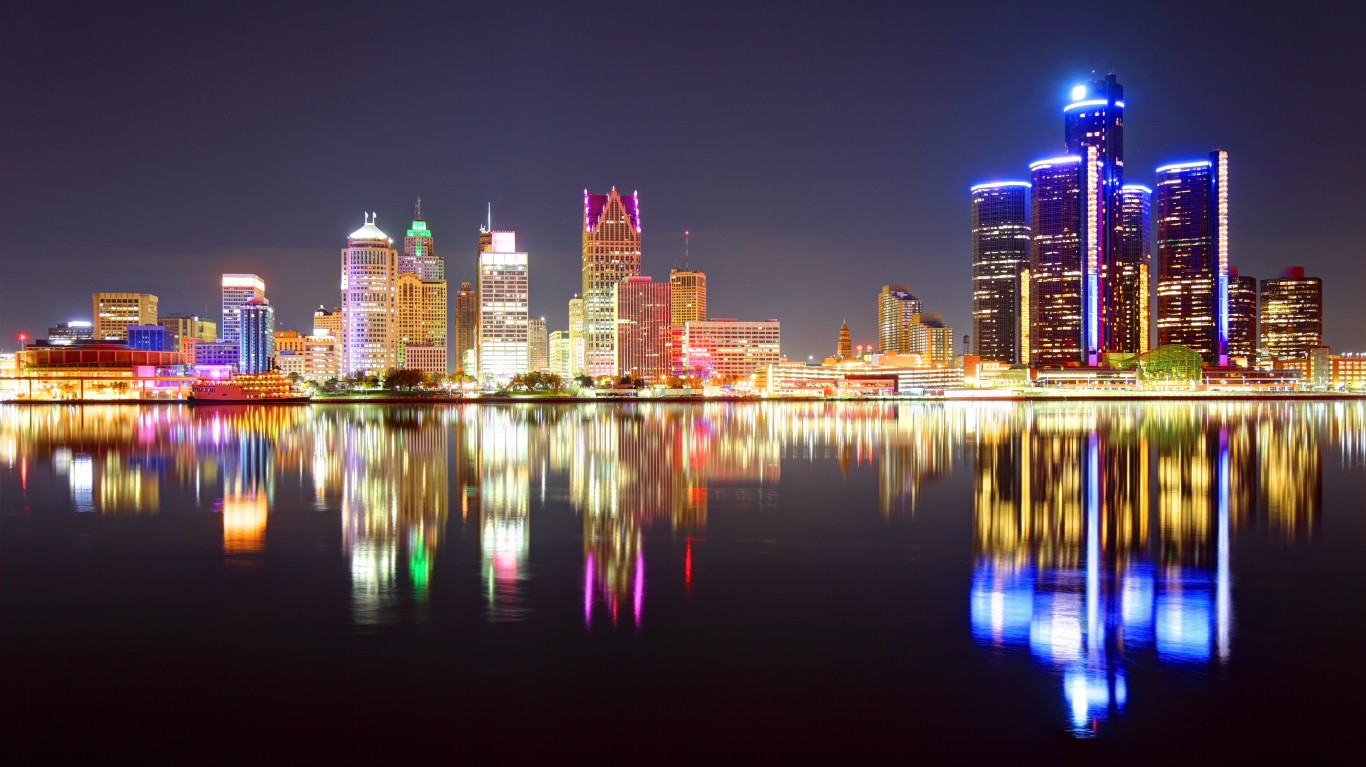
24. Detroit, Michigan

DenisTangneyJr / iStock via Getty Images
  • Population change in downtown tracts, 2012 to 2022: +20.8%
  • Population change of non-downtown tracts, 2012 to 2022: -11.3%
  • Per capita income change in downtown tracts, 2012 to 2022: +67.8%
  • Per capita income change in non-downtown tracts, 2012 to 2022: +17.1%

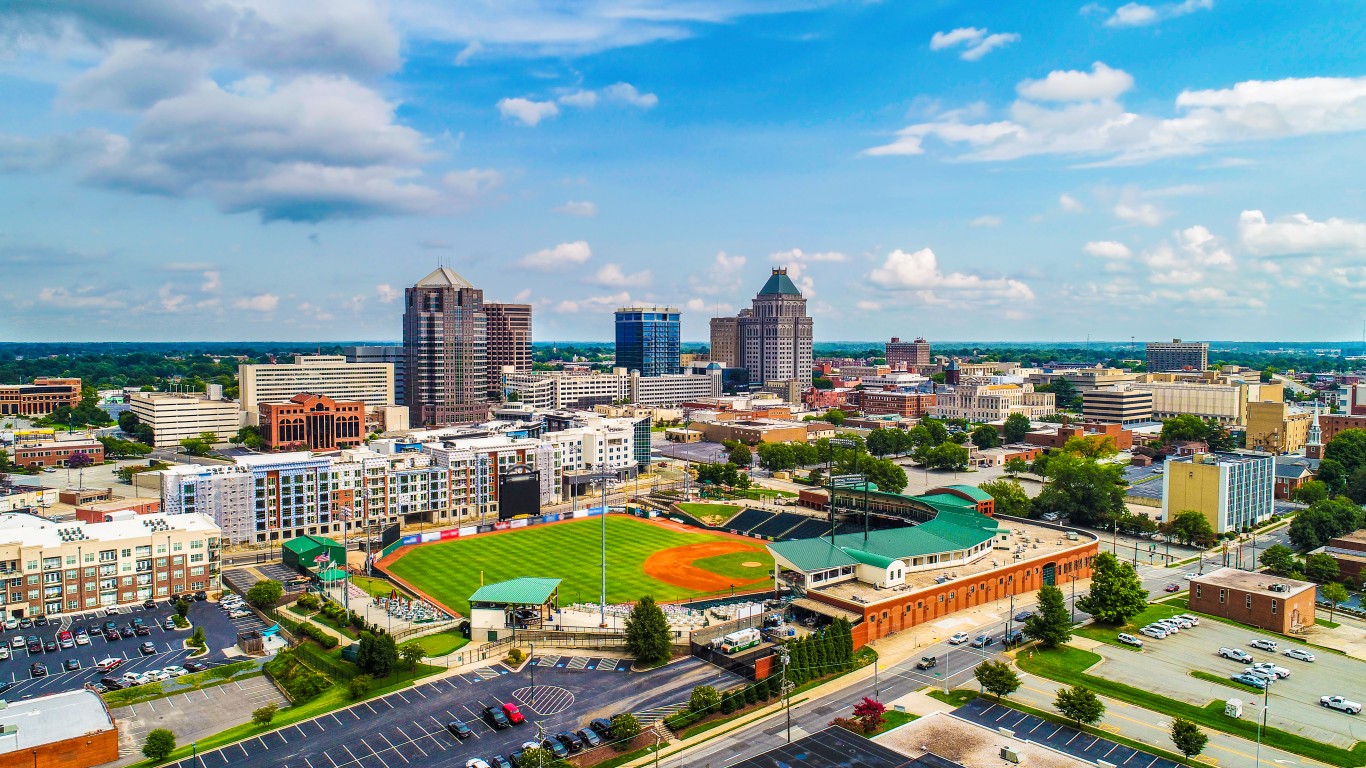
23. Greensboro, North Carolina

Kruck20 / iStock via Getty Images
  • Population change in downtown tracts, 2012 to 2022: +21.6%
  • Population change of non-downtown tracts, 2012 to 2022: +4.0%
  • Per capita income change in downtown tracts, 2012 to 2022: +17.4%
  • Per capita income change in non-downtown tracts, 2012 to 2022: +6.2%

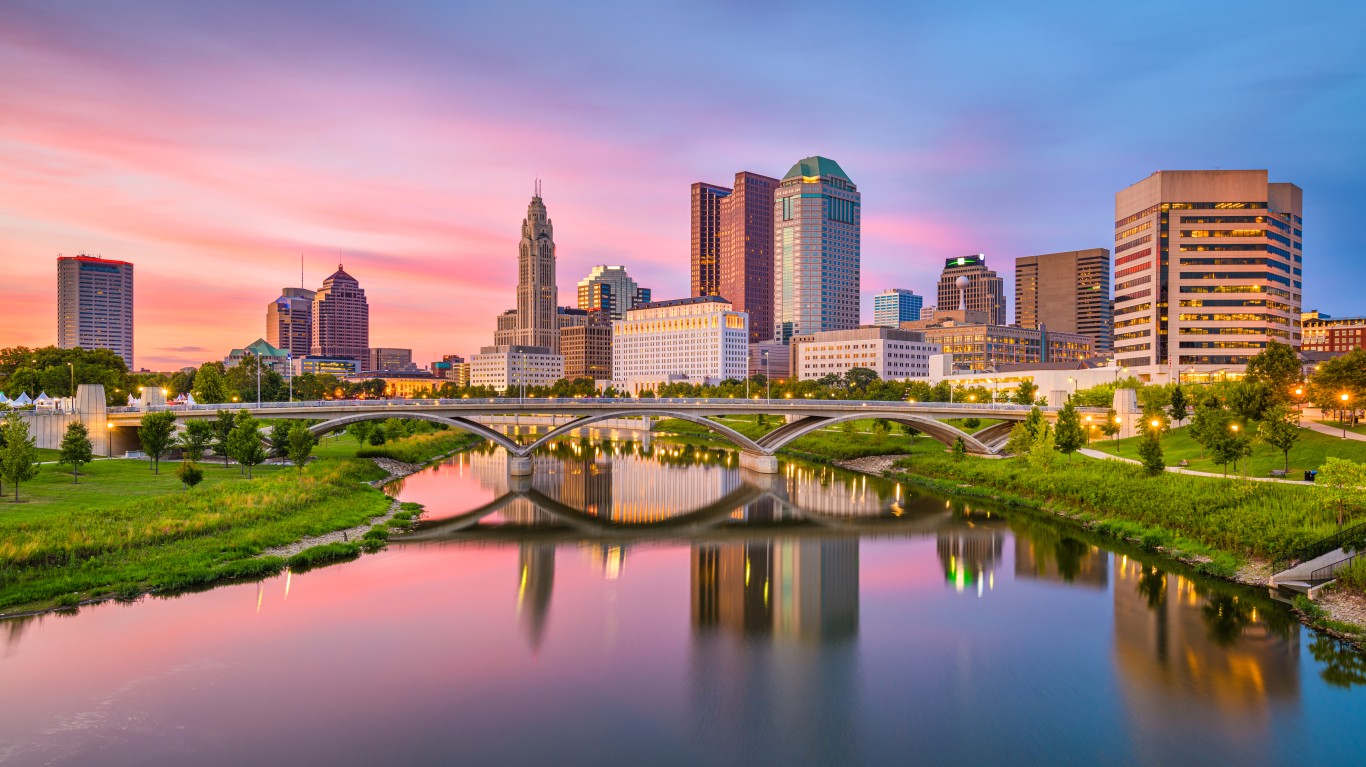
22. Columbus, Ohio

Sean Pavone / iStock via Getty Images
  • Population change in downtown tracts, 2012 to 2022: +23.0%
  • Population change of non-downtown tracts, 2012 to 2022: +11.6%
  • Per capita income change in downtown tracts, 2012 to 2022: +34.3%
  • Per capita income change in non-downtown tracts, 2012 to 2022: +17.8%

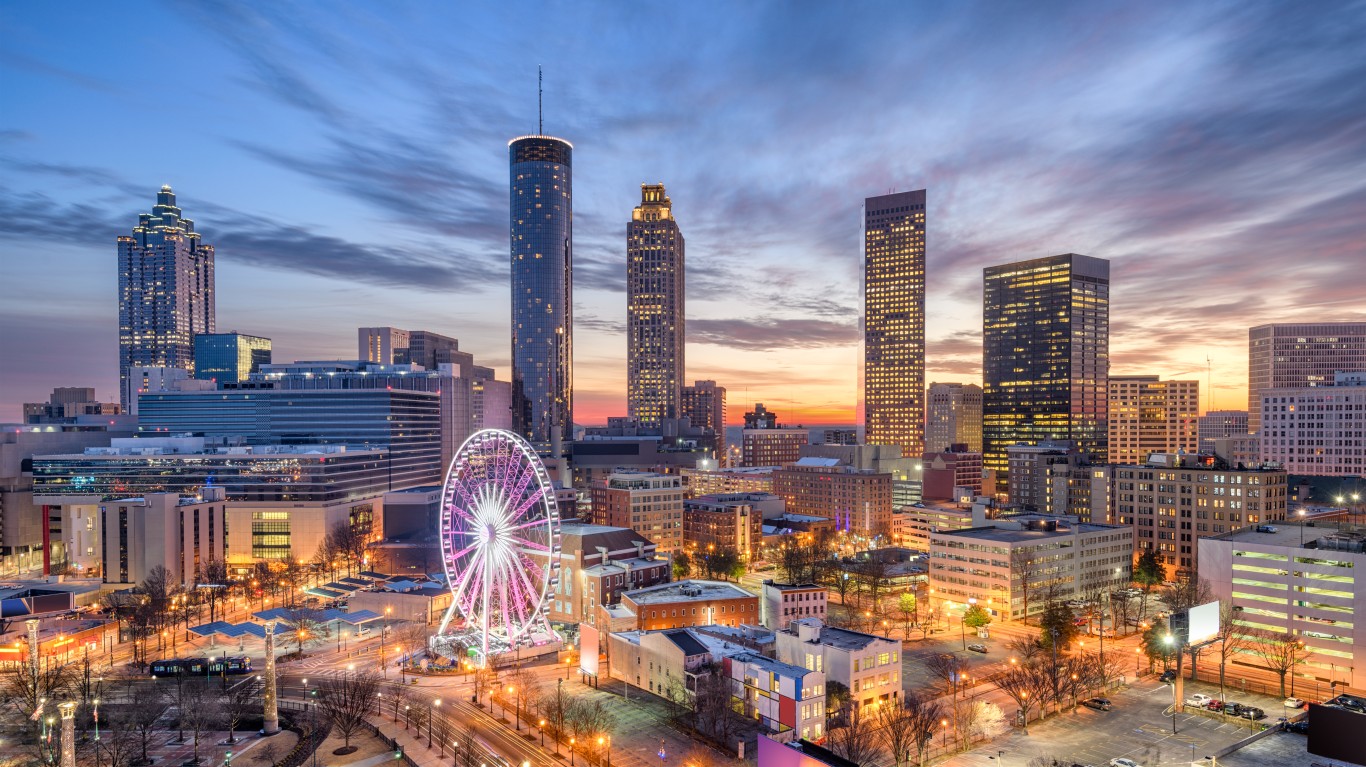
21. Atlanta, Georgia

Sean Pavone / iStock via Getty Images
  • Population change in downtown tracts, 2012 to 2022: +23.4%
  • Population change of non-downtown tracts, 2012 to 2022: +5.3%
  • Per capita income change in downtown tracts, 2012 to 2022: +31.3%
  • Per capita income change in non-downtown tracts, 2012 to 2022: +38.6%

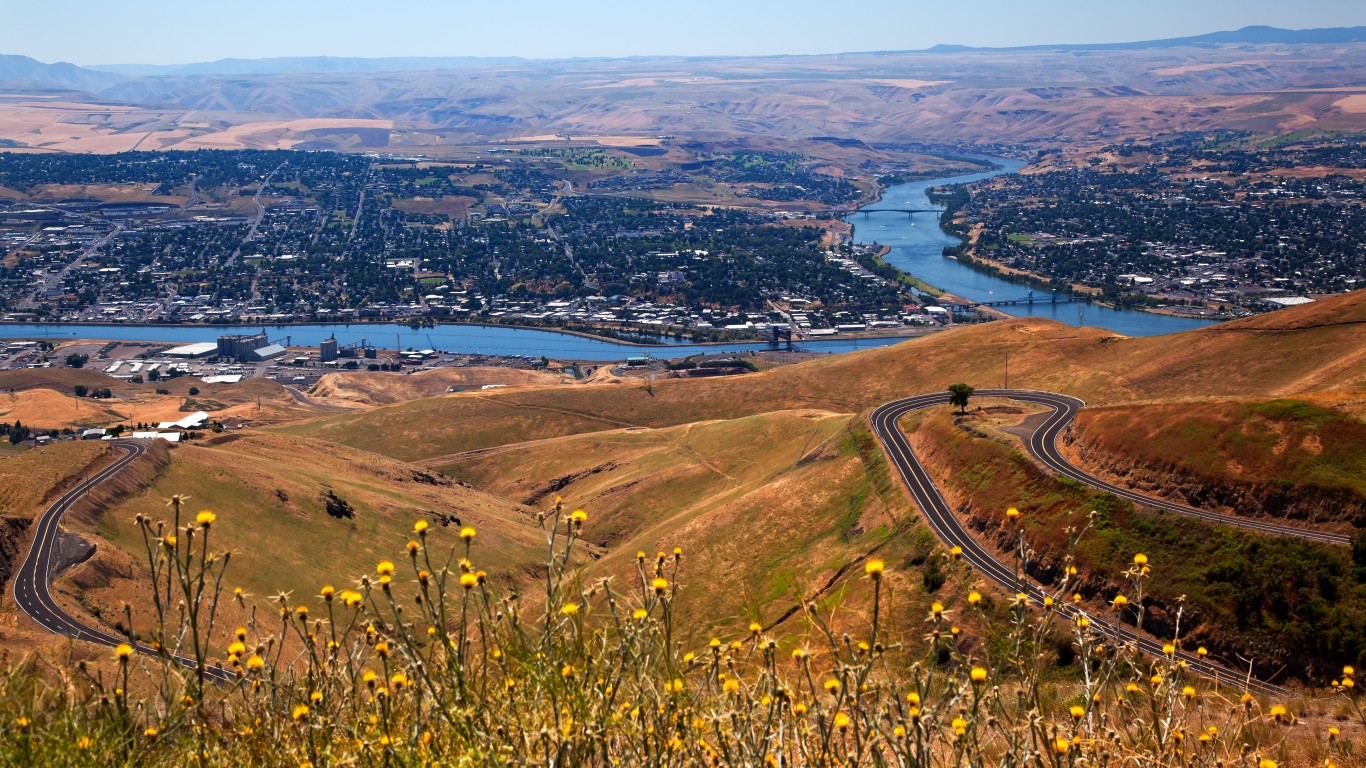
20. Lewiston, Idaho

bpperry / iStock via Getty Images
  • Population change in downtown tracts, 2012 to 2022: +23.8%
  • Population change of non-downtown tracts, 2012 to 2022: +2.7%
  • Per capita income change in downtown tracts, 2012 to 2022: -9.4%
  • Per capita income change in non-downtown tracts, 2012 to 2022: +23.5%

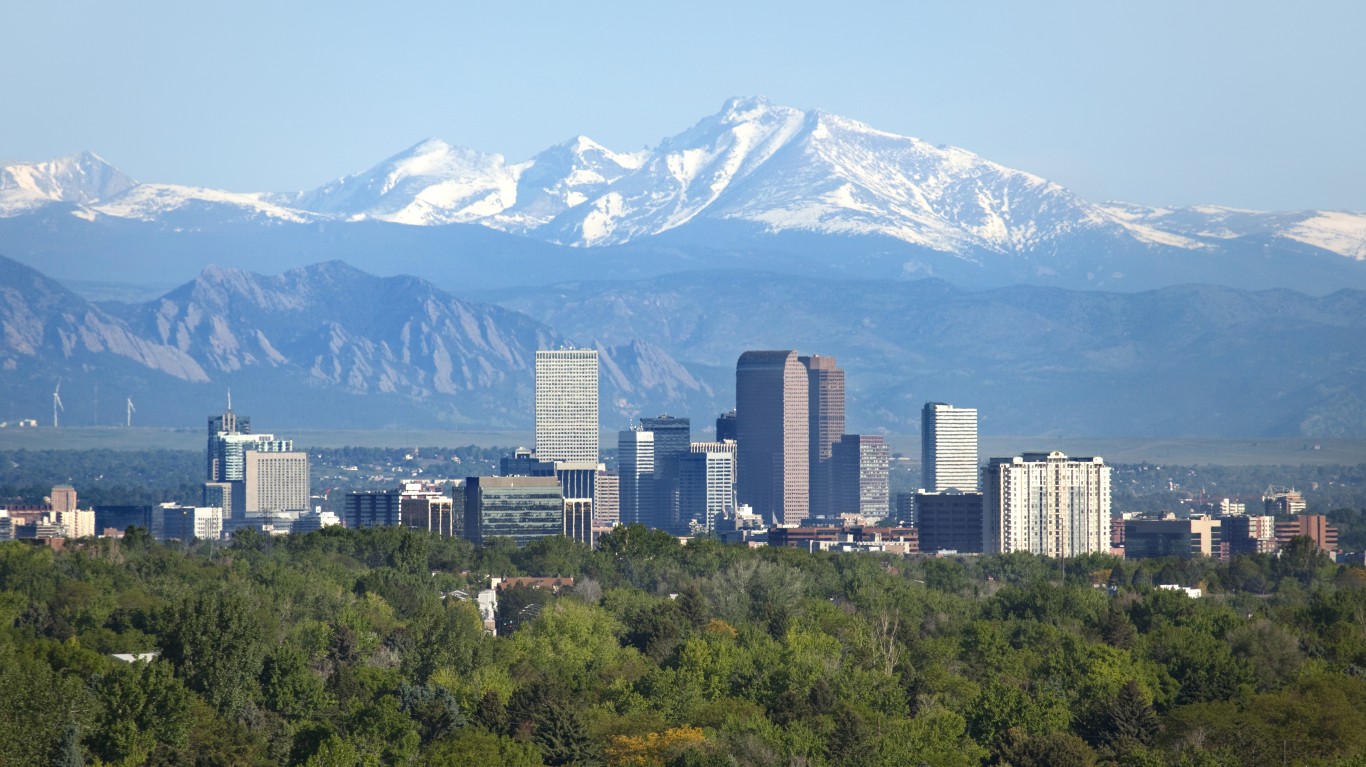
19. Denver, Colorado

milehightraveler / iStock via Getty Images
  • Population change in downtown tracts, 2012 to 2022: +23.8%
  • Population change of non-downtown tracts, 2012 to 2022: +11.0%
  • Per capita income change in downtown tracts, 2012 to 2022: +26.2%
  • Per capita income change in non-downtown tracts, 2012 to 2022: +35.8%

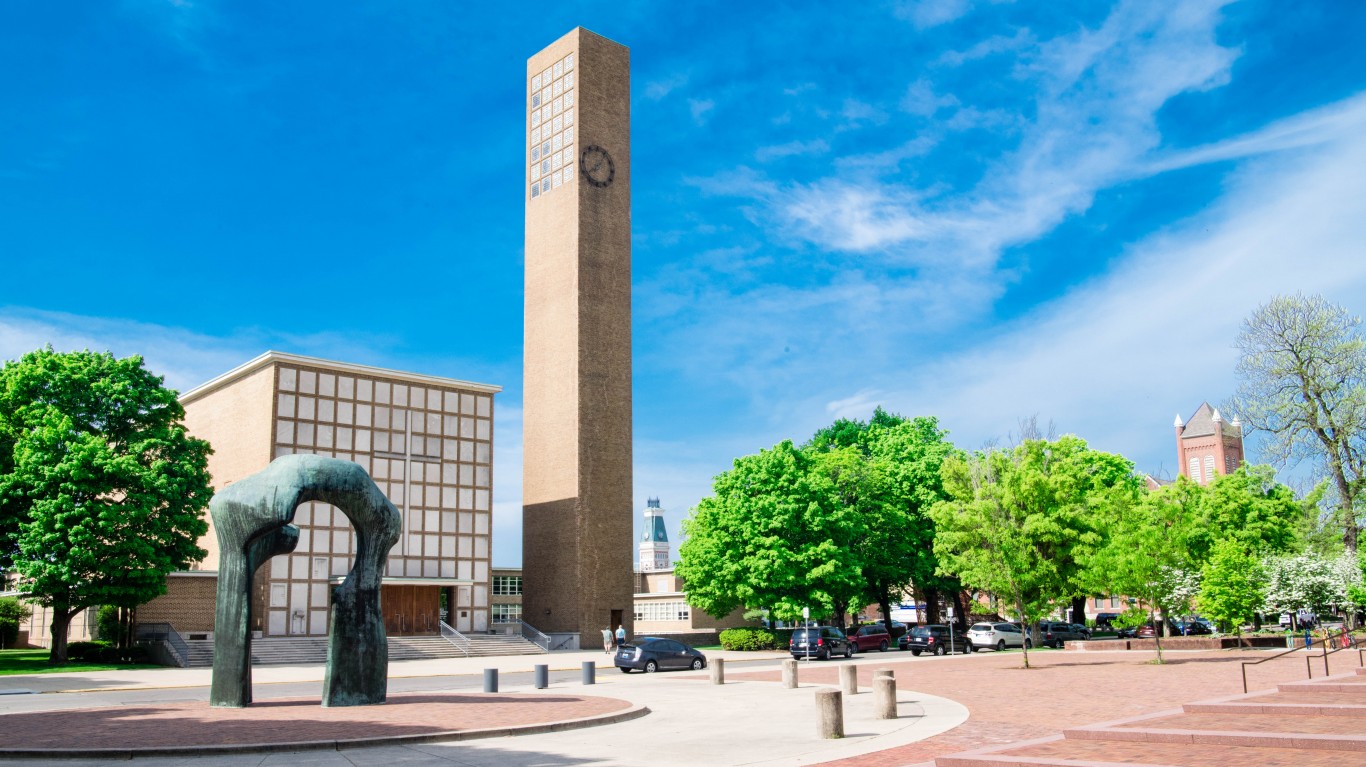
18. Columbus, Indiana

Rodrigo A. Rodriguez Fuentes / Getty Images
  • Population change in downtown tracts, 2012 to 2022: +24.1%
  • Population change of non-downtown tracts, 2012 to 2022: -0.2%
  • Per capita income change in downtown tracts, 2012 to 2022: +26.7%
  • Per capita income change in non-downtown tracts, 2012 to 2022: +9.0%

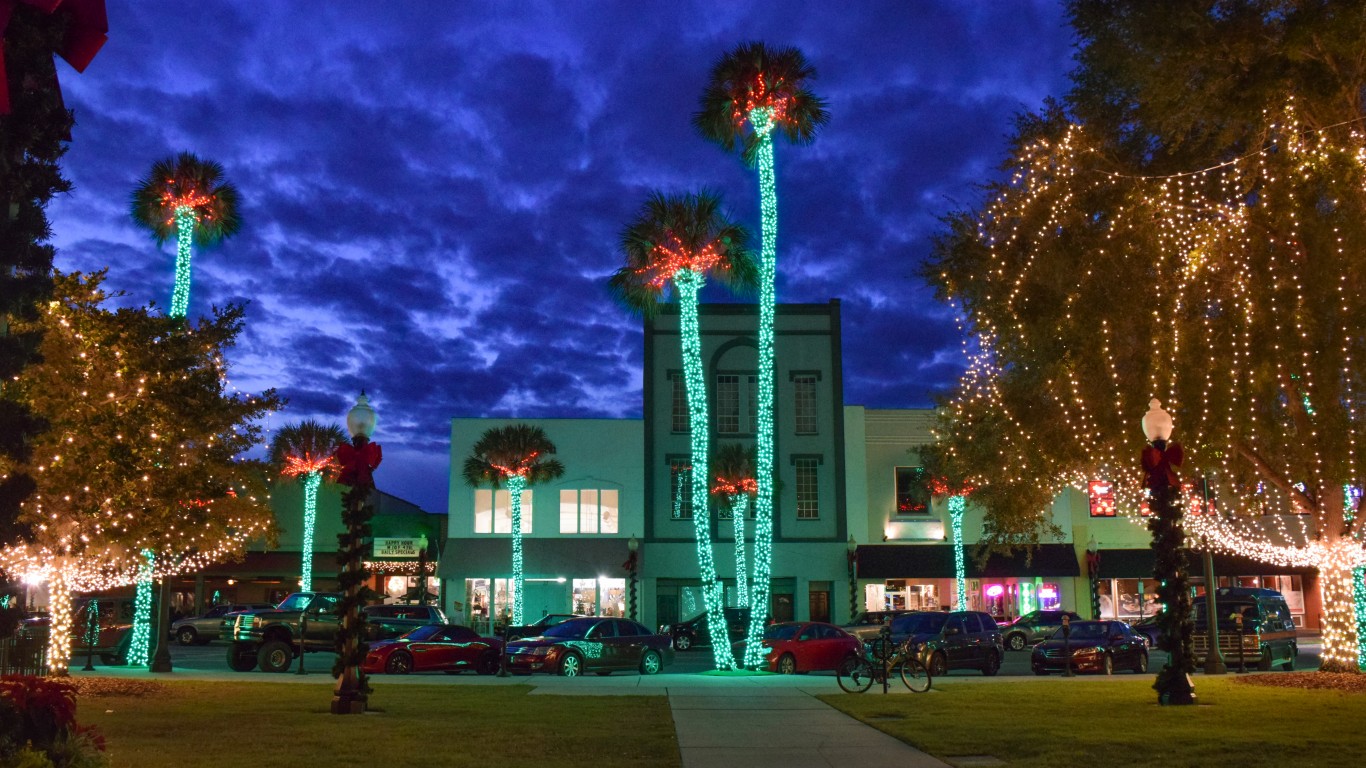
17. Ocala, Florida

MichaelWarrenPix / Getty Images
  • Population change in downtown tracts, 2012 to 2022: +24.2%
  • Population change of non-downtown tracts, 2012 to 2022: +5.2%
  • Per capita income change in downtown tracts, 2012 to 2022: -2.6%
  • Per capita income change in non-downtown tracts, 2012 to 2022: +14.4%

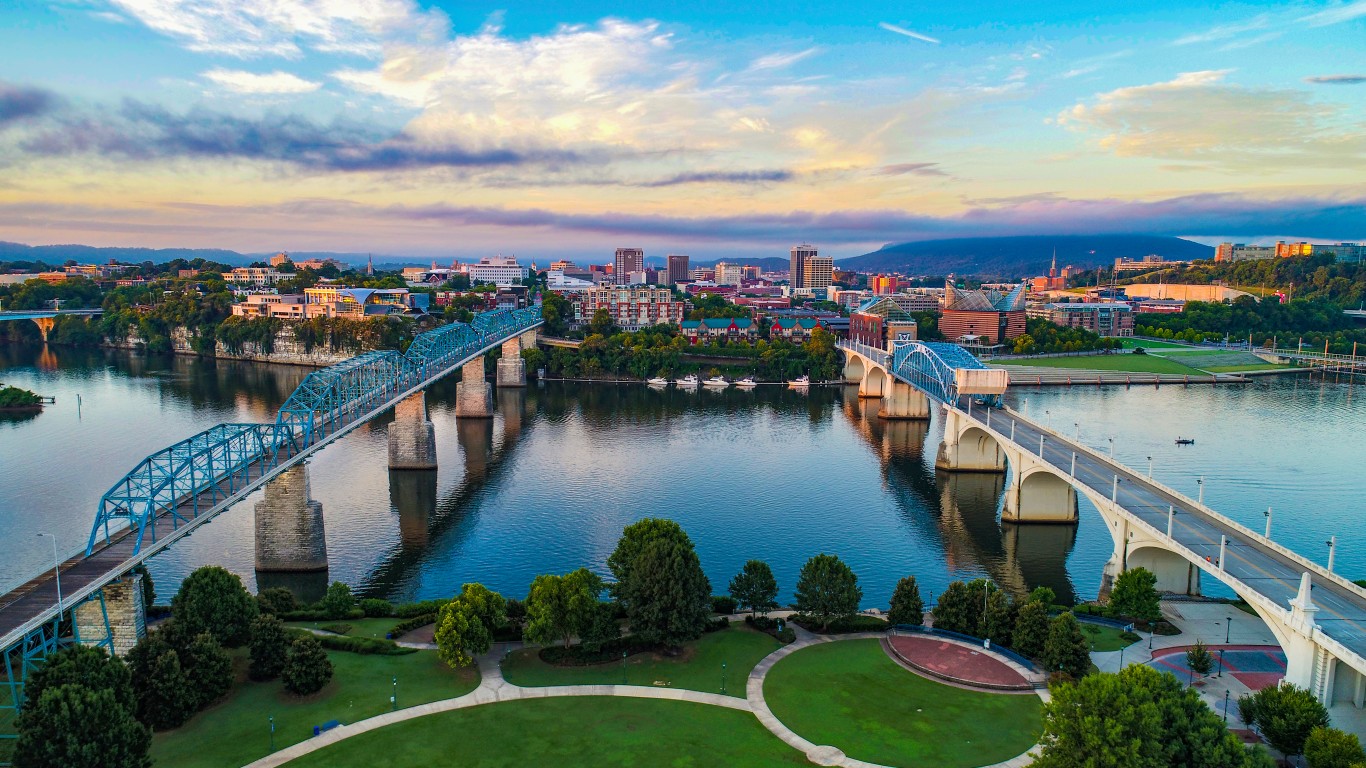
16. Chattanooga, Tennessee

Kruck20 / iStock via Getty Images
  • Population change in downtown tracts, 2012 to 2022: +25.3%
  • Population change of non-downtown tracts, 2012 to 2022: +3.6%
  • Per capita income change in downtown tracts, 2012 to 2022: +89.9%
  • Per capita income change in non-downtown tracts, 2012 to 2022: +19.1%

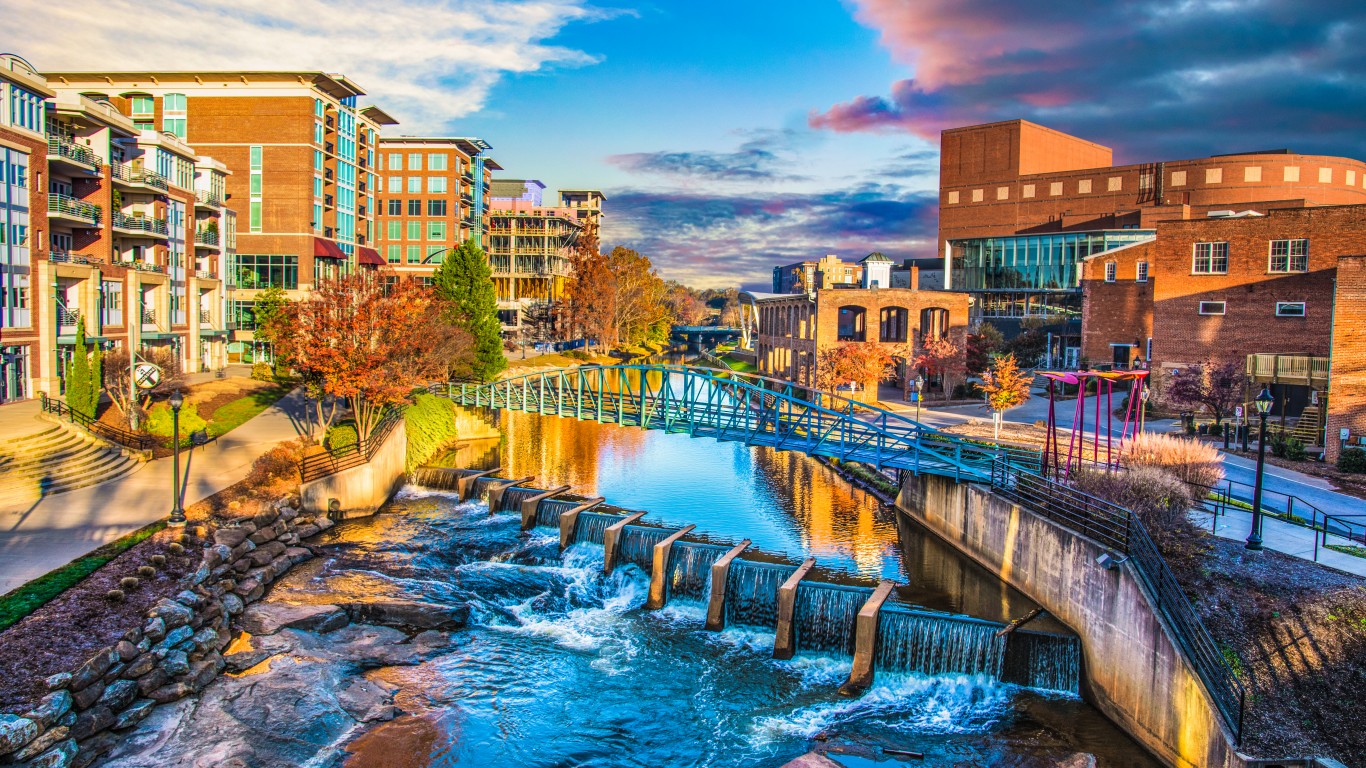
15. Greenville, South Carolina

Kruck20 / iStock via Getty Images
  • Population change in downtown tracts, 2012 to 2022: +26.1%
  • Population change of non-downtown tracts, 2012 to 2022: +10.3%
  • Per capita income change in downtown tracts, 2012 to 2022: +49.1%
  • Per capita income change in non-downtown tracts, 2012 to 2022: +37.4%

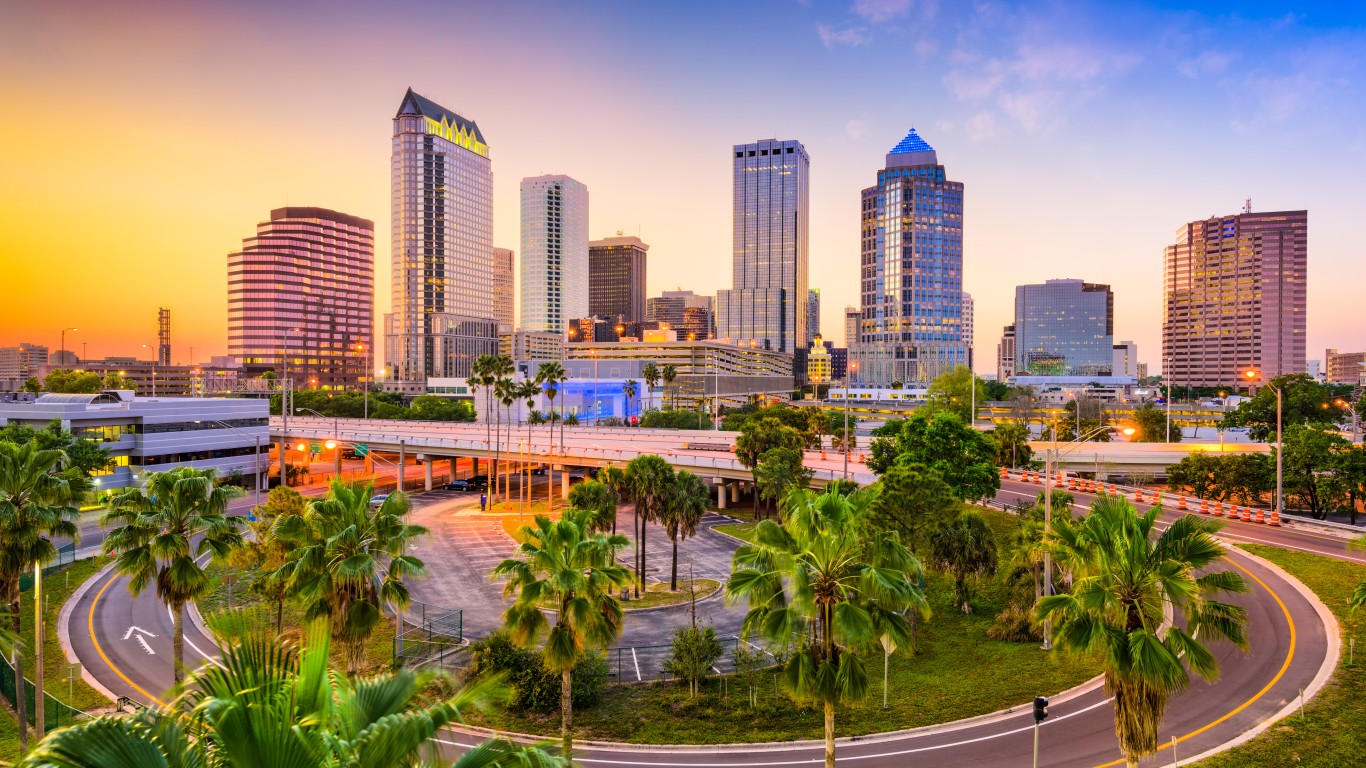
14. Tampa, Florida

SeanPavonePhoto / iStock via Getty Images
  • Population change in downtown tracts, 2012 to 2022: +27.1%
  • Population change of non-downtown tracts, 2012 to 2022: +10.5%
  • Per capita income change in downtown tracts, 2012 to 2022: +39.8%
  • Per capita income change in non-downtown tracts, 2012 to 2022: +21.2%

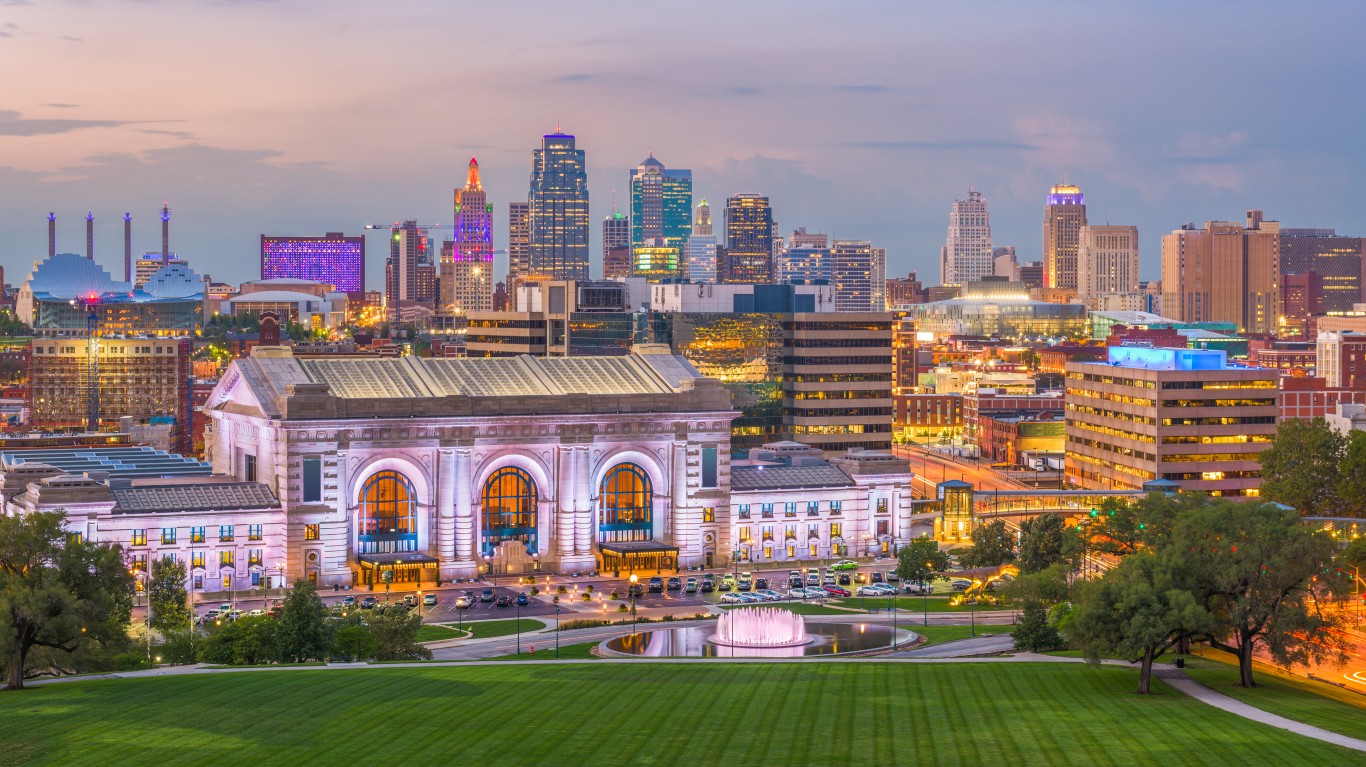
13. Kansas City, Missouri

Sean Pavone / iStock via Getty Images
  • Population change in downtown tracts, 2012 to 2022: +27.3%
  • Population change of non-downtown tracts, 2012 to 2022: +6.3%
  • Per capita income change in downtown tracts, 2012 to 2022: +37.7%
  • Per capita income change in non-downtown tracts, 2012 to 2022: +12.8%

12. Tuscaloosa, Alabama

DenisTangneyJr / iStock via Getty Images
  • Population change in downtown tracts, 2012 to 2022: +27.7%
  • Population change of non-downtown tracts, 2012 to 2022: +27.9%
  • Per capita income change in downtown tracts, 2012 to 2022: +27.1%
  • Per capita income change in non-downtown tracts, 2012 to 2022: +9.0%

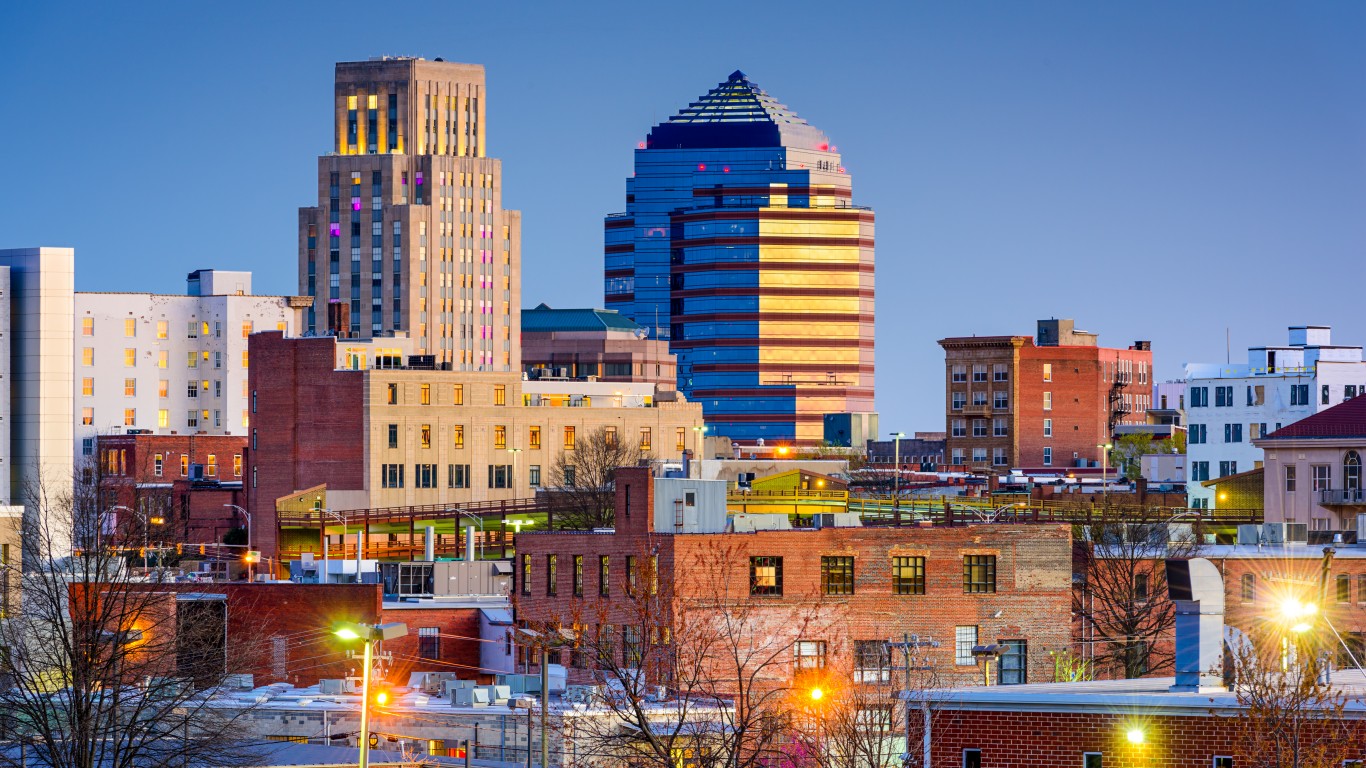
11. Durham, North Carolina

SeanPavonePhoto / iStock via Getty Images
  • Population change in downtown tracts, 2012 to 2022: +27.9%
  • Population change of non-downtown tracts, 2012 to 2022: +14.4%
  • Per capita income change in downtown tracts, 2012 to 2022: +52.9%
  • Per capita income change in non-downtown tracts, 2012 to 2022: +18.9%

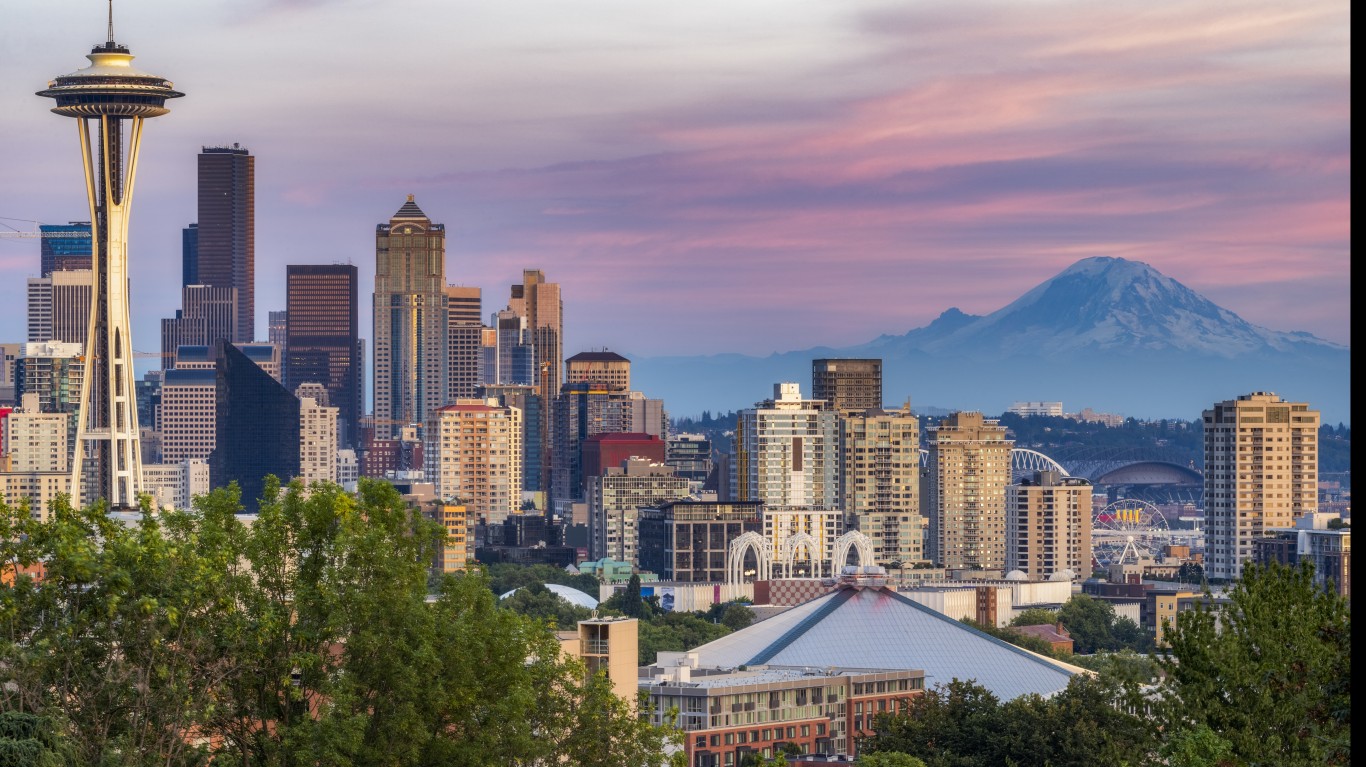
10. Seattle, Washington

chinaface / E+ via Getty Images
  • Population change in downtown tracts, 2012 to 2022: +28.3%
  • Population change of non-downtown tracts, 2012 to 2022: +12.9%
  • Per capita income change in downtown tracts, 2012 to 2022: +64.5%
  • Per capita income change in non-downtown tracts, 2012 to 2022: +39.7%

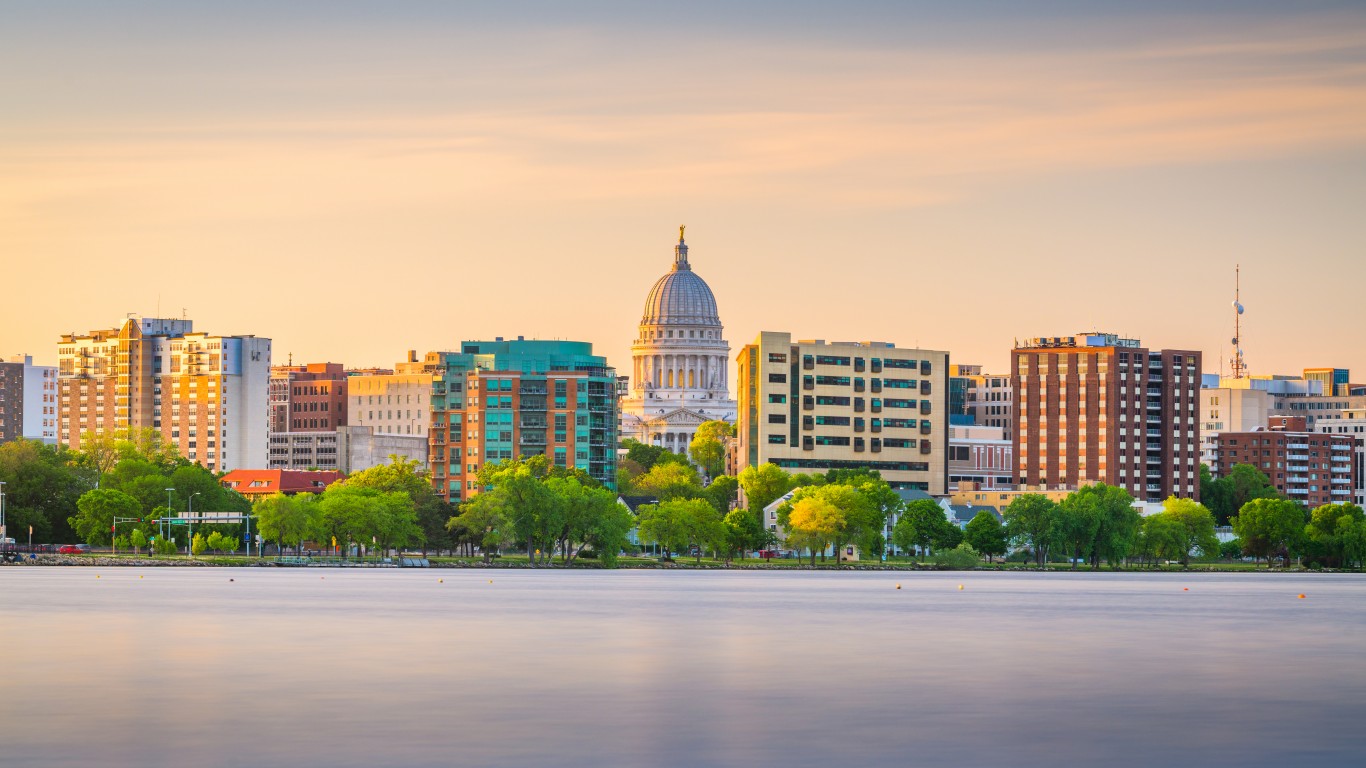
9. Madison, Wisconsin

Sean Pavone / iStock via Getty Images
  • Population change in downtown tracts, 2012 to 2022: +31.8%
  • Population change of non-downtown tracts, 2012 to 2022: +5.6%
  • Per capita income change in downtown tracts, 2012 to 2022: +28.4%
  • Per capita income change in non-downtown tracts, 2012 to 2022: +12.4%

8. Little Rock, Arkansas

Sean Pavone / iStock via Getty Images
  • Population change in downtown tracts, 2012 to 2022: +31.9%
  • Population change of non-downtown tracts, 2012 to 2022: +2.3%
  • Per capita income change in downtown tracts, 2012 to 2022: +69.6%
  • Per capita income change in non-downtown tracts, 2012 to 2022: +10.8%

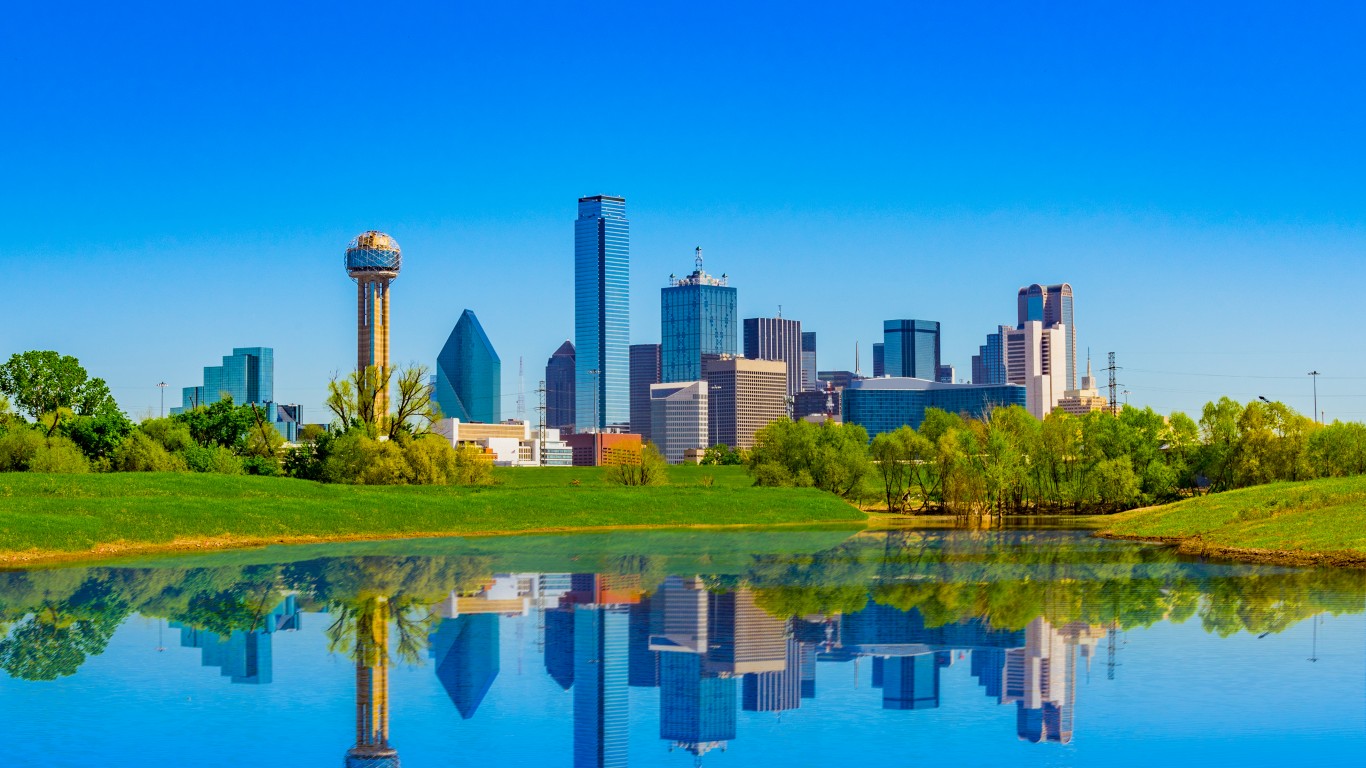
7. Dallas, Texas

Ron and Patty Thomas / iStock via Getty Images
  • Population change in downtown tracts, 2012 to 2022: +33.3%
  • Population change of non-downtown tracts, 2012 to 2022: +5.7%
  • Per capita income change in downtown tracts, 2012 to 2022: +12.6%
  • Per capita income change in non-downtown tracts, 2012 to 2022: +18.3%

6. Nashville, Tennessee

f11photo / iStock via Getty Images
  • Population change in downtown tracts, 2012 to 2022: +34.0%
  • Population change of non-downtown tracts, 2012 to 2022: +10.5%
  • Per capita income change in downtown tracts, 2012 to 2022: +87.2%
  • Per capita income change in non-downtown tracts, 2012 to 2022: +24.9%

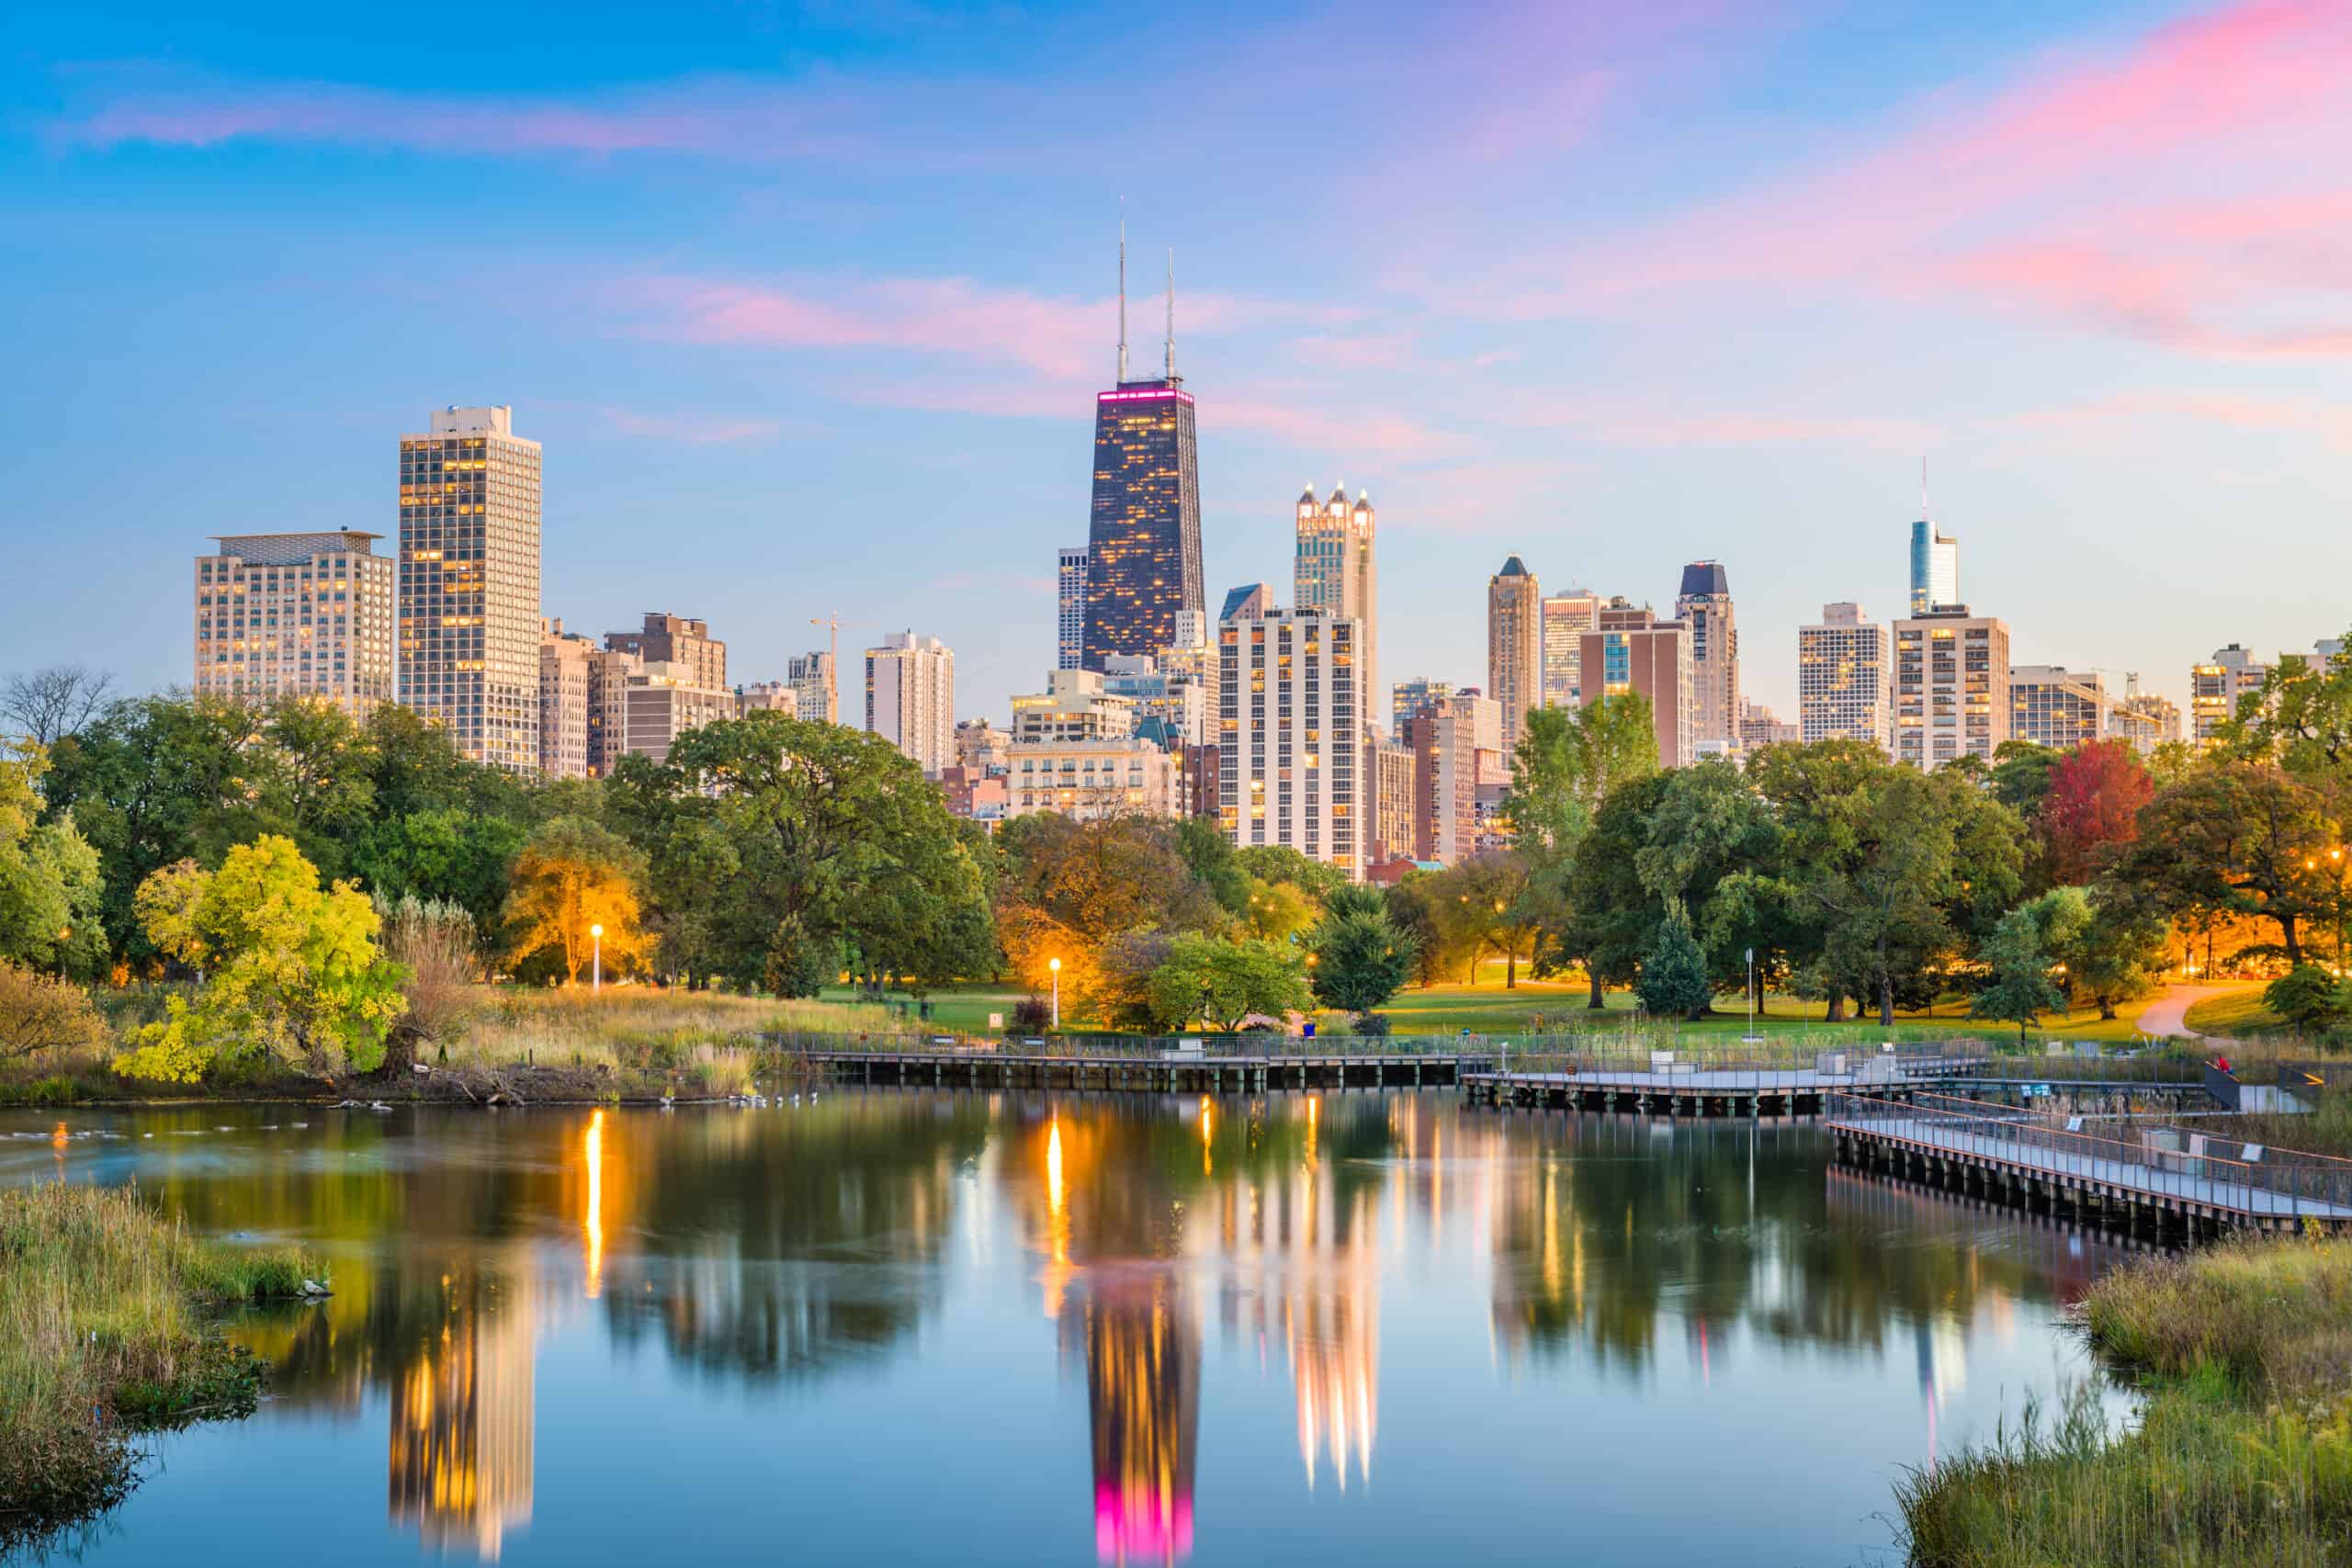
5. Chicago, Illinois

Sean Pavone / Shutterstock
  • Population change in downtown tracts, 2012 to 2022: +35.8%
  • Population change of non-downtown tracts, 2012 to 2022: -1.3%
  • Per capita income change in downtown tracts, 2012 to 2022: +5.0%
  • Per capita income change in non-downtown tracts, 2012 to 2022: +27.2%

4. Barnstable Town, Massachusetts

OlegAlbinsky / iStock via Getty Images
  • Population change in downtown tracts, 2012 to 2022: +37.7%
  • Population change of non-downtown tracts, 2012 to 2022: +2.6%
  • Per capita income change in downtown tracts, 2012 to 2022: +12.3%
  • Per capita income change in non-downtown tracts, 2012 to 2022: +14.7%

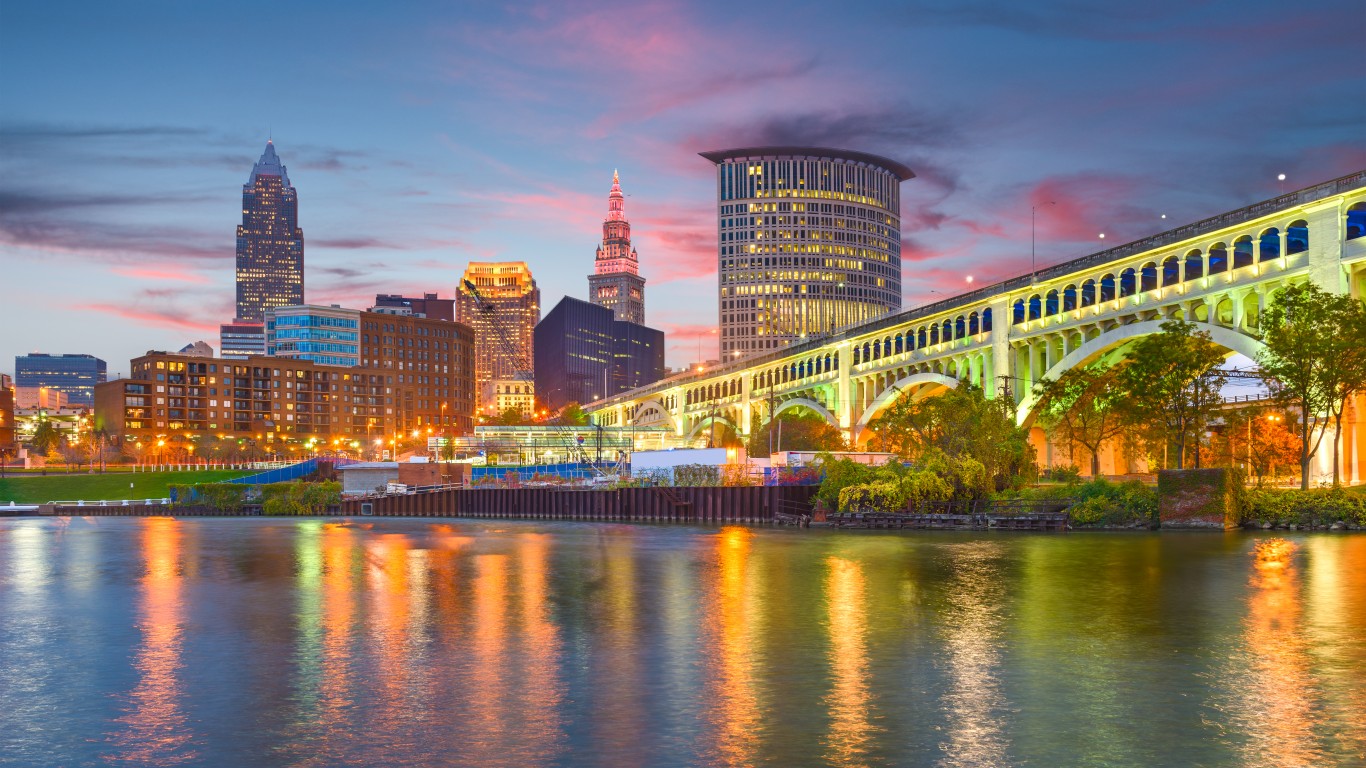
3. Cleveland, Ohio

Sean Pavone / iStock via Getty Images
  • Population change in downtown tracts, 2012 to 2022: +42.1%
  • Population change of non-downtown tracts, 2012 to 2022: -8.4%
  • Per capita income change in downtown tracts, 2012 to 2022: +17.9%
  • Per capita income change in non-downtown tracts, 2012 to 2022: +15.5%

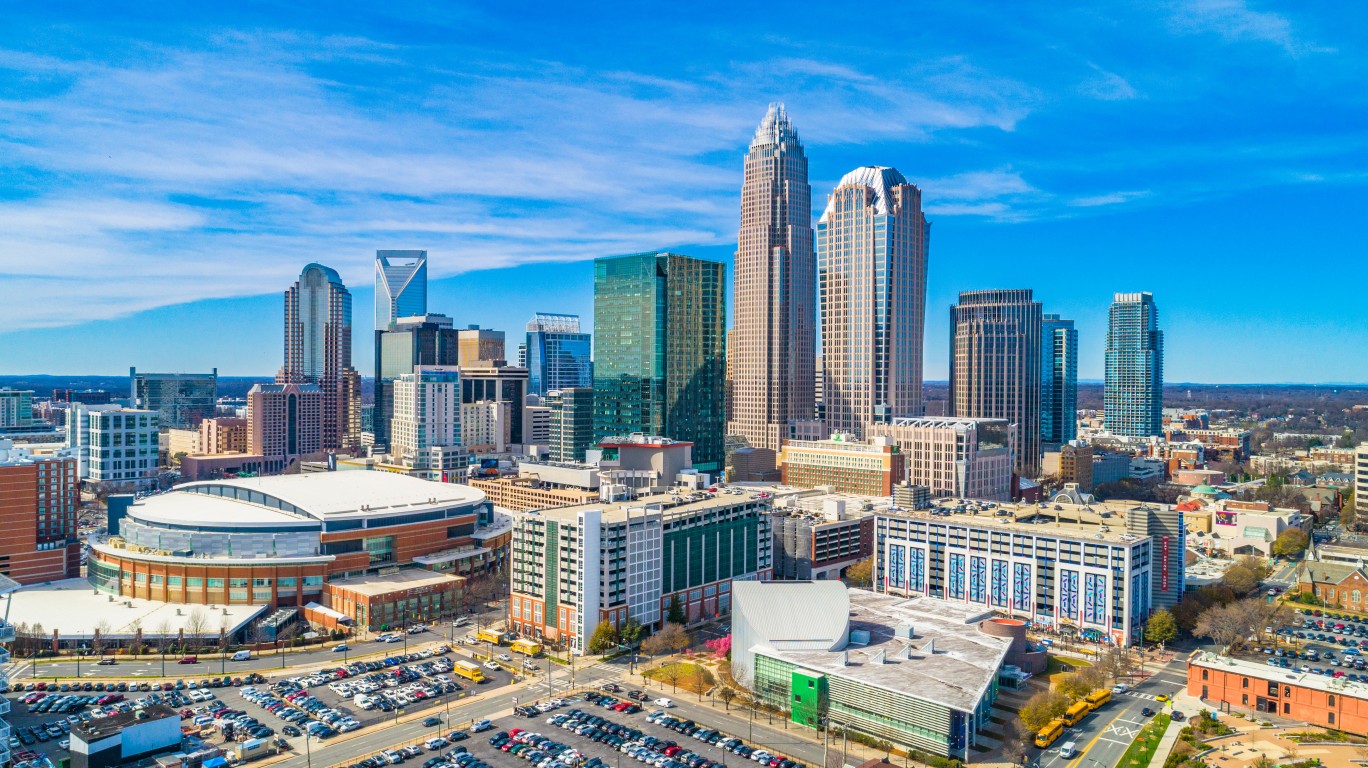
2. Charlotte, North Carolina

Kruck20 / iStock via Getty Images
  • Population change in downtown tracts, 2012 to 2022: +47.0%
  • Population change of non-downtown tracts, 2012 to 2022: +11.8%
  • Per capita income change in downtown tracts, 2012 to 2022: +29.7%
  • Per capita income change in non-downtown tracts, 2012 to 2022: +19.3%

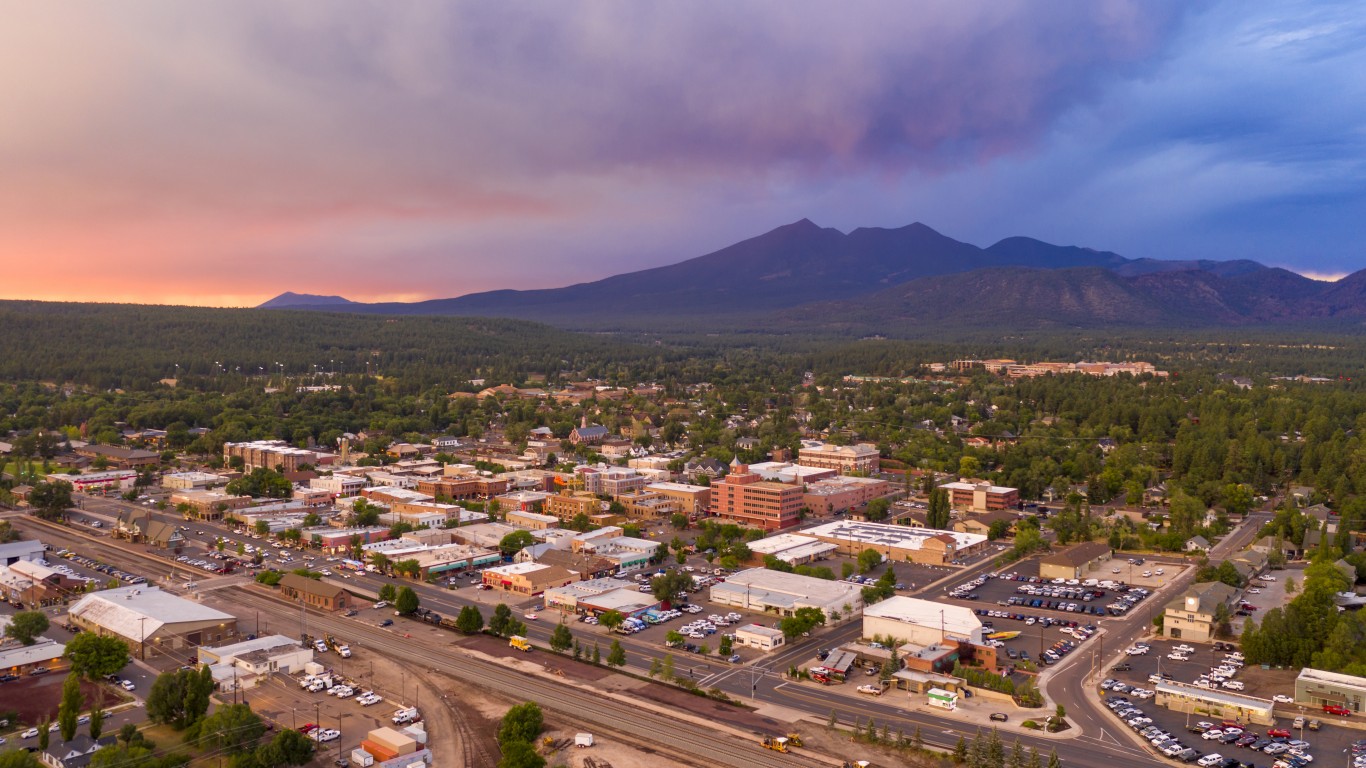
1. Flagstaff, Arizona

ChrisBoswell / iStock via Getty Images
  • Population change in downtown tracts, 2012 to 2022: +49.9%
  • Population change of non-downtown tracts, 2012 to 2022: +1.3%
  • Per capita income change in downtown tracts, 2012 to 2022: +8.4%
  • Per capita income change in non-downtown tracts, 2012 to 2022: +22.0%

Get Ready To Retire (Sponsored)

Start by taking a quick retirement quiz from SmartAsset that will match you with up to 3 financial advisors that serve your area and beyond in 5 minutes, or less.

Each advisor has been vetted by SmartAsset and is held to a fiduciary standard to act in your best interests.

Here’s how it works:
1. Answer SmartAsset advisor match quiz
2. Review your pre-screened matches at your leisure. Check out the advisors’ profiles.
3. Speak with advisors at no cost to you. Have an introductory call on the phone or introduction in person and choose whom to work with in the future
Get started right here.

Thank you for reading! Have some feedback for us?
Contact the 24/7 Wall St. editorial team.