Population and Social Characteristics
Immigrants Are Flocking to These Counties in This Red State
felixmizioznikov / iStock via Getty Images
Published: October 23, 2024 7:58 am
24/7 Wall St. Insights
Every year, millions of immigrants move to the United States. Of the 2.1 million people who moved to the U.S. from abroad in 2022, tens of thousands now live in Florida — a state with a relatively large foreign-born population. Also : 2 Dividend Legends to Hold Forever
Election Day is looming, and for millions of Americans, U.S. immigration policy is top of mind. According to a recent survey from the Pew Research Center , 61% of registered voters consider immigration to be a very important issue in the 2024 presidential race.
But, as with many major issues in American politics, opinions about immigration are starkly divided along party lines. The same Pew study also found that only 39% of voters who support Kamala Harris, a Democrat, see immigration policy as very important, compared to 82% of Republicans who support Donald Trump.
Currently, there are nearly 45.3 million immigrants living in the United States, or about 13.8% of the total U.S. population, according to 1-year estimates from the U.S. Census Bureau’s American Community Survey. Of America’s foreign-born residents, 23.7 million are naturalized U.S. citizens, 21.6 million are foreign nationals, and more than 2.1 million of all immigrants in the U.S. arrived to the country in 2022, the most recent year of available data.
Places with large, well-established immigrant populations are often top destinations for new international migrants. There are currently 4,571,902 people living in Florida who were born in a foreign country, more than in all but two other states. While every state brought in new residents from abroad in 2022, Florida was, perhaps not surprisingly, an especially popular destination.
According to 5-year ACS estimates , approximately 198,200 people moved to Florida from a different country or U.S. territory in 2022. The largest share of new residents from abroad in Florida came from South America, a region that accounted for about 24.1% of all migrants to the state in 2022. Immigrants from the Caribbean and Asia were also relatively common, accounting for about 16.4% and 12.3% of all inbound migration, respectively. (Here is a look at the countries most immigrants in the U.S. come from .)
For any number of reasons, some parts of Florida are demonstrably more attractive for international migrants than others. Whether for social factors, such as the presence of large international communities, or for economic conditions, like affordable housing or the availability of well-paying jobs, 27 of the 67 counties in Florida with available data brought in more than 1,000 people from abroad in 2022 alone. (These immigrant populations have made it big in the U.S. )
These are the counties in Florida where the most immigrants are moving. All county-level migration, income, and home value data in this story are 5-year average estimates from the U.S. Census Bureau’s ACS. Supplemental data on the average unemployment rate in 2023 are from the Bureau of Labor Statistics. It is important to note that international migration totals include individuals who moved from Puerto Rico and other U.S. territories, like the Virgin Islands and American Samoa, as well as foreign countries.
Why It Matters
GCShutter / E+ via Getty Images The United States has long been a leading destination for international migrants globally. However, fueled in part by a surge in illegal crossings along the southern border, U.S. immigration policy has emerged as one of the most contentious and polarizing issues in American politics. More than 2.1 million people migrated to the U.S. from abroad in 2022 alone, and of them, about 12.5% reside in Florida, according to 1-year ACS estimates.
lightphoto / iStock via Getty Images
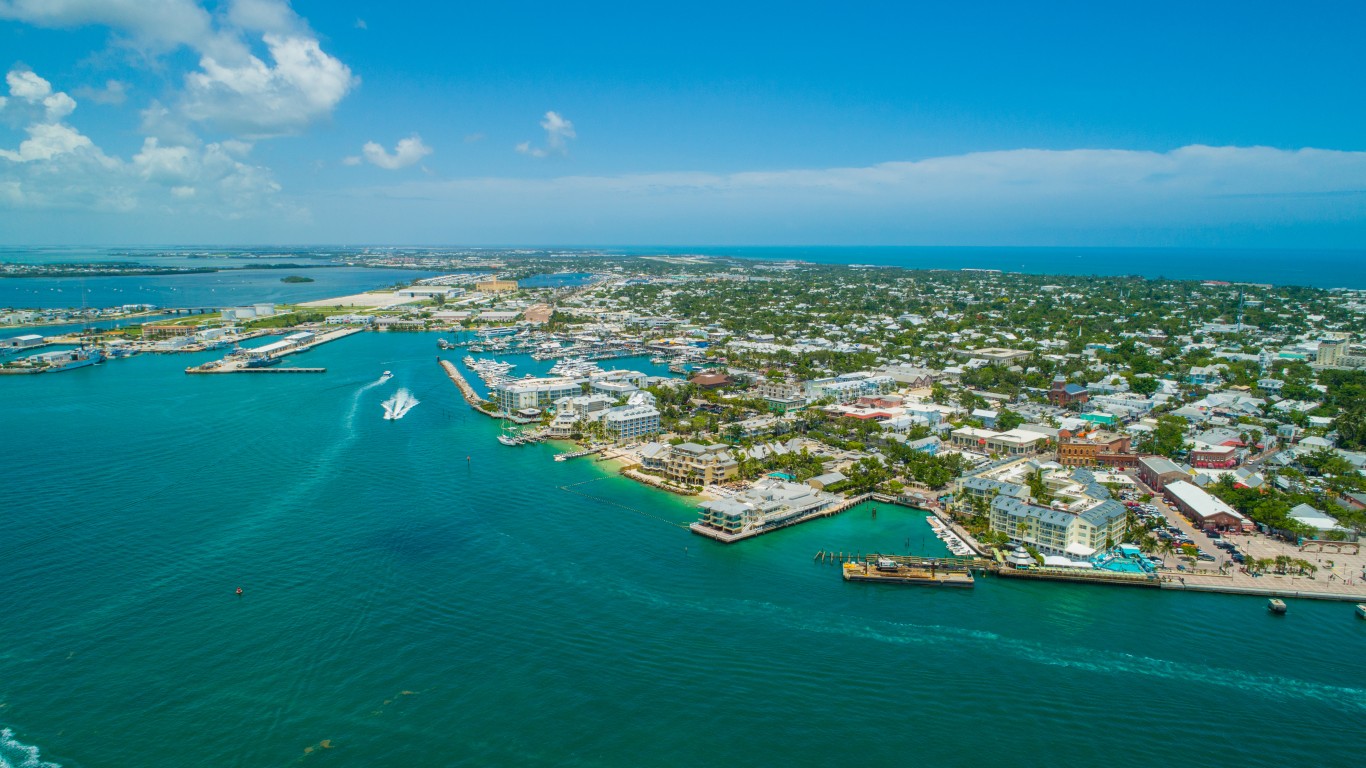
New residents who moved from abroad in 2022: 1,132 (0.6% of current population)Top feeder regions in 2022: Europe: 330 migrants; Asia: 312 migrants; Caribbean: 155 migrantsCitizenship and nativity demographics of county: 95.0% native-born; 3.5% foreign-born naturalized citizen; 1.5% foreign-born non-citizen2023 annual unemployment rate: 2.8% (0.1 ppt. lower than statewide rate)Median home value: $272,500 ($19,700 lower than statewide median)Median household income: $84,715 ($16,798 higher than statewide median)Total population: 187,020
felixmizioznikov / iStock via Getty Images
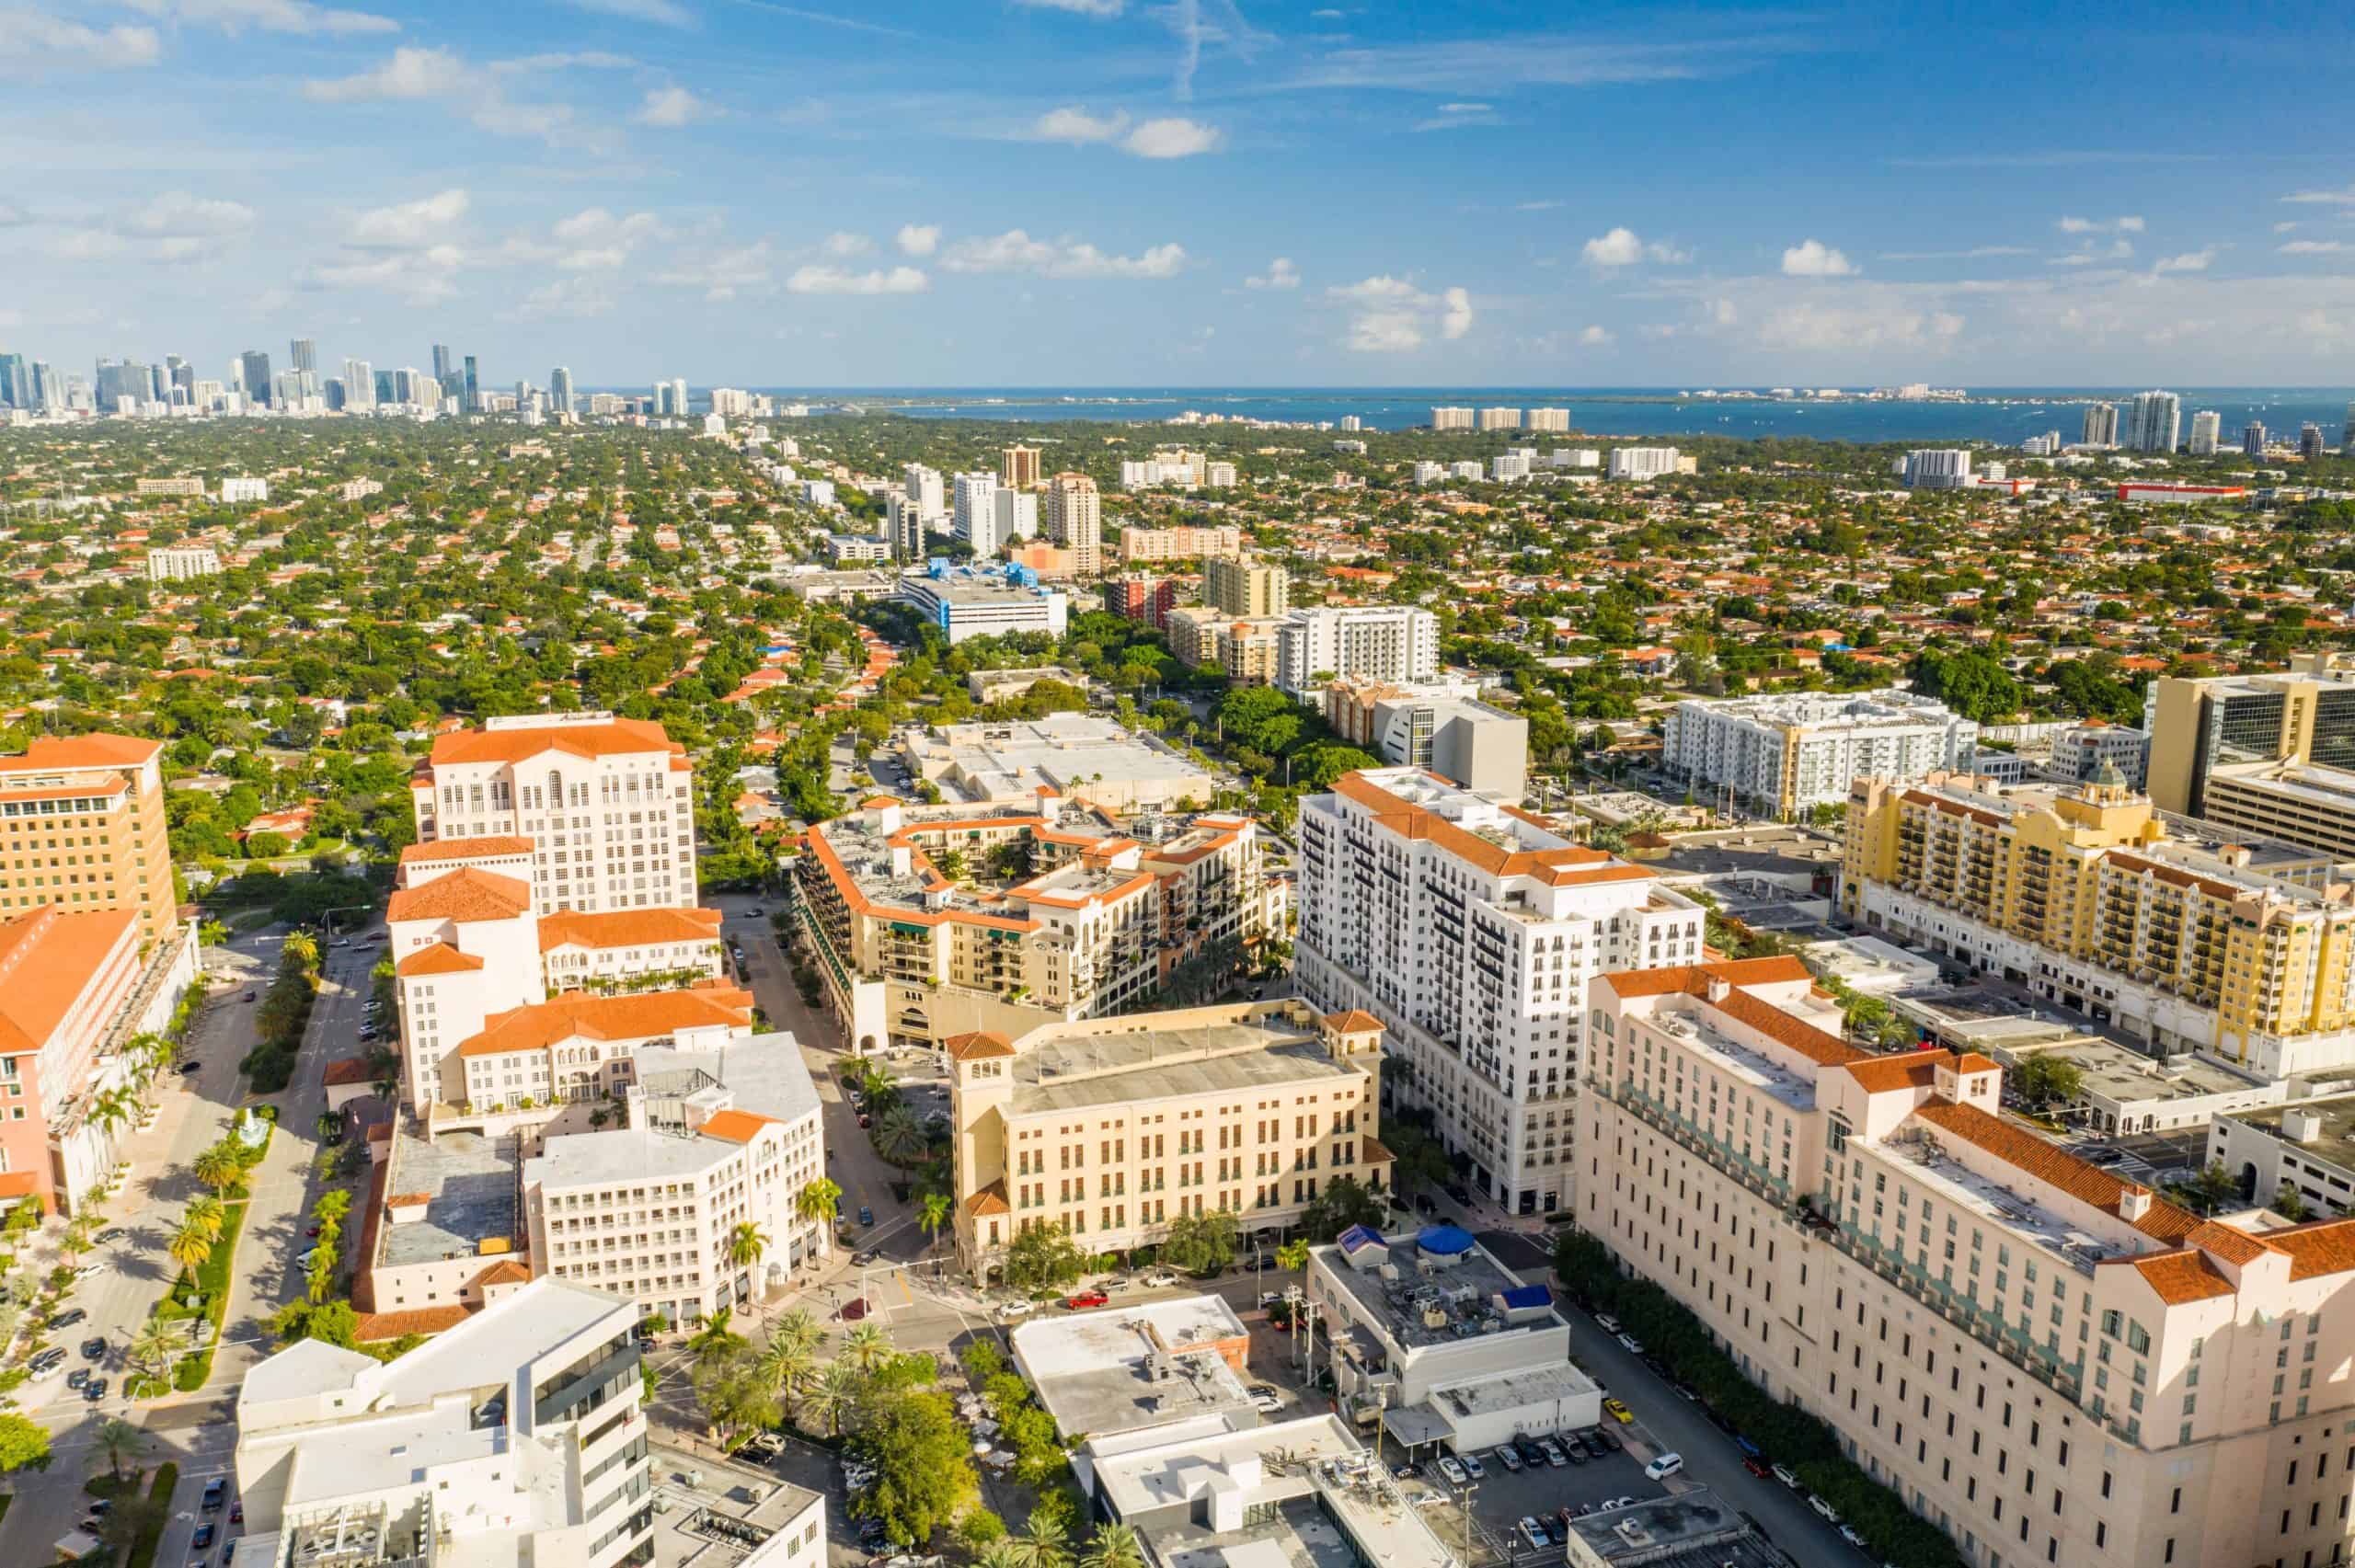
New residents who moved from abroad in 2022: 1,164 (1.4% of current population)Top feeder regions in 2022: Caribbean: 326 migrants; Puerto Rico: 267 migrants; Europe: 190 migrantsCitizenship and nativity demographics of county: 80.1% native-born; 11.9% foreign-born naturalized citizen; 7.9% foreign-born non-citizen2023 annual unemployment rate: 1.9% (1.0 ppt. lower than statewide rate)Median home value: $696,900 ($404,700 higher than statewide median)Median household income: $80,111 ($12,194 higher than statewide median)Total population: 81,163
Ryan Tishken / iStock via Getty Images
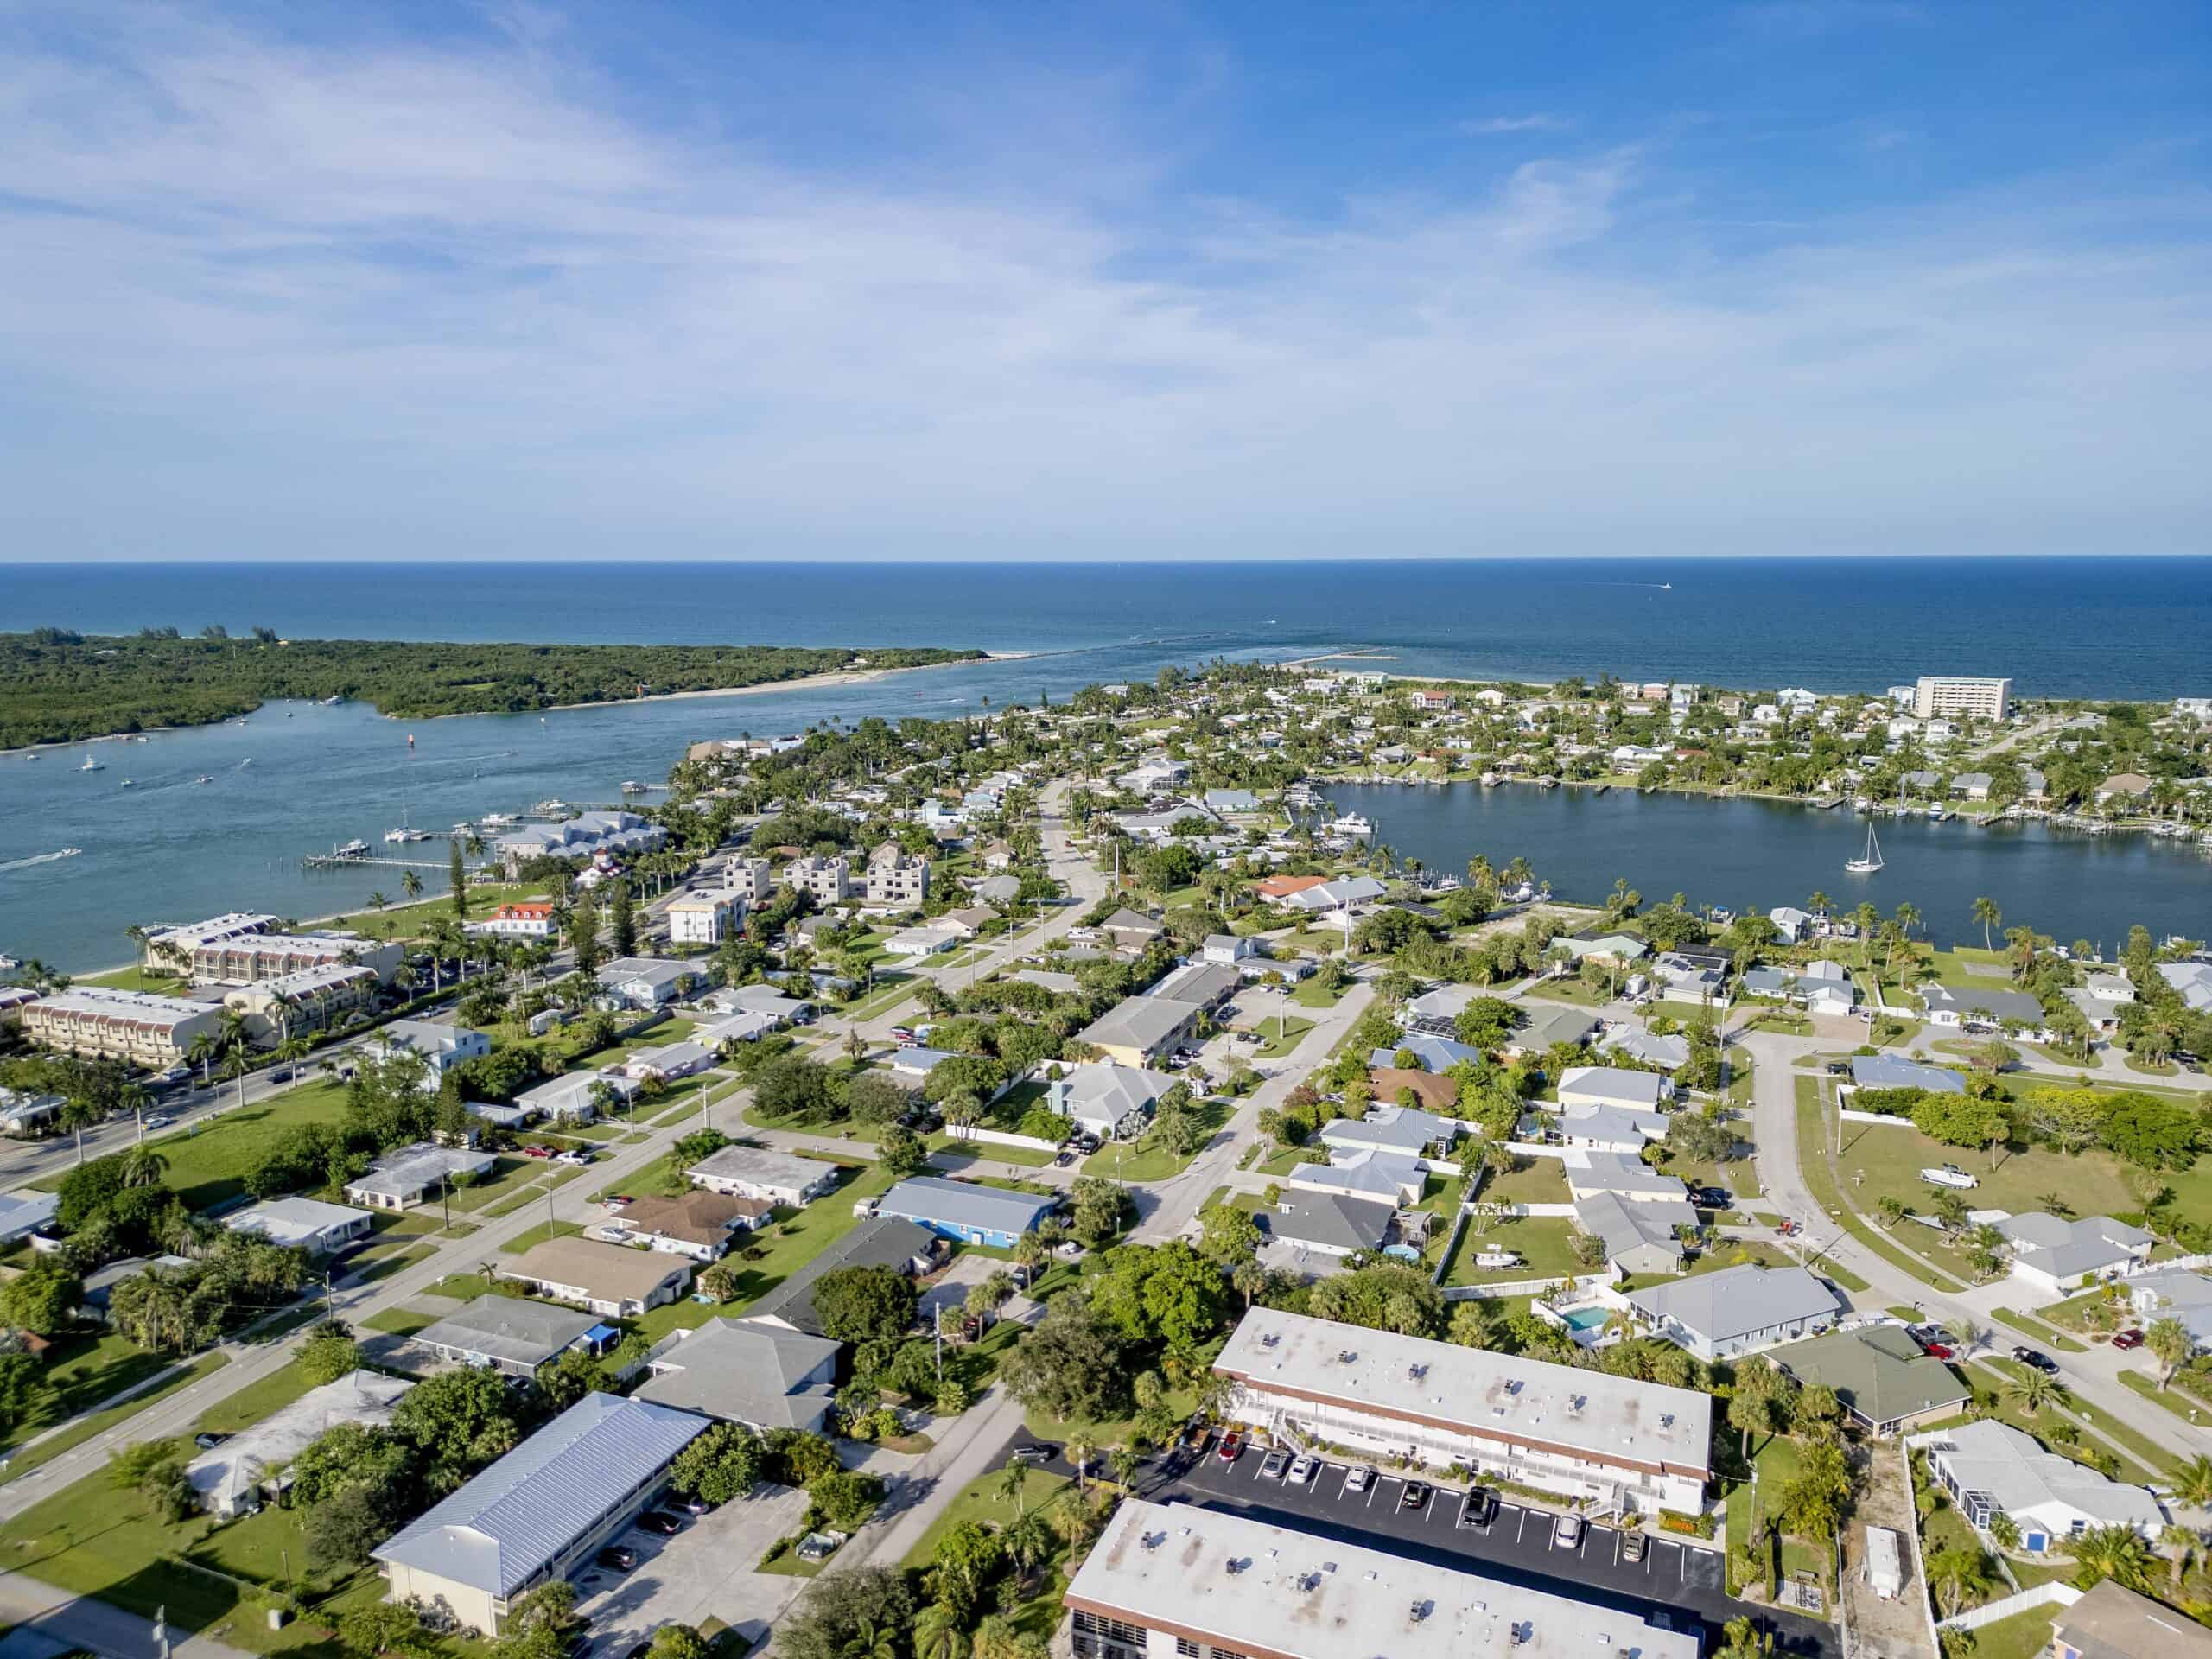
New residents who moved from abroad in 2022: 1,239 (0.4% of current population)Top feeder regions in 2022: Central America: 738 migrants; Northern North America: 221 migrants; Caribbean: 103 migrantsCitizenship and nativity demographics of county: 82.6% native-born; 11.6% foreign-born naturalized citizen; 5.7% foreign-born non-citizen2023 annual unemployment rate: 3.5% (0.6 ppt. higher than statewide rate)Median home value: $275,900 ($16,300 lower than statewide median)Median household income: $66,154 ($1,763 lower than statewide median)Total population: 331,709
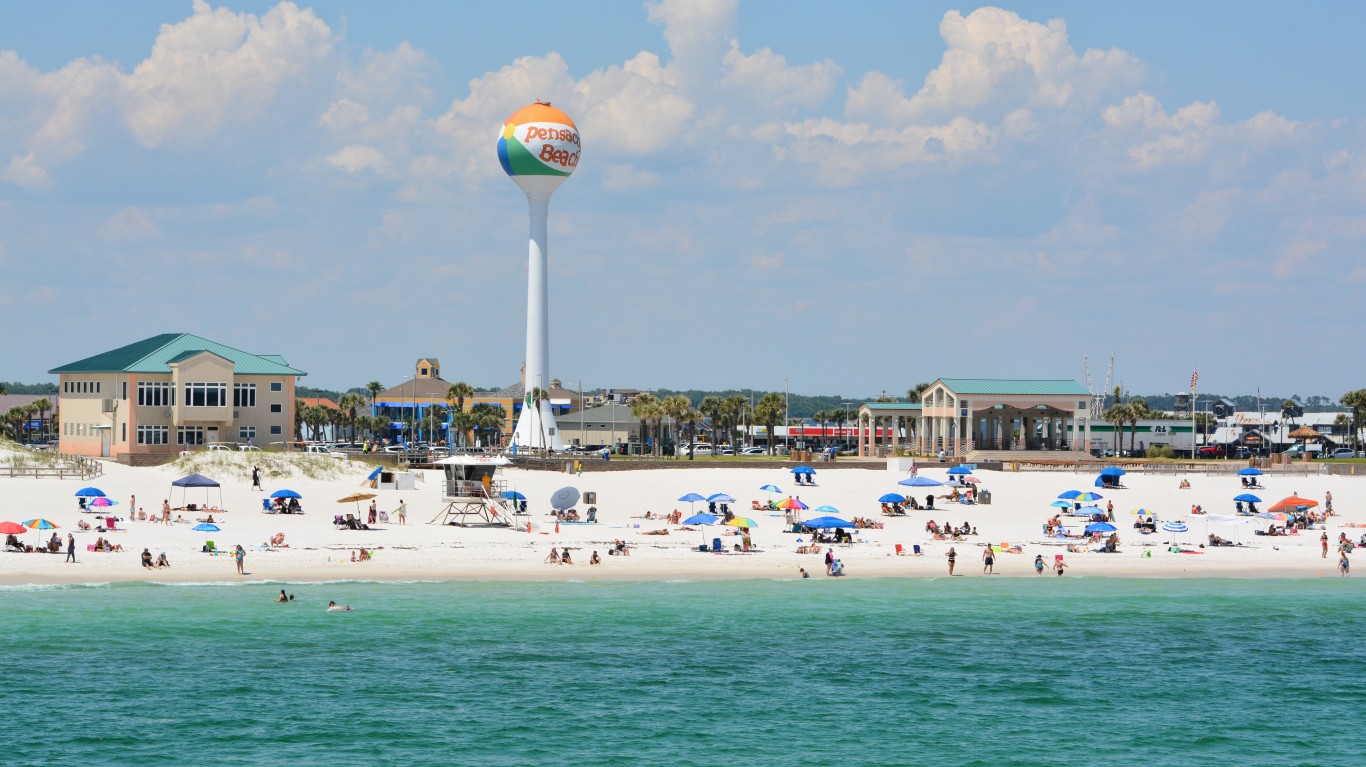
New residents who moved from abroad in 2022: 1,518 (0.5% of current population)Top feeder regions in 2022: Asia: 744 migrants; Europe: 239 migrants; Caribbean: 155 migrantsCitizenship and nativity demographics of county: 93.1% native-born; 3.9% foreign-born naturalized citizen; 3.0% foreign-born non-citizen2023 annual unemployment rate: 3.1% (0.2 ppt. higher than statewide rate)Median home value: $256,900 ($35,300 lower than statewide median)Median household income: $61,317 ($6,600 lower than statewide median)Total population: 291,235
Norm Lane / iStock via Getty Images
New residents who moved from abroad in 2022: 1,548 (0.5% of current population)Top feeder regions in 2022: Europe: 525 migrants; Asia: 454 migrants; Central America: 162 migrantsCitizenship and nativity demographics of county: 94.6% native-born; 2.9% foreign-born naturalized citizen; 2.5% foreign-born non-citizen2023 annual unemployment rate: 3.1% (0.2 ppt. higher than statewide rate)Median home value: $206,400 ($85,800 lower than statewide median)Median household income: $61,642 ($6,275 lower than statewide median)Total population: 317,582
scampj / iStock via Getty Images
New residents who moved from abroad in 2022: 1,562 (0.4% of current population)Top feeder regions in 2022: Asia: 286 migrants; Europe: 235 migrants; Puerto Rico: 220 migrantsCitizenship and nativity demographics of county: 91.7% native-born; 5.2% foreign-born naturalized citizen; 3.0% foreign-born non-citizen2023 annual unemployment rate: 3.6% (0.7 ppt. higher than statewide rate)Median home value: $194,900 ($97,300 lower than statewide median)Median household income: $55,265 ($12,652 lower than statewide median)Total population: 374,900
TimothyOLeary / iStock via Getty Images
New residents who moved from abroad in 2022: 1,936 (0.7% of current population)Top feeder regions in 2022: Europe: 856 migrants; Central America: 336 migrants; South America: 227 migrantsCitizenship and nativity demographics of county: 91.1% native-born; 5.8% foreign-born naturalized citizen; 3.1% foreign-born non-citizen2023 annual unemployment rate: 2.7% (0.2 ppt. lower than statewide rate)Median home value: $416,100 ($123,900 higher than statewide median)Median household income: $100,020 ($32,103 higher than statewide median)Total population: 276,164
Norm Lane / iStock via Getty Images
New residents who moved from abroad in 2022: 1,941 (0.5% of current population)Top feeder regions in 2022: Europe: 517 migrants; South America: 353 migrants; Asia: 321 migrantsCitizenship and nativity demographics of county: 89.5% native-born; 6.4% foreign-born naturalized citizen; 4.1% foreign-born non-citizen2023 annual unemployment rate: 3.1% (0.2 ppt. higher than statewide rate)Median home value: $262,500 ($29,700 lower than statewide median)Median household income: $66,239 ($1,678 lower than statewide median)Total population: 383,577
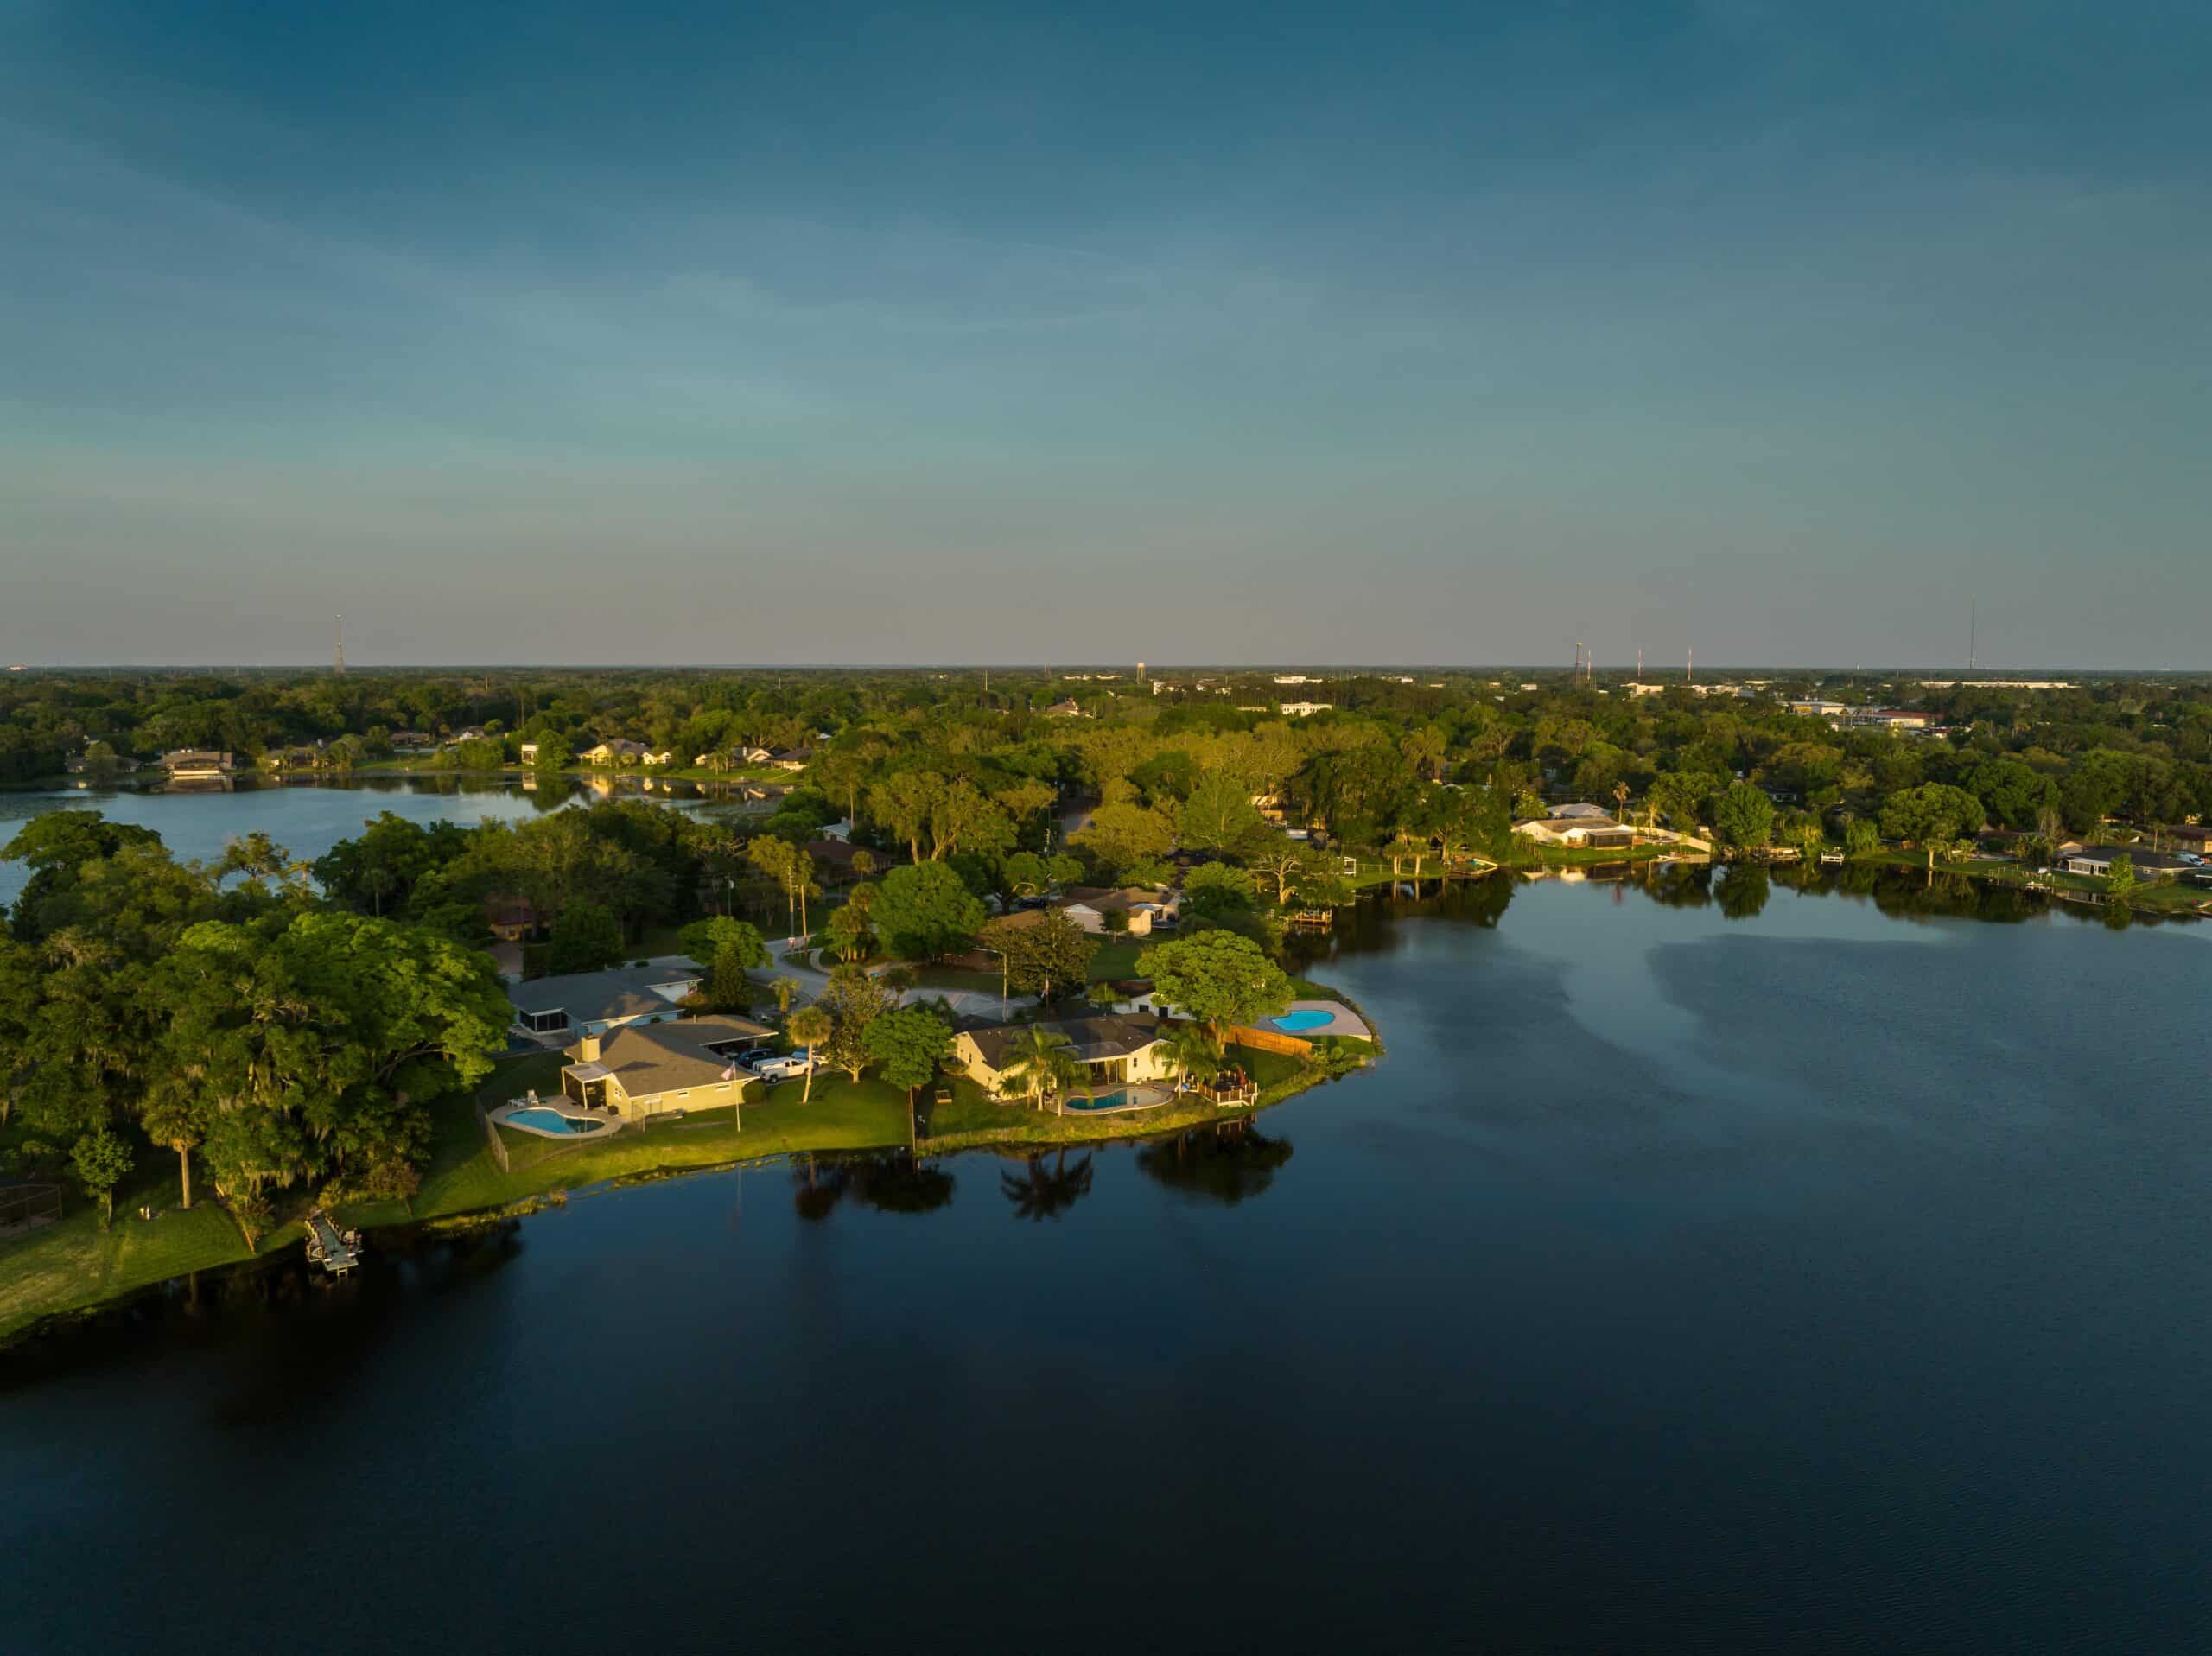
ghornephoto / E+ via Getty Images
New residents who moved from abroad in 2022: 2,061 (1.0% of current population)Top feeder regions in 2022: Asia: 941 migrants; Europe: 755 migrants; U.S. Island Areas: 154 migrantsCitizenship and nativity demographics of county: 92.0% native-born; 4.1% foreign-born naturalized citizen; 3.9% foreign-born non-citizen2023 annual unemployment rate: 2.6% (0.3 ppt. lower than statewide rate)Median home value: $295,400 ($3,200 higher than statewide median)Median household income: $73,988 ($6,071 higher than statewide median)Total population: 208,727
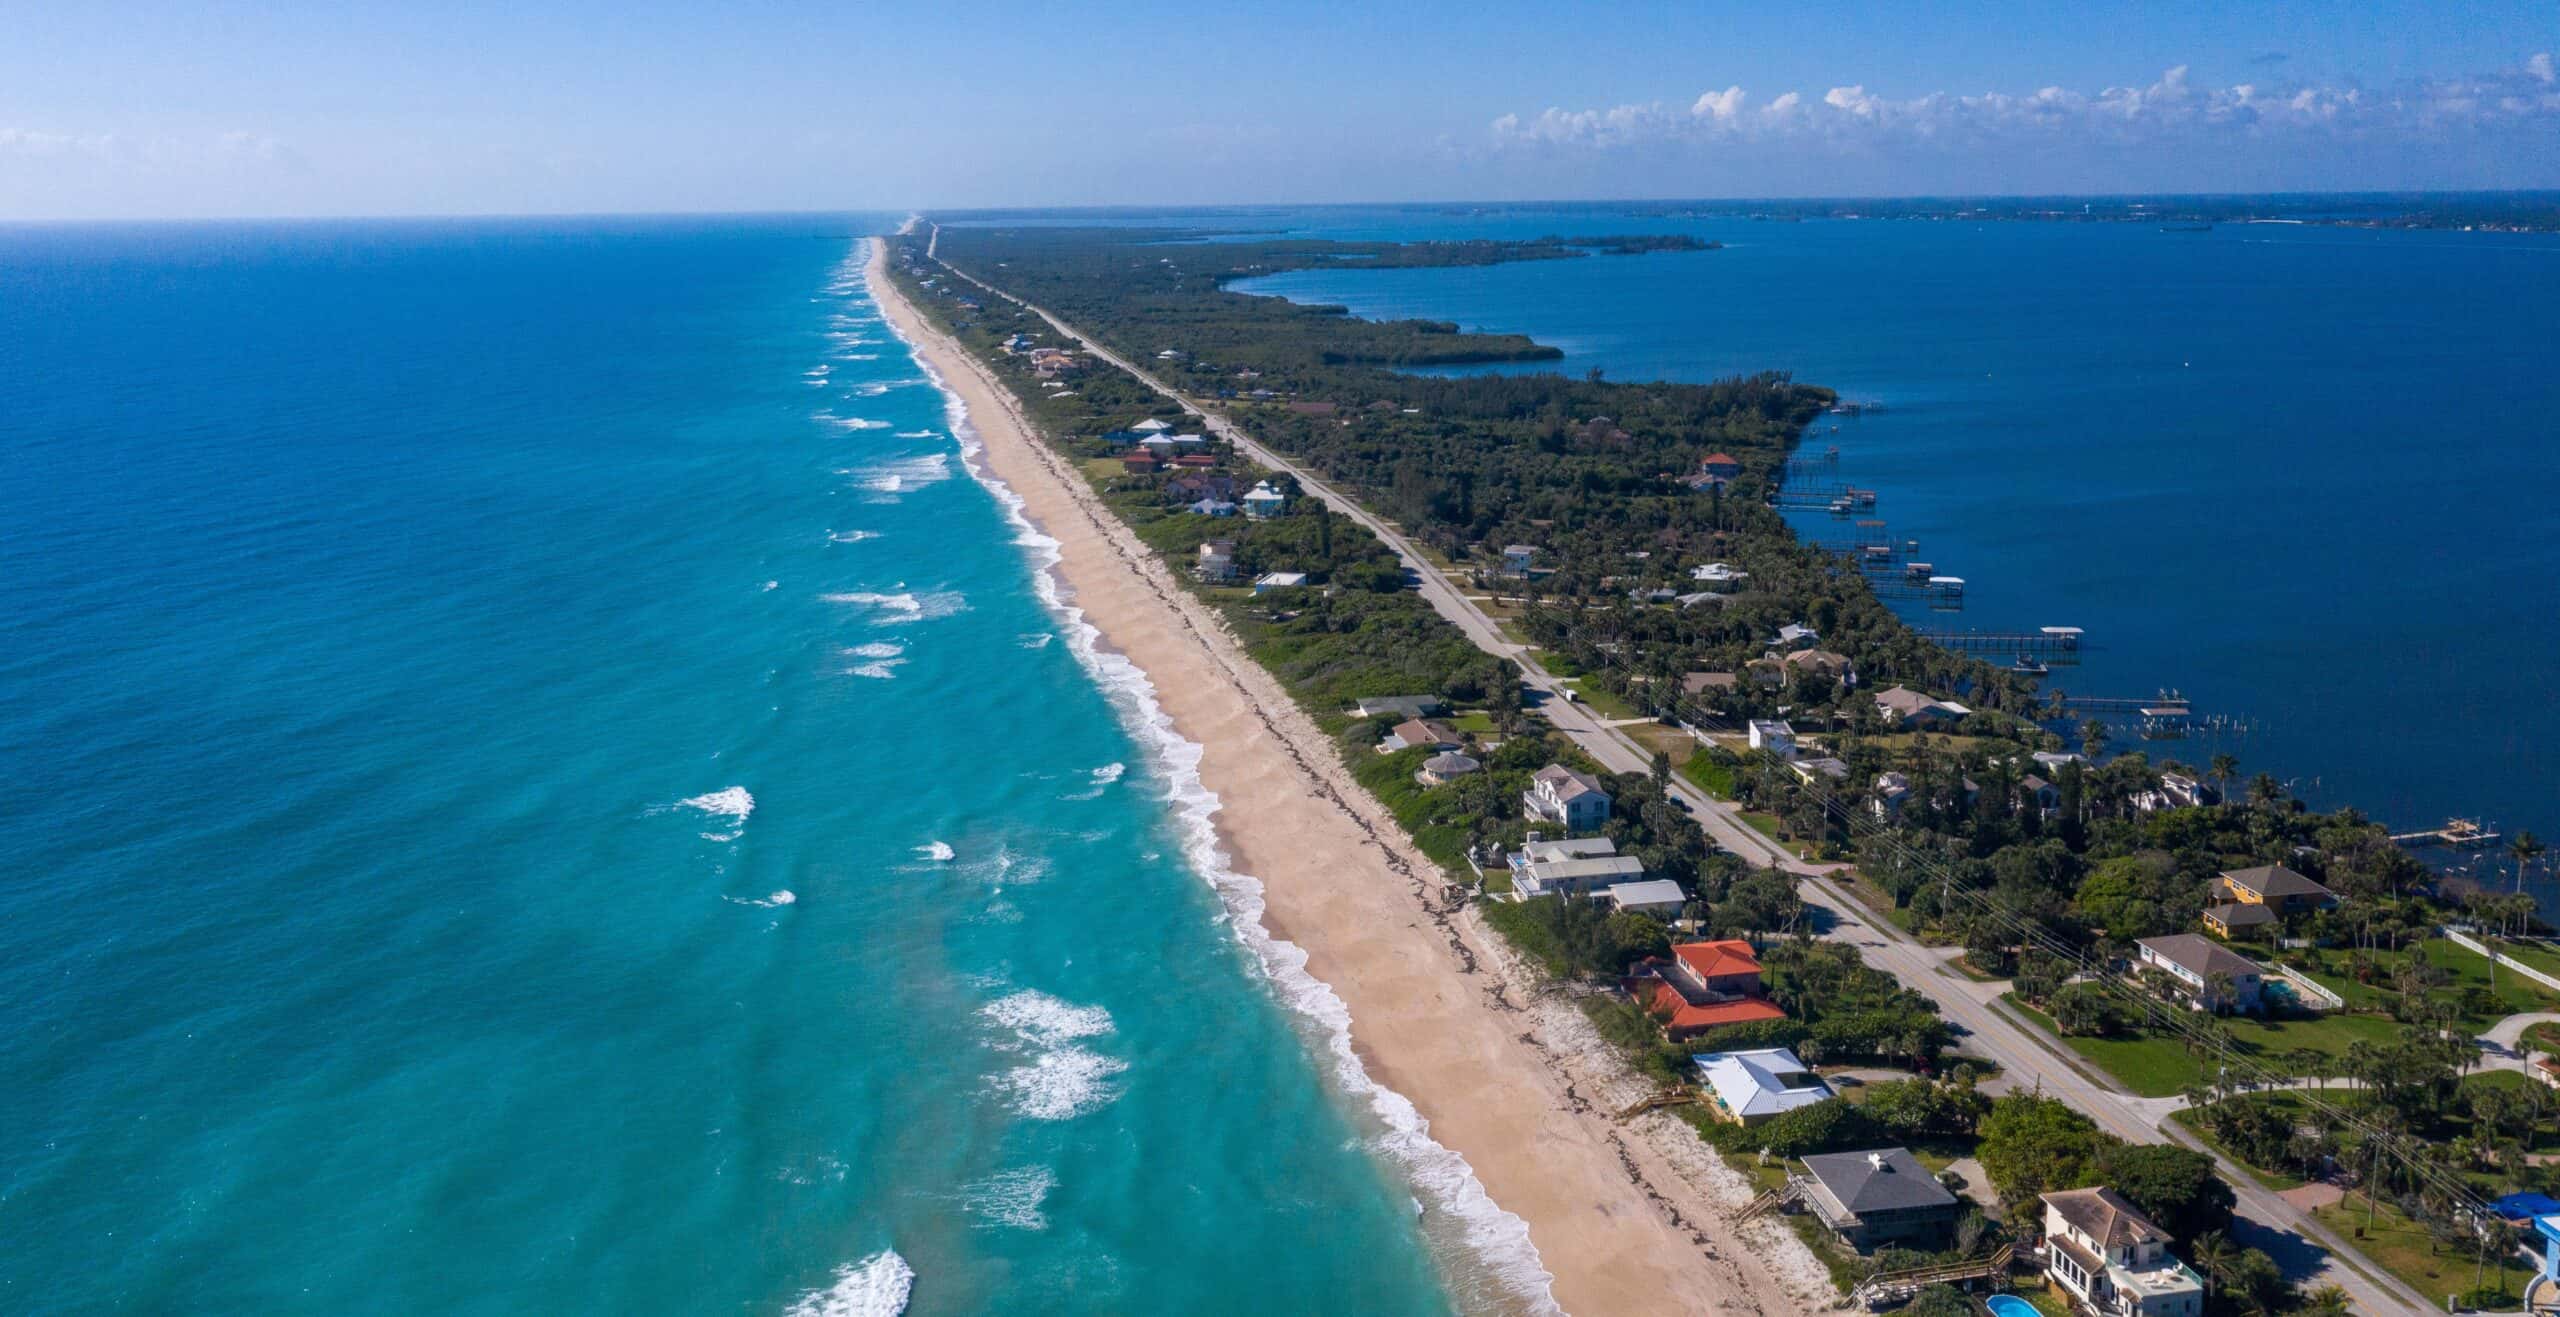
traveler1116 / iStock via Getty Images
New residents who moved from abroad in 2022: 2,234 (0.5% of current population)Top feeder regions in 2022: Northern North America: 1,267 migrants; Europe: 424 migrants; Asia: 247 migrantsCitizenship and nativity demographics of county: 87.9% native-born; 7.8% foreign-born naturalized citizen; 4.3% foreign-born non-citizen2023 annual unemployment rate: 3.0% (0.1 ppt. higher than statewide rate)Median home value: $338,500 ($46,300 higher than statewide median)Median household income: $77,213 ($9,296 higher than statewide median)Total population: 436,621
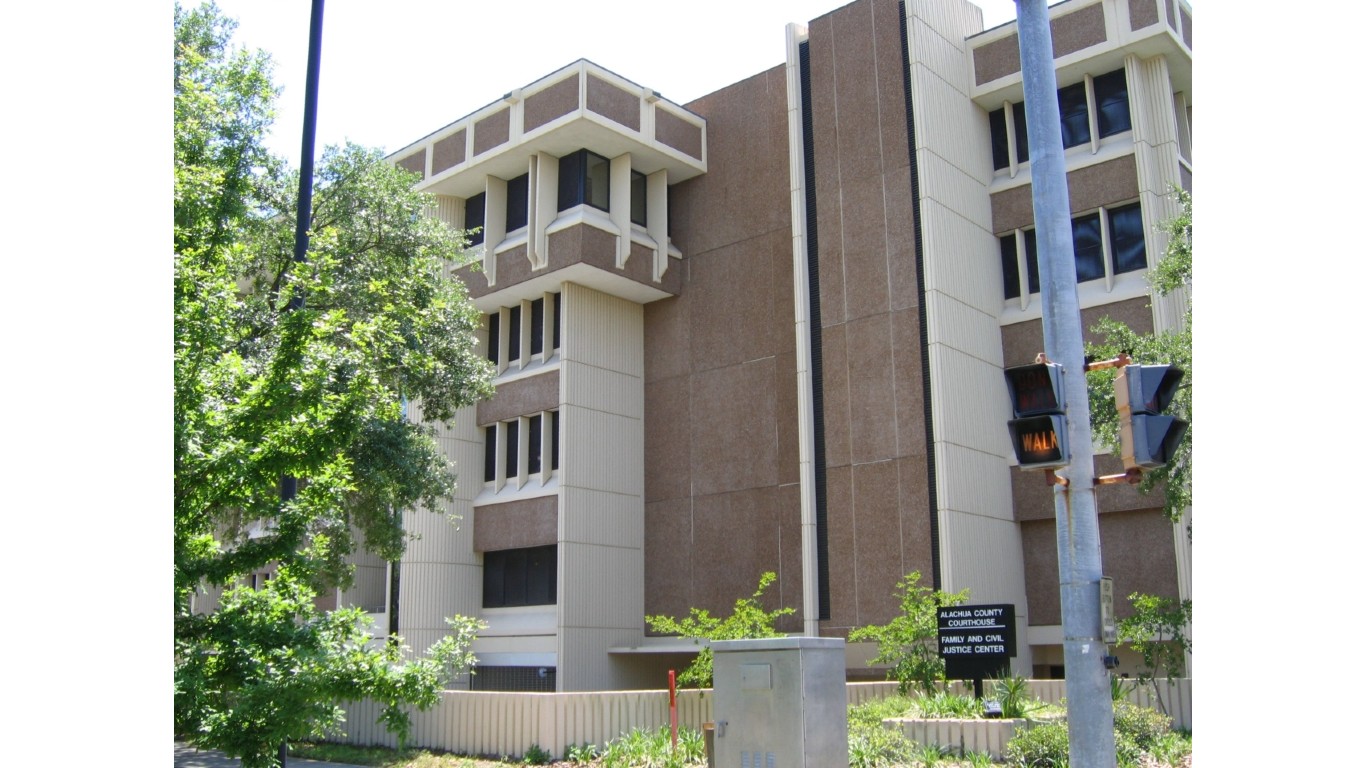
DouglasGreen / Wikimedia Commons
New residents who moved from abroad in 2022: 2,509 (0.9% of current population)Top feeder regions in 2022: Asia: 1,252 migrants; South America: 514 migrants; Europe: 352 migrantsCitizenship and nativity demographics of county: 89.1% native-born; 5.8% foreign-born naturalized citizen; 5.1% foreign-born non-citizen2023 annual unemployment rate: 3.1% (0.2 ppt. higher than statewide rate)Median home value: $245,600 ($46,600 lower than statewide median)Median household income: $57,566 ($10,351 lower than statewide median)Total population: 277,557
Ken Badgley / iStock via Getty Images
New residents who moved from abroad in 2022: 2,563 (0.5% of current population)Top feeder regions in 2022: Puerto Rico: 648 migrants; South America: 575 migrants; Europe: 297 migrantsCitizenship and nativity demographics of county: 91.6% native-born; 5.4% foreign-born naturalized citizen; 3.0% foreign-born non-citizen2023 annual unemployment rate: 3.3% (0.4 ppt. higher than statewide rate)Median home value: $251,400 ($40,800 lower than statewide median)Median household income: $63,075 ($4,842 lower than statewide median)Total population: 554,623
Thomas De Wever / iStock via Getty Images
New residents who moved from abroad in 2022: 2,947 (0.7% of current population)Top feeder regions in 2022: Northern North America: 692 migrants; Asia: 598 migrants; Central America: 461 migrantsCitizenship and nativity demographics of county: 87.1% native-born; 6.6% foreign-born naturalized citizen; 6.3% foreign-born non-citizen2023 annual unemployment rate: 3.0% (0.1 ppt. higher than statewide rate)Median home value: $323,900 ($31,700 higher than statewide median)Median household income: $71,385 ($3,468 higher than statewide median)Total population: 402,107
benedek / iStock via Getty Images
New residents who moved from abroad in 2022: 3,068 (0.5% of current population)Top feeder regions in 2022: Northern North America: 966 migrants; South America: 405 migrants; Puerto Rico: 399 migrantsCitizenship and nativity demographics of county: 88.8% native-born; 7.1% foreign-born naturalized citizen; 4.1% foreign-born non-citizen2023 annual unemployment rate: 3.3% (0.4 ppt. higher than statewide rate)Median home value: $233,600 ($58,600 lower than statewide median)Median household income: $63,187 ($4,730 lower than statewide median)Total population: 564,423
halbergman / iStock via Getty Images
New residents who moved from abroad in 2022: 3,857 (0.8% of current population)Top feeder regions in 2022: Asia: 986 migrants; Puerto Rico: 932 migrants; South America: 668 migrantsCitizenship and nativity demographics of county: 84.5% native-born; 9.6% foreign-born naturalized citizen; 6.0% foreign-born non-citizen2023 annual unemployment rate: 2.8% (0.1 ppt. lower than statewide rate)Median home value: $329,300 ($37,100 higher than statewide median)Median household income: $79,490 ($11,573 higher than statewide median)Total population: 467,576
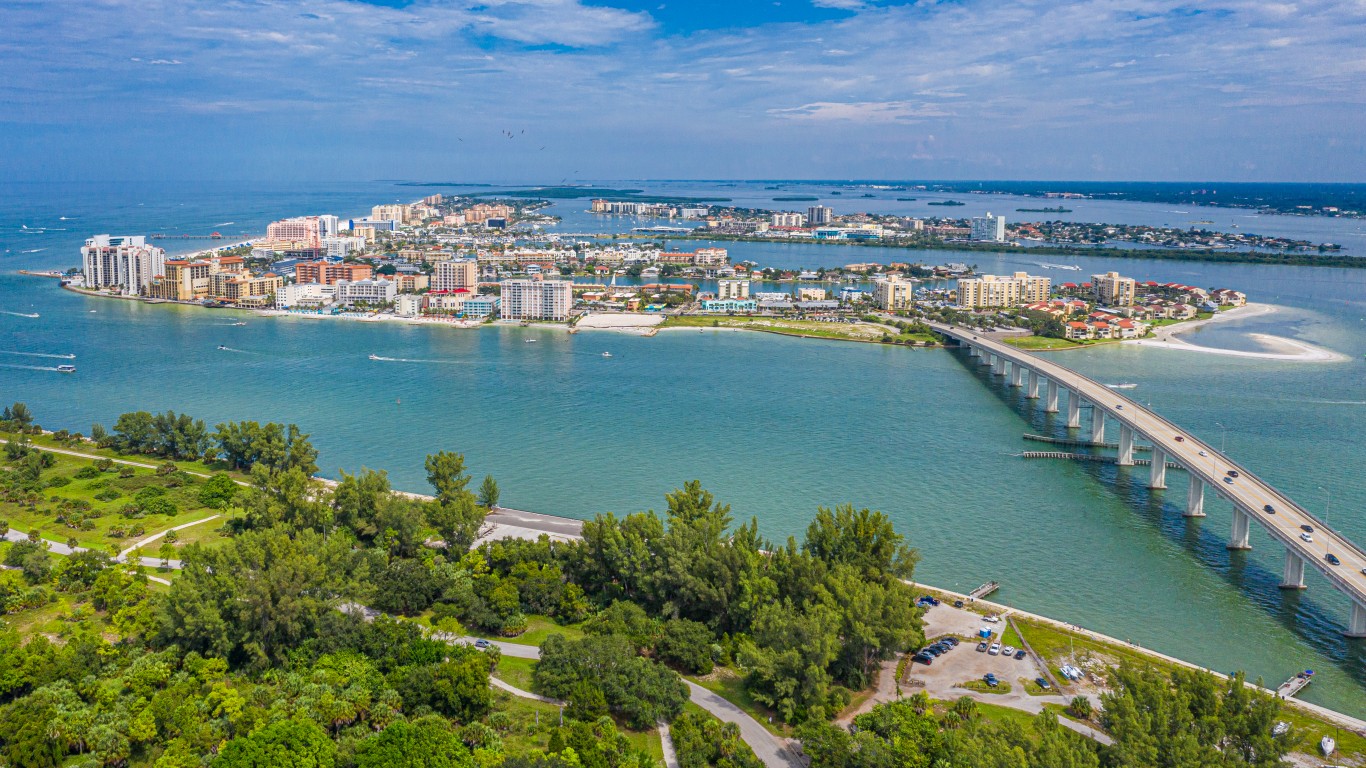
Sean Pavone / iStock via Getty Images
New residents who moved from abroad in 2022: 4,050 (1.1% of current population)Top feeder regions in 2022: Northern North America: 1,489 migrants; Europe: 752 migrants; Caribbean: 621 migrantsCitizenship and nativity demographics of county: 75.0% native-born; 12.8% foreign-born naturalized citizen; 12.2% foreign-born non-citizen2023 annual unemployment rate: 2.9 % (in line with statewide rate)Median home value: $443,700 ($151,500 higher than statewide median)Median household income: $82,011 ($14,094 higher than statewide median)Total population: 377,532
Stephen Wood / iStock via Getty Images
New residents who moved from abroad in 2022: 4,070 (0.7% of current population)Top feeder regions in 2022: Asia: 1,202 migrants; Puerto Rico: 791 migrants; Europe: 626 migrantsCitizenship and nativity demographics of county: 90.8% native-born; 6.3% foreign-born naturalized citizen; 2.9% foreign-born non-citizen2023 annual unemployment rate: 3.0% (0.1 ppt. higher than statewide rate)Median home value: $278,000 ($14,200 lower than statewide median)Median household income: $71,308 ($3,391 higher than statewide median)Total population: 605,149
JillianCain / iStock via Getty Images
New residents who moved from abroad in 2022: 4,950 (0.5% of current population)Top feeder regions in 2022: Asia: 1,348 migrants; Europe: 1,057 migrants; South America: 807 migrantsCitizenship and nativity demographics of county: 88.1% native-born; 6.8% foreign-born naturalized citizen; 5.1% foreign-born non-citizen2023 annual unemployment rate: 3.1% (0.2 ppt. higher than statewide rate)Median home value: $251,300 ($40,900 lower than statewide median)Median household income: $65,579 ($2,338 lower than statewide median)Total population: 982,827
Sean Pavone / iStock via Getty Images
New residents who moved from abroad in 2022: 5,352 (0.7% of current population)Top feeder regions in 2022: Puerto Rico: 1,847 migrants; South America: 1,048 migrants; Europe: 762 migrantsCitizenship and nativity demographics of county: 89.0% native-born; 5.2% foreign-born naturalized citizen; 5.7% foreign-born non-citizen2023 annual unemployment rate: 3.7% (0.8 ppt. higher than statewide rate)Median home value: $215,700 ($76,500 lower than statewide median)Median household income: $60,901 ($7,016 lower than statewide median)Total population: 728,194
Michael Warren / iStock via Getty Images
New residents who moved from abroad in 2022: 5,964 (0.6% of current population)Top feeder regions in 2022: Northern North America: 1,683 migrants; Europe: 1,379 migrants; South America: 629 migrantsCitizenship and nativity demographics of county: 88.0% native-born; 7.7% foreign-born naturalized citizen; 4.3% foreign-born non-citizen2023 annual unemployment rate: 2.8% (0.1 ppt. lower than statewide rate)Median home value: $284,300 ($7,900 lower than statewide median)Median household income: $66,406 ($1,511 lower than statewide median)Total population: 952,189
VisionsbyAtlee / iStock via Getty Images
New residents who moved from abroad in 2022: 6,176 (1.6% of current population)Top feeder regions in 2022: Puerto Rico: 2,095 migrants; South America: 1,982 migrants; Central America: 665 migrantsCitizenship and nativity demographics of county: 76.0% native-born; 12.1% foreign-born naturalized citizen; 11.9% foreign-born non-citizen2023 annual unemployment rate: 3.4% (0.5 ppt. higher than statewide rate)Median home value: $285,200 ($7,000 lower than statewide median)Median household income: $64,312 ($3,605 lower than statewide median)Total population: 389,730
fotoguy22 / iStock via Getty Images
New residents who moved from abroad in 2022: 6,378 (0.8% of current population)Top feeder regions in 2022: Northern North America: 1,433 migrants; Caribbean: 1,237 migrants; Europe: 993 migrantsCitizenship and nativity demographics of county: 82.3% native-born; 9.4% foreign-born naturalized citizen; 8.3% foreign-born non-citizen2023 annual unemployment rate: 3.2% (0.3 ppt. higher than statewide rate)Median home value: $290,900 ($1,300 lower than statewide median)Median household income: $69,368 ($1,451 higher than statewide median)Total population: 765,935
Orietta Gaspari / iStock via Getty Images
New residents who moved from abroad in 2022: 14,660 (1.0% of current population)Top feeder regions in 2022: South America: 3,433 migrants; Caribbean: 2,921 migrants; Central America: 2,212 migrantsCitizenship and nativity demographics of county: 73.0% native-born; 15.3% foreign-born naturalized citizen; 11.7% foreign-born non-citizen2023 annual unemployment rate: 3.0% (0.1 ppt. higher than statewide rate)Median home value: $368,300 ($76,100 higher than statewide median)Median household income: $76,066 ($8,149 higher than statewide median)Total population: 1,480,970
halbergman / iStock via Getty Images
New residents who moved from abroad in 2022: 17,066 (1.2% of current population)Top feeder regions in 2022: Asia: 4,572 migrants; Caribbean: 3,010 migrants; Central America: 2,573 migrantsCitizenship and nativity demographics of county: 81.1% native-born; 10.1% foreign-born naturalized citizen; 8.9% foreign-born non-citizen2023 annual unemployment rate: 2.9 % (in line with statewide rate)Median home value: $294,900 ($2,700 higher than statewide median)Median household income: $70,612 ($2,695 higher than statewide median)Total population: 1,453,110
Sean Pavone / iStock via Getty Images
New residents who moved from abroad in 2022: 22,289 (1.2% of current population)Top feeder regions in 2022: South America: 8,172 migrants; Caribbean: 4,123 migrants; Northern North America: 3,181 migrantsCitizenship and nativity demographics of county: 64.2% native-born; 22.2% foreign-born naturalized citizen; 13.5% foreign-born non-citizen2023 annual unemployment rate: 2.9 % (in line with statewide rate)Median home value: $348,600 ($56,400 higher than statewide median)Median household income: $70,331 ($2,414 higher than statewide median)Total population: 1,921,194
John Coletti / The Image Bank via Getty Images
New residents who moved from abroad in 2022: 24,013 (1.7% of current population)Top feeder regions in 2022: South America: 8,229 migrants; Puerto Rico: 6,299 migrants; Caribbean: 3,181 migrantsCitizenship and nativity demographics of county: 77.2% native-born; 11.6% foreign-born naturalized citizen; 11.2% foreign-born non-citizen2023 annual unemployment rate: 2.8% (0.1 ppt. lower than statewide rate)Median home value: $329,000 ($36,800 higher than statewide median)Median household income: $72,629 ($4,712 higher than statewide median)Total population: 1,414,458
simonkr / E+ via Getty Images
New residents who moved from abroad in 2022: 41,883 (1.6% of current population)Top feeder regions in 2022: South America: 14,779 migrants; Caribbean: 11,679 migrants; Central America: 6,250 migrantsCitizenship and nativity demographics of county: 45.4% native-born; 33.2% foreign-born naturalized citizen; 21.4% foreign-born non-citizen2023 annual unemployment rate: 1.8% (1.1 ppt. lower than statewide rate)Median home value: $387,000 ($94,800 higher than statewide median)Median household income: $64,215 ($3,702 lower than statewide median)Total population: 2,661,108
Are You Ahead, or Behind on Retirement? (sponsor) If you’re one of the over 4 Million Americans set to retire this year, you may want to pay attention.
Finding a financial advisor who puts your interest first can be the difference between a rich retirement and barely getting by, and today it’s easier than ever. SmartAsset’s free tool matches you with up to three fiduciary financial advisors that serve your area in minutes. Each advisor has been carefully vetted, and must act in your best interests. Start your search now.
Don’t waste another minute; get started right here and help your retirement dreams become a retirement reality.
Thank you for reading! Have some feedback for us?Contact the 24/7 Wall St. editorial team .
