American downtowns suffered during the global pandemic when many employees worked from home and downtown buildings were left empty. But even before the pandemic, technological advances created work environments where employees didn’t necessarily need to be physically present in the office. Today we’re taking a closer look at the top American cities with shrinking downtowns. (On the other hand, some American cities are exploding with population growth.)
To determine the cities with shrinking downtowns, 24/7 Wall St. reviewed five-year data on population change from the U.S. Census Bureau’s 2022 American Community Survey. Cities were ranked based on the percentage change in population in downtown census tracts from 2012 to 2022. Downtown areas were defined as the census tracts that fall at least 50% within the 1.8-mile radius around a city hall. Non-downtown areas were defined as the census tracts that fall at least 50% within a city’s boundaries, yet less than 50% within the 1.8-mile radius around city hall. Boundary definitions are from the U.S. Census Bureau and are for 2022. Only principal cities of metropolitan statistical areas were considered. City hall coordinates, as well as supplemental data on income, are also from the Census Bureau.
Why This Matters
American downtowns and city centers have an overall impact on the health of the local economy. When downtowns are thriving; property values go up, jobs are plentiful, and tax revenues are generated. Furthermore, urban sprawl is reduced and people can rely on walking or public transportation to get to jobs, schools, parks, and restaurants.
Here are 40 American cities with shrinking downtowns:
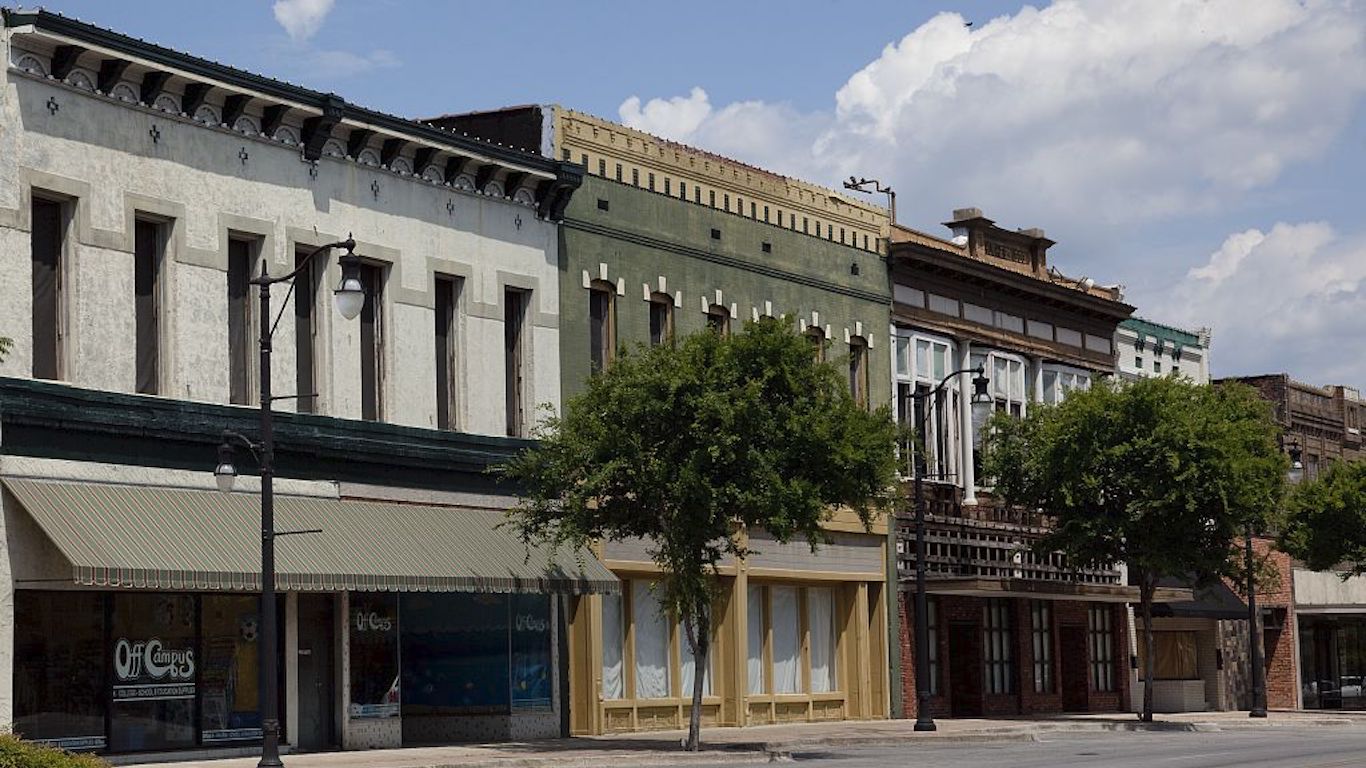
40. San Angelo, Texas
Population change in downtown tracts from 2012 to 2022: -10.3%
Population change of non-downtown tracts from 2012 to 2022: +8.7%
Per capita income change in downtown tracts from 2012 to 2022: +21.3%
Per capita income change in non-downtown tracts from 2012 to 2022: +15.5%
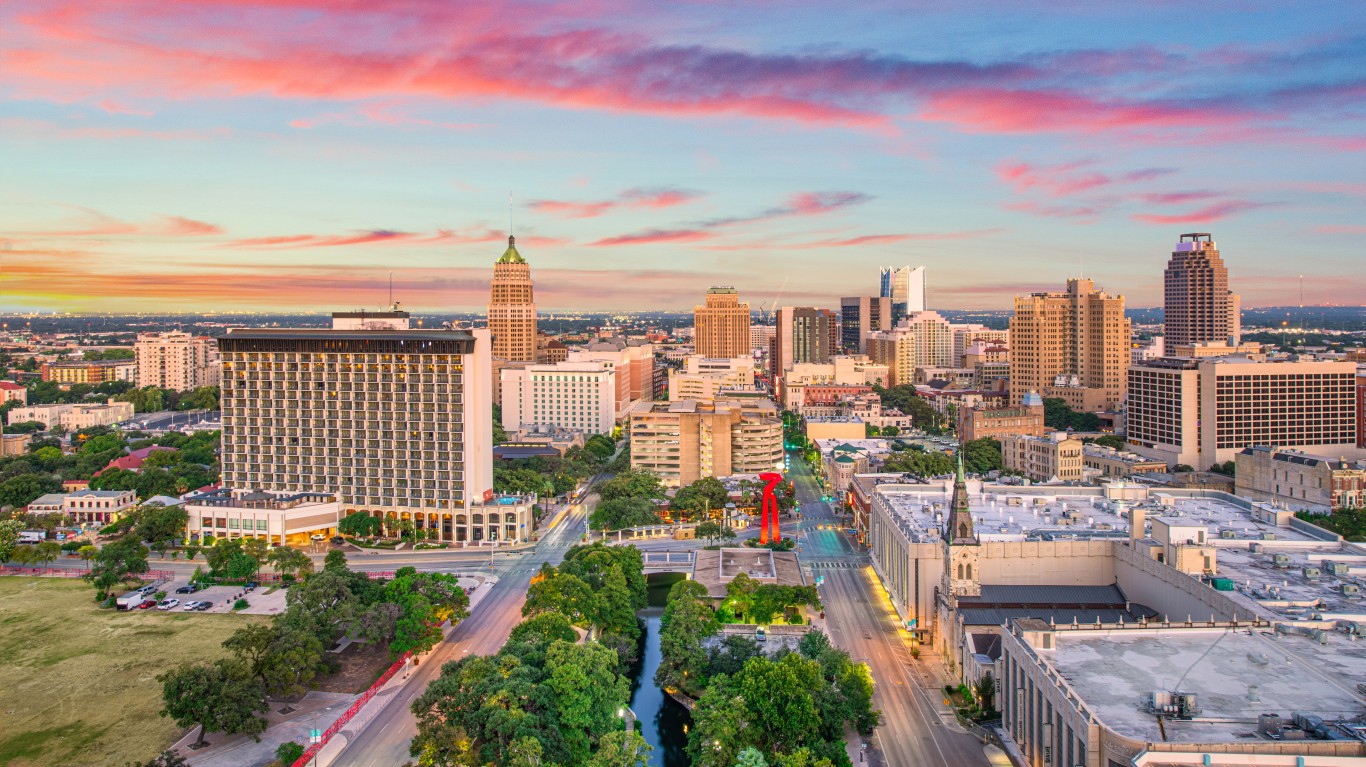
39. San Antonio, Texas
Population change in downtown tracts from 2012 to 2022: -10.6%
Population change of non-downtown tracts from 2012 to 2022: +7.5%
Per capita income change in downtown tracts from 2012 to 2022: +28.5%
Per capita income change in non-downtown tracts from 2012 to 2022: +8.0%
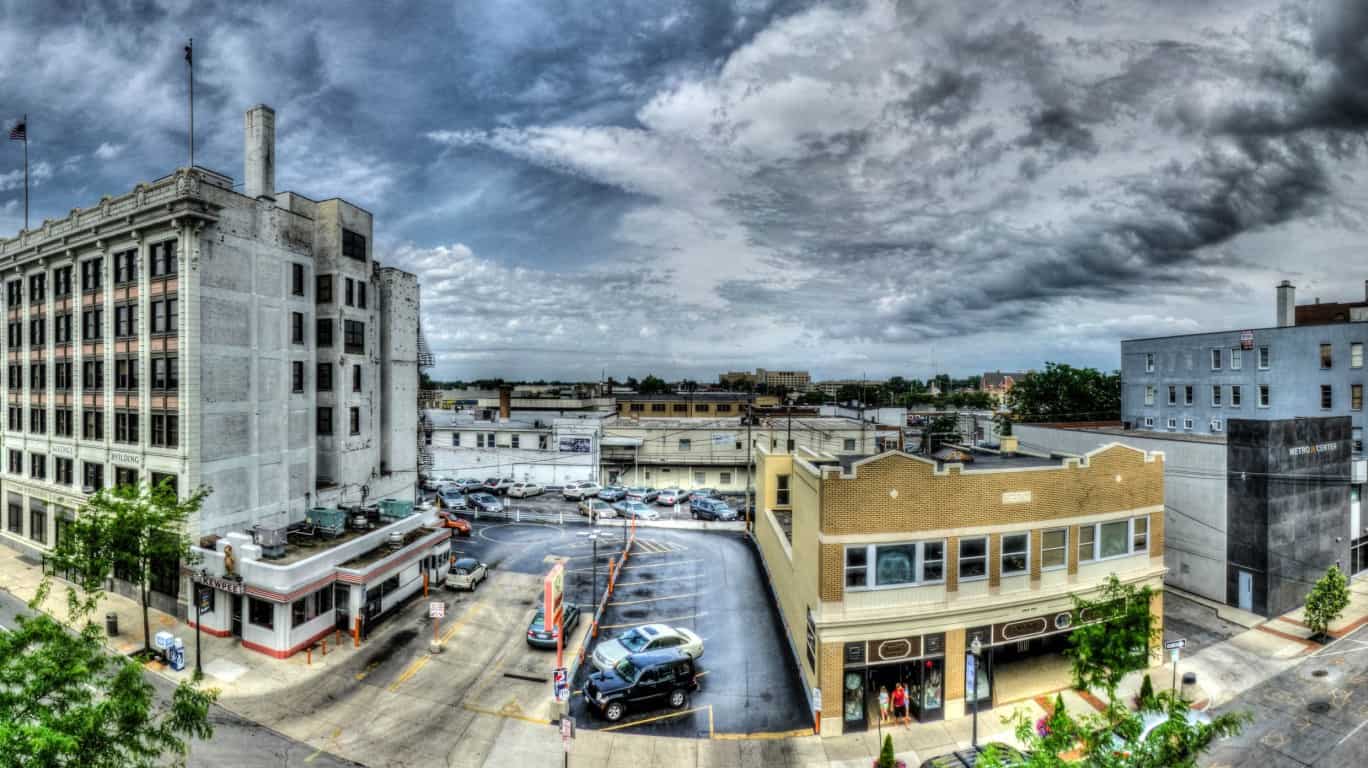
38. St. Joseph, Missouri
Population change in downtown tracts from 2012 to 2022: -10.9%
Population change of non-downtown tracts from 2012 to 2022: -1.7%
Per capita income change in downtown tracts from 2012 to 2022: +9.1%
Per capita income change in non-downtown tracts from 2012 to 2022: +11.5%
37. Springfield, Illinois
Population change in downtown tracts from 2012 to 2022: -10.9%
Population change of non-downtown tracts from 2012 to 2022: -2.0%
Per capita income change in downtown tracts from 2012 to 2022: +9.5%
Per capita income change in non-downtown tracts from 2012 to 2022: +8.2%
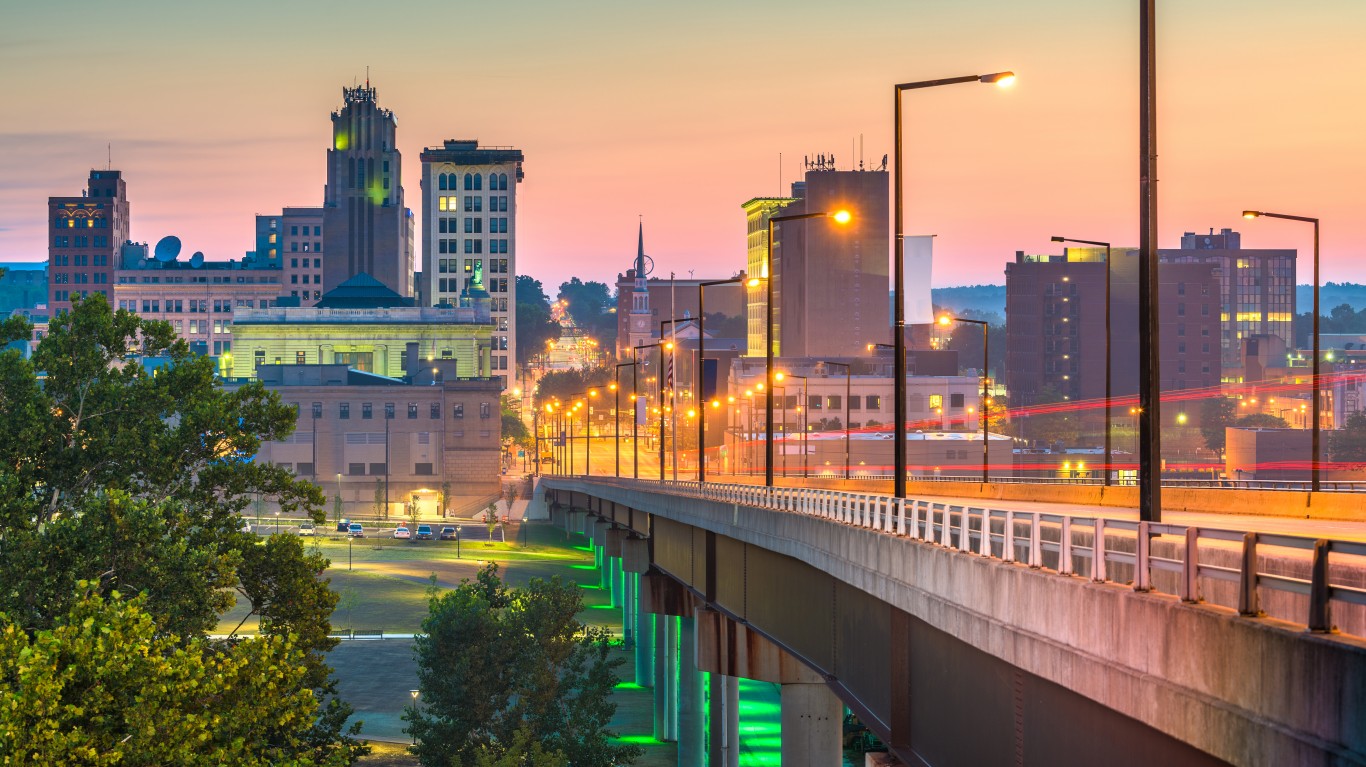
36. Youngstown, Ohio
Population change in downtown tracts from 2012 to 2022: -11.1%
Population change of non-downtown tracts from 2012 to 2022: -7.4%
Per capita income change in downtown tracts from 2012 to 2022: +21.5%
Per capita income change in non-downtown tracts from 2012 to 2022: +2.2%
35. Canton, Ohio
Population change in downtown tracts from 2012 to 2022: -11.3%
Population change of non-downtown tracts from 2012 to 2022: -2.8%
Per capita income change in downtown tracts from 2012 to 2022: +4.6%
Per capita income change in non-downtown tracts from 2012 to 2022: +11.1%
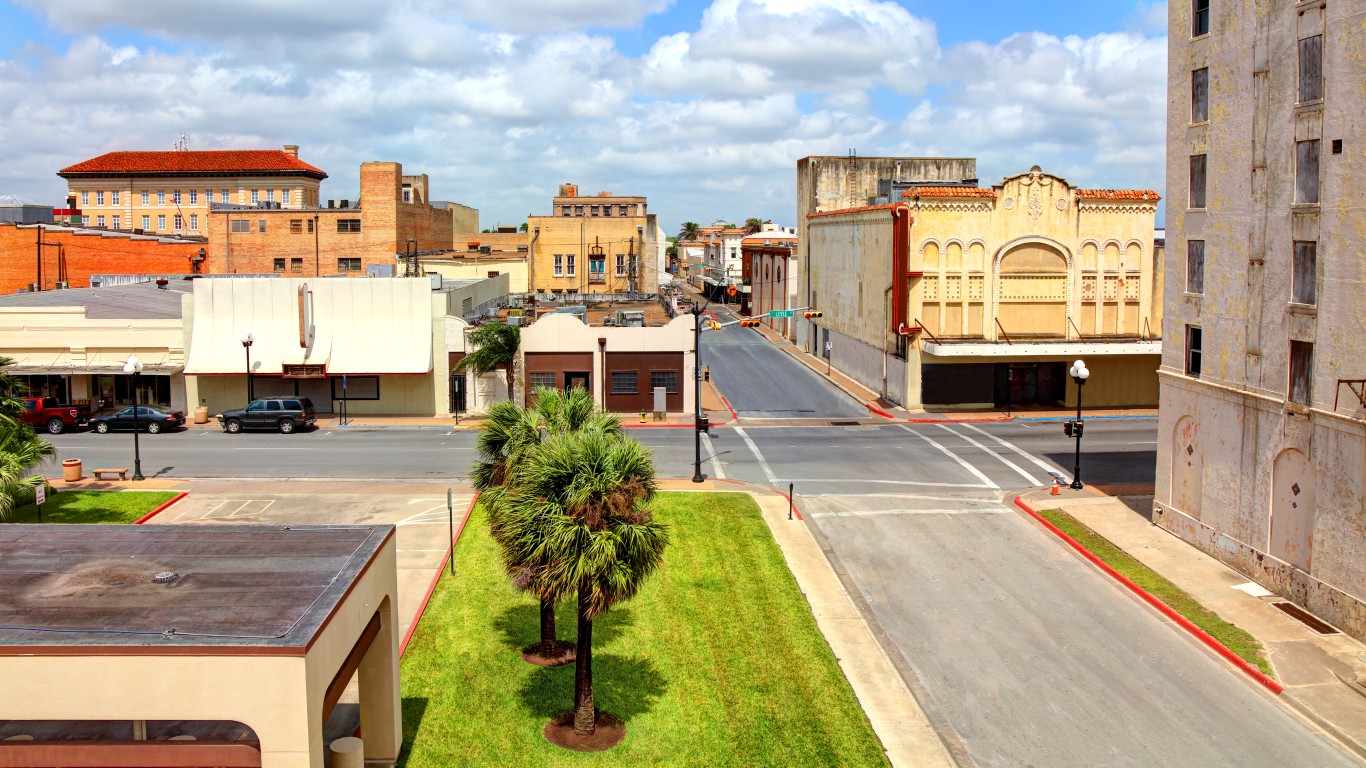
34. Brownsville, Texas
Population change in downtown tracts from 2012 to 2022: -11.5%
Population change of non-downtown tracts from 2012 to 2022: +0.6%
Per capita income change in downtown tracts from 2012 to 2022: +11.5%
Per capita income change in non-downtown tracts from 2012 to 2022: +9.8%
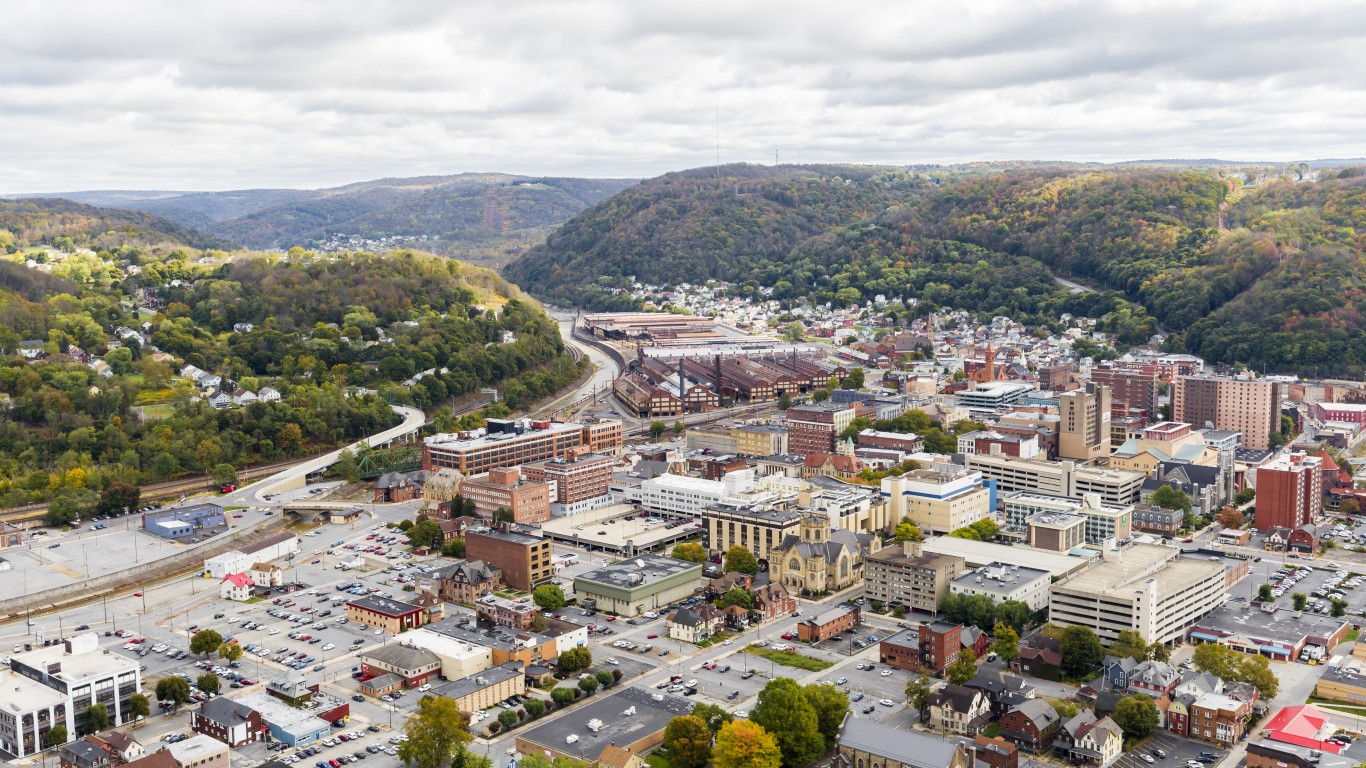
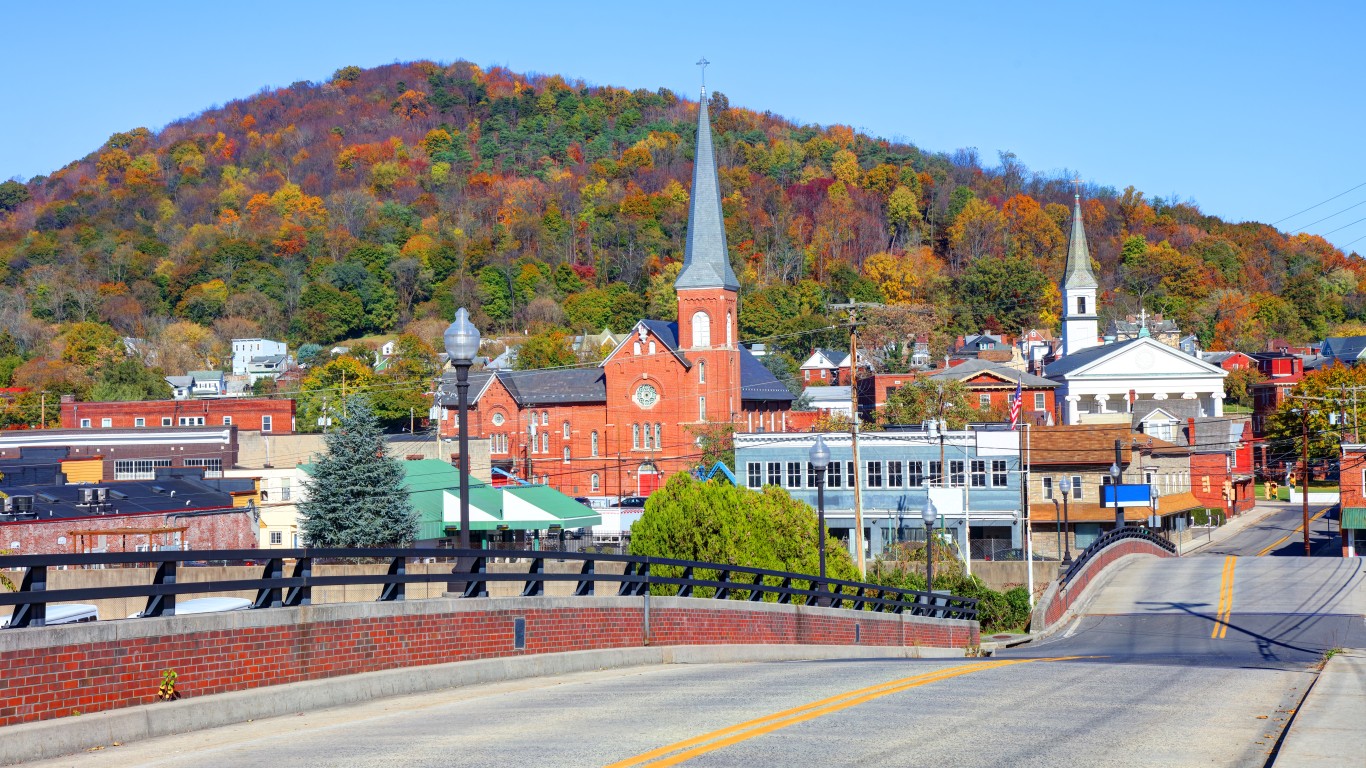
33. Johnstown, Pennsylvania
Population change in downtown tracts from 2012 to 2022: -11.6%
Population change of non-downtown tracts from 2012 to 2022: -12.4%
Per capita income change in downtown tracts from 2012 to 2022: +23.9%
Per capita income change in non-downtown tracts from 2012 to 2022: -1.5%
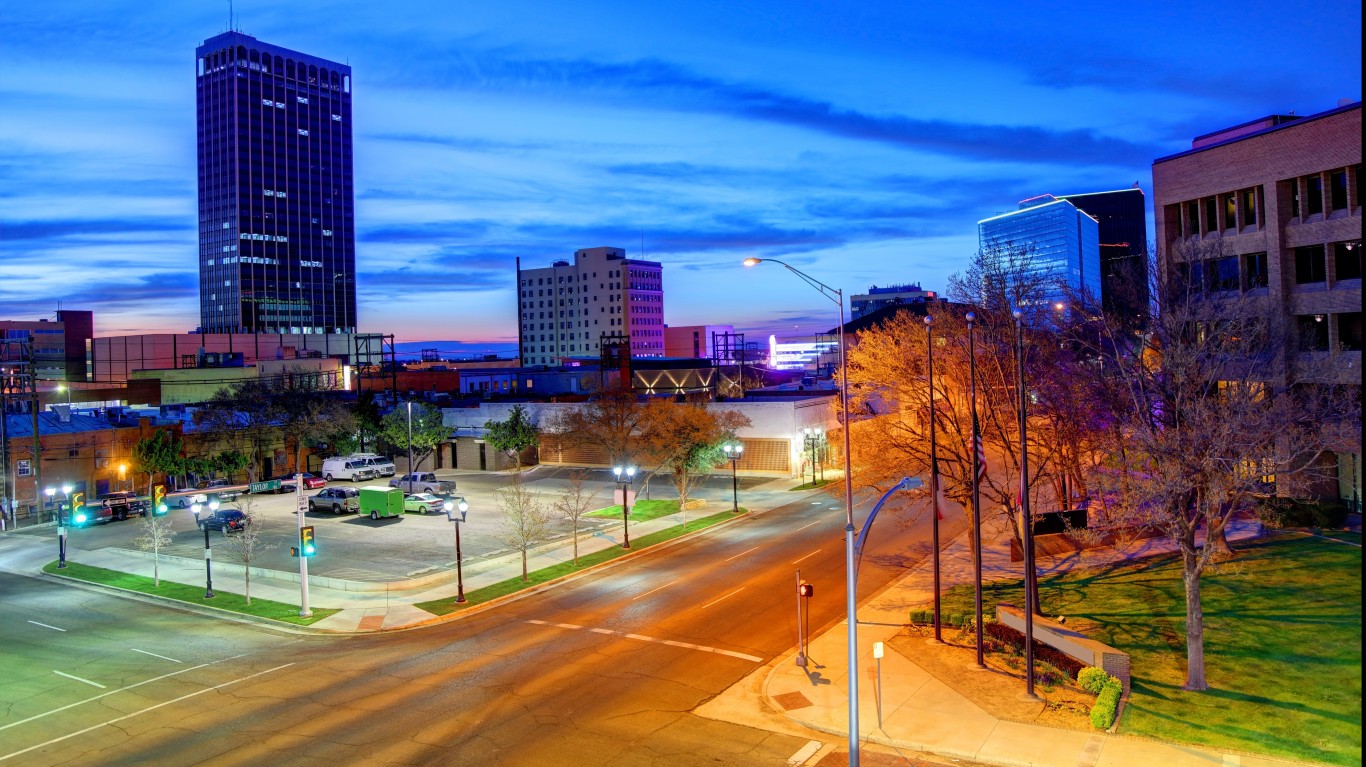
32. Amarillo, Texas
Population change in downtown tracts from 2012 to 2022: -11.6%
Population change of non-downtown tracts from 2012 to 2022: +1.8%
Per capita income change in downtown tracts from 2012 to 2022: +14.1%
Per capita income change in non-downtown tracts from 2012 to 2022: +6.2%
31. Hattiesburg, Mississippi
Population change in downtown tracts from 2012 to 2022: -11.7%
Population change of non-downtown tracts from 2012 to 2022: +9.2%
Per capita income change in downtown tracts from 2012 to 2022: +21.2%
Per capita income change in non-downtown tracts from 2012 to 2022: +0.8%
30. Valdosta, Georgia
Population change in downtown tracts from 2012 to 2022: -12.6%
Population change of non-downtown tracts from 2012 to 2022: +4.5%
Per capita income change in downtown tracts from 2012 to 2022: +26.0%
Per capita income change in non-downtown tracts from 2012 to 2022: +5.0%
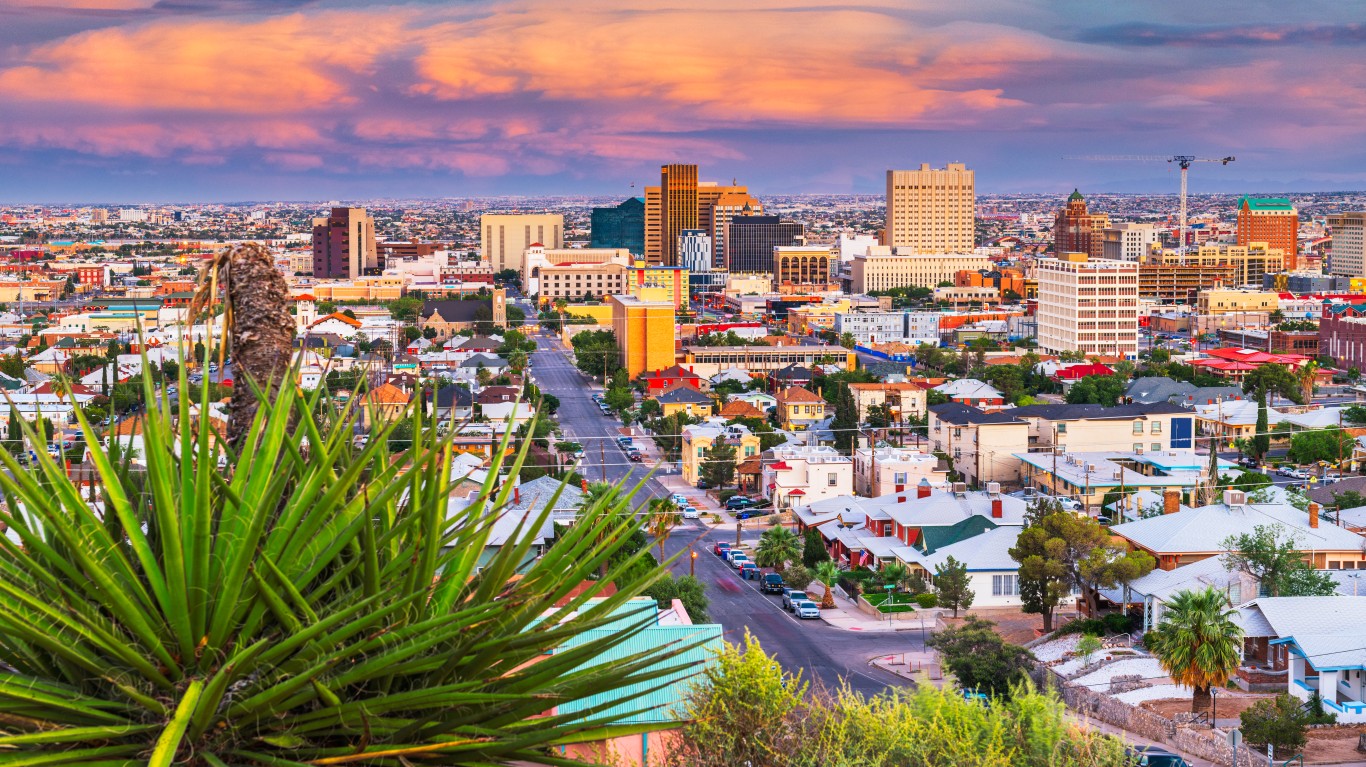
29. El Paso, Texas
Population change in downtown tracts from 2012 to 2022: -12.7%
Population change of non-downtown tracts from 2012 to 2022: -3.2%
Per capita income change in downtown tracts from 2012 to 2022: +17.9%
Per capita income change in non-downtown tracts from 2012 to 2022: +8.5%
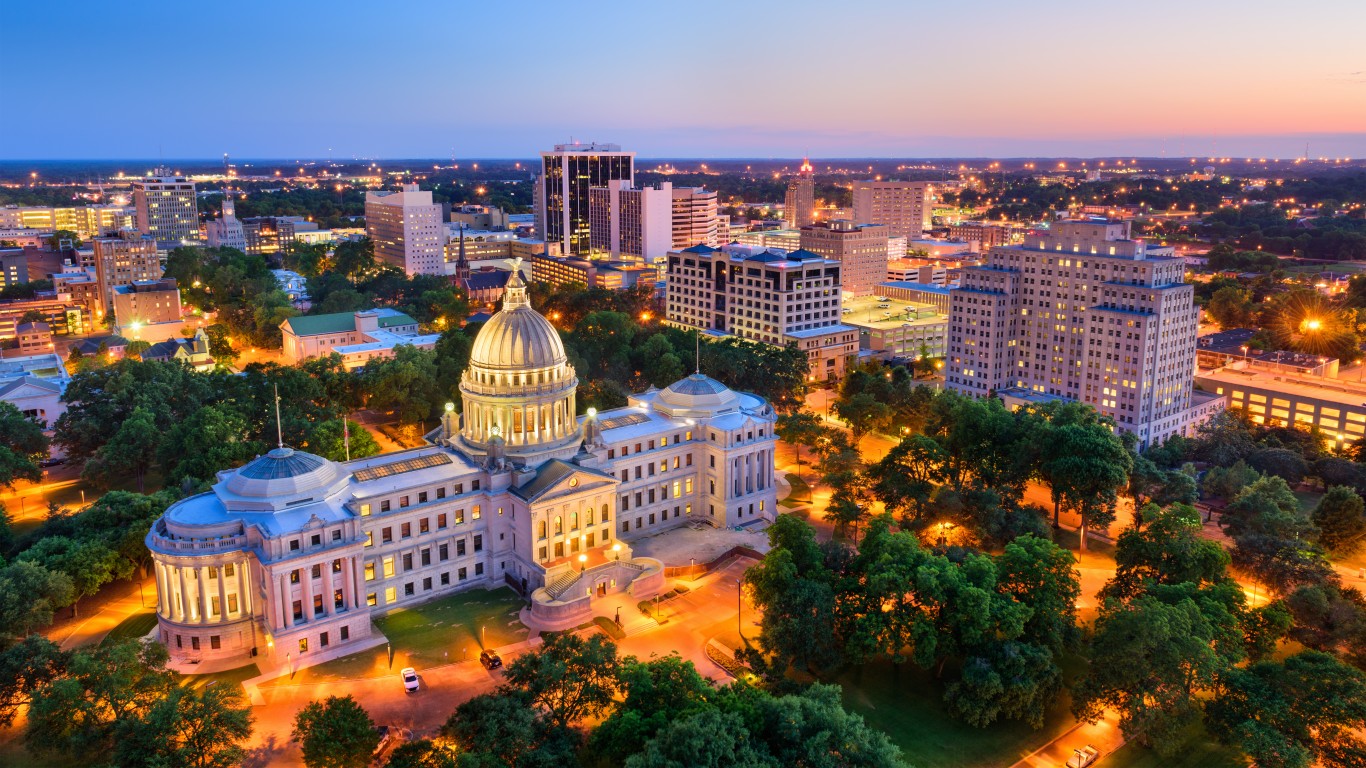
28. Jackson, Mississippi
Population change in downtown tracts from 2012 to 2022: -13.2%
Population change of non-downtown tracts from 2012 to 2022: -12.6%
Per capita income change in downtown tracts from 2012 to 2022: +33.1%
Per capita income change in non-downtown tracts from 2012 to 2022: +5.4%
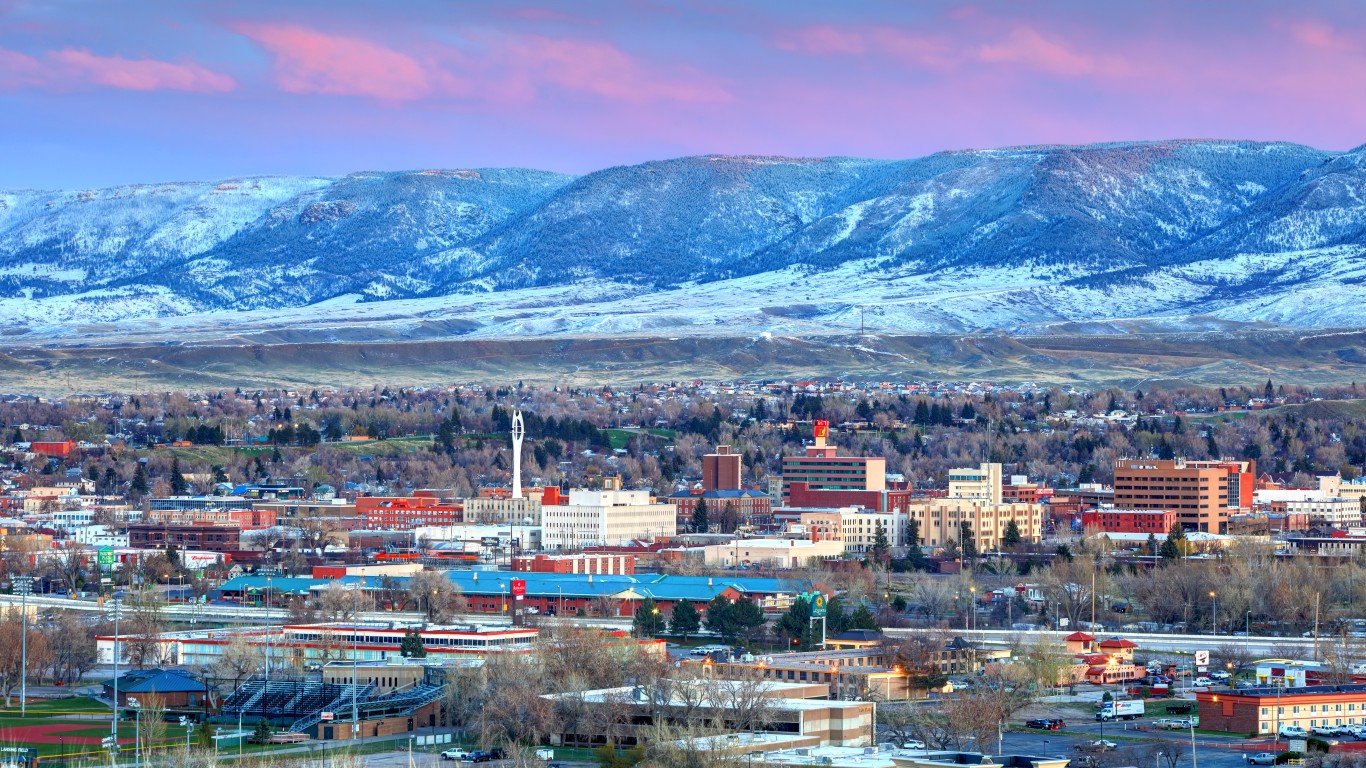
27. Casper, Wyoming
Population change in downtown tracts from 2012 to 2022: -13.2%
Population change of non-downtown tracts from 2012 to 2022: +1.5%
Per capita income change in downtown tracts from 2012 to 2022: +11.6%
Per capita income change in non-downtown tracts from 2012 to 2022: -3.6%
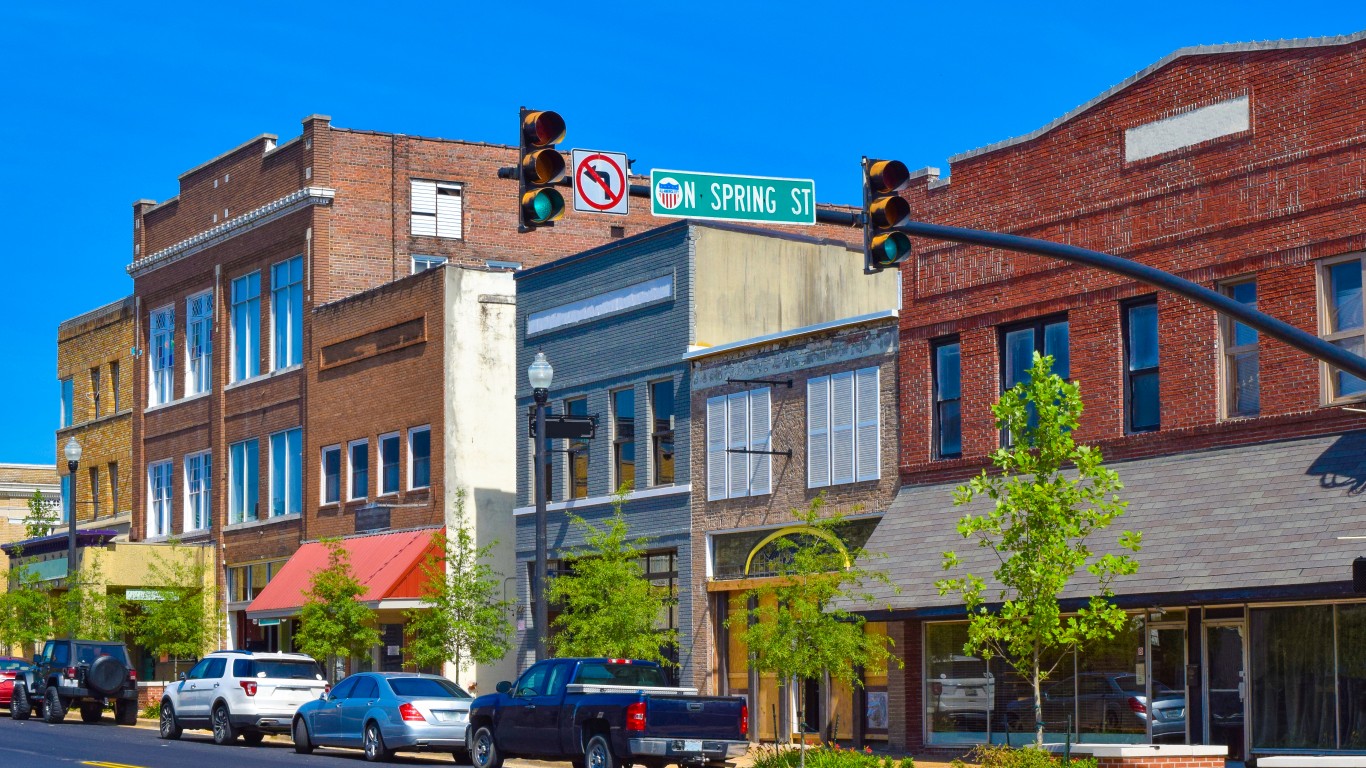
26. Gadsden, Alabama
Population change in downtown tracts from 2012 to 2022: -13.3%
Population change of non-downtown tracts from 2012 to 2022: -6.4%
Per capita income change in downtown tracts from 2012 to 2022: +5.2%
Per capita income change in non-downtown tracts from 2012 to 2022: +7.4%
25. Abilene, Texas
Population change in downtown tracts from 2012 to 2022: -13.3%
Population change of non-downtown tracts from 2012 to 2022: +3.3%
Per capita income change in downtown tracts from 2012 to 2022: +4.8%
Per capita income change in non-downtown tracts from 2012 to 2022: +7.5%
24. Cumberland, Maryland
Population change in downtown tracts from 2012 to 2022: -13.4%
Population change of non-downtown tracts from 2012 to 2022: -7.4%
Per capita income change in downtown tracts from 2012 to 2022: +5.1%
Per capita income change in non-downtown tracts from 2012 to 2022: +14.8%
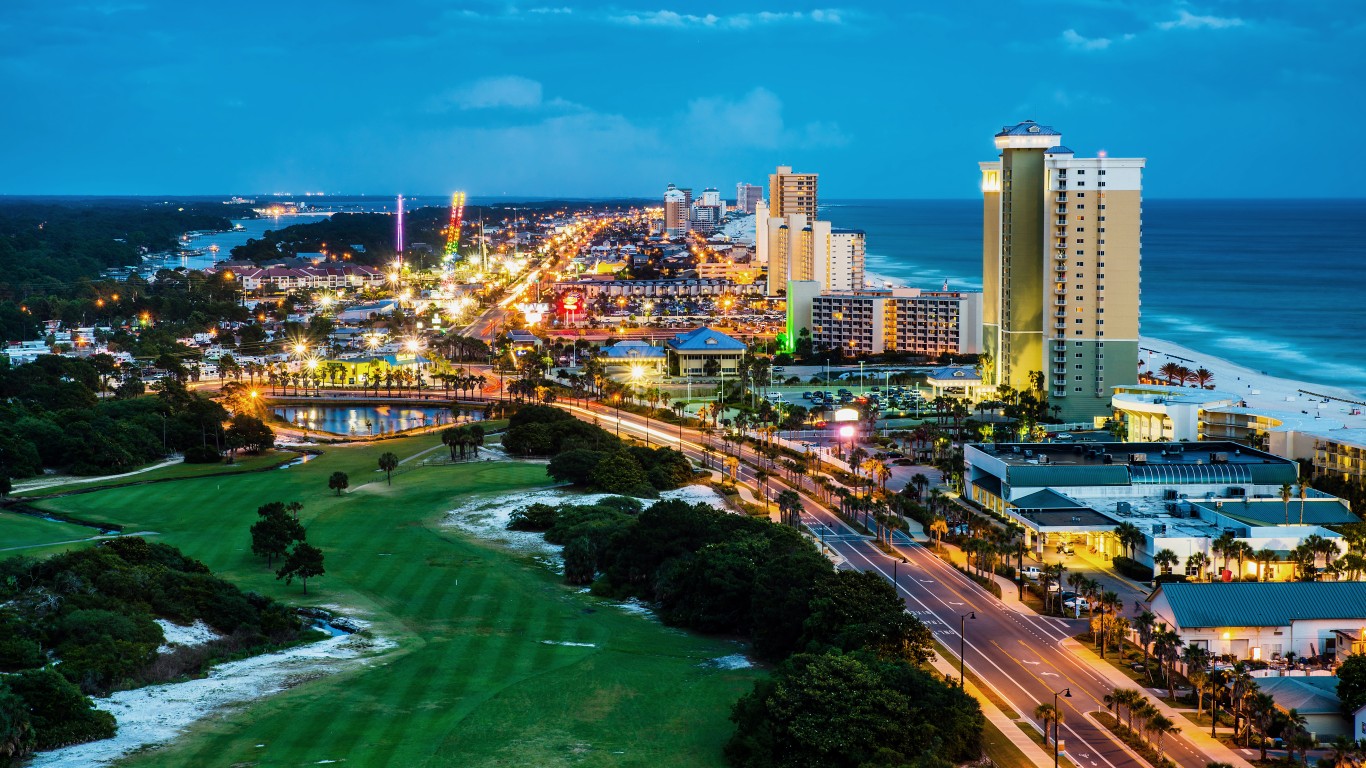
23. Panama City, Florida
Population change in downtown tracts from 2012 to 2022: -13.8%
Population change of non-downtown tracts from 2012 to 2022: -7.9%
Per capita income change in downtown tracts from 2012 to 2022: +20.6%
Per capita income change in non-downtown tracts from 2012 to 2022: +17.1%
22. Decatur, Illinois
Population change in downtown tracts from 2012 to 2022: -14.7%
Population change of non-downtown tracts from 2012 to 2022: -7.4%
Per capita income change in downtown tracts from 2012 to 2022: +9.4%
Per capita income change in non-downtown tracts from 2012 to 2022: +6.2%
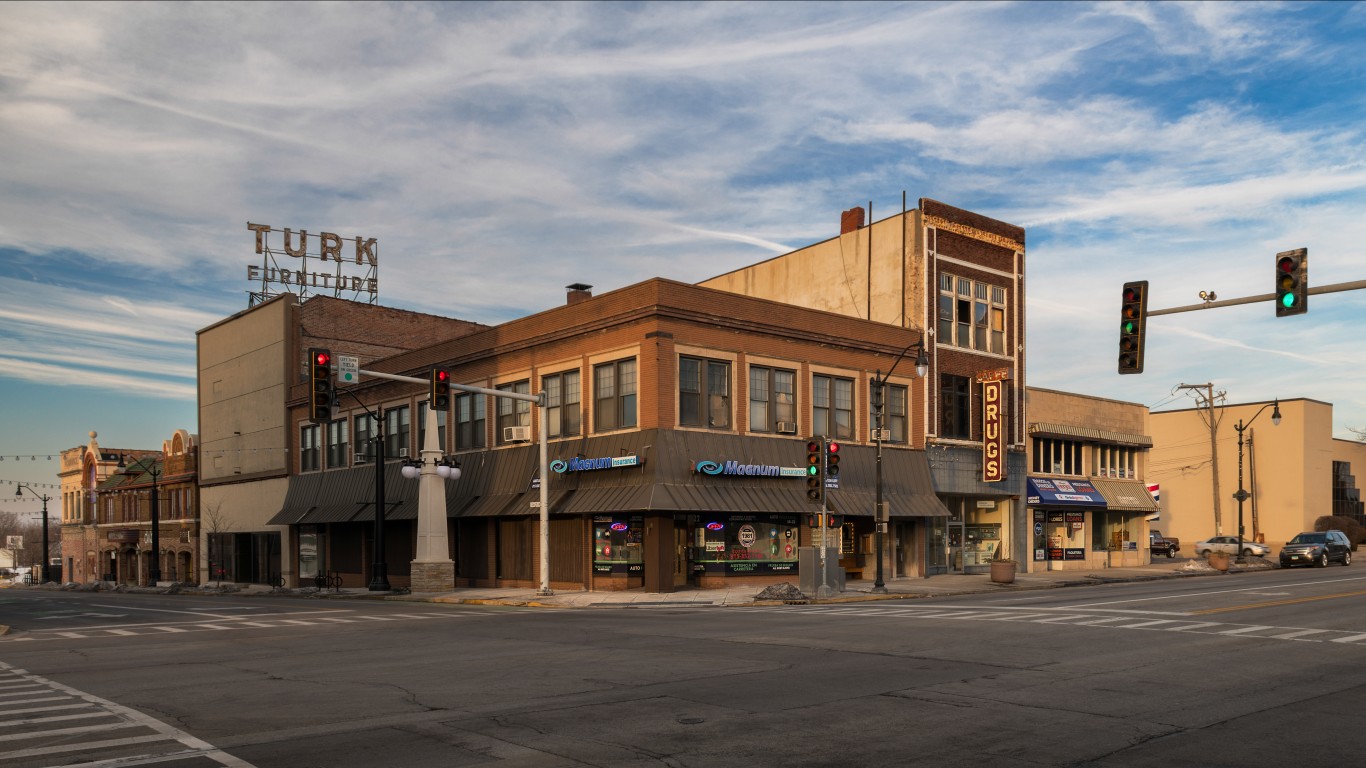
21. Kankakee, Illinois
Population change in downtown tracts from 2012 to 2022: -14.9%
Population change of non-downtown tracts from 2012 to 2022: +3.6%
Per capita income change in downtown tracts from 2012 to 2022: +19.4%
Per capita income change in non-downtown tracts from 2012 to 2022: +2.7%
20. Naples, Florida
Population change in downtown tracts from 2012 to 2022: -15.0%
Population change of non-downtown tracts from 2012 to 2022: +3.3%
Per capita income change in downtown tracts from 2012 to 2022: +31.1%
Per capita income change in non-downtown tracts from 2012 to 2022: +29.3%
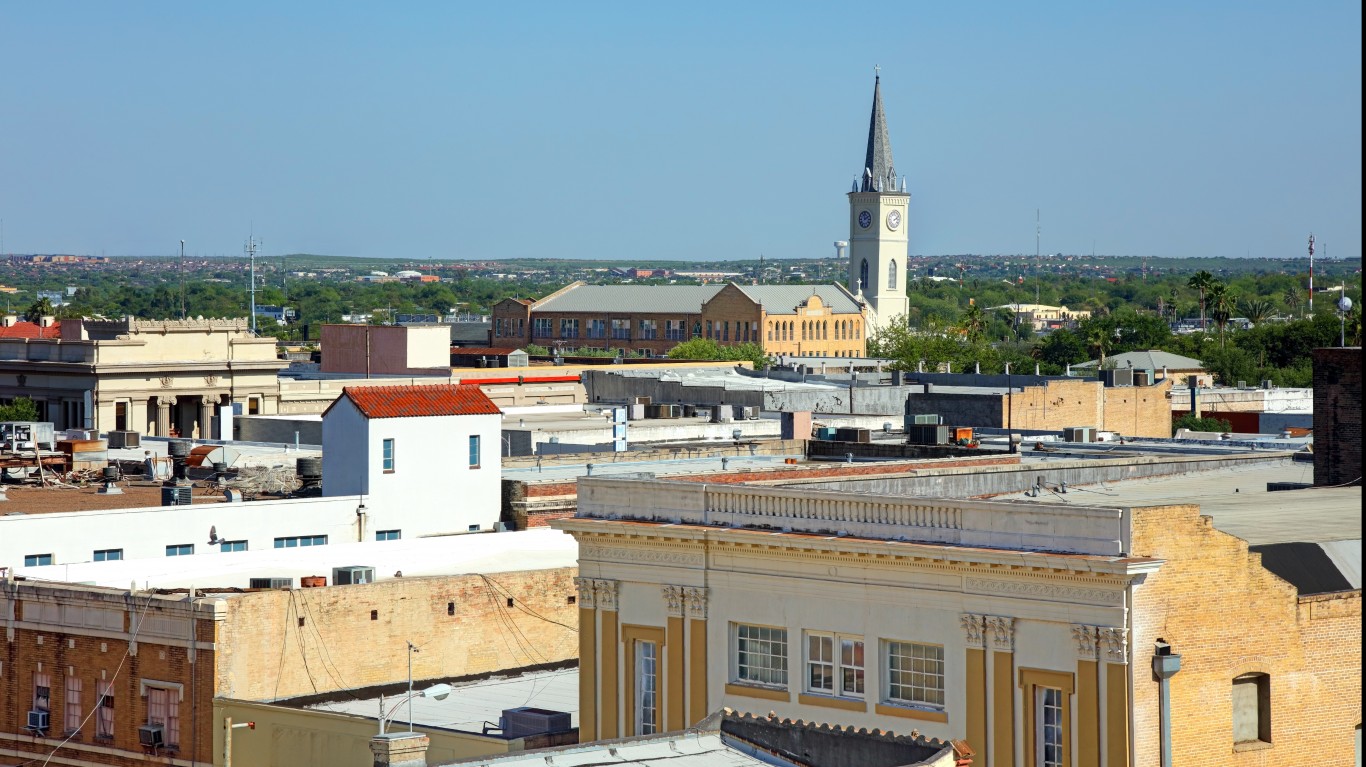
19. Laredo, Texas
Population change in downtown tracts from 2012 to 2022: -15.4%
Population change of non-downtown tracts from 2012 to 2022: +5.4%
Per capita income change in downtown tracts from 2012 to 2022: +27.8%
Per capita income change in non-downtown tracts from 2012 to 2022: +22.2%
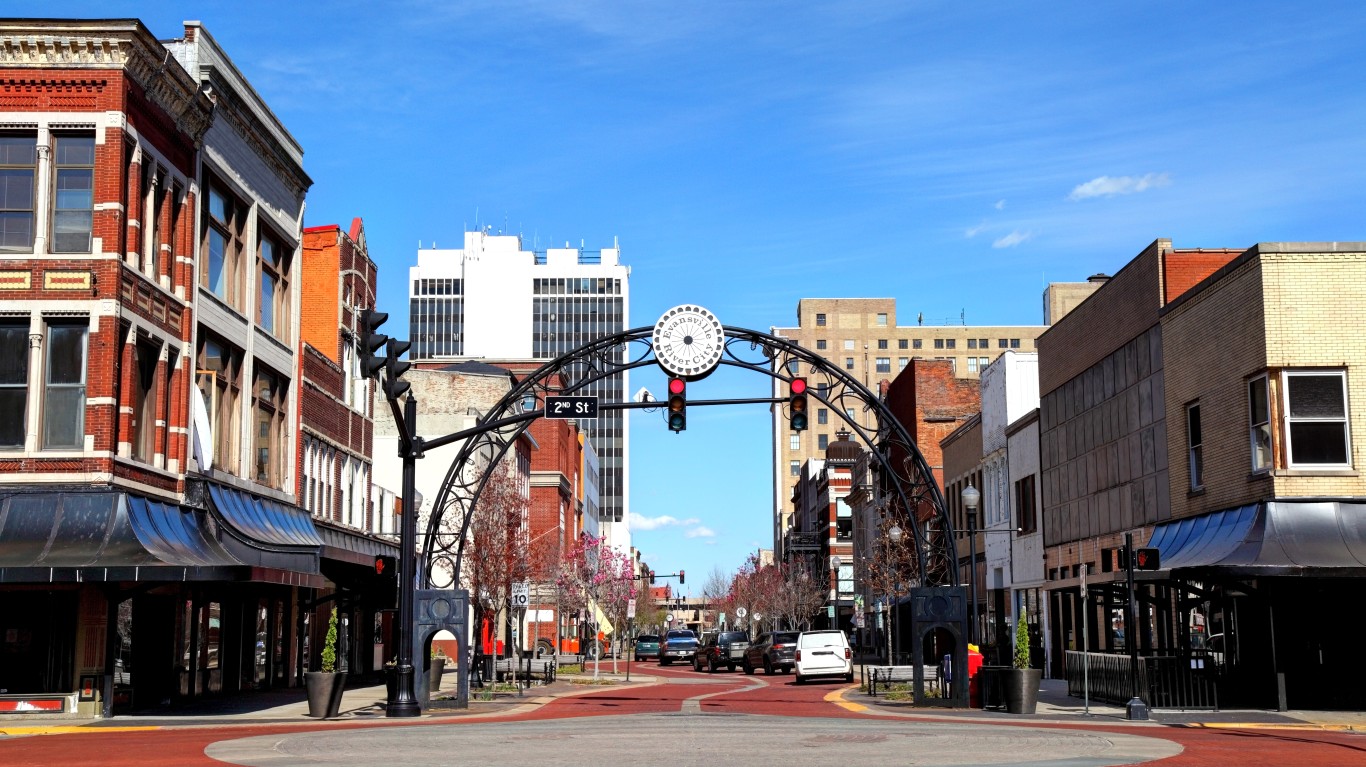
18. Evansville, Indiana
Population change in downtown tracts from 2012 to 2022: -15.6%
Population change of non-downtown tracts from 2012 to 2022: +0.2%
Per capita income change in downtown tracts from 2012 to 2022: +10.5%
Per capita income change in non-downtown tracts from 2012 to 2022: +8.6%
17. Lima, Ohio
Population change in downtown tracts from 2012 to 2022: -16.0%
Population change of non-downtown tracts from 2012 to 2022: +8.3%
Per capita income change in downtown tracts from 2012 to 2022: +17.7%
Per capita income change in non-downtown tracts from 2012 to 2022: -1.3%
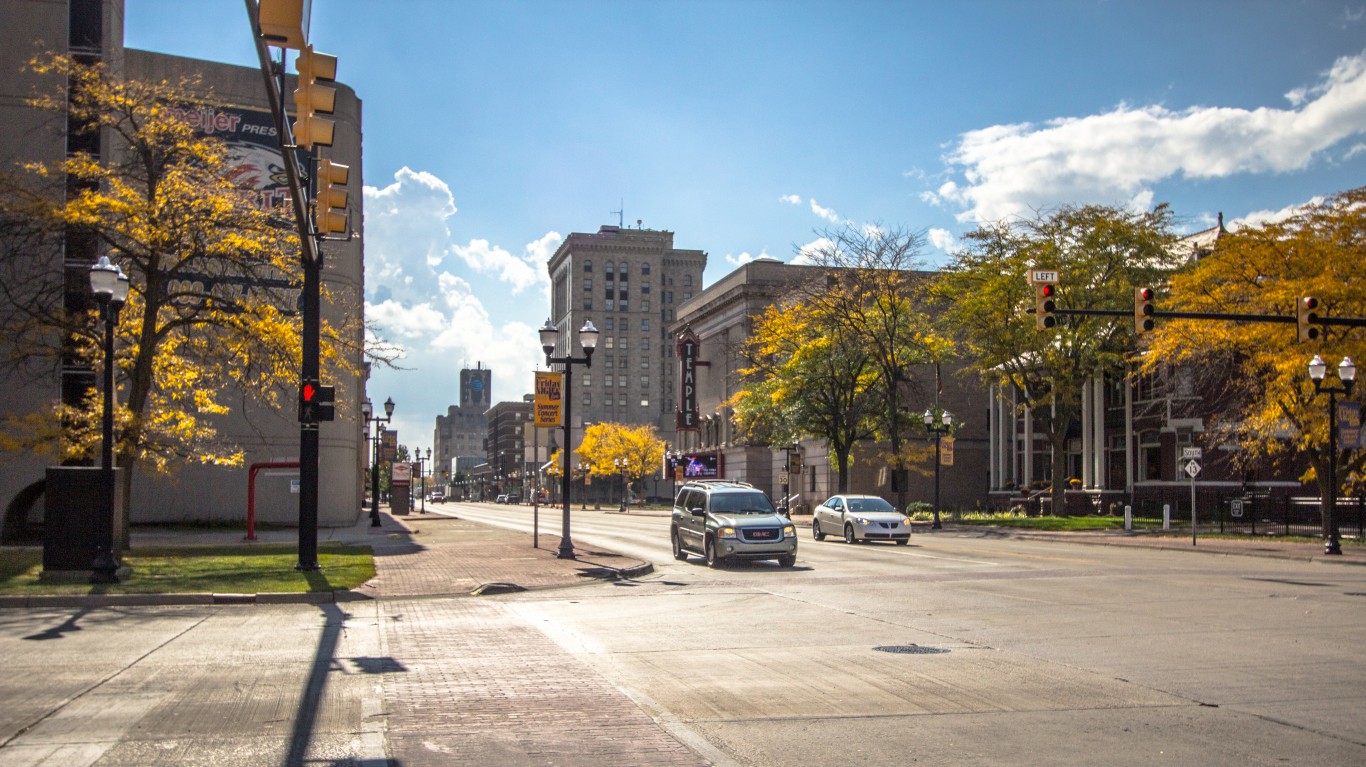
16. Flint, Michigan
Population change in downtown tracts from 2012 to 2022: -16.9%
Population change of non-downtown tracts from 2012 to 2022: -22.0%
Per capita income change in downtown tracts from 2012 to 2022: +19.1%
Per capita income change in non-downtown tracts from 2012 to 2022: +7.1%
15. Yuma, Arizona
Population change in downtown tracts from 2012 to 2022: -17.0%
Population change of non-downtown tracts from 2012 to 2022: -5.4%
Per capita income change in downtown tracts from 2012 to 2022: +23.6%
Per capita income change in non-downtown tracts from 2012 to 2022: +19.6%
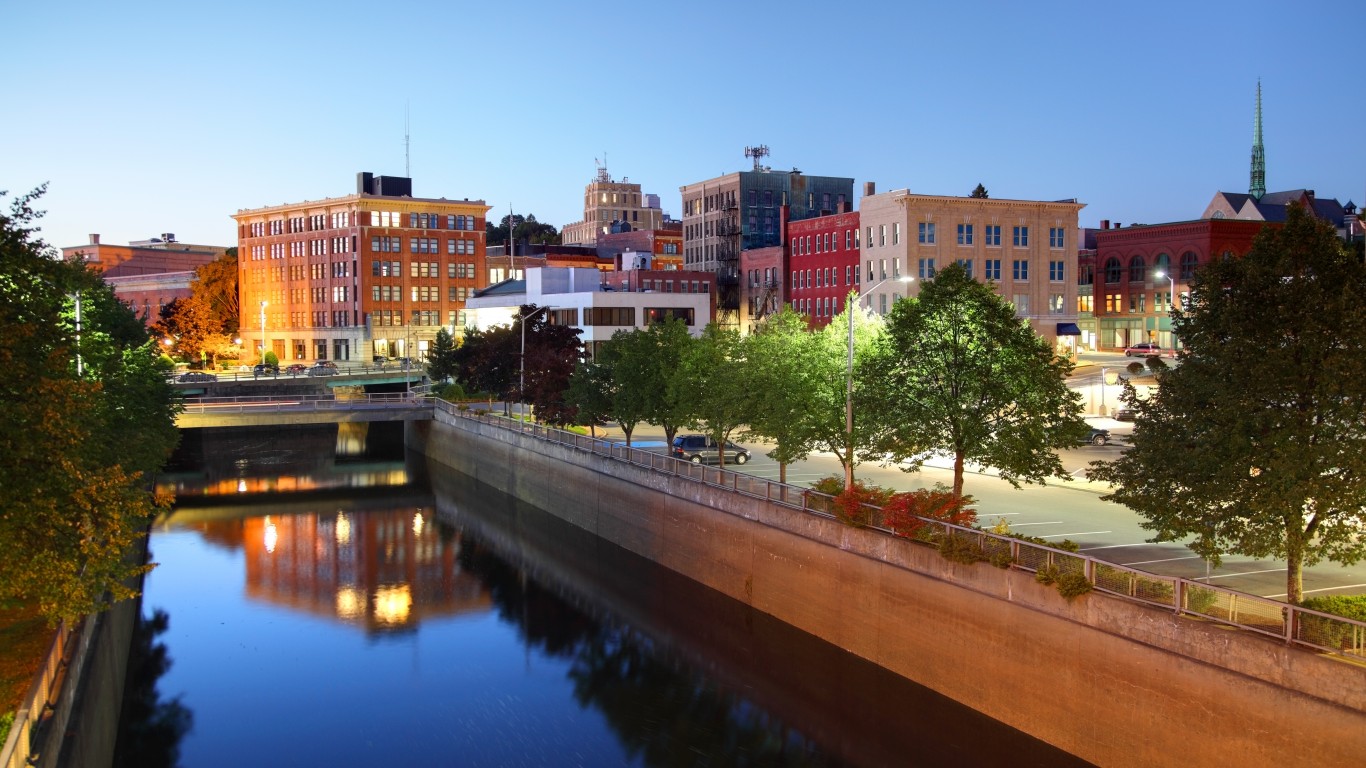
14. Bangor, Maine
Population change in downtown tracts from 2012 to 2022: -17.2%
Population change of non-downtown tracts from 2012 to 2022: +4.4%
Per capita income change in downtown tracts from 2012 to 2022: +25.7%
Per capita income change in non-downtown tracts from 2012 to 2022: +16.7%
13. Victoria, Texas
Population change in downtown tracts from 2012 to 2022: -17.8%
Population change of non-downtown tracts from 2012 to 2022: +5.7%
Per capita income change in downtown tracts from 2012 to 2022: -6.3%
Per capita income change in non-downtown tracts from 2012 to 2022: +2.1%
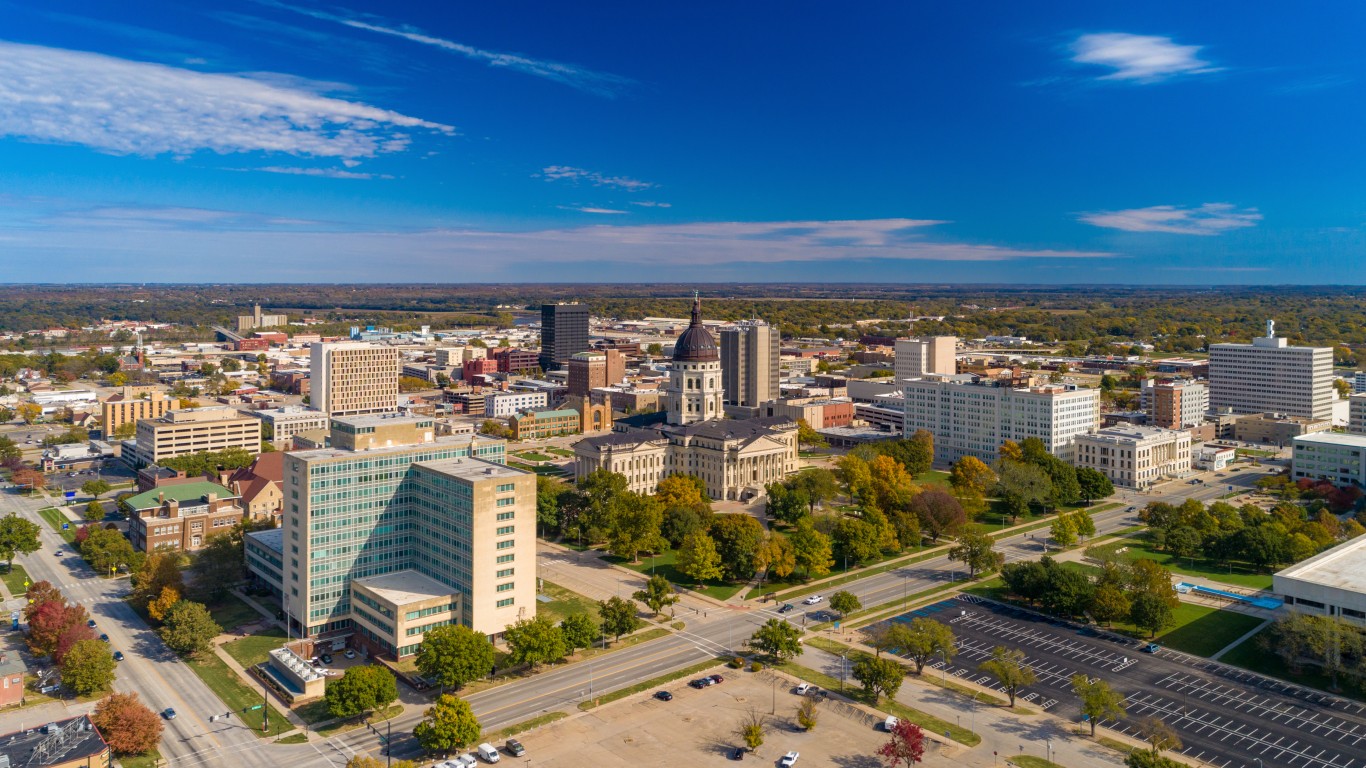
12. Topeka, Kansas
Population change in downtown tracts from 2012 to 2022: -18.4%
Population change of non-downtown tracts from 2012 to 2022: +3.2%
Per capita income change in downtown tracts from 2012 to 2022: +33.2%
Per capita income change in non-downtown tracts from 2012 to 2022: +5.0%
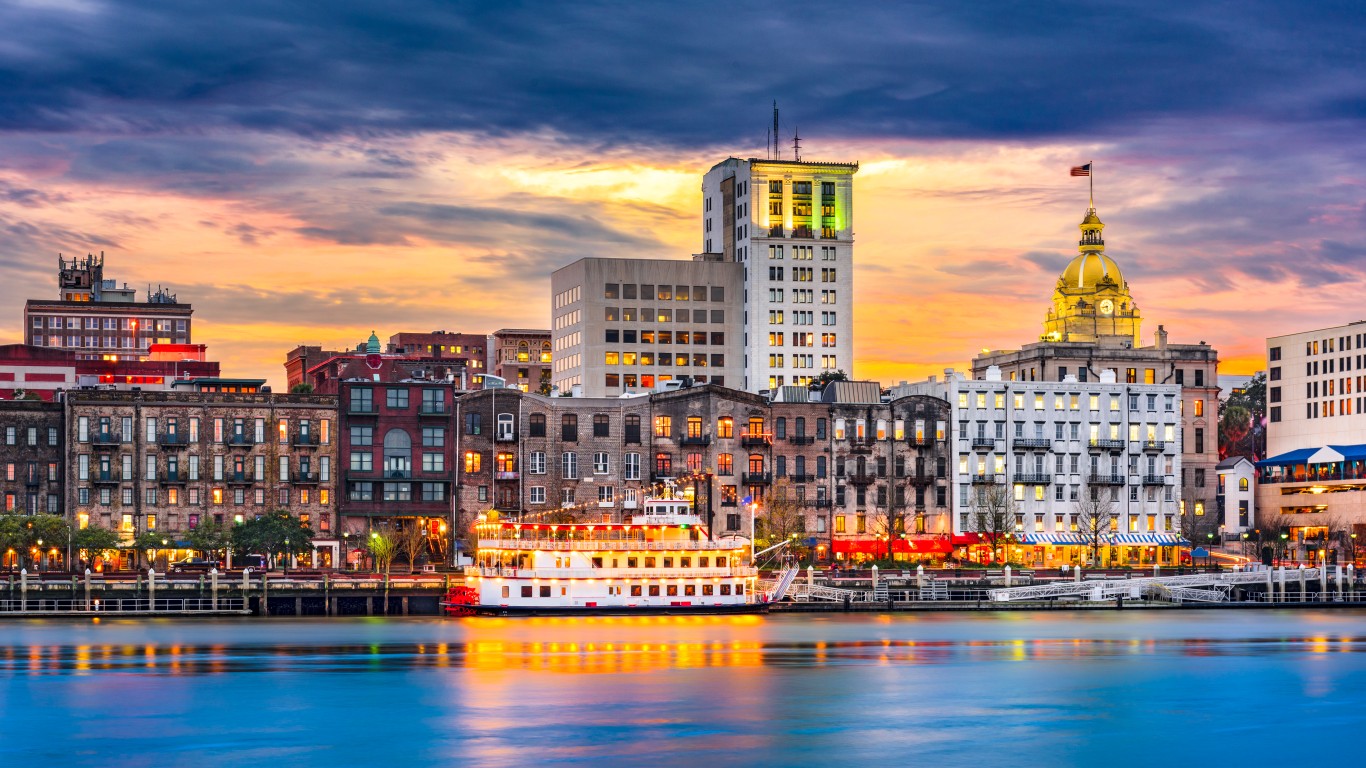
11. Savannah, Georgia
Population change in downtown tracts from 2012 to 2022: -18.4%
Population change of non-downtown tracts from 2012 to 2022: +1.8%
Per capita income change in downtown tracts from 2012 to 2022: +76.9%
Per capita income change in non-downtown tracts from 2012 to 2022: +15.2%
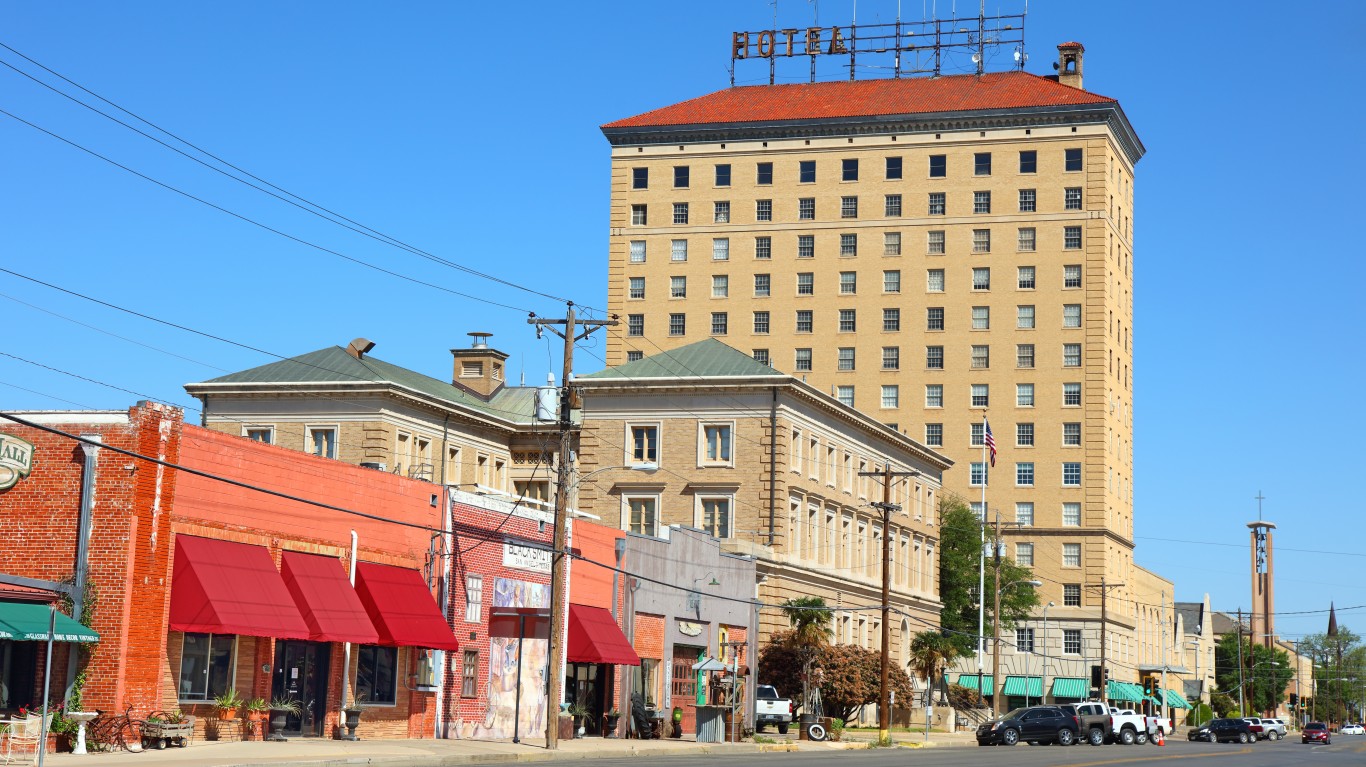
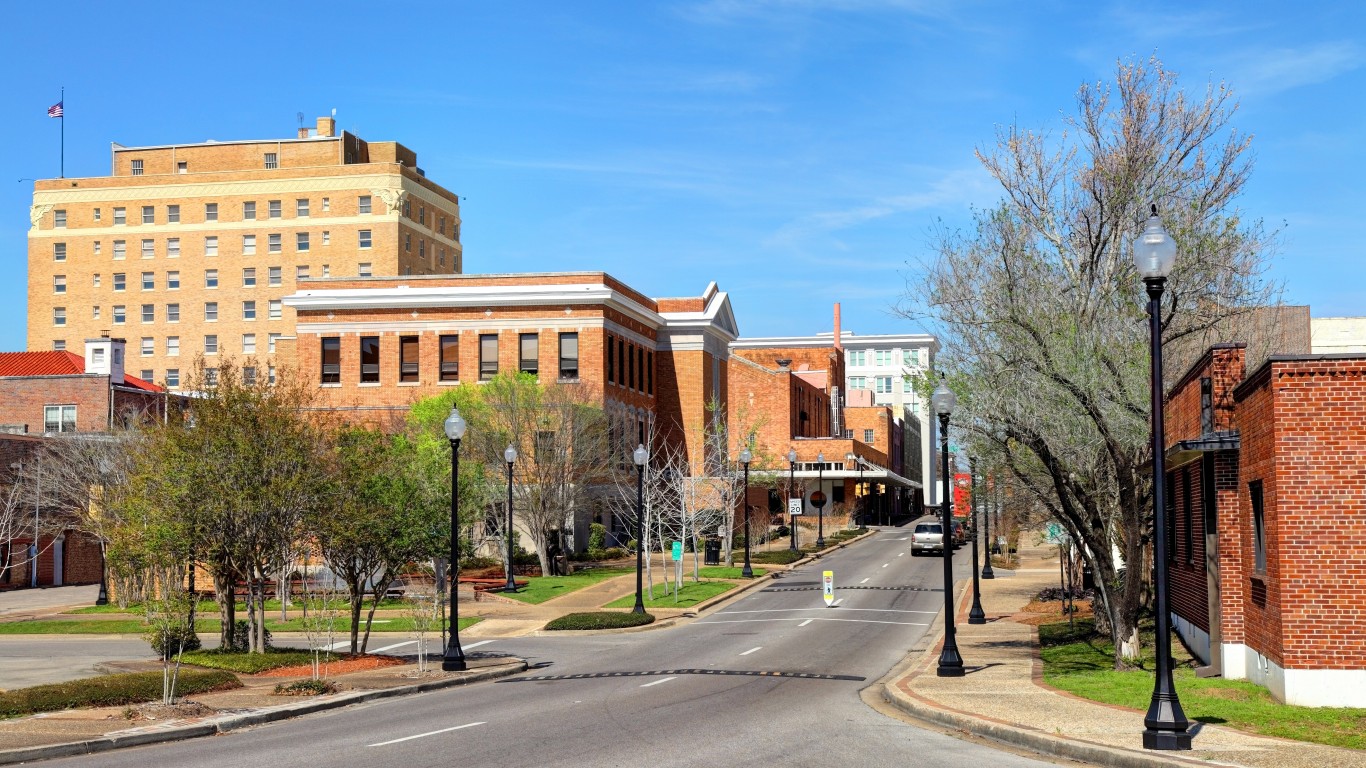
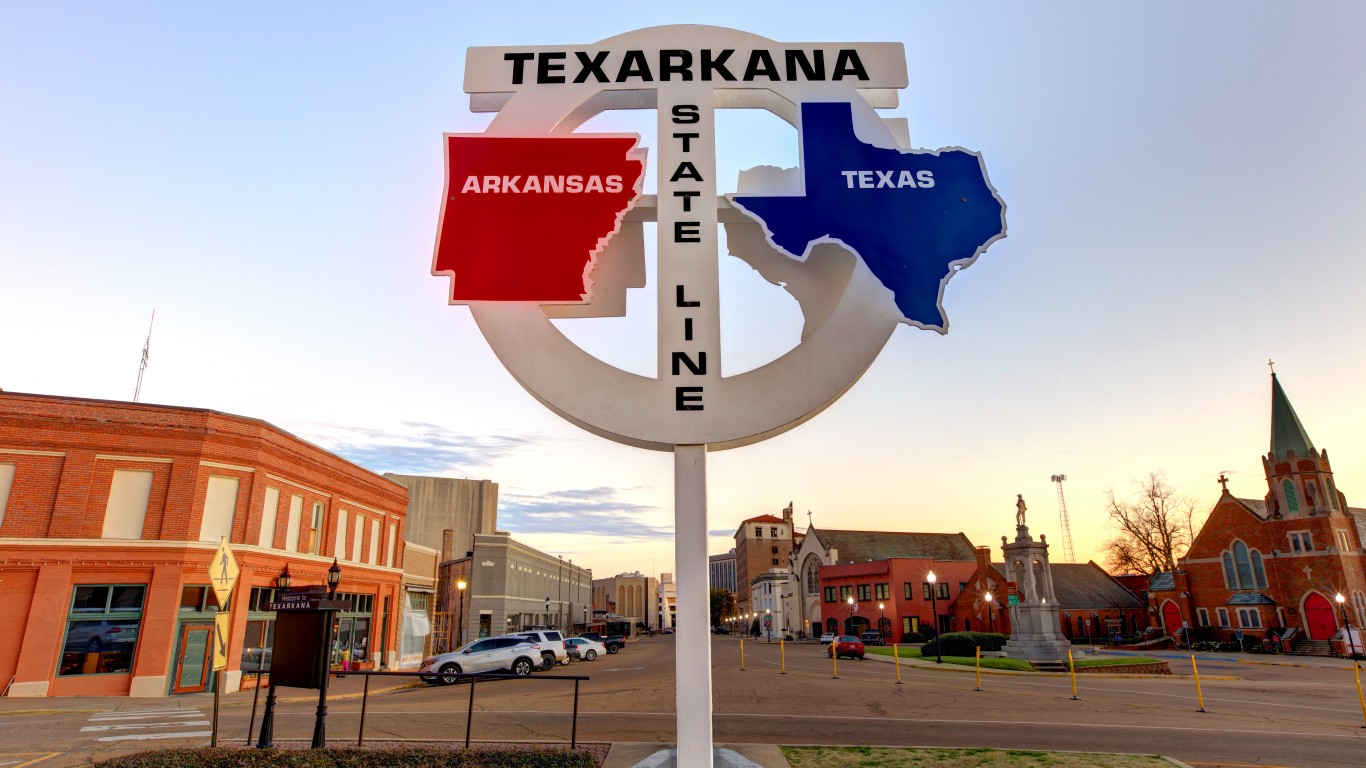
10. Texarkana, Texas
Population change in downtown tracts from 2012 to 2022: -19.9%
Population change of non-downtown tracts from 2012 to 2022: -2.2%
Per capita income change in downtown tracts from 2012 to 2022: +28.7%
Per capita income change in non-downtown tracts from 2012 to 2022: +1.3%
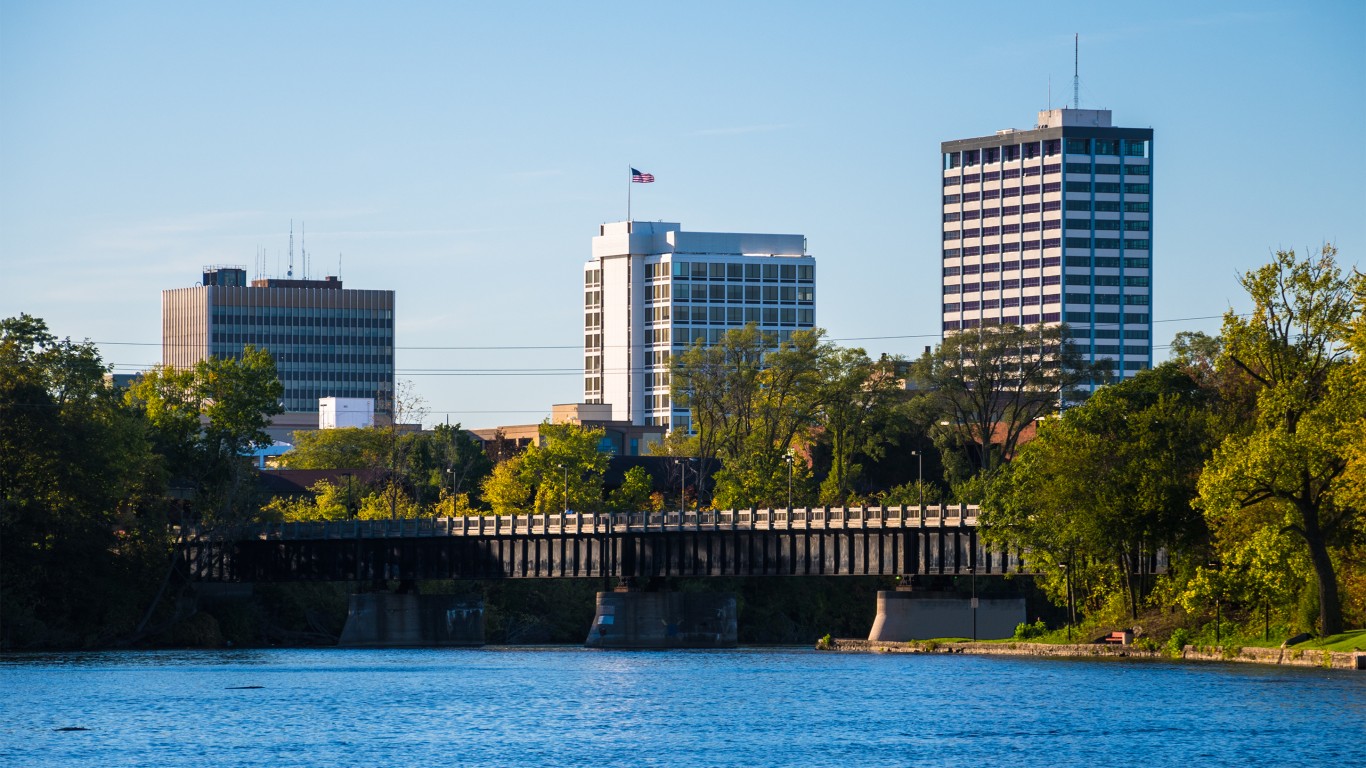
9. Saginaw, Michigan
Population change in downtown tracts from 2012 to 2022: -20.2%
Population change of non-downtown tracts from 2012 to 2022: -11.8%
Per capita income change in downtown tracts from 2012 to 2022: +26.4%
Per capita income change in non-downtown tracts from 2012 to 2022: -0.6%
8. Sumter, South Carolina
Population change in downtown tracts from 2012 to 2022: -21.0%
Population change of non-downtown tracts from 2012 to 2022: +9.6%
Per capita income change in downtown tracts from 2012 to 2022: -7.5%
Per capita income change in non-downtown tracts from 2012 to 2022: -9.5%
7. Shreveport, Louisiana
Population change in downtown tracts from 2012 to 2022: -21.0%
Population change of non-downtown tracts from 2012 to 2022: -8.9%
Per capita income change in downtown tracts from 2012 to 2022: +92.2%
Per capita income change in non-downtown tracts from 2012 to 2022: -1.2%
6. Alexandria, Louisiana
Population change in downtown tracts from 2012 to 2022: -21.3%
Population change of non-downtown tracts from 2012 to 2022: -1.0%
Per capita income change in downtown tracts from 2012 to 2022: +29.3%
Per capita income change in non-downtown tracts from 2012 to 2022: -10.3%
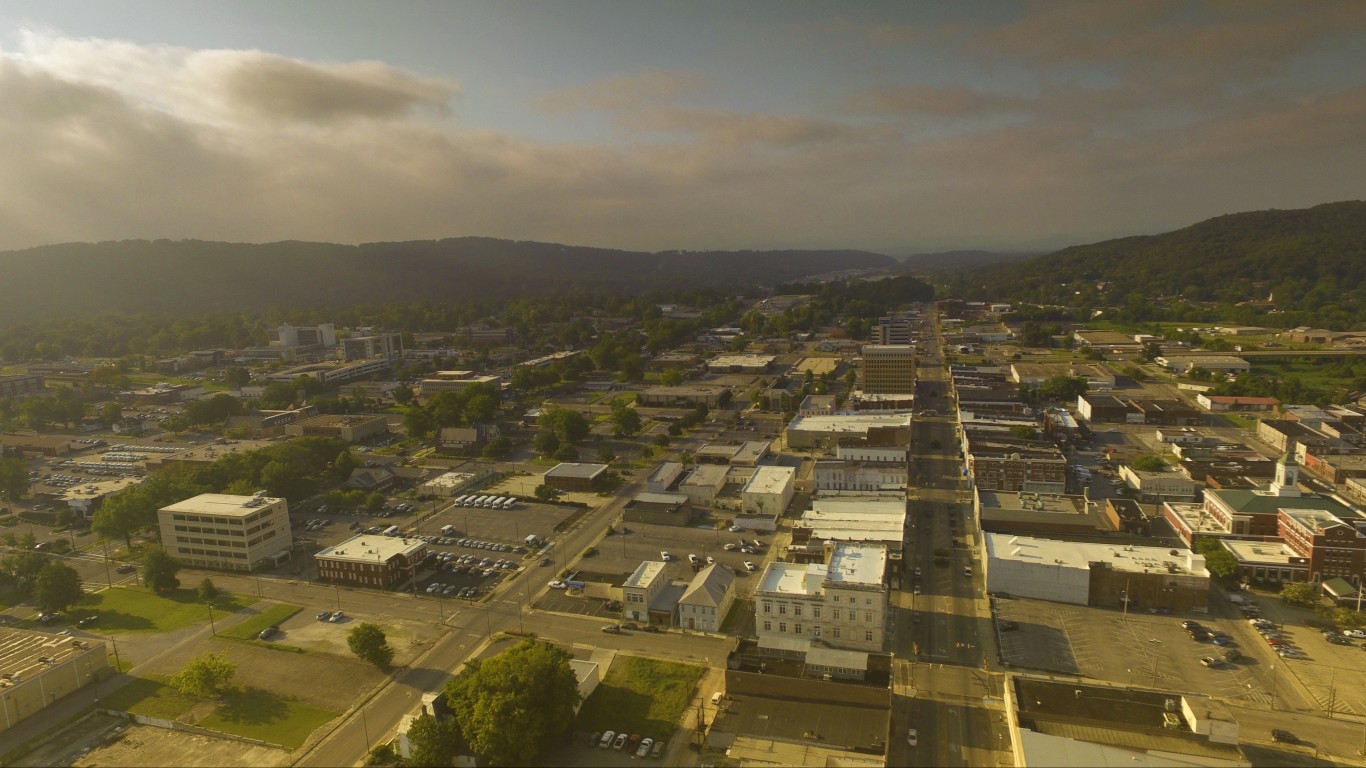
5. Anniston, Alabama
Population change in downtown tracts from 2012 to 2022: -22.2%
Population change of non-downtown tracts from 2012 to 2022: +5.9%
Per capita income change in downtown tracts from 2012 to 2022: +10.5%
Per capita income change in non-downtown tracts from 2012 to 2022: +4.9%
4. Birmingham, Alabama
Population change in downtown tracts from 2012 to 2022: -22.5%
Population change of non-downtown tracts from 2012 to 2022: -9.6%
Per capita income change in downtown tracts from 2012 to 2022: +28.7%
Per capita income change in non-downtown tracts from 2012 to 2022: +15.6%
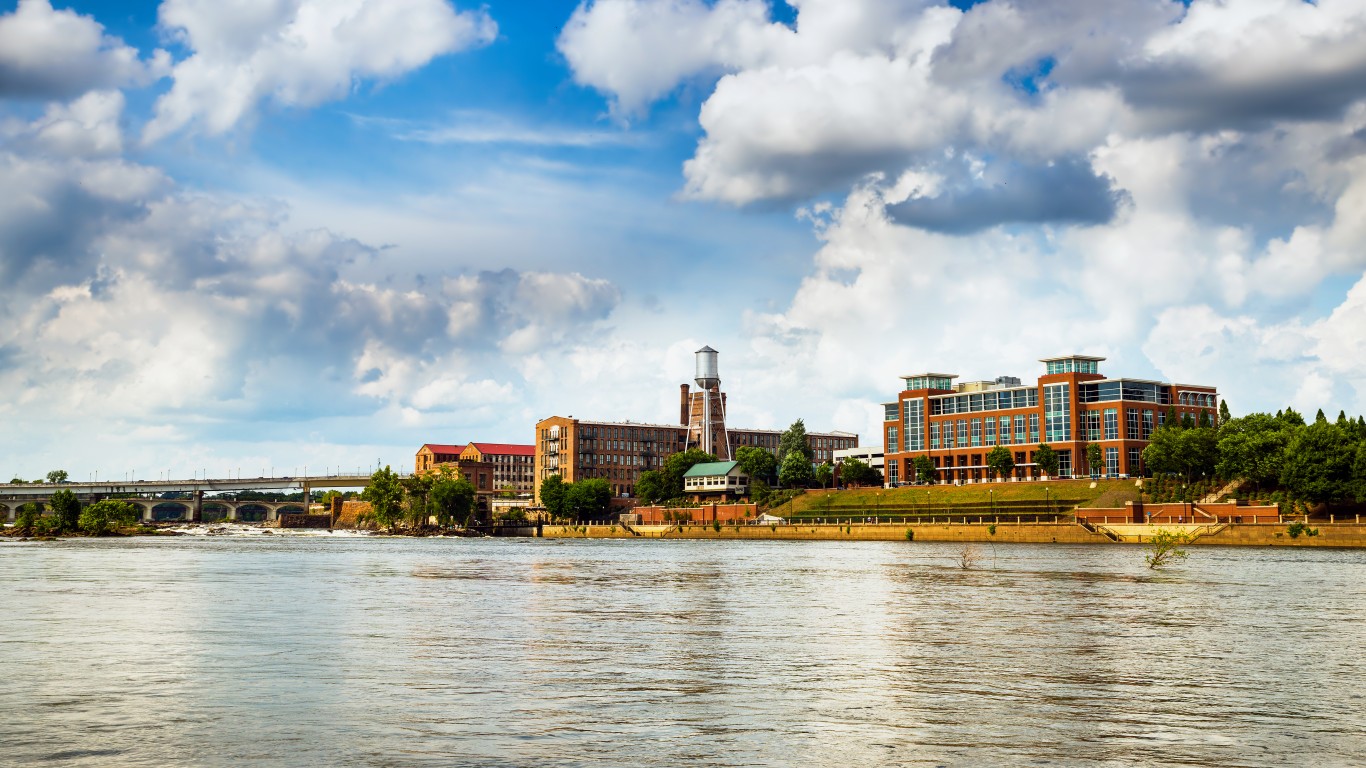
3. Columbus, Georgia
Population change in downtown tracts from 2012 to 2022: -25.4%
Population change of non-downtown tracts from 2012 to 2022: +3.6%
Per capita income change in downtown tracts from 2012 to 2022: +41.4%
Per capita income change in non-downtown tracts from 2012 to 2022: +1.0%
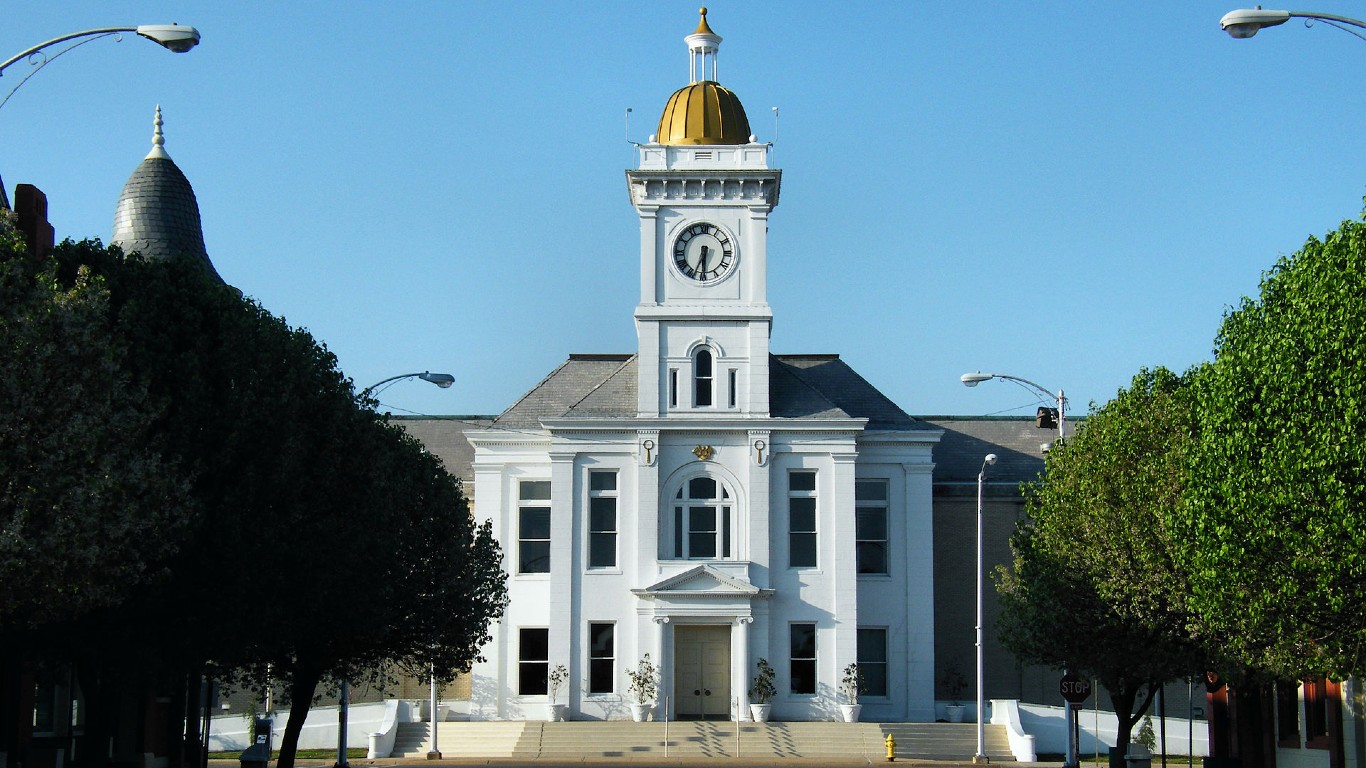
2. Pine Bluff, Arkansas
Population change in downtown tracts from 2012 to 2022: -30.5%
Population change of non-downtown tracts from 2012 to 2022: -10.0%
Per capita income change in downtown tracts from 2012 to 2022: +19.1%
Per capita income change in non-downtown tracts from 2012 to 2022: +1.4%
1. Albany, Georgia
Population change in downtown tracts from 2012 to 2022: -39.3%
Population change of non-downtown tracts from 2012 to 2022: -4.0%
Per capita income change in downtown tracts from 2012 to 2022: +23.7%
Per capita income change in non-downtown tracts from 2012 to 2022: +1.9%
The Average American Has No Idea How Much Money You Can Make Today (Sponsor)
The last few years made people forget how much banks and CD’s can pay. Meanwhile, interest rates have spiked and many can afford to pay you much more, but most are keeping yields low and hoping you won’t notice.
But there is good news. To win qualified customers, some accounts are paying almost 10x the national average! That’s an incredible way to keep your money safe and earn more at the same time. Our top pick for high yield savings accounts includes other benefits as well. You can earn up to 3.80% with a Checking & Savings Account today Sign up and get up to $300 with direct deposit. No account fees. FDIC Insured.
Our top pick for high yield savings accounts includes other benefits as well. You can earn up to 4.00% with a Checking & Savings Account from Sofi. Sign up and get up to $300 with direct deposit. No account fees. FDIC Insured.