24/7 Wall St. Insights
- We reviewed the study, Depopulation and associated challenges for US cities by 2100, to find cities projected to lose at least 50% of their populations by 2100.
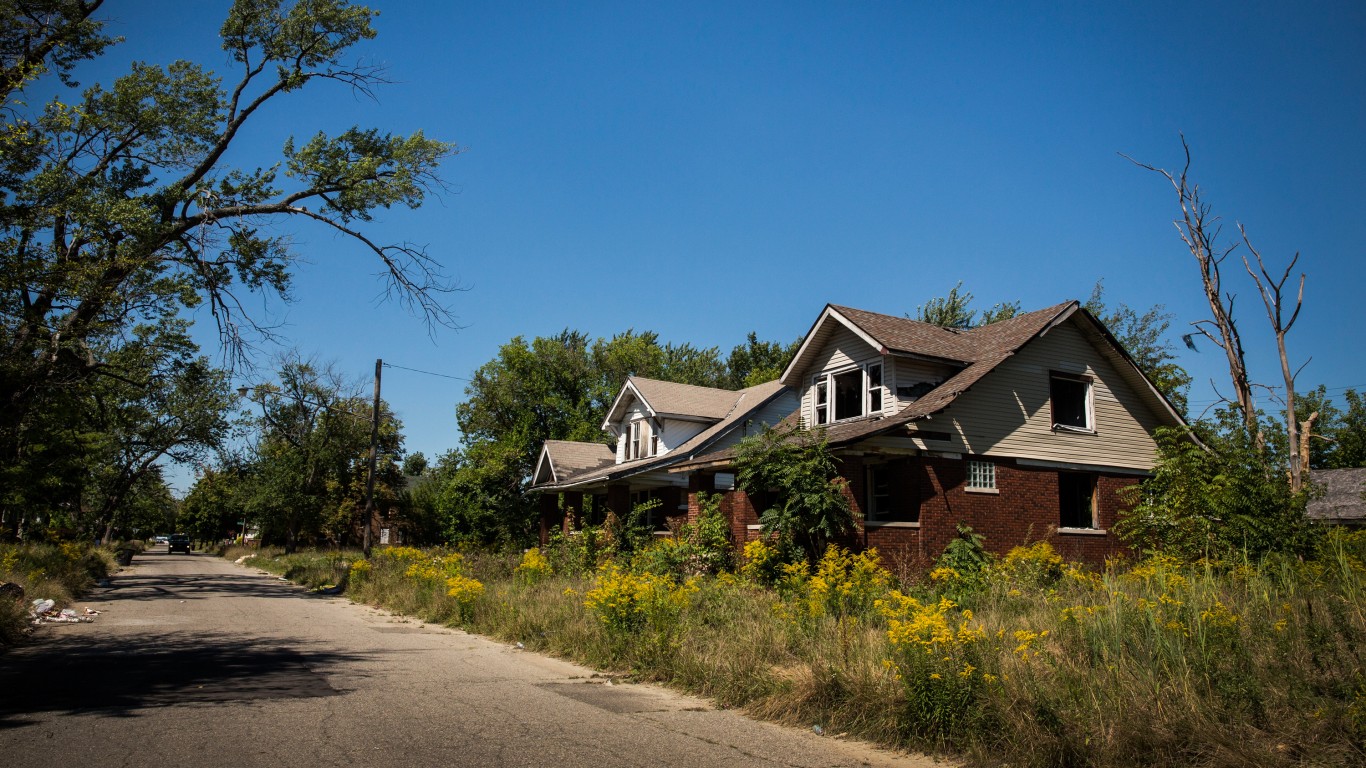
- Depopulation can lead to many challenges for a metro area.
- The Midwest has the most cities on our list at 12.
- Also: Discover “The Next NVIDIA”
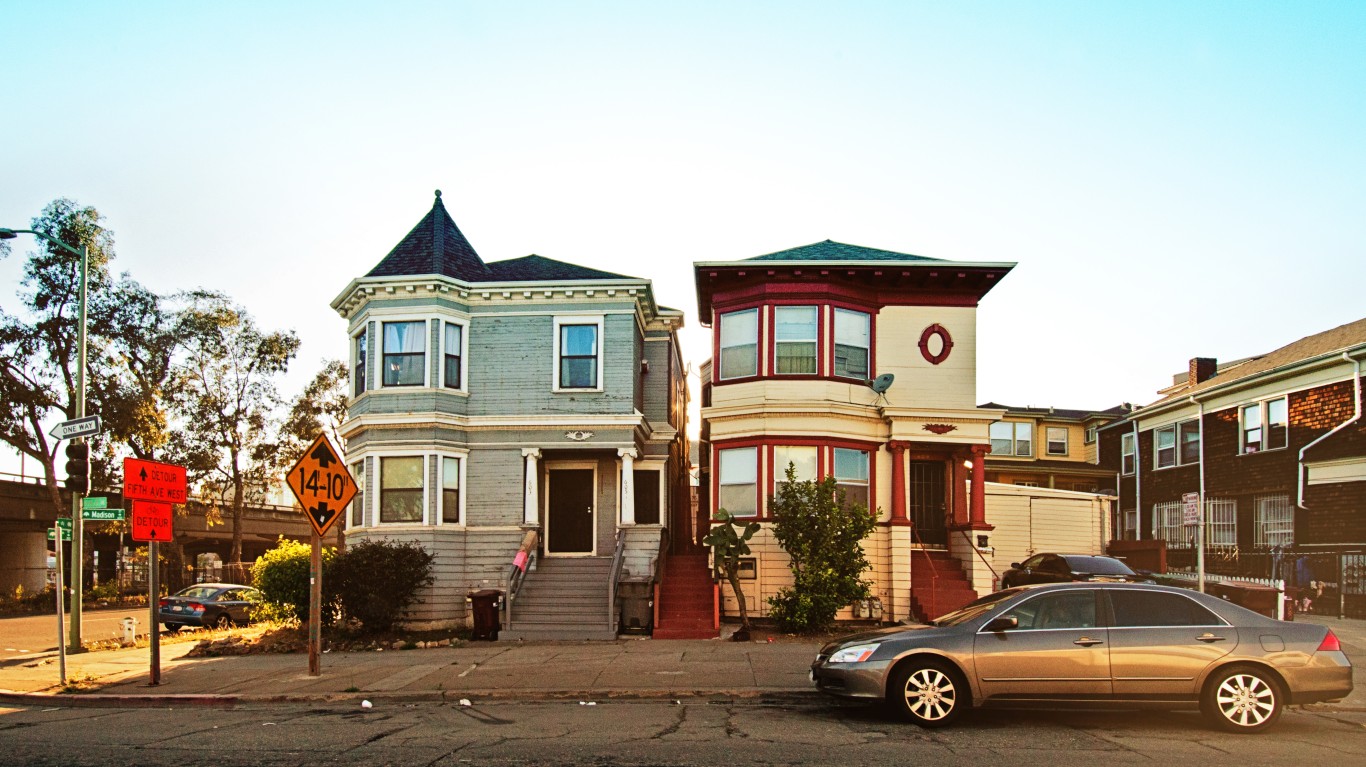
The under-18 population of Healdsburg, CA has dropped considerably, from 25% in 2009 to 17% in 2023. This is the steepest decline among comparably sized Bay Area towns, and quite a drop for the affluent area. One contributing factor to this decline in children is young, middle-income families leaving the area due to skyrocketing housing costs. Youth programs in the picturesque town abound, yet school enrollment is still falling. In fact, the school district recently accepted transfers to maintain class size. Leaders within the community have spoken out, warning that if changes are not implemented, Healdsburg will eventually grow completely unsustainable for young families.
A recent study published in the science journal Nature revealed that almost half of 30,000 American cities will experience a population decline by the end of the century. In the study, researchers predicted this could mean “unprecedented challenges.” The loss of residents in a city will also contribute to a loss of tax revenue, meaning there may be “disruptions in basic services like transit, clean water, electricity and internet access.” Although this scenario seems hard to imagine, researchers estimated future trends by considering projections under five scenarios, from environmentally friendly development to fossil-fueled development. At the top of the list is Pine Bluff, AR, projected to lose 67.8% of its population by 2100.
24/7 Wall St. reviewed the study, Depopulation and associated challenges for US cities by 2100, listing here the 26 cities with 2020 population above 10,000 that are projected to shrink by at least 50% by 2100 — under the middle of the road scenario, which includes intermediate challenges. We also added socioeconomic data — median household income, poverty rate, unemployment rate, bachelor’s degree attainment rate — from the Census Bureau’s 5-year estimates 2022 American Community Survey.
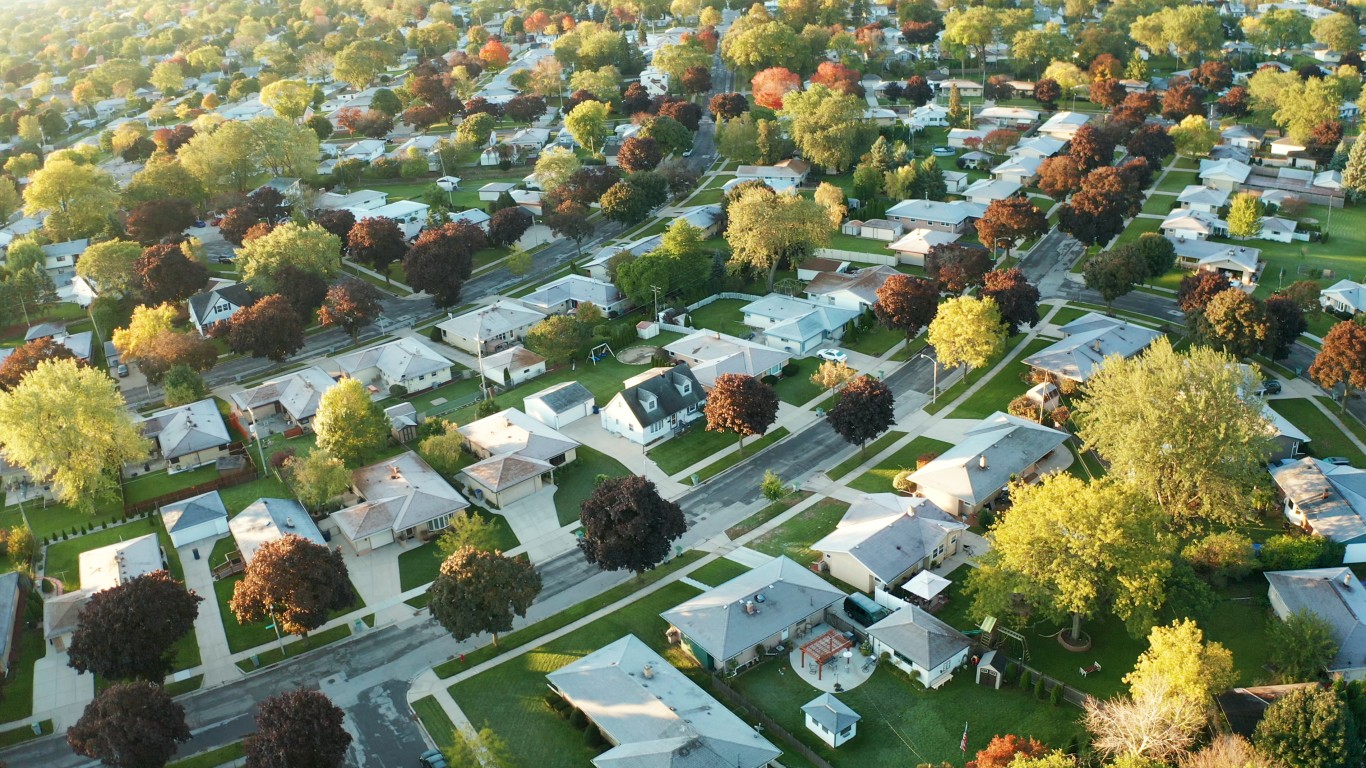
The Midwest tops our list with the most cities at 12 (including six cities in Illinois and four in Michigan.) Behind the Midwest is the South with eight cities, and then the Northeast at five (with three in New York.) Only one city in the West made the list of 26. Of the 24 cities with data, all have lower median household income than the national average, higher poverty, and lower rates of people holding bachelor’s degrees. Only four of the cities actually have a lower unemployment rate than the national average.
The largest city listed here is Flint, Michigan, which is projected to lose a stunning nearly 61% of its 2020 population of over 81,000 by 2100. Decatur, Illinois, which had close to 71,000 residents in 2020, is also projected to lose about 61% of its population by 2100. (In the past five years here are Cities Americans Are Abandoning in Droves.)
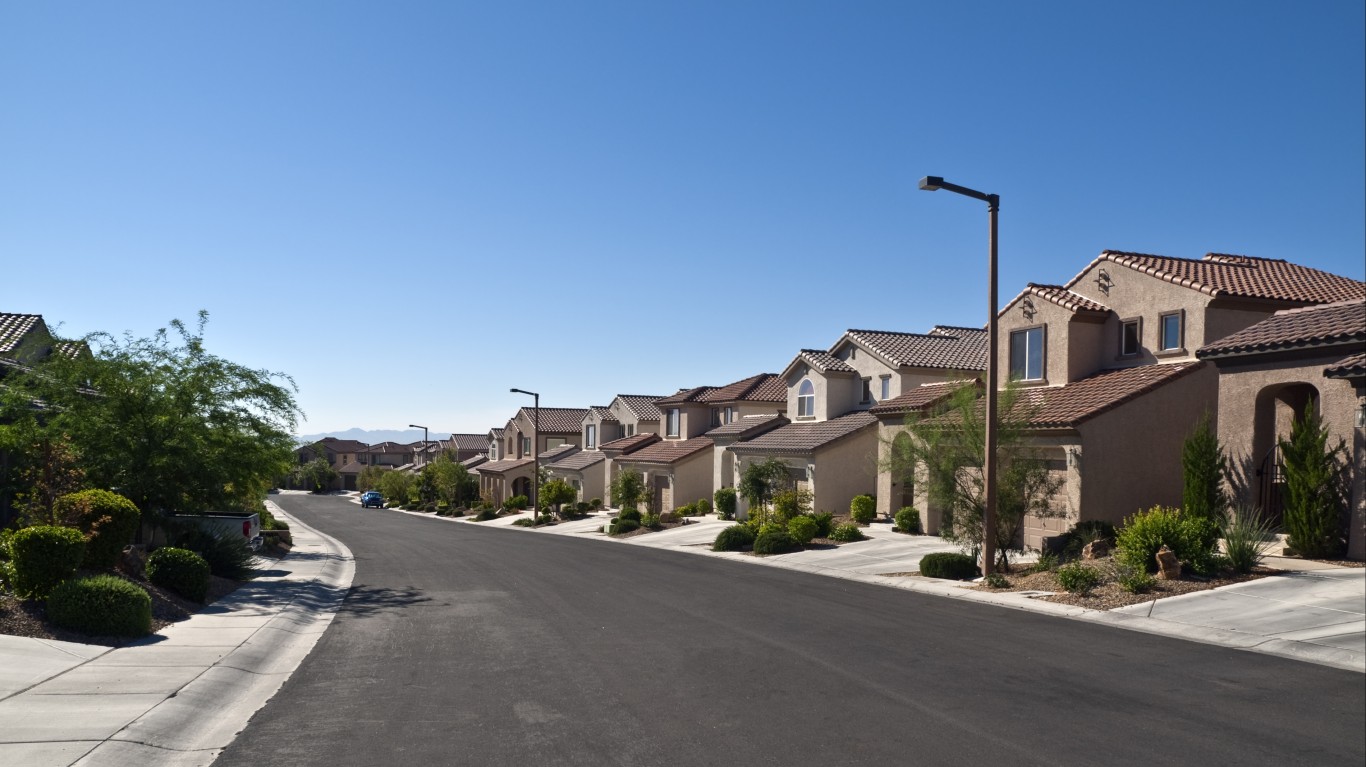
While these are the results strictly for the 26 cities on the list (selected by the criteria noted above), the study’s overall findings indicate that a larger number of depopulating cities will be in the Northeast and Midwest than the South and West regions (although many cities in the North and Midwest will still grow). Within individual states, there could be variations as well. For example, in California, the southern coast may lose population, while the northern coast may gain population. And surprisingly, though Texas and Utah cities are generally growing, they are projected to have a fair share of cities losing population. Finally, except for the District of Columbia and Hawaii, all states will have cities with depopulation concerns.
This post was updated on July 22, 2025 to include information on Healdsburg’s plummeting under-18 population.
Why This Matters

26. Laurinburg, North Carolina

- Population change by 2100: -50.1% (from 14,978 in 2020 to 7,468 in 2100)
- Current population trend from 2000-2020: slowly depopulating
- Median household income: $38,015 (vs $75,149 nationwide)
- Poverty rate: 33.8% (vs. 12.5% nationwide)
- Unemployment rate: 11.2% (vs. 5.3% nationwide)
- Bachelor’s degree attainment rate: 19.0% (vs. 34.3% nationwide)
25. Bogalusa, Louisiana
- Population change by 2100: -52.5% (from 10,659 in 2020 to 5,065 in 2100)
- Current population trend from 2000-2020: moderately depopulating
- Median household income: $39,213 (vs $75,149 nationwide)
- Poverty rate: 29.6% (vs. 12.5% nationwide)
- Unemployment rate: 11.6% (vs. 5.3% nationwide)
- Bachelor’s degree attainment rate: 12.2% (vs. 34.3% nationwide)
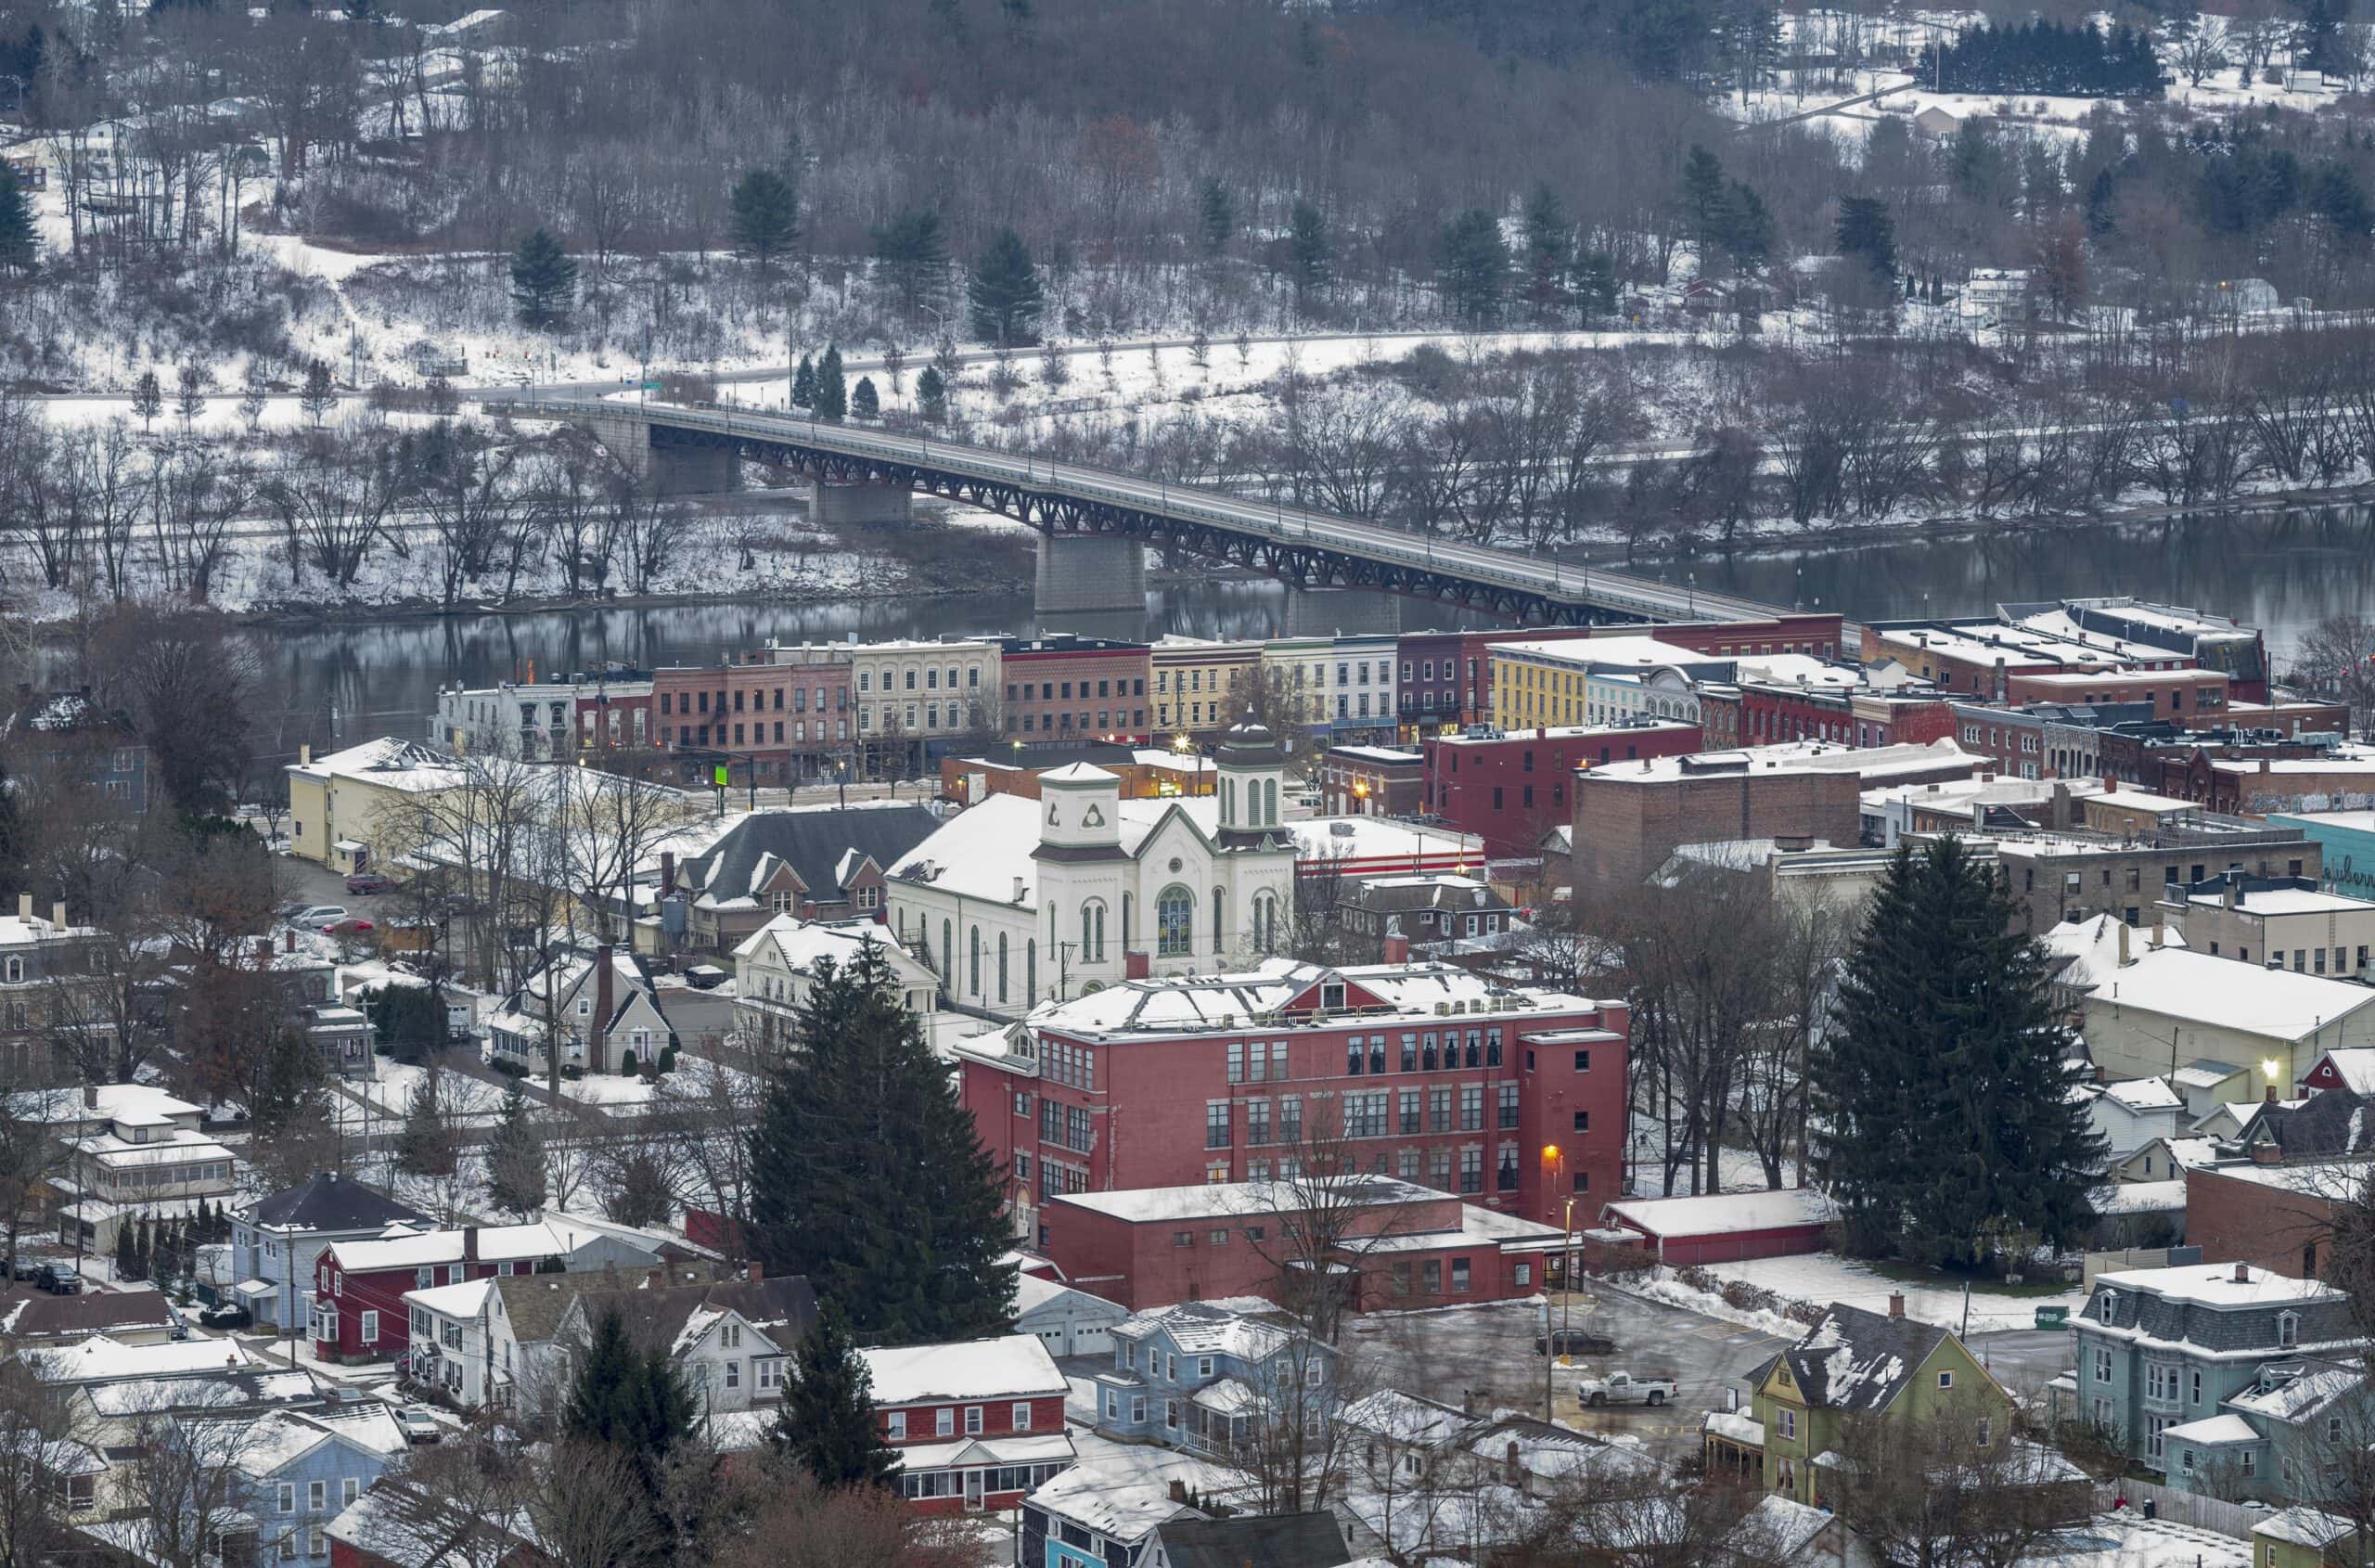
24. Meadville, Pennsylvania

- Population change by 2100: -53.5% (from 13,050 in 2020 to 6,064 in 2100)
- Current population trend from 2000-2020: slowly depopulating
- Median household income: $46,157 (vs $75,149 nationwide)
- Poverty rate: 18.1% (vs. 12.5% nationwide)
- Unemployment rate: 6.9% (vs. 5.3% nationwide)
- Bachelor’s degree attainment rate: 24.9% (vs. 34.3% nationwide)
23. Burton, Michigan
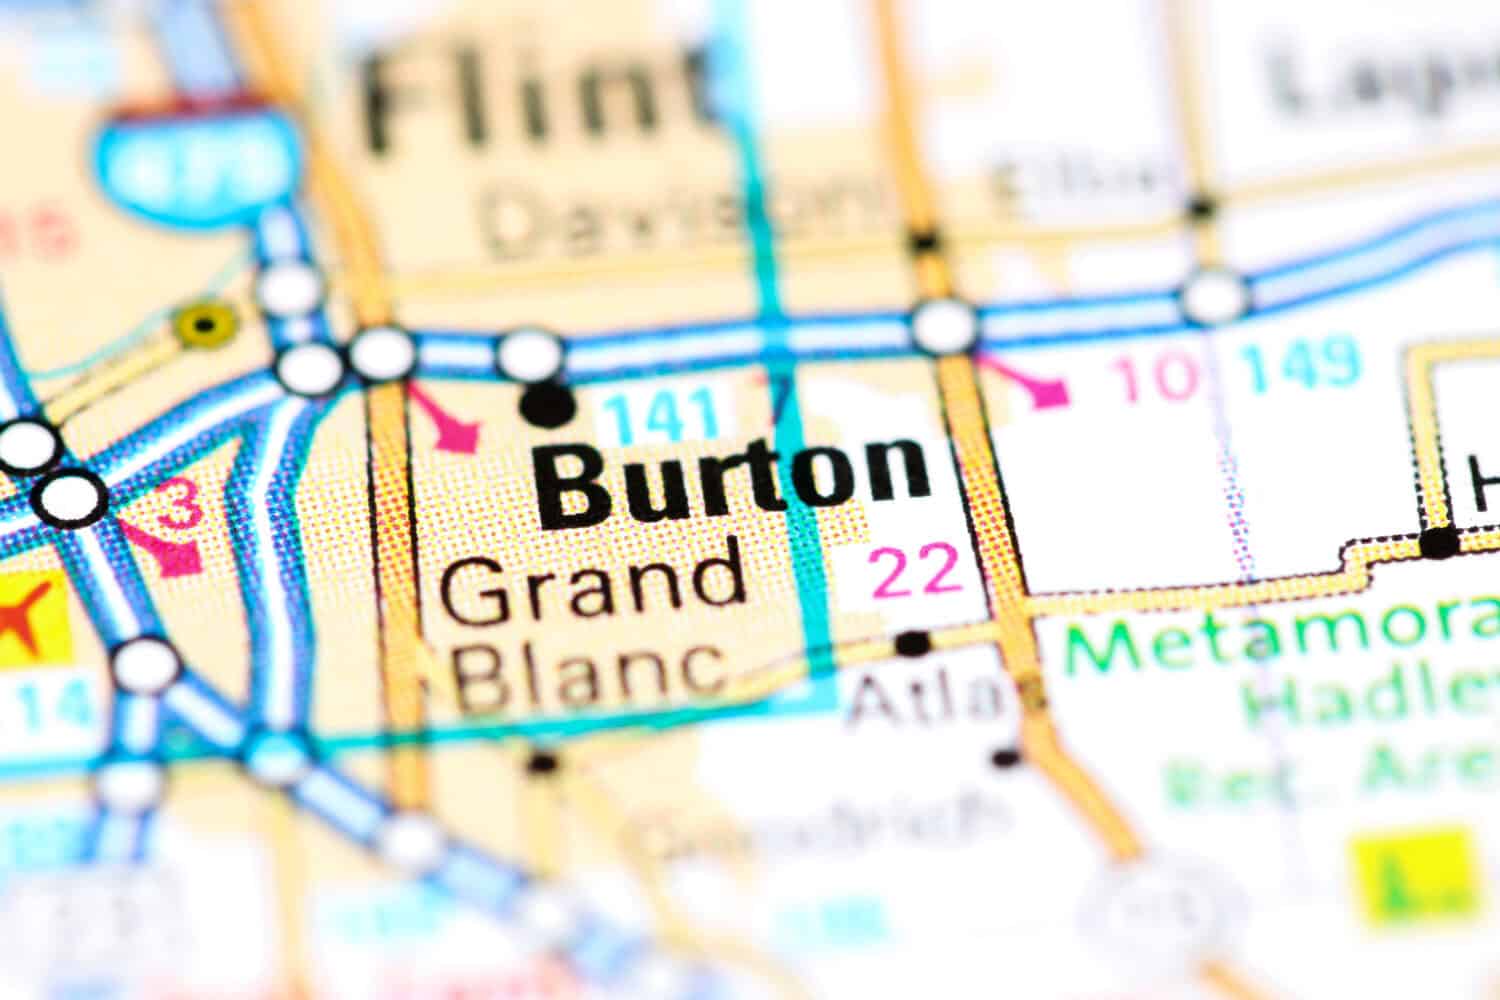
- Population change by 2100: -53.7% (from 29,715 in 2020 to 13,756 in 2100)
- Current population trend from 2000-2020: slowly depopulating
- Median household income: $55,698 (vs $75,149 nationwide)
- Poverty rate: 16.2% (vs. 12.5% nationwide)
- Unemployment rate: 7.1% (vs. 5.3% nationwide)
- Bachelor’s degree attainment rate: 16.2% (vs. 34.3% nationwide)
22. Batavia, New York

- Population change by 2100: -54.1% (from 15,600 in 2020 to 7,161 in 2100)
- Current population trend from 2000-2020: fluctuating
- Median household income: $54,937 (vs $75,149 nationwide)
- Poverty rate: 13.3% (vs. 12.5% nationwide)
- Unemployment rate: 4.0% (vs. 5.3% nationwide)
- Bachelor’s degree attainment rate: 22.5% (vs. 34.3% nationwide)
21. Sterling, Illinois

- Population change by 2100: -54.4% (from 14,764 in 2020 to 6,732 in 2100)
- Current population trend from 2000-2020: slowly depopulating
- Median household income: $49,007 (vs $75,149 nationwide)
- Poverty rate: 15.1% (vs. 12.5% nationwide)
- Unemployment rate: 5.1% (vs. 5.3% nationwide)
- Bachelor’s degree attainment rate: 16.5% (vs. 34.3% nationwide)
20. Freeport, Illinois

- Population change by 2100: -55.0% (from 23,973 in 2020 to 10,797 in 2100)
- Current population trend from 2000-2020: slowly depopulating
- Median household income: $44,658 (vs $75,149 nationwide)
- Poverty rate: 18.6% (vs. 12.5% nationwide)
- Unemployment rate: 6.4% (vs. 5.3% nationwide)
- Bachelor’s degree attainment rate: 18.2% (vs. 34.3% nationwide)
19. Cambridge, Ohio

- Population change by 2100: -55.8% (from 10,089 in 2020 to 4,459 in 2100)
- Current population trend from 2000-2020: slowly depopulating
- Median household income: $39,589 (vs $75,149 nationwide)
- Poverty rate: 30.2% (vs. 12.5% nationwide)
- Unemployment rate: 2.5% (vs. 5.3% nationwide)
- Bachelor’s degree attainment rate: 13.4% (vs. 34.3% nationwide)
18. Fulton, New York

- Population change by 2100: -56.3% (from 11,389 in 2020 to 4,974 in 2100)
- Current population trend from 2000-2020: slowly depopulating
- Median household income: N/A
- Poverty rate: N/A
- Unemployment rate: N/A
- Bachelor’s degree attainment rate: N/A
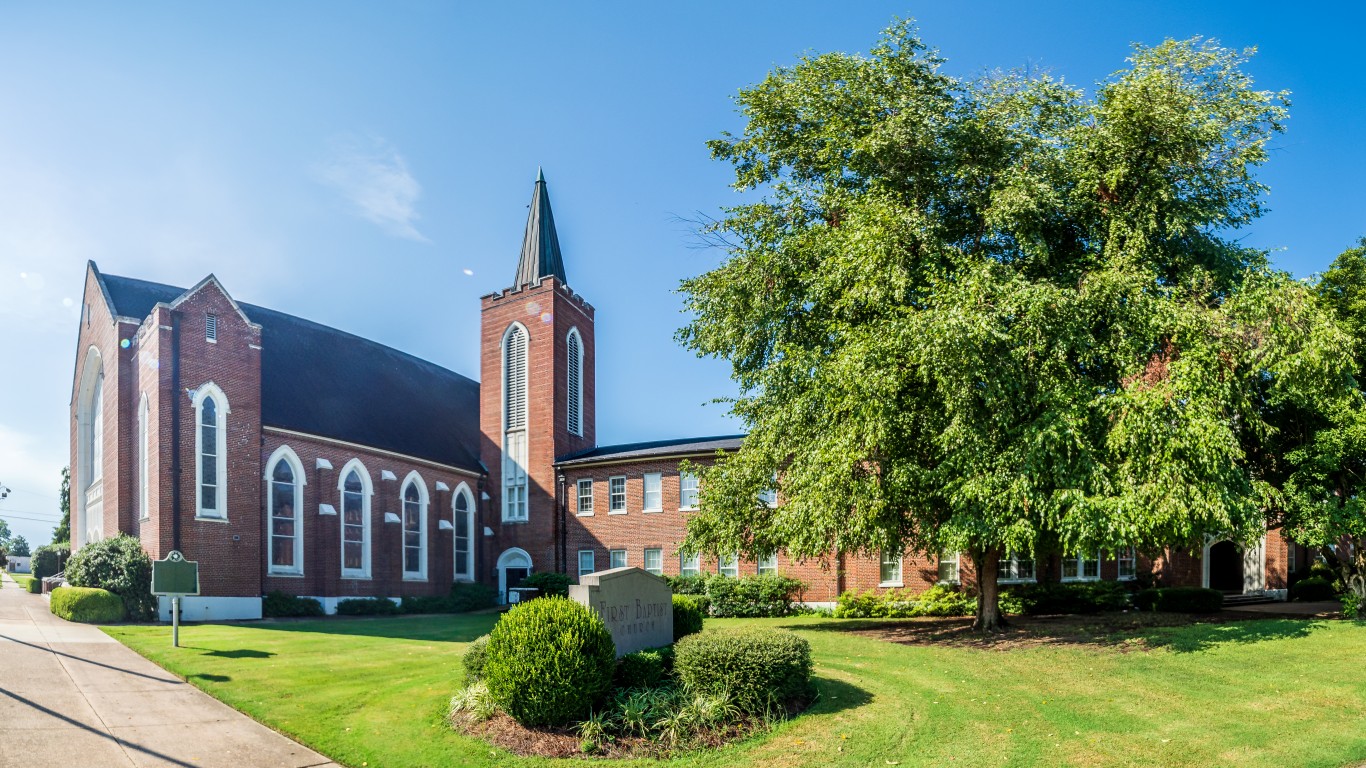
17. Selma, Alabama

- Population change by 2100: -56.5% (from 17,971 in 2020 to 7,809 in 2100)
- Current population trend from 2000-2020: moderately depopulating
- Median household income: $31,084 (vs $75,149 nationwide)
- Poverty rate: 29.5% (vs. 12.5% nationwide)
- Unemployment rate: 12.9% (vs. 5.3% nationwide)
- Bachelor’s degree attainment rate: 19.7% (vs. 34.3% nationwide)
16. Oswego, New York
- Population change by 2100: -57.0% (from 16,921 in 2020 to 7,280 in 2100)
- Current population trend from 2000-2020: slowly depopulating
- Median household income: $50,266 (vs $75,149 nationwide)
- Poverty rate: 25.4% (vs. 12.5% nationwide)
- Unemployment rate: 10.6% (vs. 5.3% nationwide)
- Bachelor’s degree attainment rate: 27.8% (vs. 34.3% nationwide)
15. New Castle, Pennsylvania

- Population change by 2100: -57.0% (from 21,926 in 2020 to 9,427 in 2100)
- Current population trend from 2000-2020: slowly depopulating
- Median household income: $39,948 (vs $75,149 nationwide)
- Poverty rate: 26.4% (vs. 12.5% nationwide)
- Unemployment rate: 15.6% (vs. 5.3% nationwide)
- Bachelor’s degree attainment rate: 16.5% (vs. 34.3% nationwide)
14. Bay City, Michigan

- Population change by 2100: -57.9% (from 32,661 in 2020 to 13,734 in 2100)
- Current population trend from 2000-2020: slowly depopulating
- Median household income: $45,026 (vs $75,149 nationwide)
- Poverty rate: 24.8% (vs. 12.5% nationwide)
- Unemployment rate: 6.2% (vs. 5.3% nationwide)
- Bachelor’s degree attainment rate: 16.3% (vs. 34.3% nationwide)
13. Mount Airy, North Carolina

- Population change by 2100: -58.6% (from 10,676 in 2020 to 4,418 in 2100)
- Current population trend from 2000-2020: slowly increasing
- Median household income: $34,089 (vs $75,149 nationwide)
- Poverty rate: 31.7% (vs. 12.5% nationwide)
- Unemployment rate: 7.2% (vs. 5.3% nationwide)
- Bachelor’s degree attainment rate: 24.7% (vs. 34.3% nationwide)
12. Saginaw, Michigan

- Population change by 2100: -59.7% (from 44,202 in 2020 to 17,828 in 2100)
- Current population trend from 2000-2020: moderately depopulating
- Median household income: $35,521 (vs $75,149 nationwide)
- Poverty rate: 34.5% (vs. 12.5% nationwide)
- Unemployment rate: 11.7% (vs. 5.3% nationwide)
- Bachelor’s degree attainment rate: 12.8% (vs. 34.3% nationwide)
11. Belleville, Illinois

- Population change by 2100: -60.5% (from 42,404 in 2020 to 16,770 in 2100)
- Current population trend from 2000-2020: fluctuating
- Median household income: $60,573 (vs $75,149 nationwide)
- Poverty rate: 14.7% (vs. 12.5% nationwide)
- Unemployment rate: 5.9% (vs. 5.3% nationwide)
- Bachelor’s degree attainment rate: 26.4% (vs. 34.3% nationwide)
10. Decatur, Illinois

- Population change by 2100: -60.5% (from 70,522 in 2020 to 27,862 in 2100)
- Current population trend from 2000-2020: slowly depopulating
- Median household income: $49,039 (vs $75,149 nationwide)
- Poverty rate: 19.5% (vs. 12.5% nationwide)
- Unemployment rate: 8.9% (vs. 5.3% nationwide)
- Bachelor’s degree attainment rate: 21.4% (vs. 34.3% nationwide)
9. Cahokia, Illinois

- Population change by 2100: -60.8% (from 12,096 in 2020 to 4,747 in 2100)
- Current population trend from 2000-2020: moderately depopulating
- Median household income: N/A
- Poverty rate: N/A
- Unemployment rate: N/A
- Bachelor’s degree attainment rate: N/A
8. East St. Louis, Illinois

- Population change by 2100: -60.8% (from 18,469 in 2020 to 7,240 in 2100)
- Current population trend from 2000-2020: moderately depopulating
- Median household income: $28,519 (vs $75,149 nationwide)
- Poverty rate: 31.6% (vs. 12.5% nationwide)
- Unemployment rate: 13.0% (vs. 5.3% nationwide)
- Bachelor’s degree attainment rate: 12.4% (vs. 34.3% nationwide)
7. Flint, Michigan

- Population change by 2100: -60.9% (from 81,252 in 2020 to 31,799 in 2100)
- Current population trend from 2000-2020: moderately depopulating
- Median household income: $35,451 (vs $75,149 nationwide)
- Poverty rate: 33.3% (vs. 12.5% nationwide)
- Unemployment rate: 17.6% (vs. 5.3% nationwide)
- Bachelor’s degree attainment rate: 12.3% (vs. 34.3% nationwide)
6. Eufaula, Alabama

- Population change by 2100: -61.3% (from 12,882 in 2020 to 4,982 in 2100)
- Current population trend from 2000-2020: slowly depopulating
- Median household income: $39,511 (vs $75,149 nationwide)
- Poverty rate: 25.3% (vs. 12.5% nationwide)
- Unemployment rate: 5.2% (vs. 5.3% nationwide)
- Bachelor’s degree attainment rate: 17.3% (vs. 34.3% nationwide)
5. Plainview, Texas
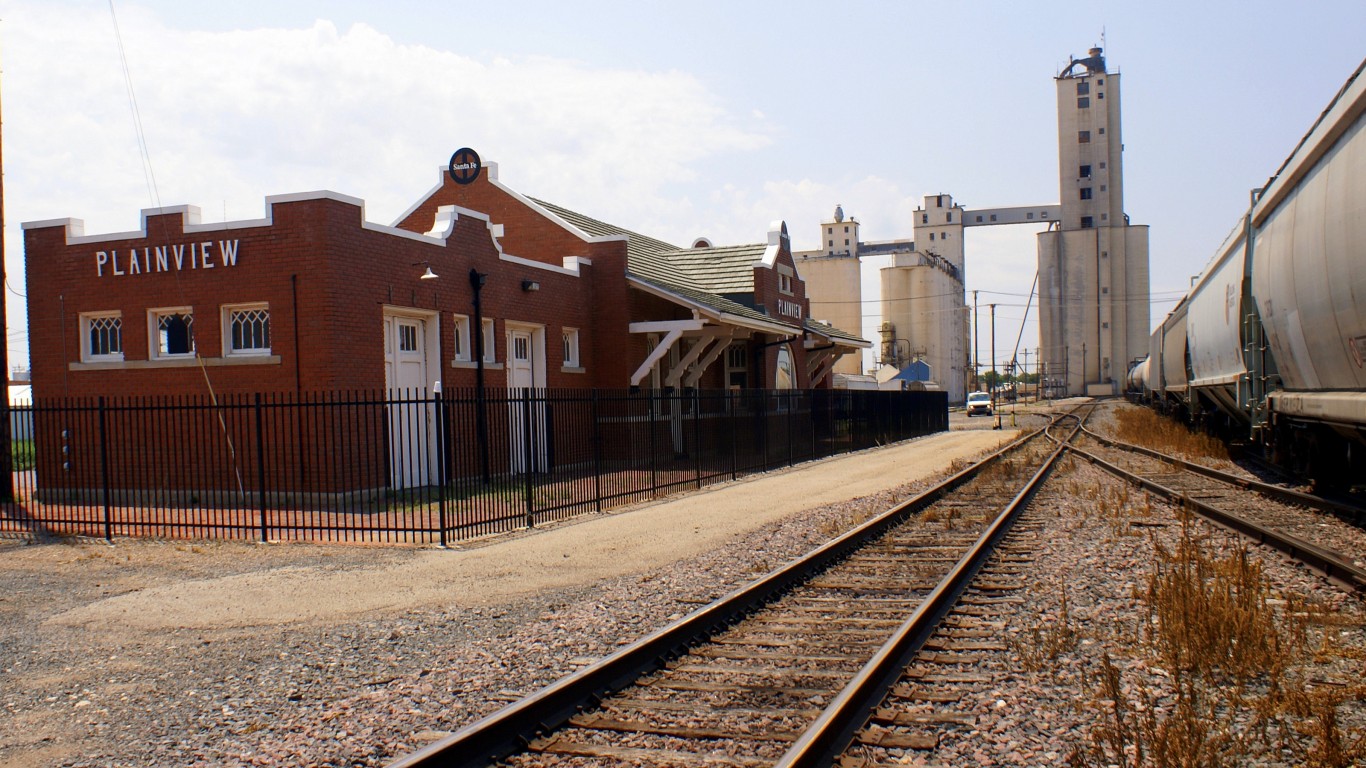
- Population change by 2100: -63.1% (from 20,187 in 2020 to 7,451 in 2100)
- Current population trend from 2000-2020: slowly depopulating
- Median household income: $46,274 (vs $75,149 nationwide)
- Poverty rate: 21.6% (vs. 12.5% nationwide)
- Unemployment rate: 6.6% (vs. 5.3% nationwide)
- Bachelor’s degree attainment rate: 14.6% (vs. 34.3% nationwide)
4. Portsmouth, Ohio

- Population change by 2100: -63.3% (from 18,252 in 2020 to 6,706 in 2100)
- Current population trend from 2000-2020: slowly depopulating
- Median household income: $36,051 (vs $75,149 nationwide)
- Poverty rate: 35.4% (vs. 12.5% nationwide)
- Unemployment rate: 11.5% (vs. 5.3% nationwide)
- Bachelor’s degree attainment rate: 16.7% (vs. 34.3% nationwide)
3. Show Low, Arizona
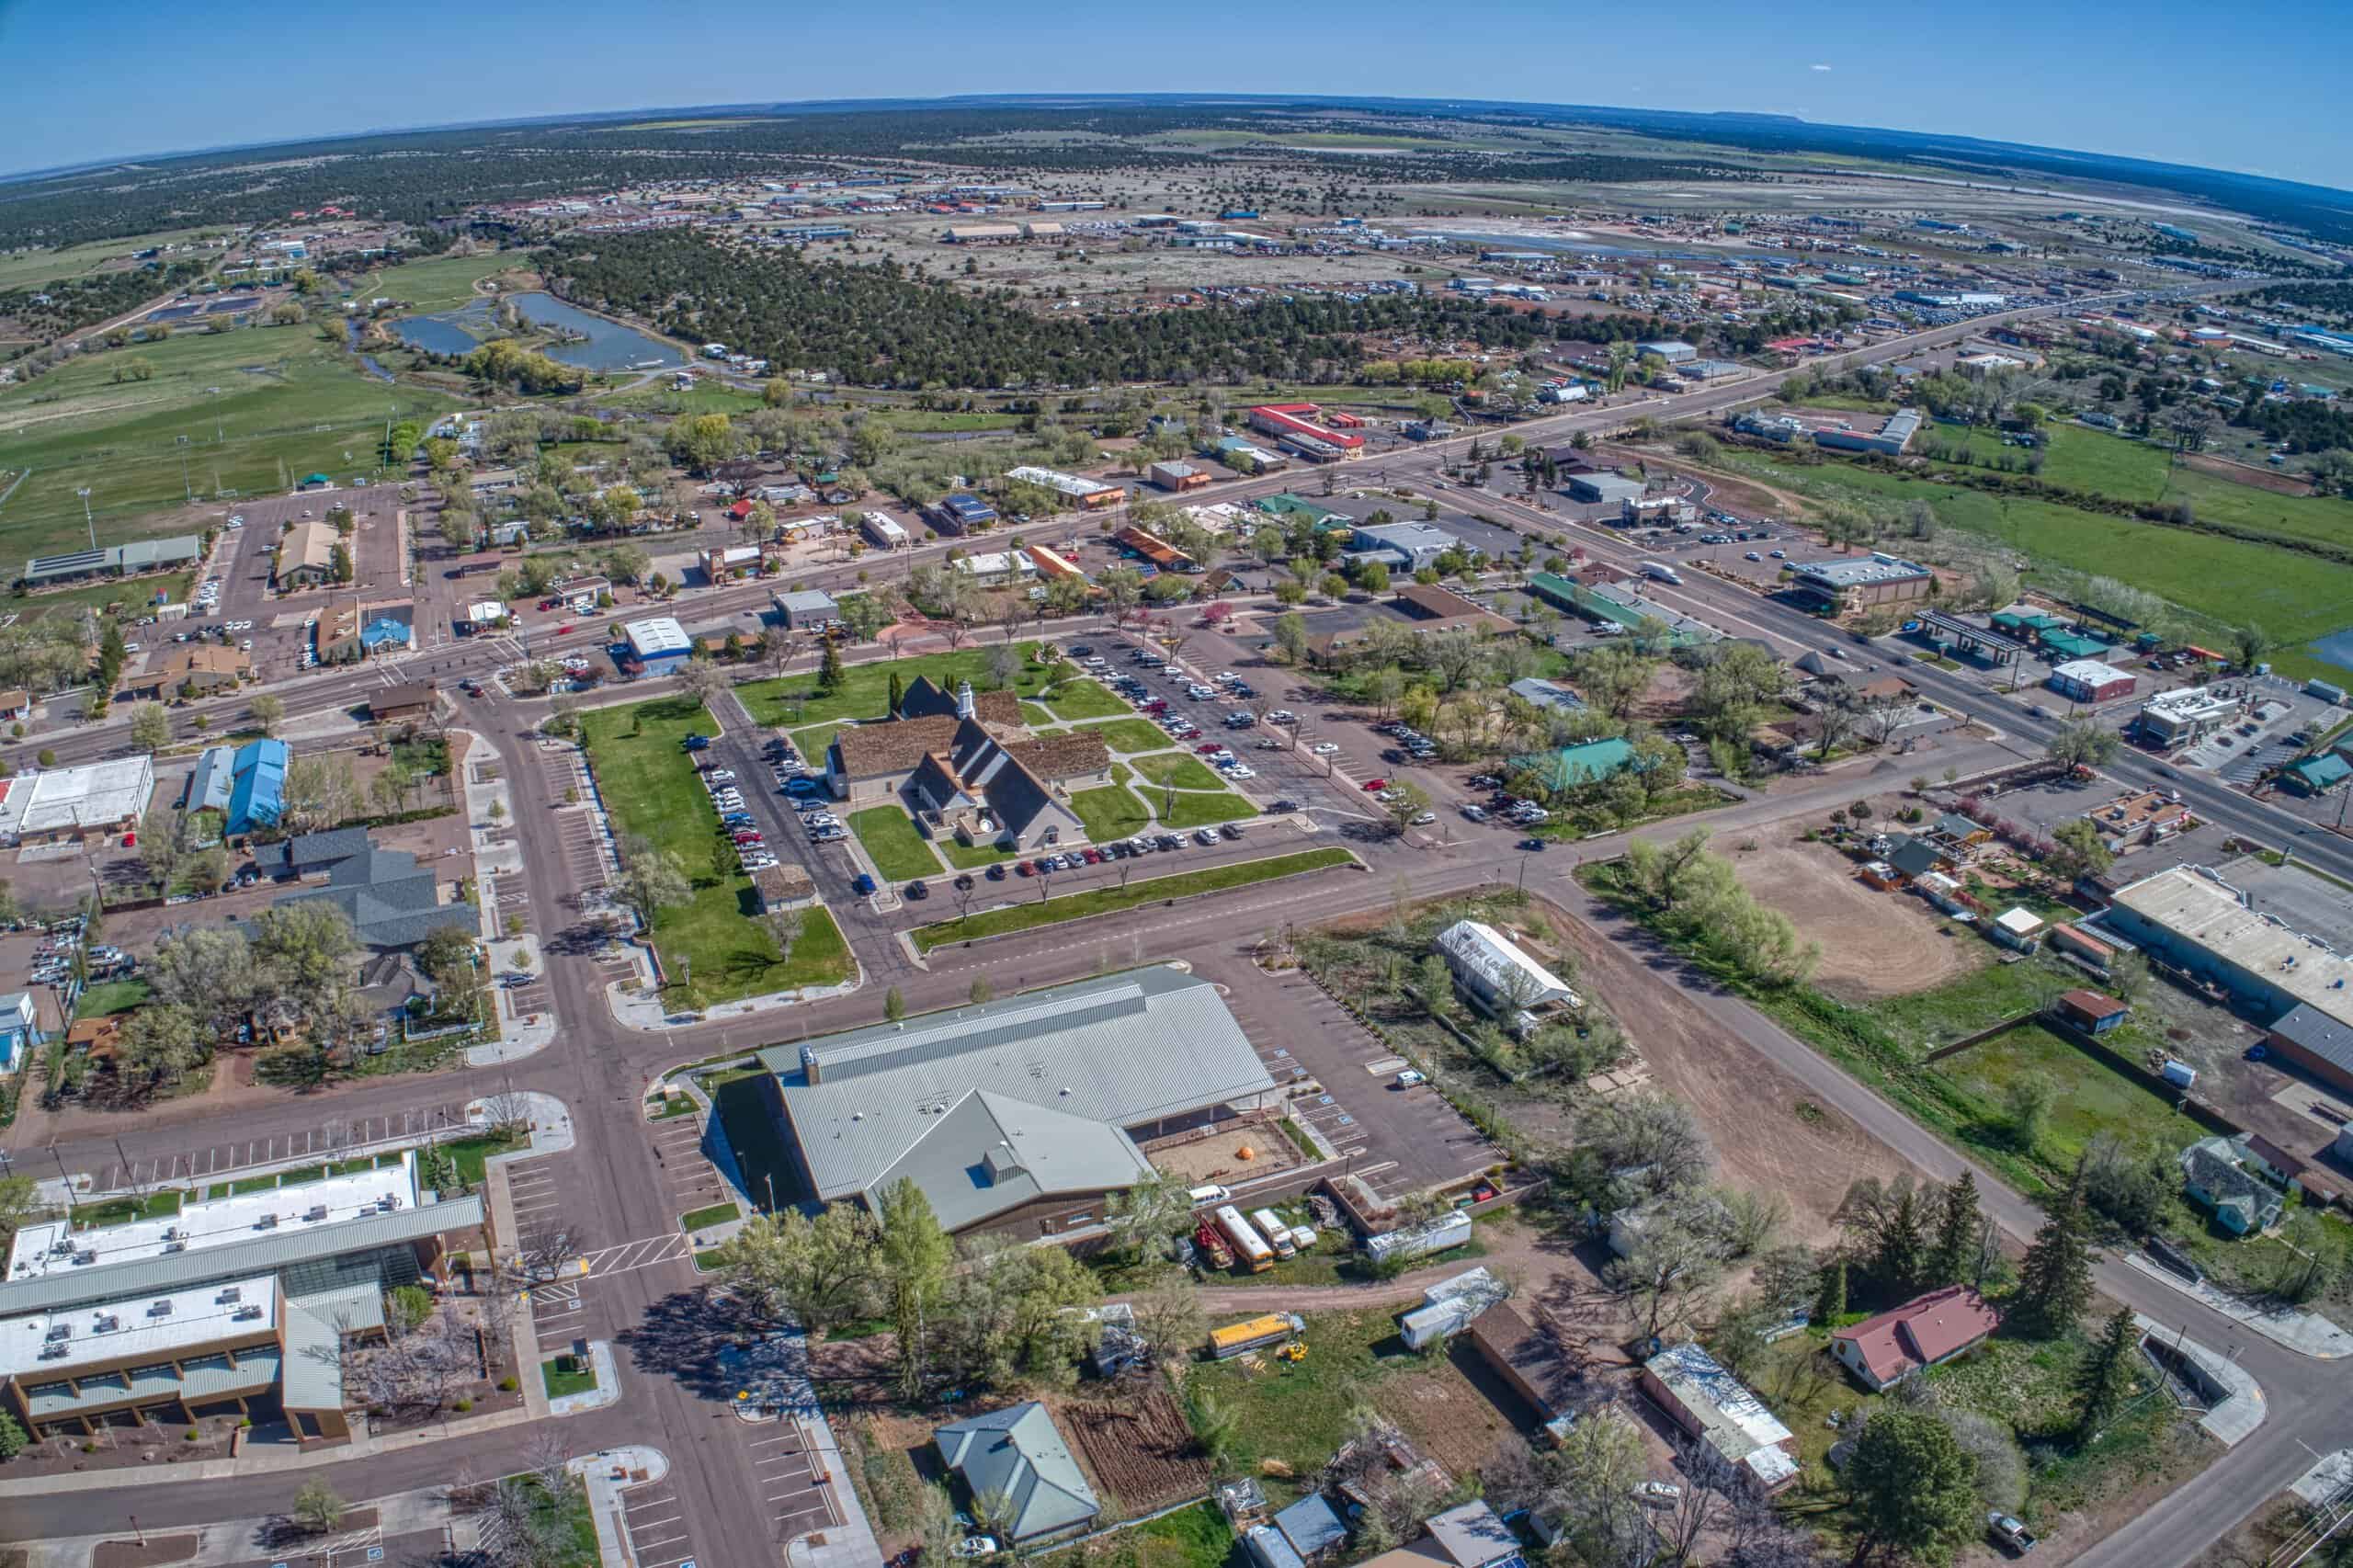
- Population change by 2100: -64.9% (from 11,732 in 2020 to 4,117 in 2100)
- Current population trend from 2000-2020: moderately increasing
- Median household income: $57,406 (vs $75,149 nationwide)
- Poverty rate: 12.6% (vs. 12.5% nationwide)
- Unemployment rate: 6.5% (vs. 5.3% nationwide)
- Bachelor’s degree attainment rate: 28.5% (vs. 34.3% nationwide)
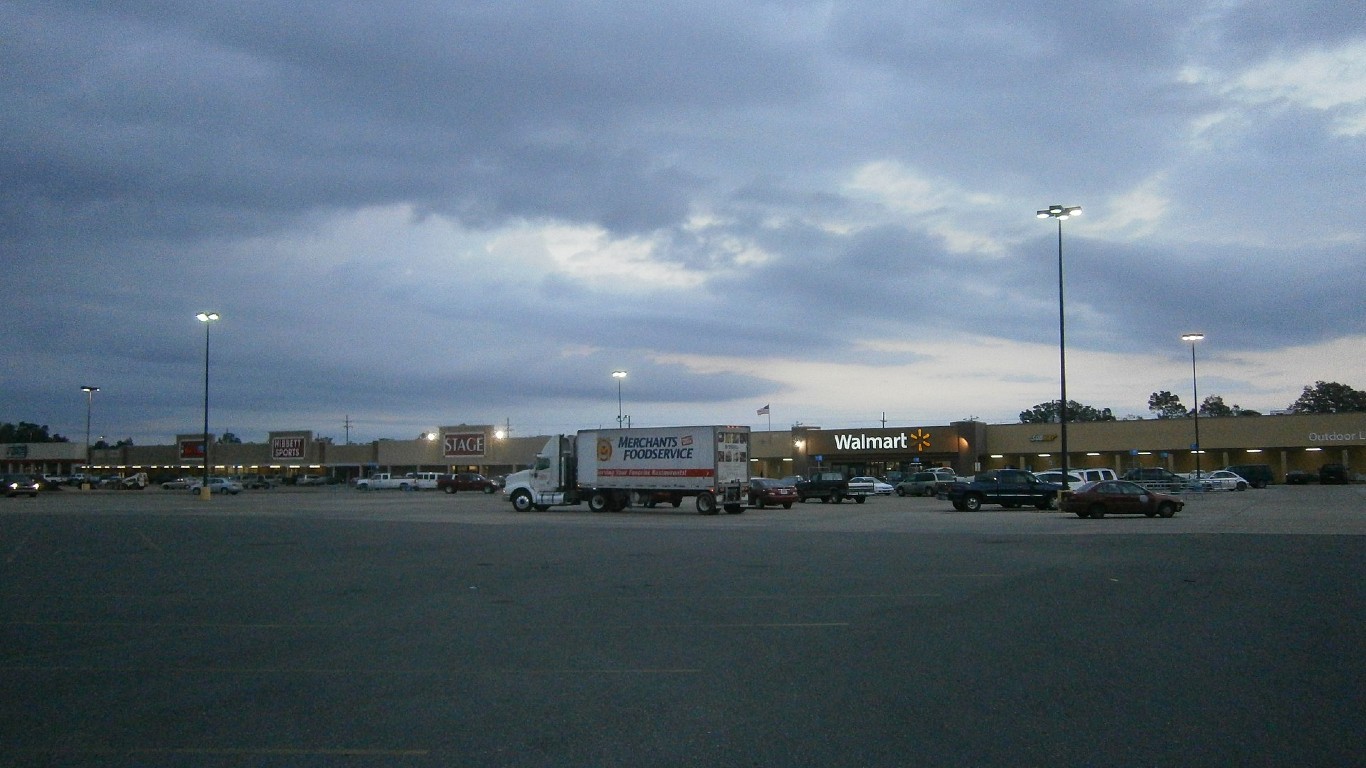
2. Greenville, Mississippi
- Population change by 2100: -67.7% (from 29,670 in 2020 to 9,594 in 2100)
- Current population trend from 2000-2020: moderately depopulating
- Median household income: $35,148 (vs $75,149 nationwide)
- Poverty rate: 32.2% (vs. 12.5% nationwide)
- Unemployment rate: 11.5% (vs. 5.3% nationwide)
- Bachelor’s degree attainment rate: 20.5% (vs. 34.3% nationwide)
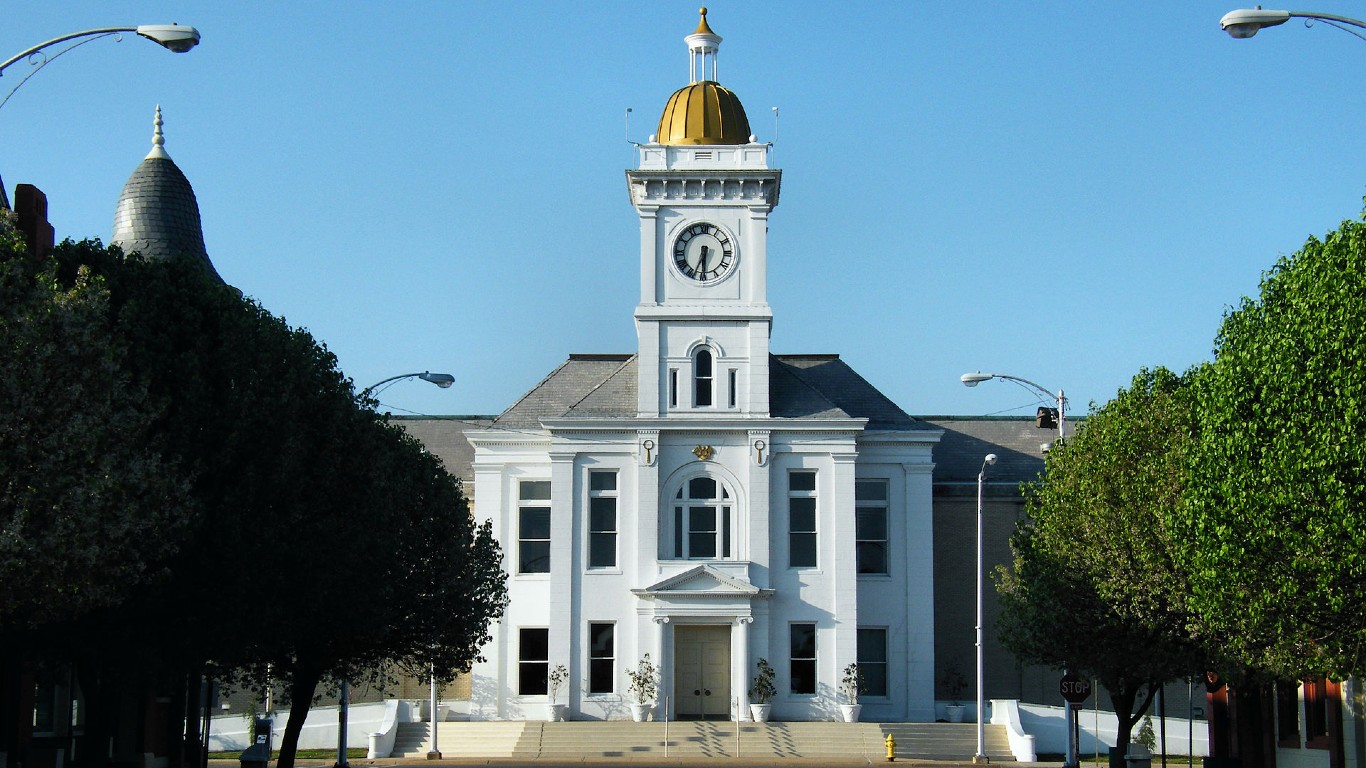
1. Pine Bluff, Arkansas

- Population change by 2100: -67.8% (from 41,253 in 2020 to 13,286 in 2100)
- Current population trend from 2000-2020: moderately depopulating
- Median household income: $39,411 (vs $75,149 nationwide)
- Poverty rate: 24.9% (vs. 12.5% nationwide)
- Unemployment rate: 9.8% (vs. 5.3% nationwide)
- Bachelor’s degree attainment rate: 22.2% (vs. 34.3% nationwide)