Working out and remaining active are important components of a healthy lifestyle. According to the Mayo Clinic, regular exercise can help control weight, fight certain diseases and conditions, promote better sleep, and improve mood. The message may be getting through as Americans appear to be exercising more every year.
Though awareness of the importance of exercise is widespread, residents of some parts of the country are much more inclined to stay physically active than others. In a handful of cities, such as Beckley, West Virginia, less than two-thirds of the adult population exercises. Meanwhile, in the most active city in the country — Boulder, Colorado — more than 90% of the adult population makes time to exercise. To determine which city populations exercise the most, 24/7 Wall St. created an index based on the share of area residents reporting regular physical activity from County Health Rankings and the number of area gyms per capita from County Business Patterns.
While it is no guarantee that people will exercise regularly, access to locations that facilitate physical activity is important for city residents. In an interview with 24/7 Wall St., Amanda Jovaag, the County Health Rankings data lead, explained that communities around the country have been working “to make it easier and safer to be active.”
Click here to see the American cities getting the most exercise.
The significant presence of exercise venues has likely helped Boulder’s population become the most active in the country. “There is strong evidence that improving access to places for physical activity increases physical activity,” Jovaag explained. Boulder boasts 20 fitness and recreation centers for every 100,000 people, roughly double the average number of facilities per capita across U.S. metro areas, and more gyms per capita than any other city.
In many of the most active cities, health outcomes tend to be better. While across the country, 27% of adults are obese, the obesity rate in Boulder is only 15%, one of the lowest obesity rates in the country. Of the 50 metro areas with residents that exercise the most, only seven have an obesity rate that exceeds the national rate.
Not only do health outcomes tend to be better in the most active cities, but residents in these cities also tend to subjectively report better health than the average American. All but six of the 50 cities that exercise the most have a smaller share of adults who report fair or poor health than the national share of 16%.
Those who maintain healthy habits such as exercising regularly are also less likely to partake in unhealthy habits. Certain measures such as smoking rates tend to be significantly lower in the most active cities than they are nationwide. Only four of the cities that exercise the most have a higher smoking rate than the 20% national figure: Carson City, Nevada; Kingston, New York; Lewiston, Idaho; and Ocean City, New Jersey.
To identify the 50 cities whose residents exercise the most, 24/7 Wall St. created an index to rank the 381 metro areas in the United States by their level of physical activity and the number of fitness and recreational sports centers per capita. For every metro area, we reviewed the percentage of adults who report engaging in no physical activity during their leisure time to determine the share of the adult population that is physically active, with data from County Health Rankings & Roadmaps, a collaboration between the Robert Wood Johnson Foundation and the University of Wisconsin Population Health Institute. The number of fitness and recreational sports centers comes from County Business Patterns, a data series produced by the U.S. Census Bureau. Obesity rates also came from County Health Rankings & Roadmaps. Smoking rates and the percentage of adults reporting fair or poor health are from the Center for Disease Control’s Behavioral Risk Factor Surveillance System. Population data come from the Census Bureau’s 2014 American Community Survey.
These are the cities that exercise the most.
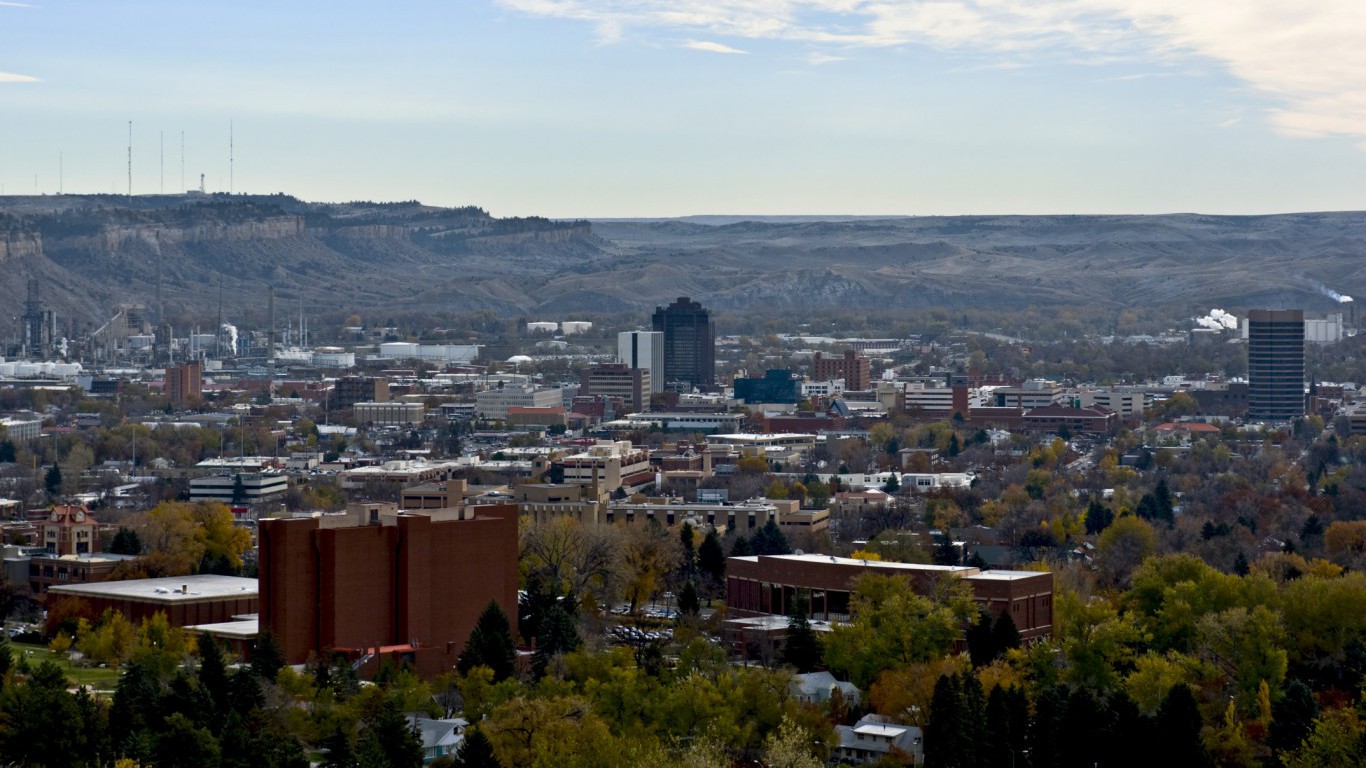
50. Billings
> State: Montana
> Population: 167,521
> Pct. of city residents reporting physical activity: 76.4%
> Fitness centers per 100,000 residents: 15
> Obesity rate: 25.7%
> Pct. of adults reporting fair/poor health: 13.2%
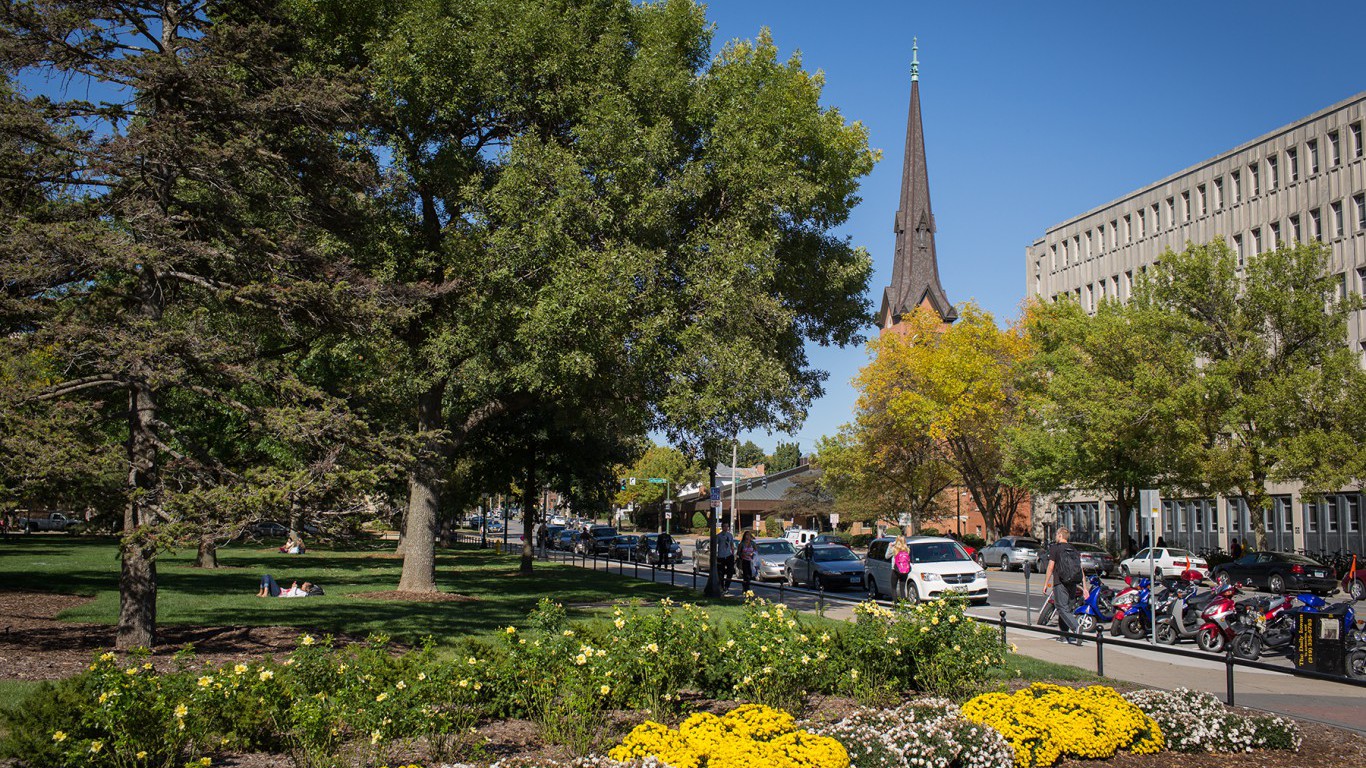
49. Iowa City
> State: Iowa
> Population: 164,357
> Pct. of city residents reporting physical activity: 82.2%
> Fitness centers per 100,000 residents: 11
> Obesity rate: 24.4%
> Pct. of adults reporting fair/poor health: 8.0%

48. Reno
> State: Nevada
> Population: 444,487
> Pct. of city residents reporting physical activity: 84.2%
> Fitness centers per 100,000 residents: 10
> Obesity rate: 22.2%
> Pct. of adults reporting fair/poor health: 15.3%
47. Sioux Falls
> State: South Dakota
> Population: 248,252
> Pct. of city residents reporting physical activity: 77.1%
> Fitness centers per 100,000 residents: 15
> Obesity rate: 27.6%
> Pct. of adults reporting fair/poor health: 9.3%

46. Medford
> State: Oregon
> Population: 210,287
> Pct. of city residents reporting physical activity: 82.6%
> Fitness centers per 100,000 residents: 11
> Obesity rate: 24.7%
> Pct. of adults reporting fair/poor health: 15.1%
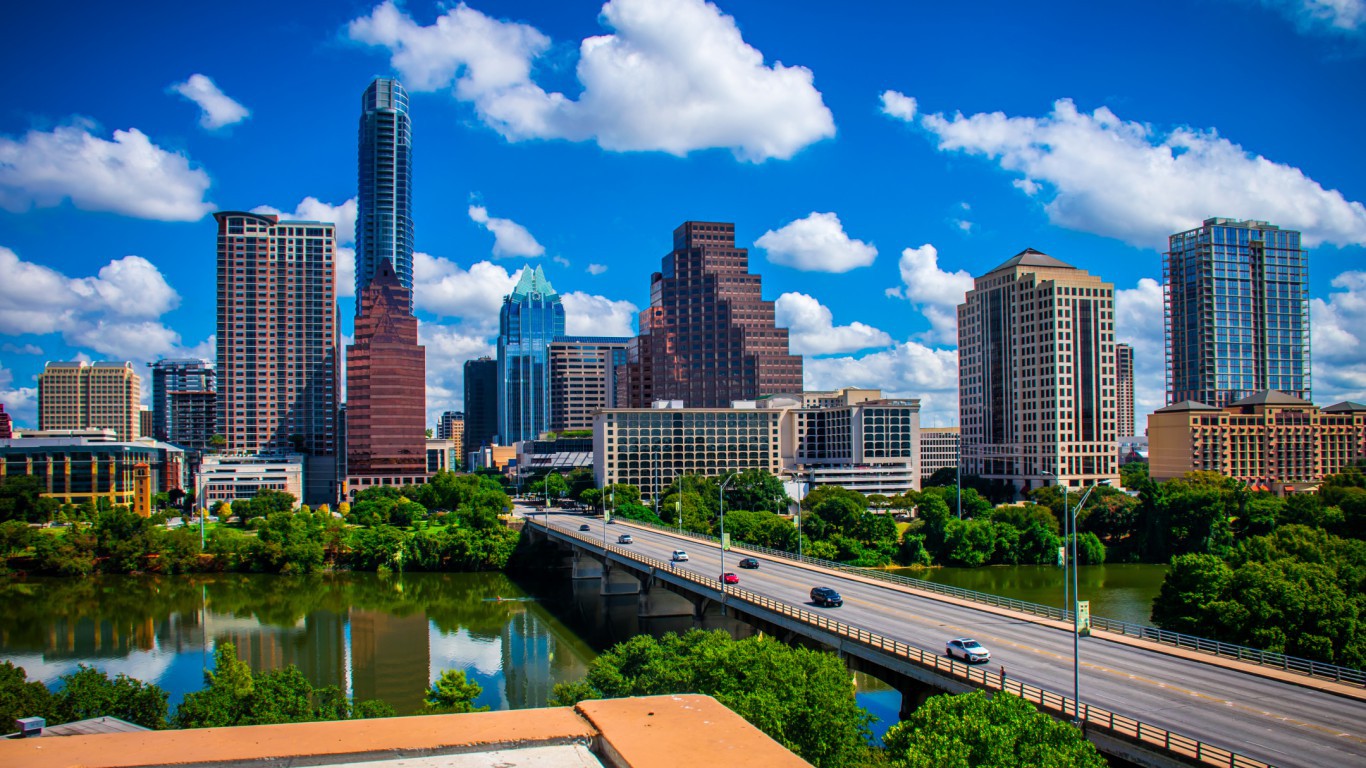
45. Austin-Round Rock
> State: Texas
> Population: 1,943,299
> Pct. of city residents reporting physical activity: 82.2%
> Fitness centers per 100,000 residents: 11
> Obesity rate: 24.1%
> Pct. of adults reporting fair/poor health: 12.9%
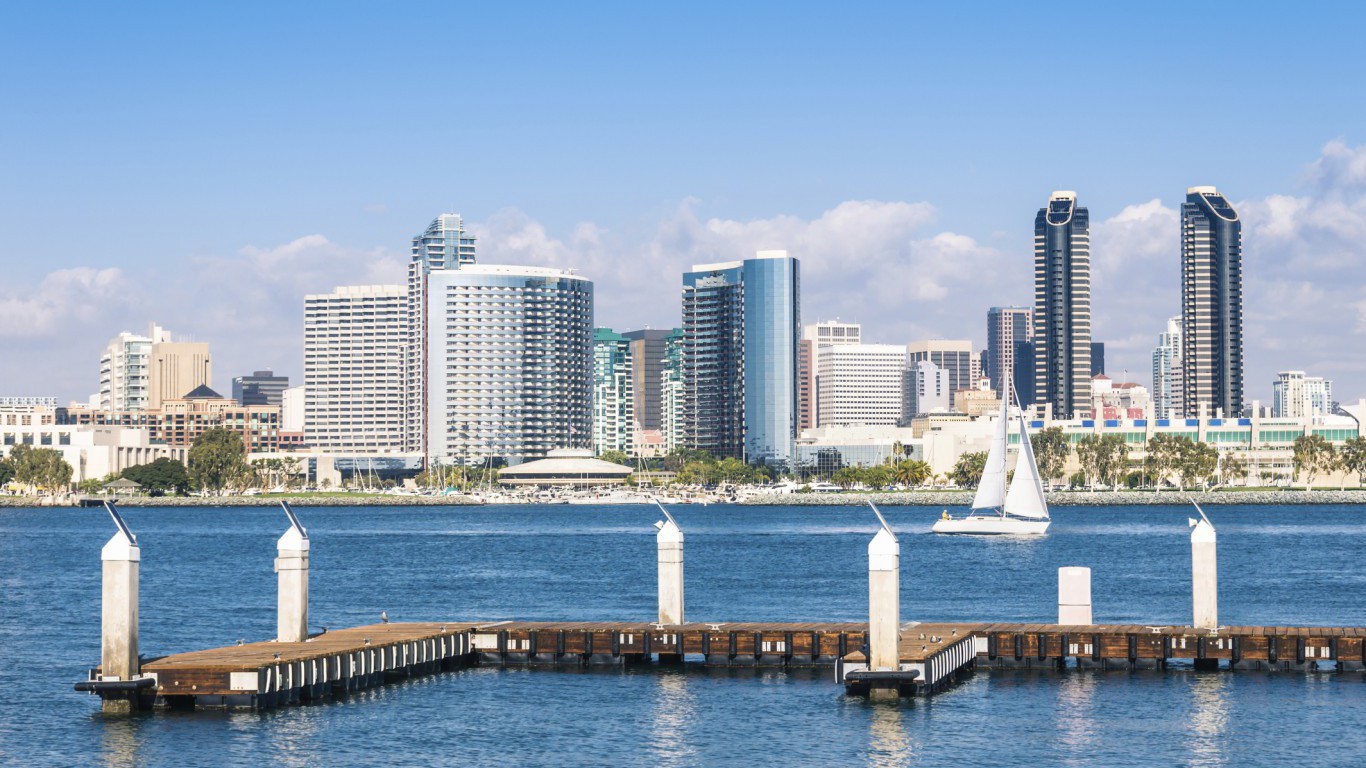
44. San Diego-Carlsbad
> State: California
> Population: 3,263,431
> Pct. of city residents reporting physical activity: 84.7%
> Fitness centers per 100,000 residents: 10
> Obesity rate: 22.6%
> Pct. of adults reporting fair/poor health: 16.0%
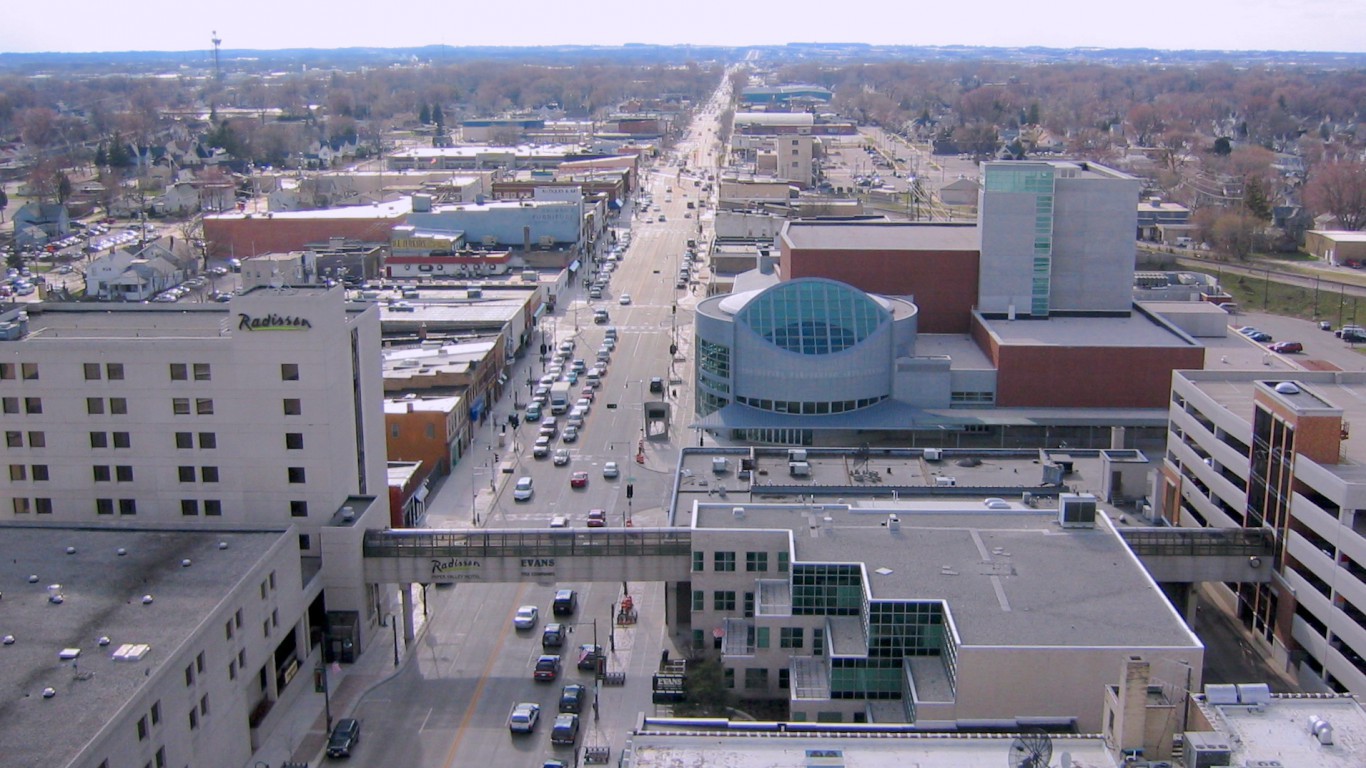
43. Appleton
> State: Wisconsin
> Population: 231,497
> Pct. of city residents reporting physical activity: 80.9%
> Fitness centers per 100,000 residents: 12
> Obesity rate: 29.7%
> Pct. of adults reporting fair/poor health: 9.4%

42. Washington-Arlington-Alexandria
> State: District of Columbia-Virginia-Maryland-West Virginia
> Population: 6,032,744
> Pct. of city residents reporting physical activity: 81.3%
> Fitness centers per 100,000 residents: 12
> Obesity rate: 24.4%
> Pct. of adults reporting fair/poor health: 11.6%
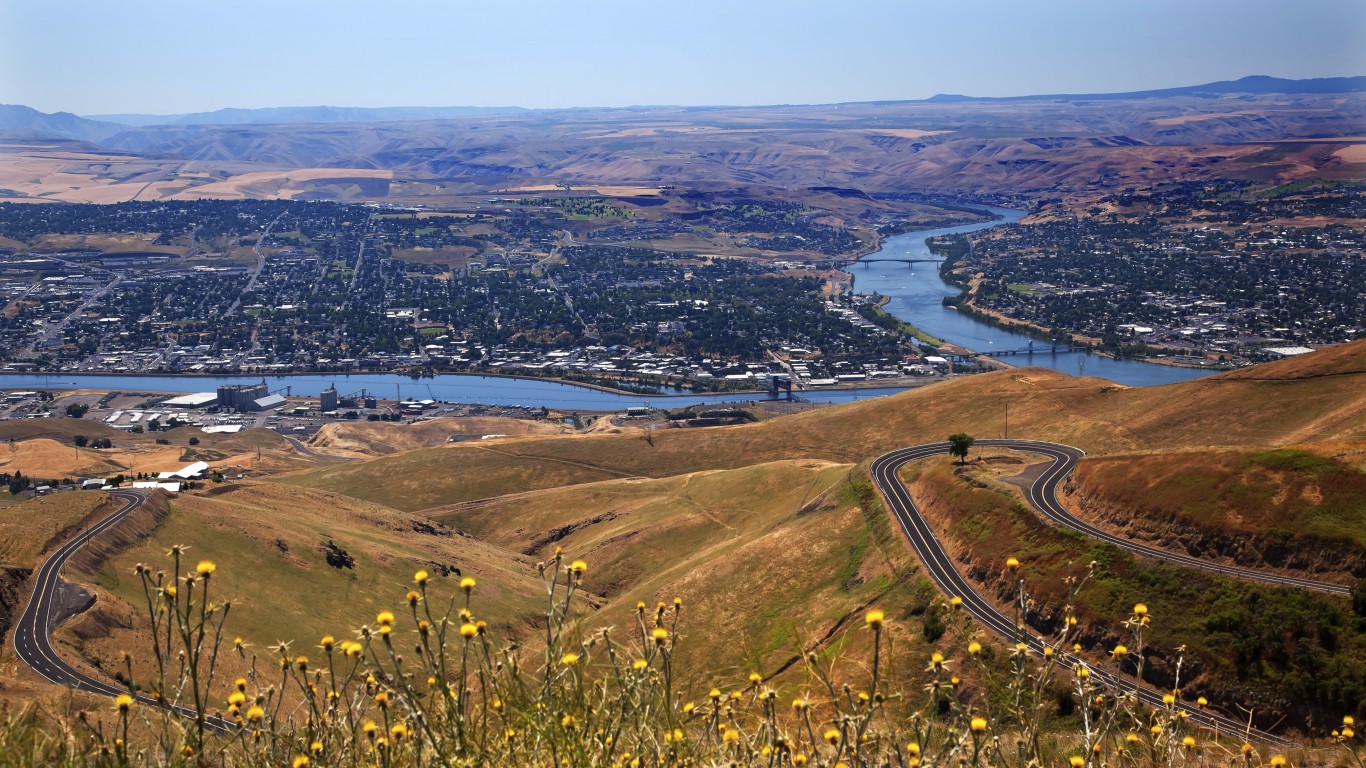
41. Lewiston
> State: Idaho-Washington
> Population: 62,196
> Pct. of city residents reporting physical activity: 77.7%
> Fitness centers per 100,000 residents: 14
> Obesity rate: 31.0%
> Pct. of adults reporting fair/poor health: 17.1%
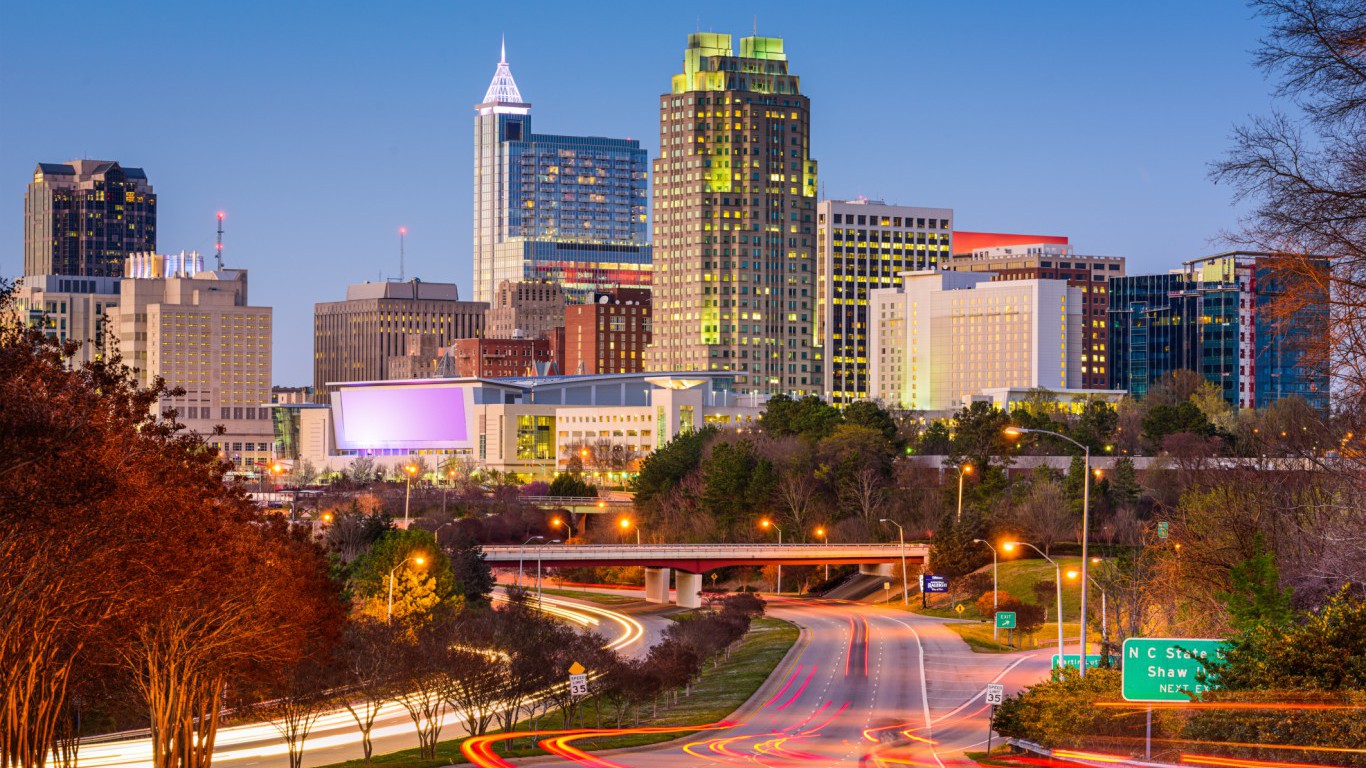
40. Raleigh
> State: North Carolina
> Population: 1,242,974
> Pct. of city residents reporting physical activity: 80.1%
> Fitness centers per 100,000 residents: 13
> Obesity rate: 27.0%
> Pct. of adults reporting fair/poor health: 14.6%
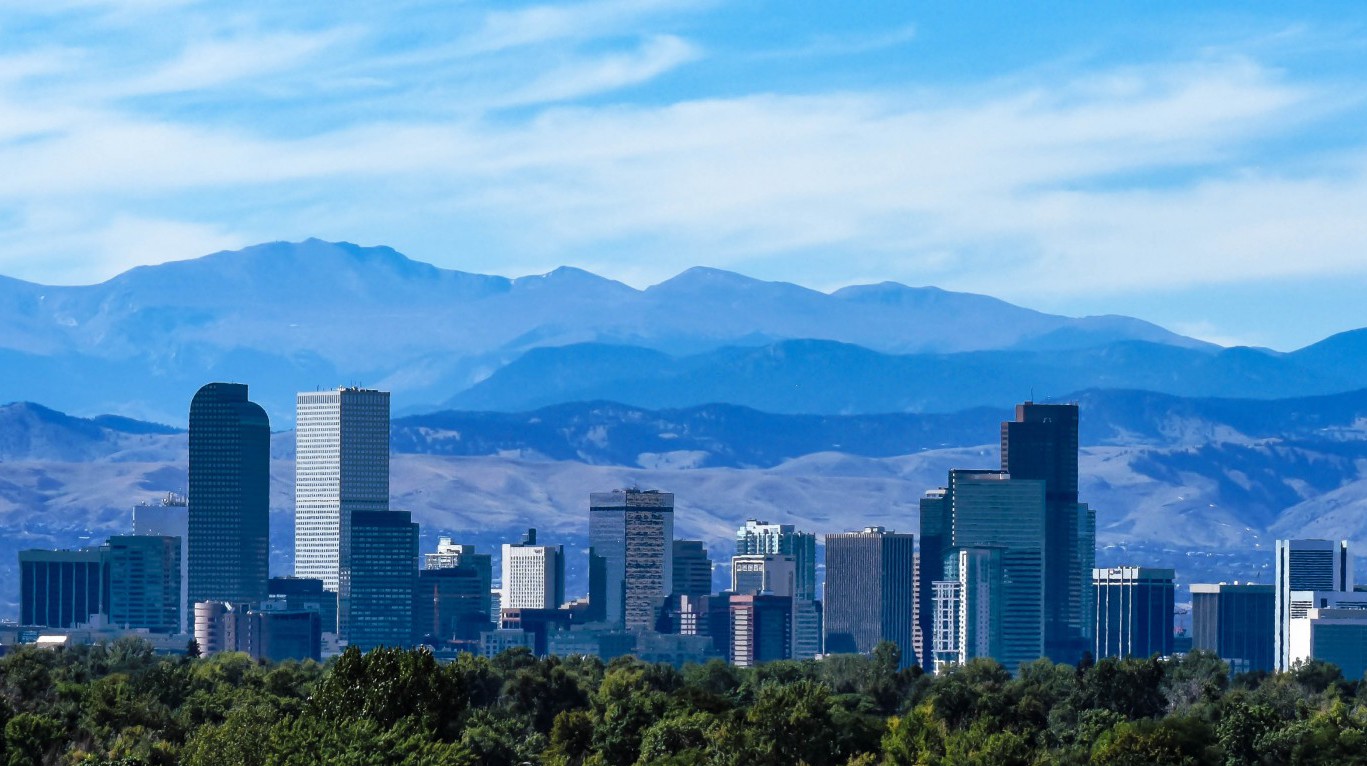
39. Denver-Aurora-Lakewood
> State: Colorado
> Population: 2,754,258
> Pct. of city residents reporting physical activity: 85.1%
> Fitness centers per 100,000 residents: 10
> Obesity rate: 19.9%
> Pct. of adults reporting fair/poor health: 12.2%
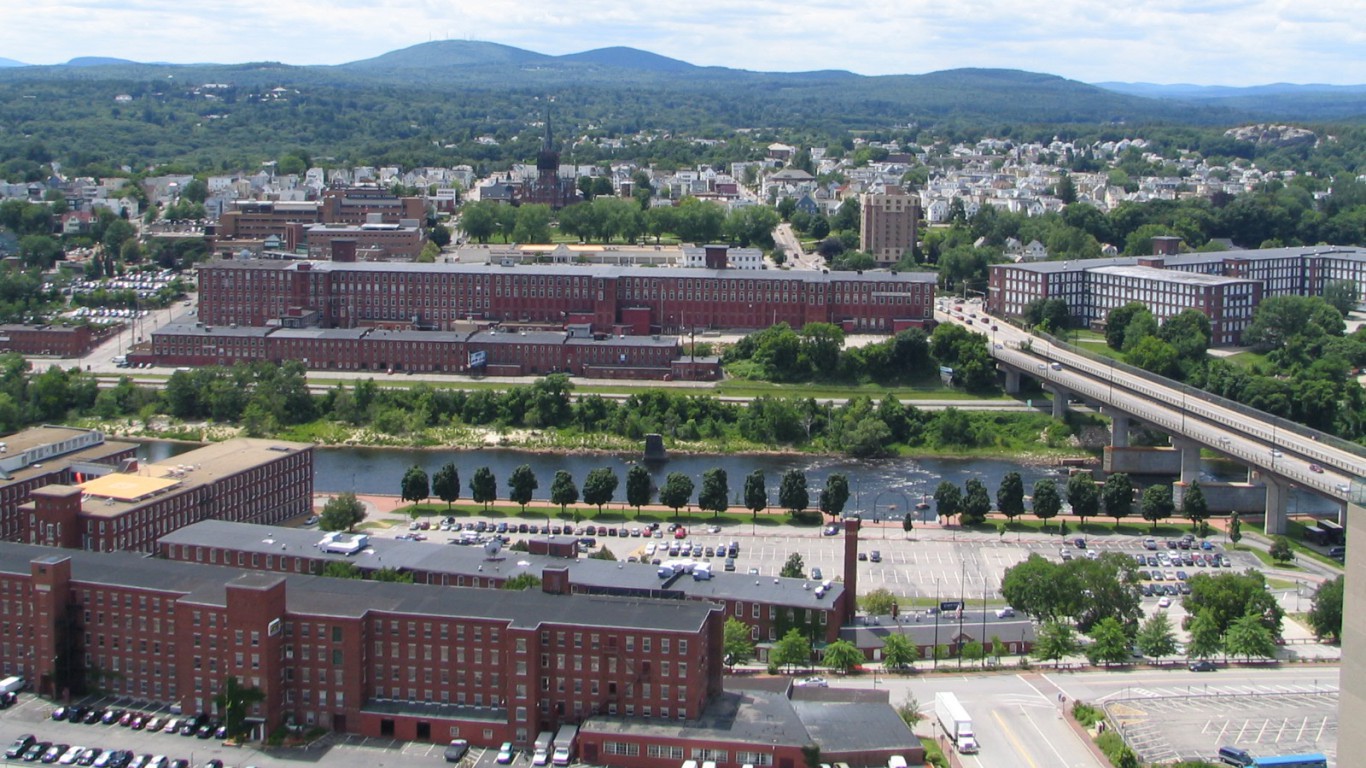
38. Manchester-Nashua
> State: New Hampshire
> Population: 405,184
> Pct. of city residents reporting physical activity: 78.8%
> Fitness centers per 100,000 residents: 14
> Obesity rate: 27.2%
> Pct. of adults reporting fair/poor health: 11.1%

37. Santa Fe
> State: New Mexico
> Population: 148,164
> Pct. of city residents reporting physical activity: 88.1%
> Fitness centers per 100,000 residents: 9
> Obesity rate: 14.2%
> Pct. of adults reporting fair/poor health: 14.5%
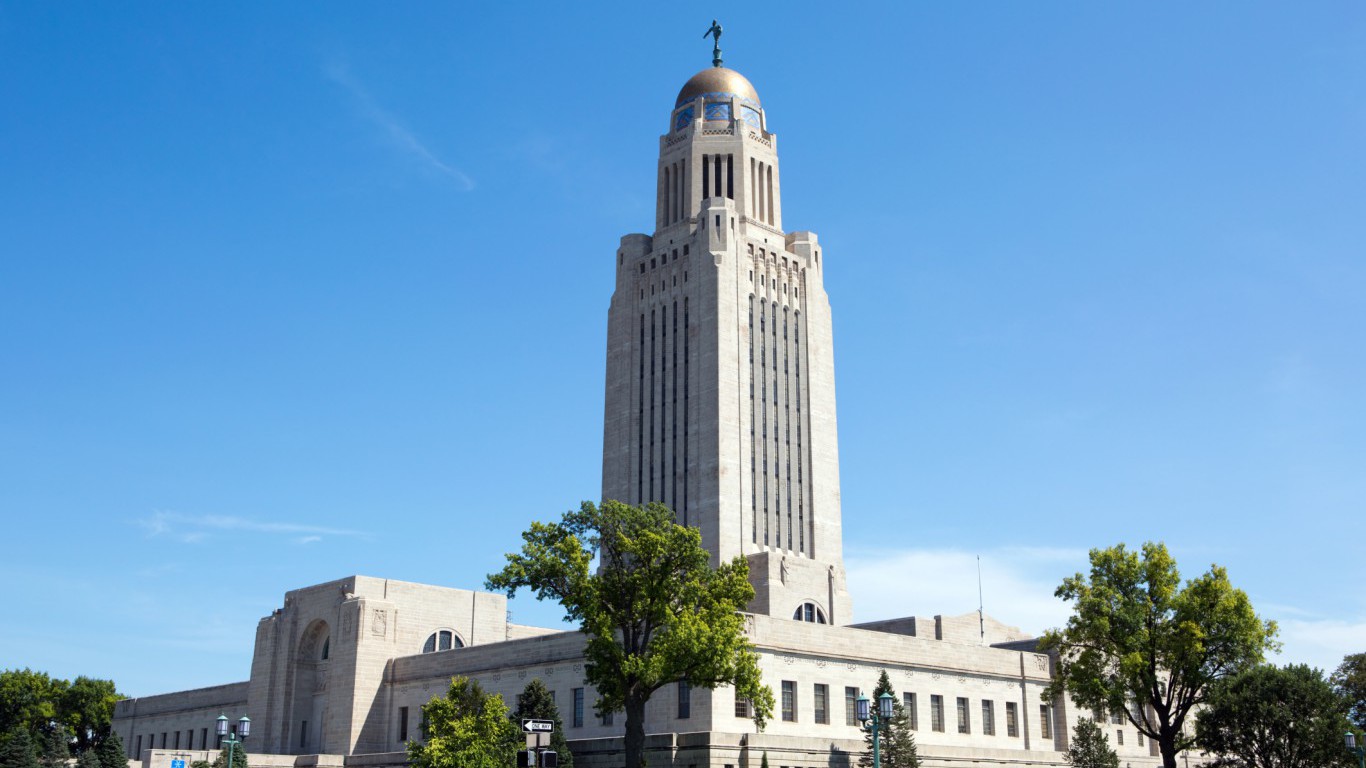
36. Lincoln
> State: Nebraska
> Population: 320,227
> Pct. of city residents reporting physical activity: 81.0%
> Fitness centers per 100,000 residents: 12
> Obesity rate: 26.4%
> Pct. of adults reporting fair/poor health: 9.7%
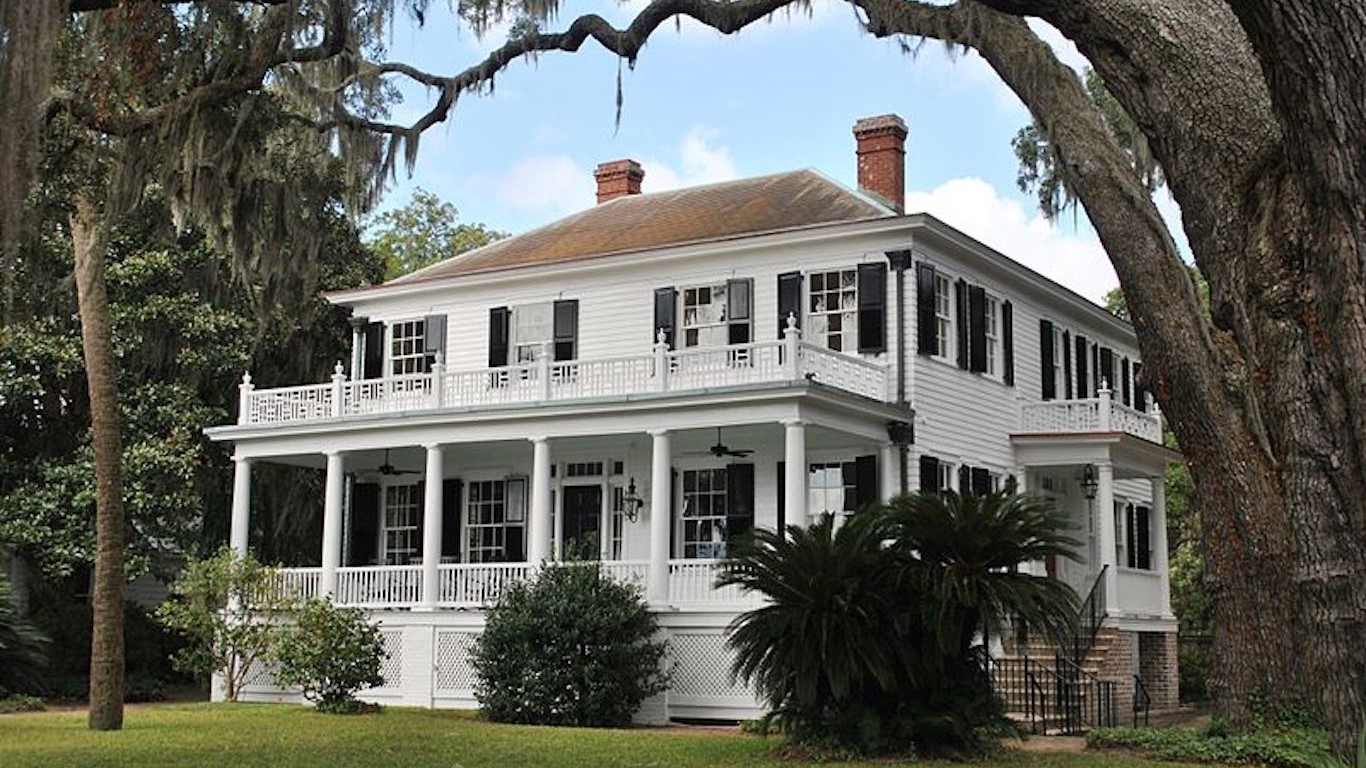
35. Hilton Head Island-Bluffton-Beaufort
> State: South Carolina
> Population: 203,022
> Pct. of city residents reporting physical activity: 82.3%
> Fitness centers per 100,000 residents: 12
> Obesity rate: 24.3%
> Pct. of adults reporting fair/poor health: 10.9%
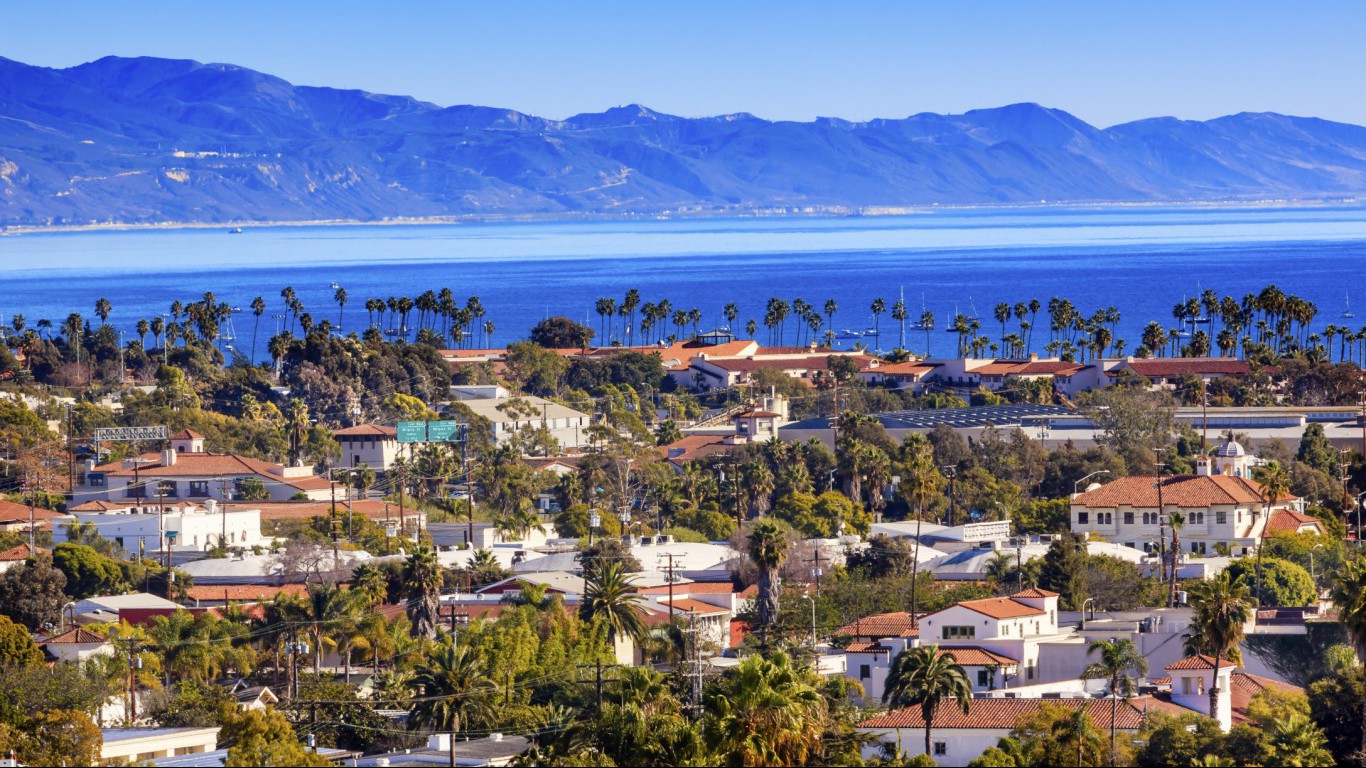
34. Santa Maria-Santa Barbara
> State: California
> Population: 440,668
> Pct. of city residents reporting physical activity: 86.1%
> Fitness centers per 100,000 residents: 10
> Obesity rate: 19.4%
> Pct. of adults reporting fair/poor health: 21.0%
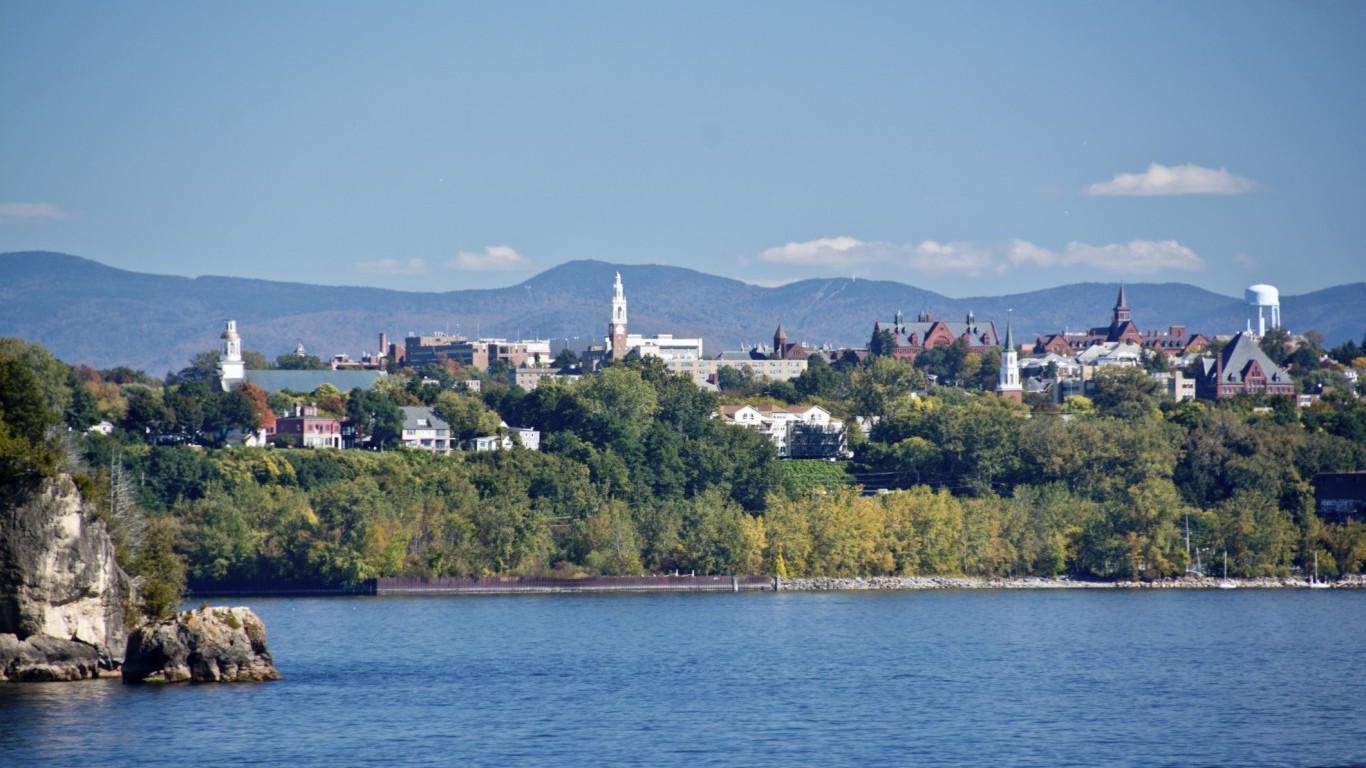
33. Burlington-South Burlington
> State: Vermont
> Population: 215,824
> Pct. of city residents reporting physical activity: 83.6%
> Fitness centers per 100,000 residents: 12
> Obesity rate: 23.0%
> Pct. of adults reporting fair/poor health: 9.1%
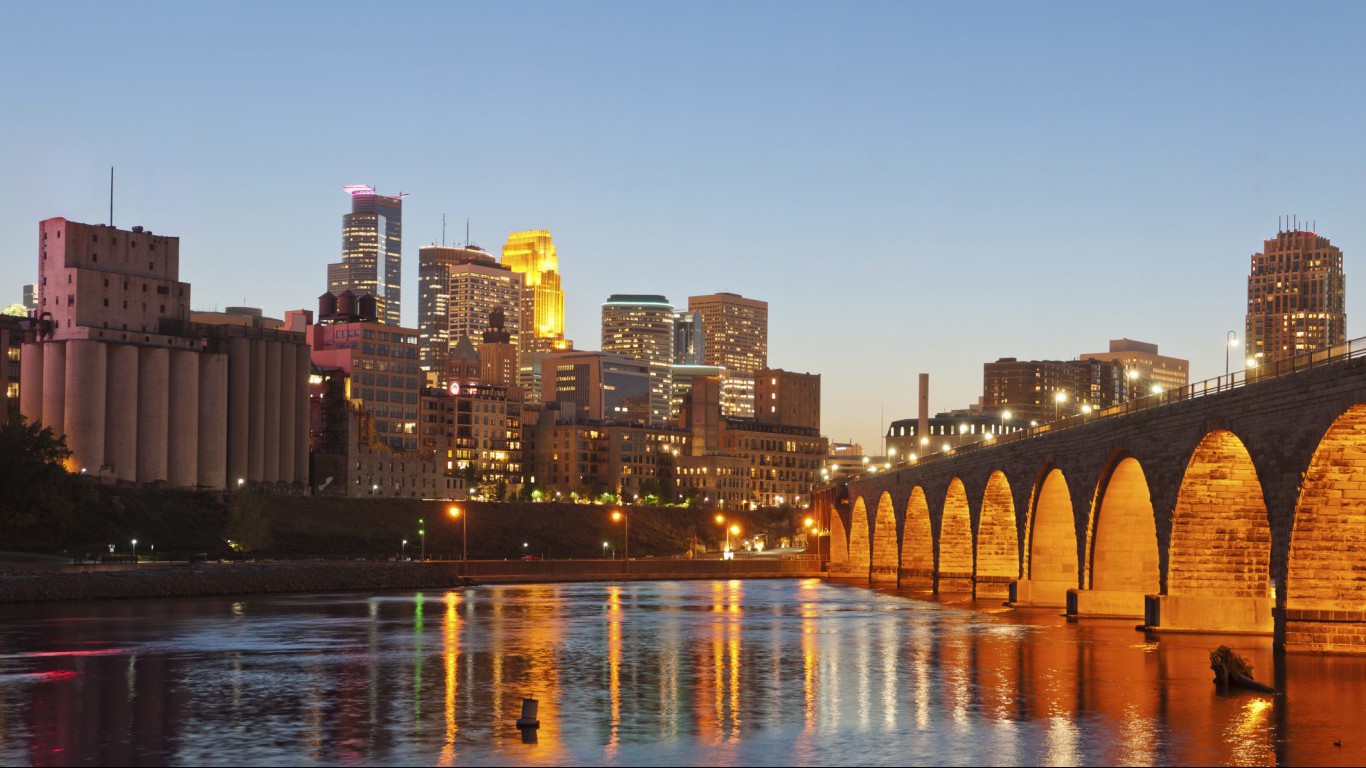
32. Minneapolis-St. Paul-Bloomington
> State: Minnesota
> Population: 3,495,176
> Pct. of city residents reporting physical activity: 82.1%
> Fitness centers per 100,000 residents: 12
> Obesity rate: 25.0%
> Pct. of adults reporting fair/poor health: 9.9%
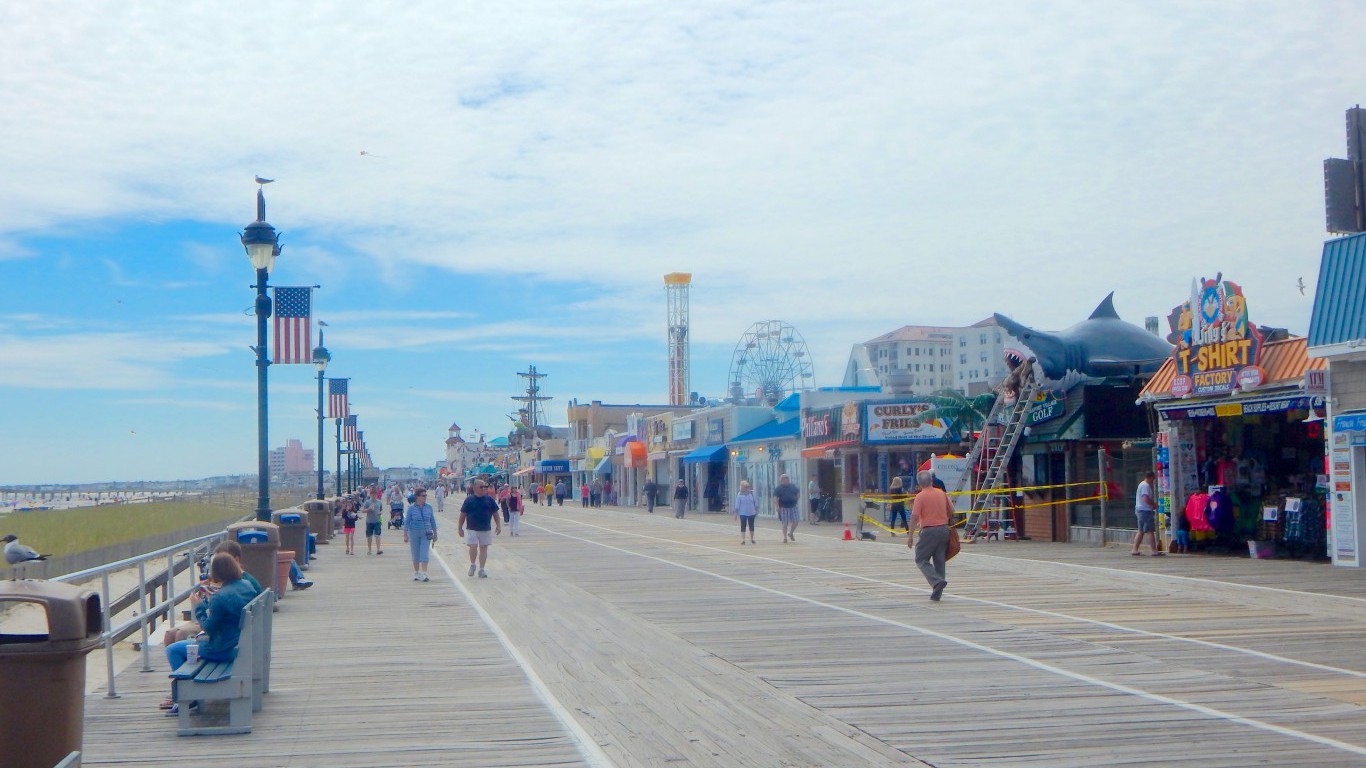
31. Ocean City
> State: New Jersey
> Population: 95,344
> Pct. of city residents reporting physical activity: 76.6%
> Fitness centers per 100,000 residents: 17
> Obesity rate: 26.3%
> Pct. of adults reporting fair/poor health: 13.5%
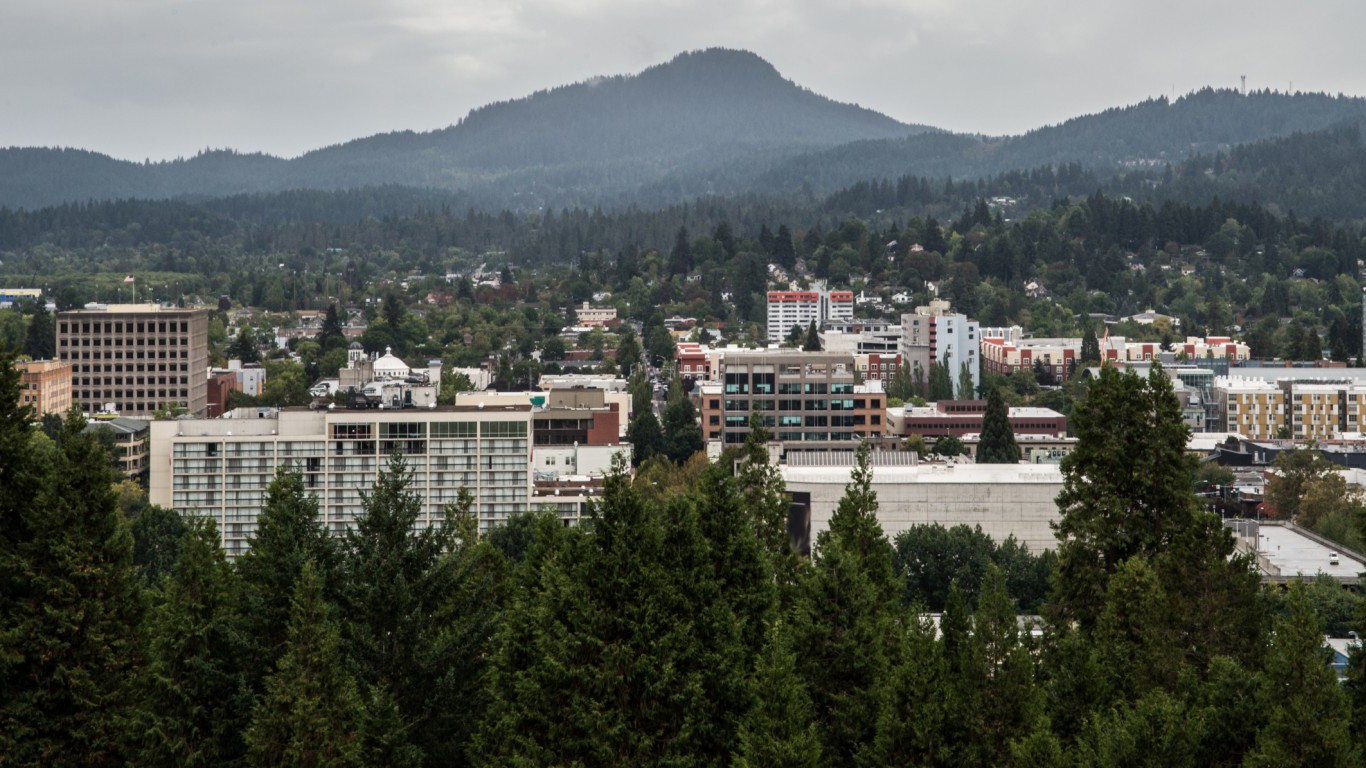
30. Eugene
> State: Oregon
> Population: 358,337
> Pct. of city residents reporting physical activity: 84.8%
> Fitness centers per 100,000 residents: 11
> Obesity rate: 28.1%
> Pct. of adults reporting fair/poor health: 14.2%
29. Durham-Chapel Hill
> State: North Carolina
> Population: 542,710
> Pct. of city residents reporting physical activity: 80.0%
> Fitness centers per 100,000 residents: 14
> Obesity rate: 26.8%
> Pct. of adults reporting fair/poor health: 15.4%
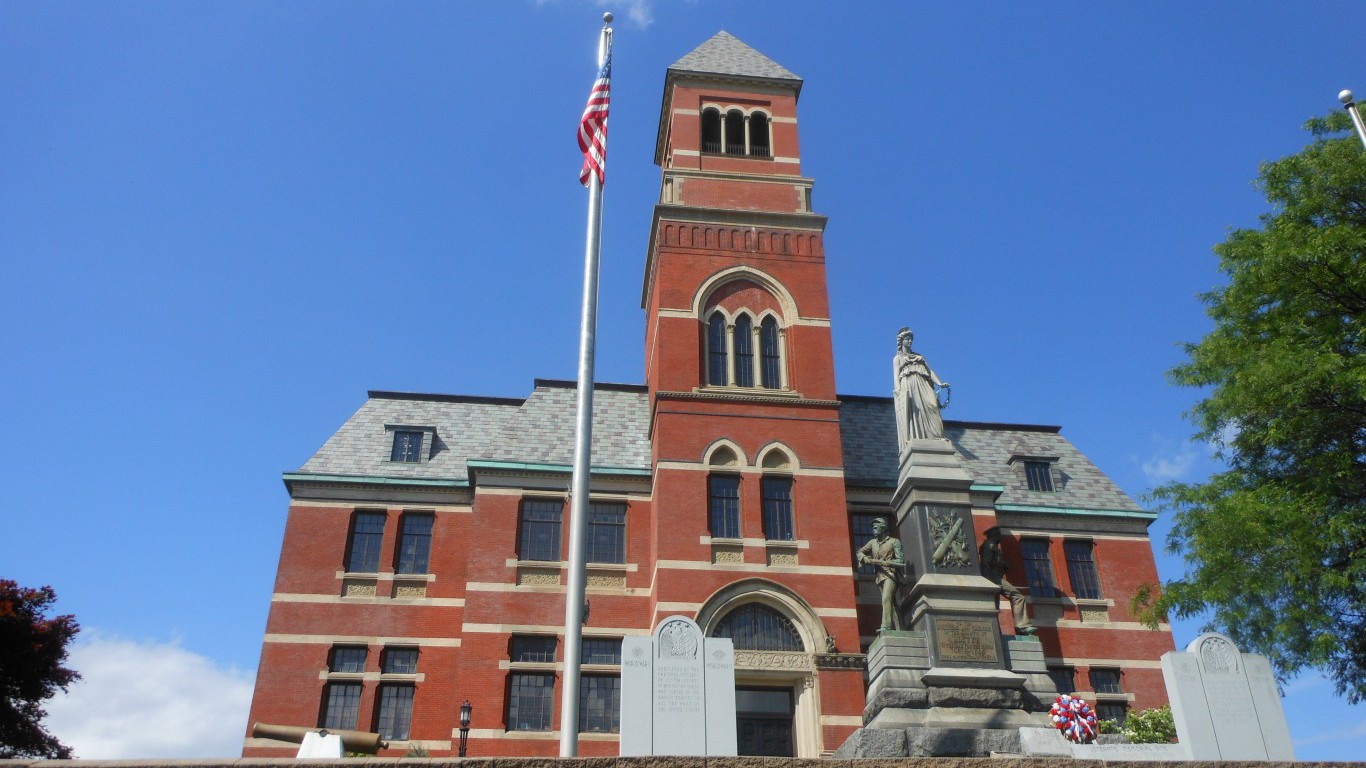
28. Kingston
> State: New York
> Population: 180,445
> Pct. of city residents reporting physical activity: 81.3%
> Fitness centers per 100,000 residents: 13
> Obesity rate: 27.0%
> Pct. of adults reporting fair/poor health: 12.1%
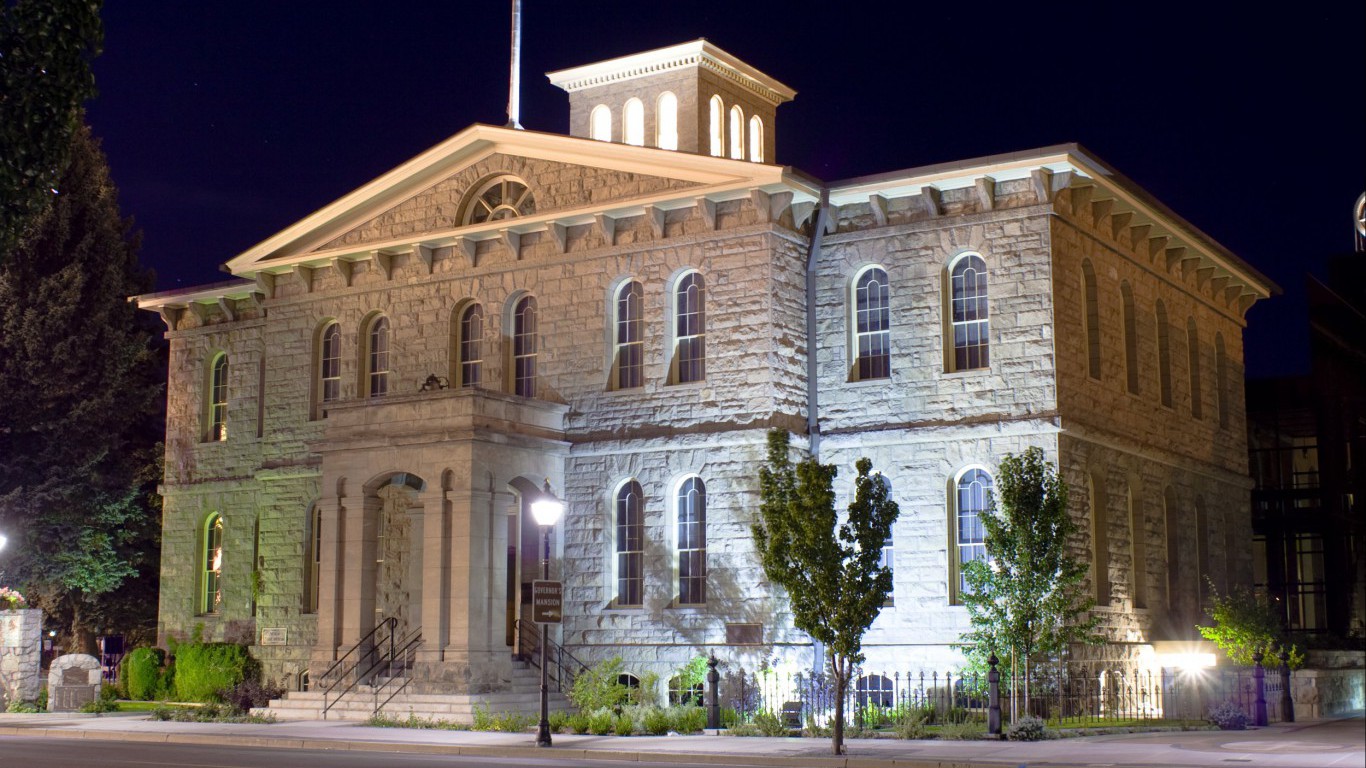
27. Carson City
> State: Nevada
> Population: 54,522
> Pct. of city residents reporting physical activity: 82.1%
> Fitness centers per 100,000 residents: 13
> Obesity rate: 23.0%
> Pct. of adults reporting fair/poor health: 17.7%
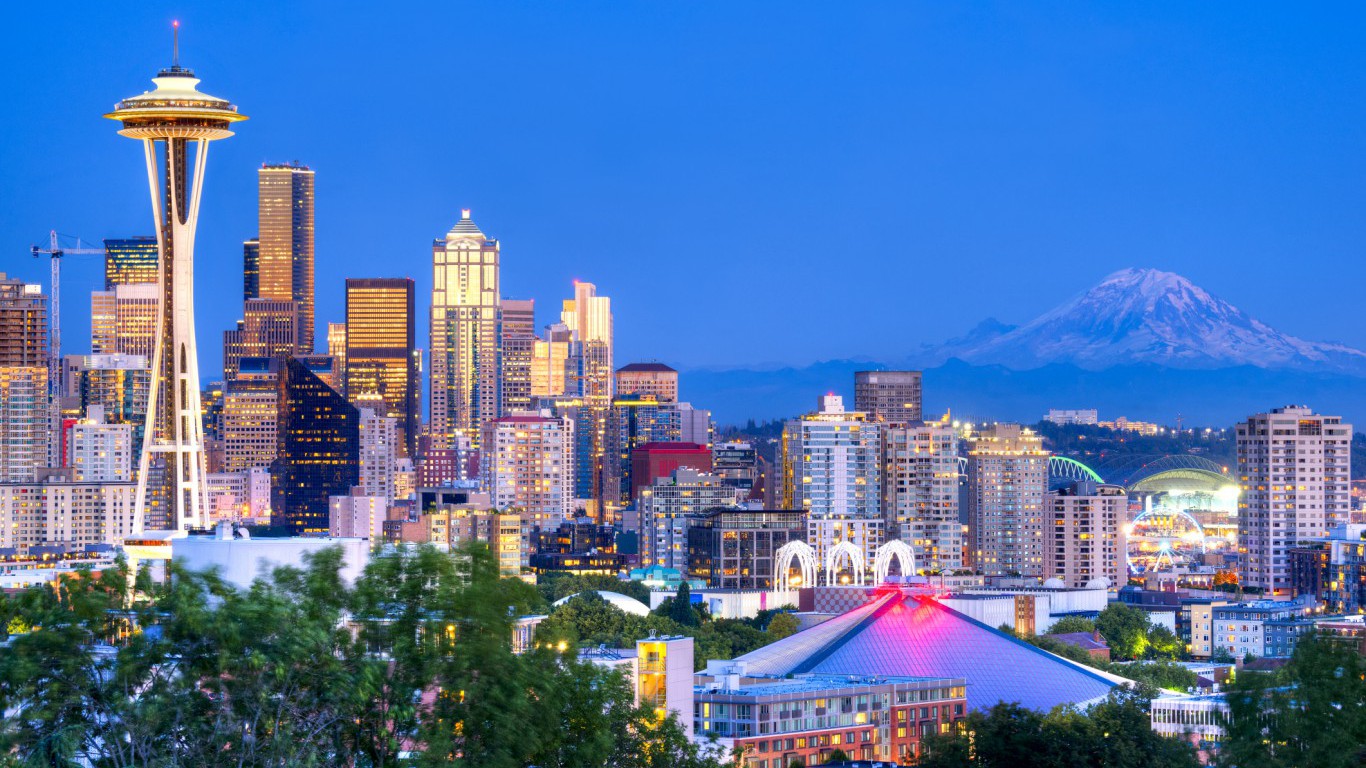
26. Seattle-Tacoma-Bellevue
> State: Washington
> Population: 3,671,478
> Pct. of city residents reporting physical activity: 83.3%
> Fitness centers per 100,000 residents: 12
> Obesity rate: 25.5%
> Pct. of adults reporting fair/poor health: 12.1%
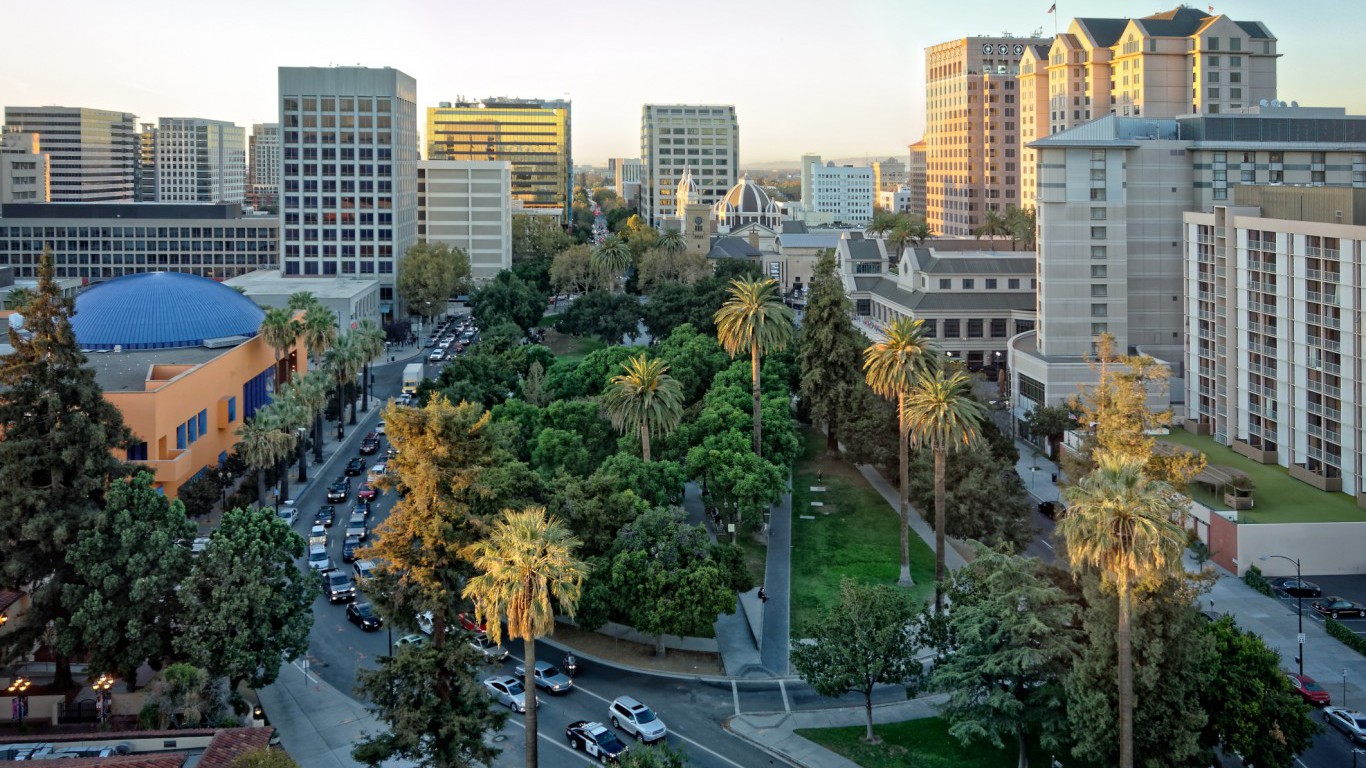
25. San Jose-Sunnyvale-Santa Clara
> State: California
> Population: 1,952,872
> Pct. of city residents reporting physical activity: 84.5%
> Fitness centers per 100,000 residents: 12
> Obesity rate: 20.5%
> Pct. of adults reporting fair/poor health: 13.7%

24. San Francisco-Oakland-Hayward
> State: California
> Population: 4,594,060
> Pct. of city residents reporting physical activity: 84.8%
> Fitness centers per 100,000 residents: 12
> Obesity rate: 19.8%
> Pct. of adults reporting fair/poor health: 13.9%
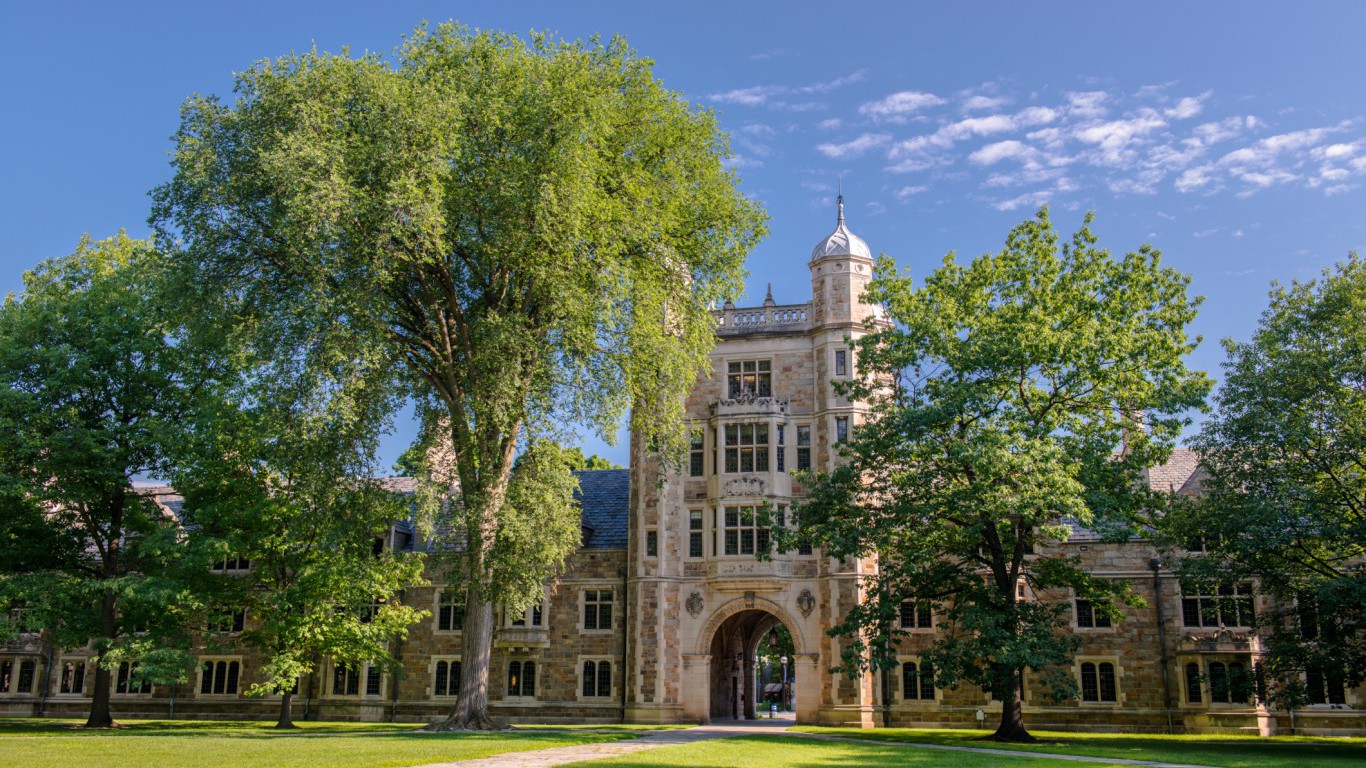
23. Ann Arbor
> State: Michigan
> Population: 356,874
> Pct. of city residents reporting physical activity: 83.0%
> Fitness centers per 100,000 residents: 13
> Obesity rate: 23.6%
> Pct. of adults reporting fair/poor health: 9.6%

22. Portland-South Portland
> State: Maine
> Population: 523,552
> Pct. of city residents reporting physical activity: 82.5%
> Fitness centers per 100,000 residents: 13
> Obesity rate: 24.0%
> Pct. of adults reporting fair/poor health: 10.7%
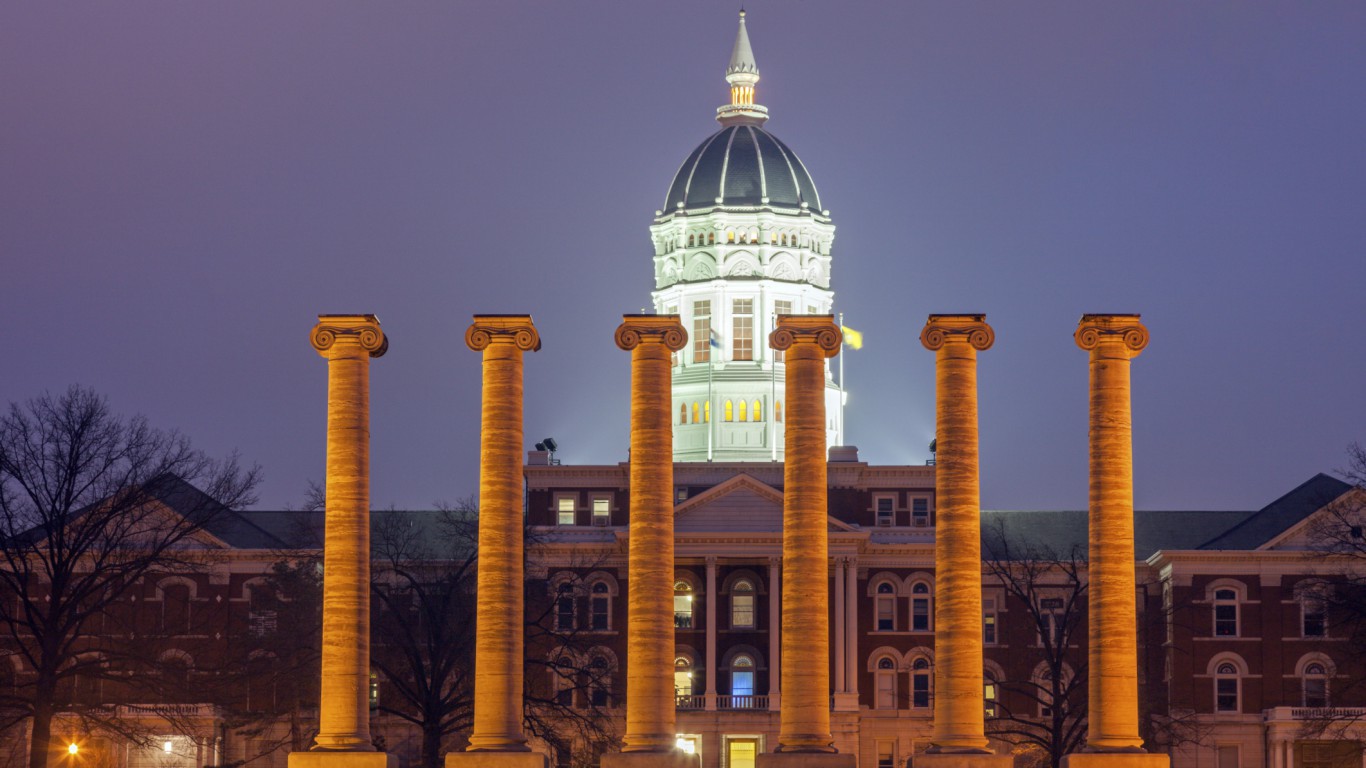
21. Columbia
> State: Missouri
> Population: 172,717
> Pct. of city residents reporting physical activity: 79.0%
> Fitness centers per 100,000 residents: 16
> Obesity rate: 24.2%
> Pct. of adults reporting fair/poor health: 10.8%
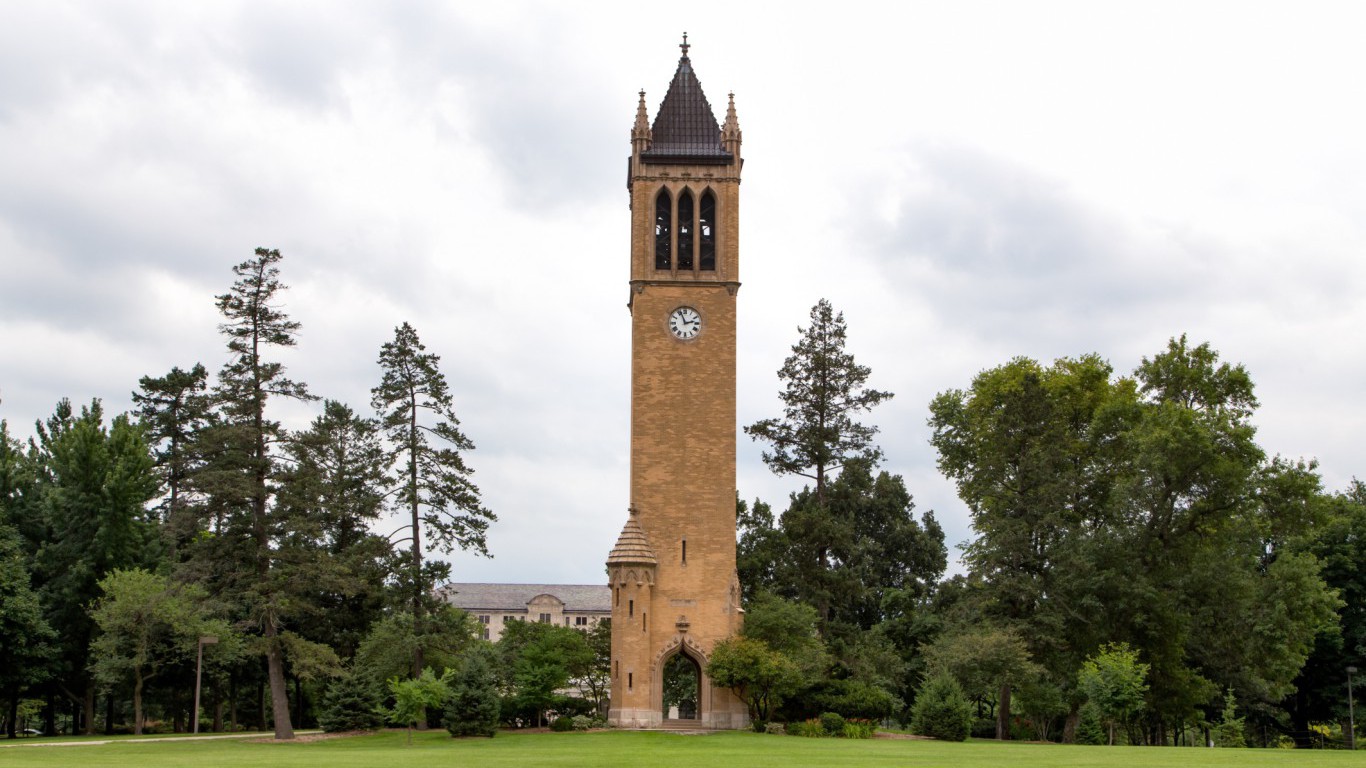
20. Ames
> State: Iowa
> Population: 94,073
> Pct. of city residents reporting physical activity: 80.6%
> Fitness centers per 100,000 residents: 15
> Obesity rate: 25.4%
> Pct. of adults reporting fair/poor health: 6.4%
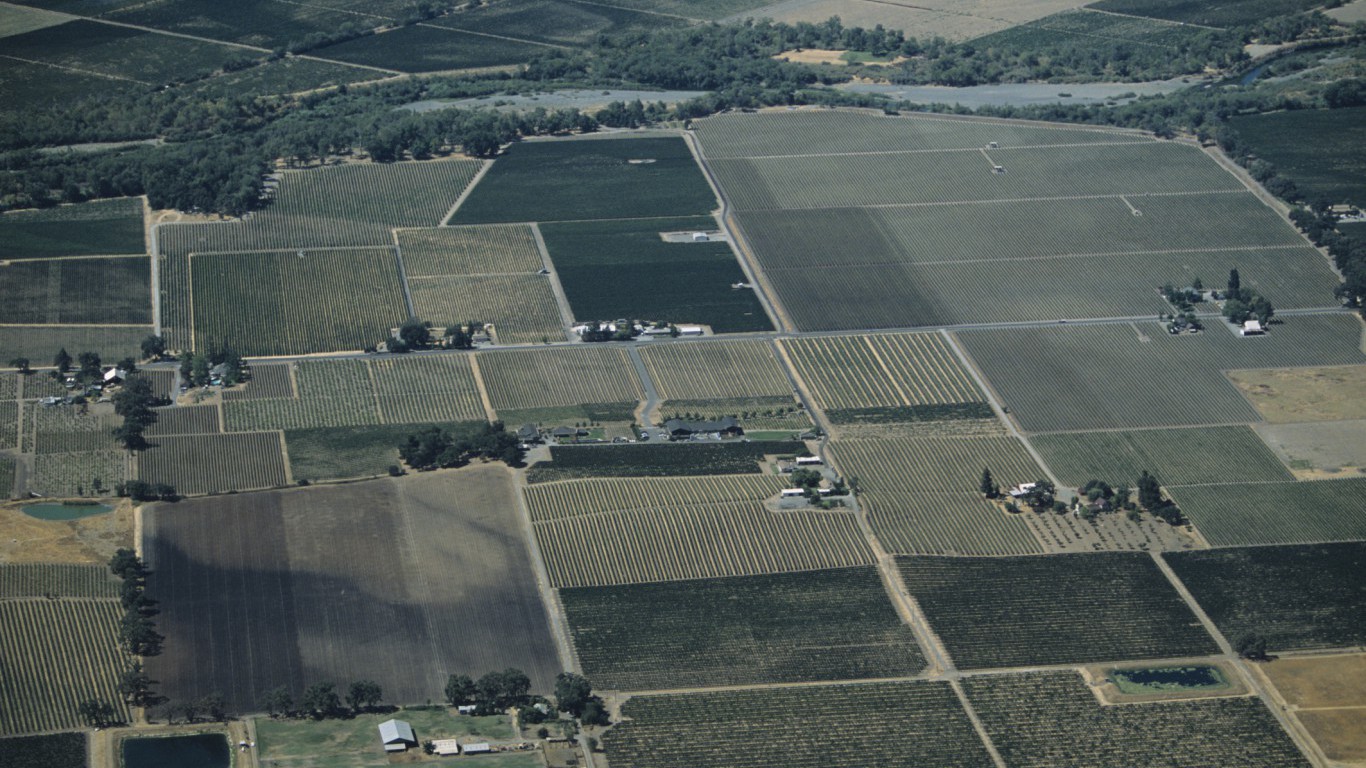
19. Santa Rosa
> State: California
> Population: 500,292
> Pct. of city residents reporting physical activity: 87.7%
> Fitness centers per 100,000 residents: 11
> Obesity rate: 22.4%
> Pct. of adults reporting fair/poor health: 14.4%
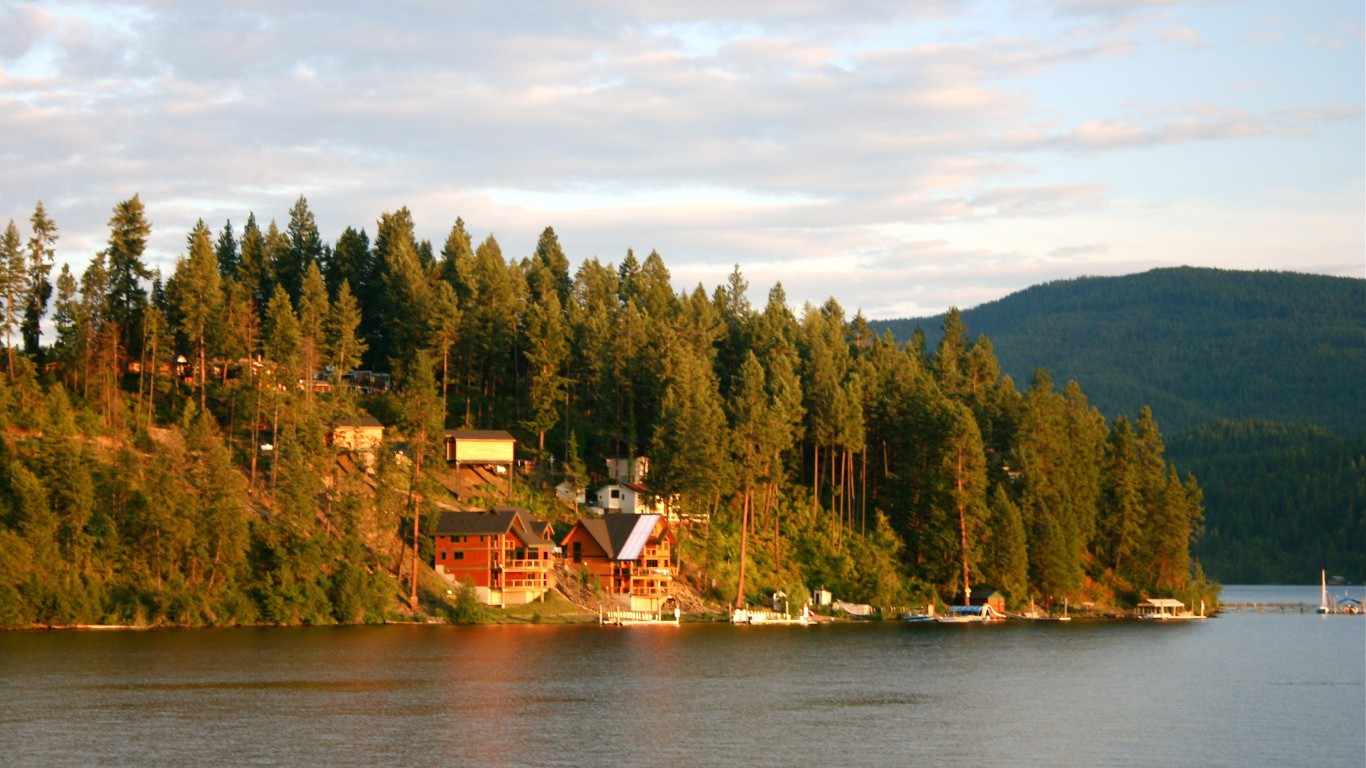
18. Coeur d’Alene
> State: Idaho
> Population: 147,326
> Pct. of city residents reporting physical activity: 82.5%
> Fitness centers per 100,000 residents: 14
> Obesity rate: 24.6%
> Pct. of adults reporting fair/poor health: 12.7%
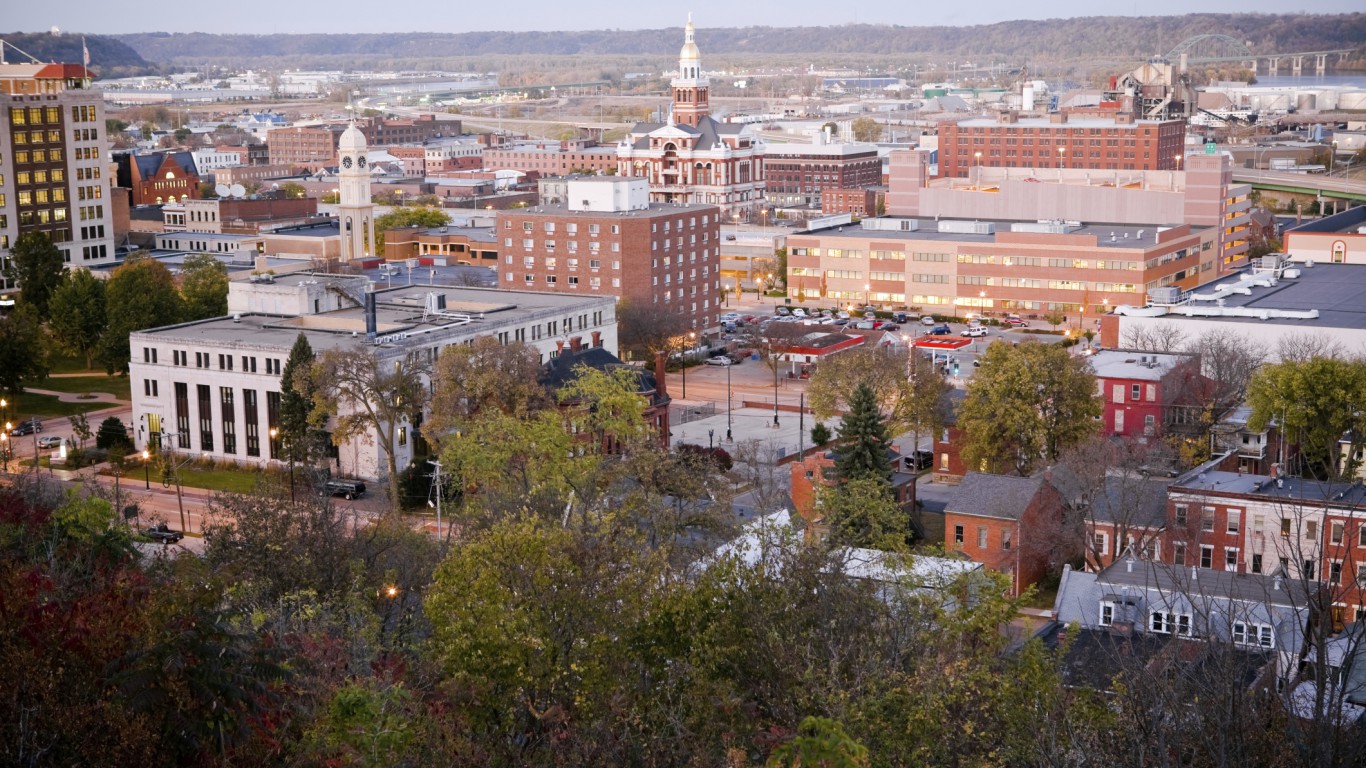
17. Dubuque
> State: Iowa
> Population: 96,370
> Pct. of city residents reporting physical activity: 79.5%
> Fitness centers per 100,000 residents: 17
> Obesity rate: 28.6%
> Pct. of adults reporting fair/poor health: 9.7%
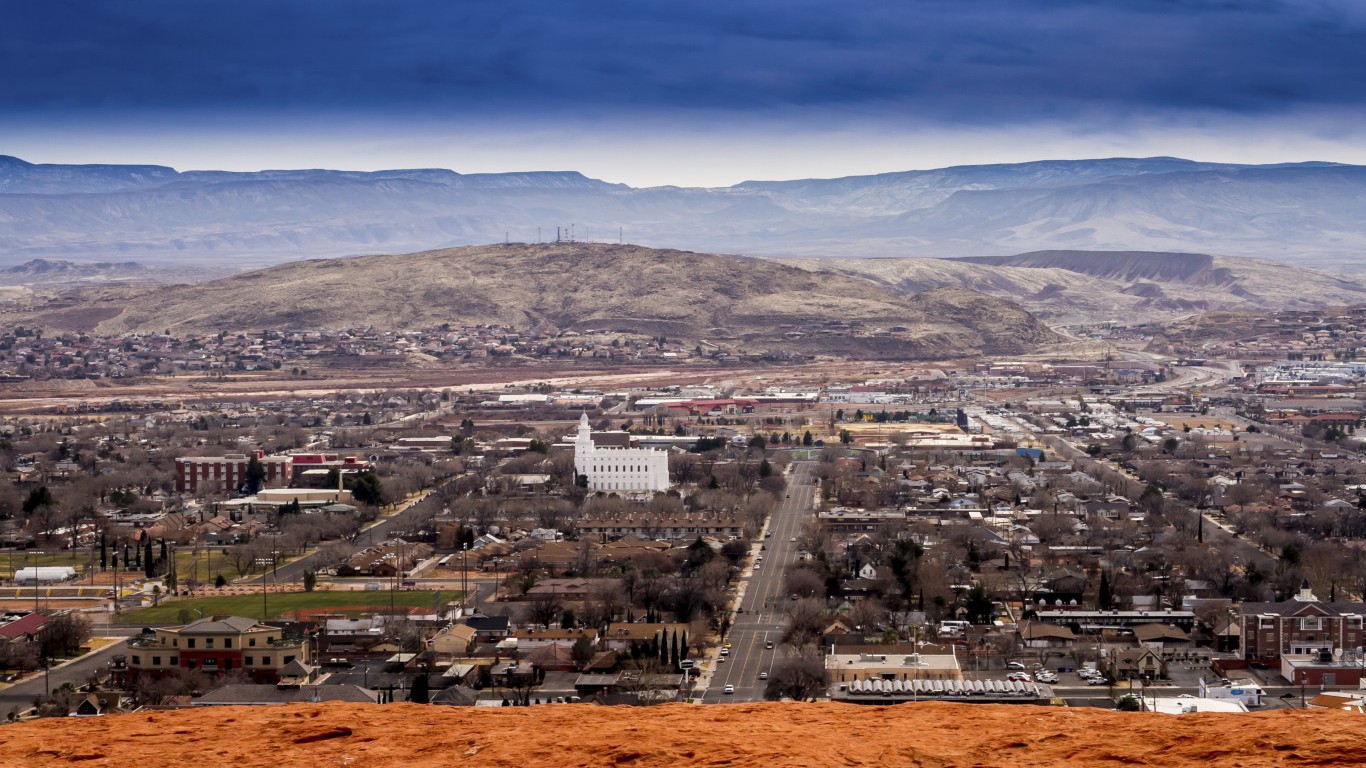
16. St. George
> State: Utah
> Population: 151,948
> Pct. of city residents reporting physical activity: 82.3%
> Fitness centers per 100,000 residents: 14
> Obesity rate: 22.6%
> Pct. of adults reporting fair/poor health: 12.0%
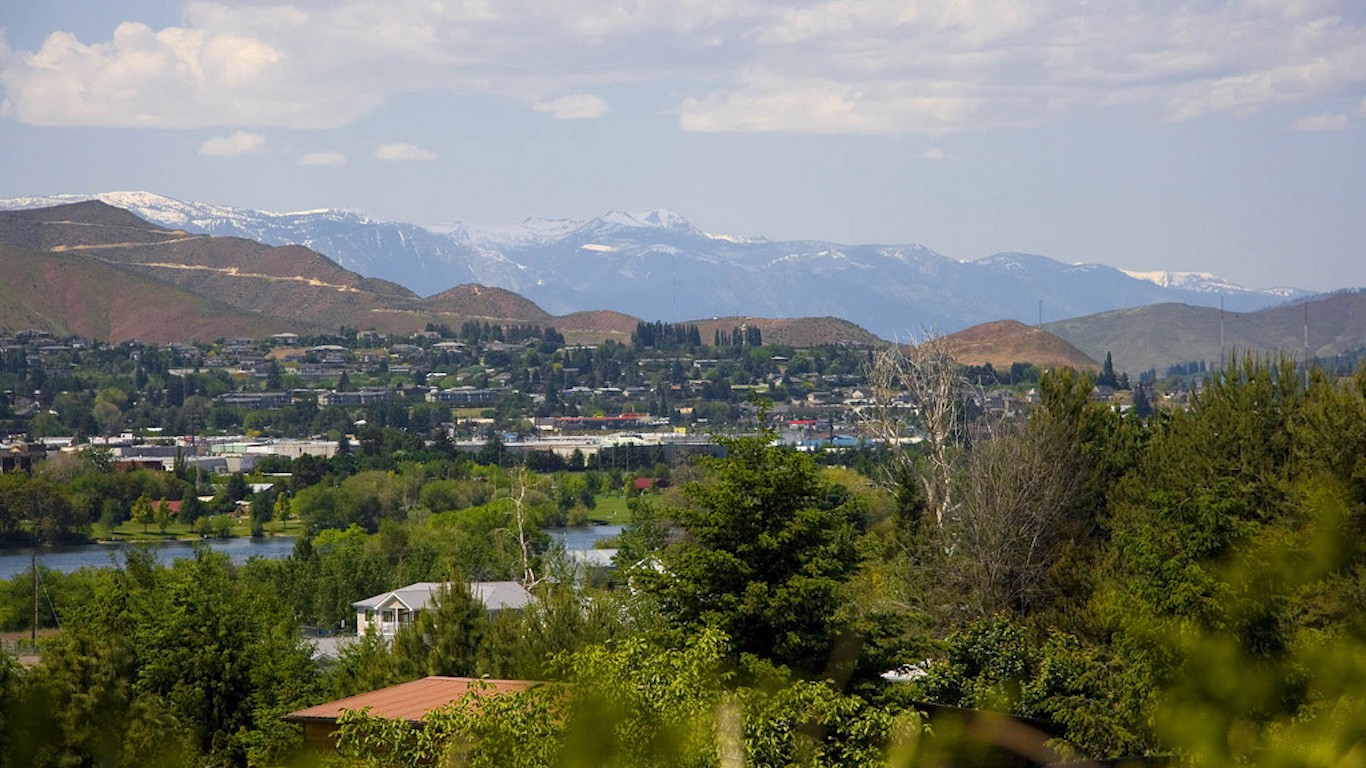
15. Wenatchee
> State: Washington
> Population: 114,392
> Pct. of city residents reporting physical activity: 82.2%
> Fitness centers per 100,000 residents: 15
> Obesity rate: 26.0%
> Pct. of adults reporting fair/poor health: 15.5%
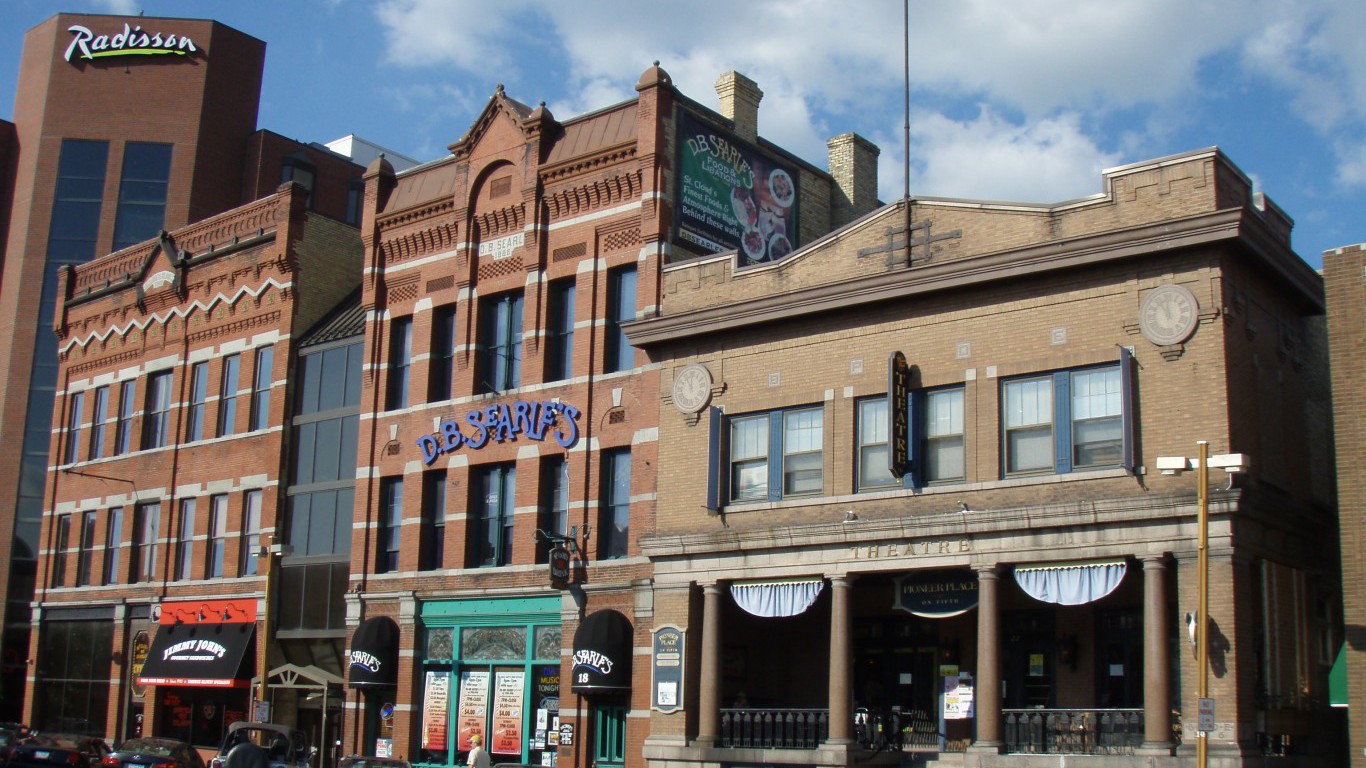
14. St. Cloud
> State: Minnesota
> Population: 192,418
> Pct. of city residents reporting physical activity: 80.9%
> Fitness centers per 100,000 residents: 16
> Obesity rate: 27.5%
> Pct. of adults reporting fair/poor health: 10.3%
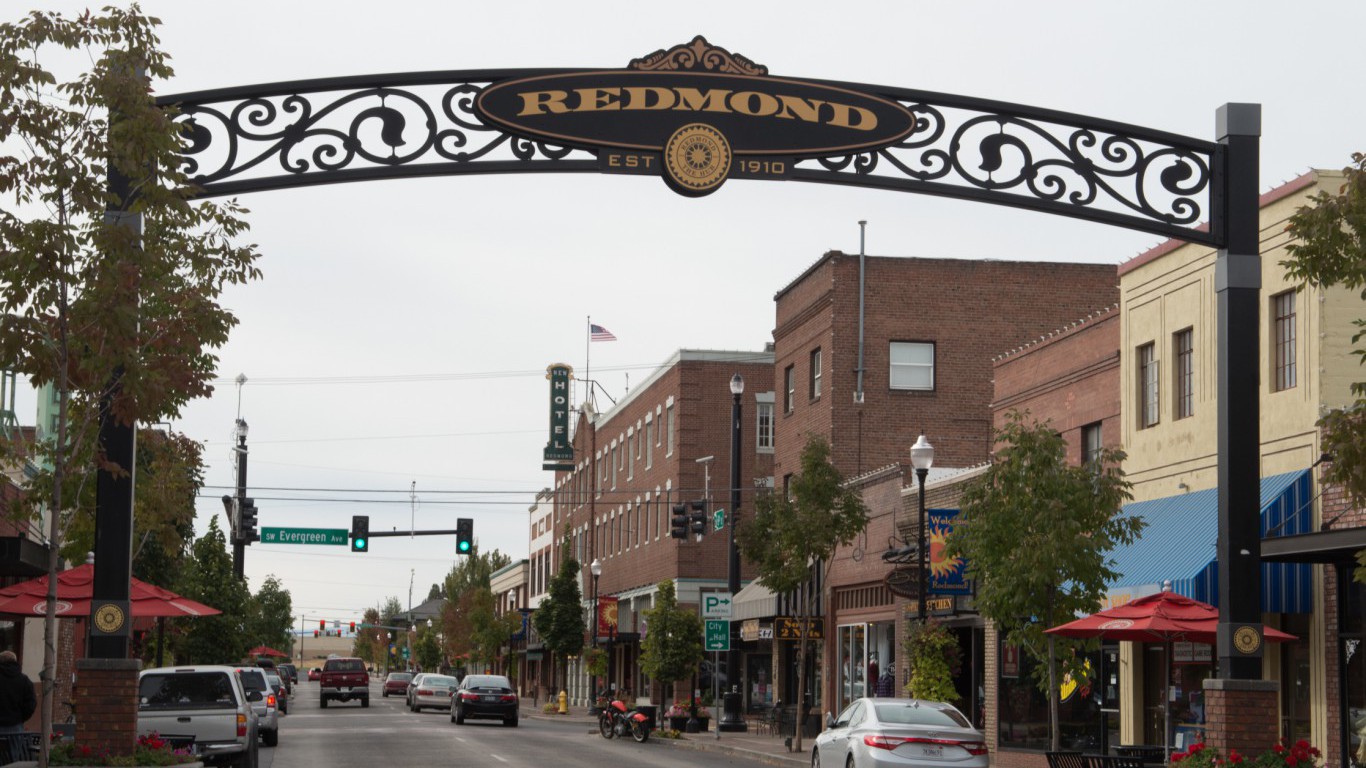
13. Bend-Redmond
> State: Oregon
> Population: 170,388
> Pct. of city residents reporting physical activity: 85.0%
> Fitness centers per 100,000 residents: 13
> Obesity rate: 23.0%
> Pct. of adults reporting fair/poor health: 8.7%

12. Boston-Cambridge-Newton
> State: Massachusetts-New Hampshire
> Population: 4,732,161
> Pct. of city residents reporting physical activity: 79.4%
> Fitness centers per 100,000 residents: 18
> Obesity rate: 23.2%
> Pct. of adults reporting fair/poor health: 11.7%
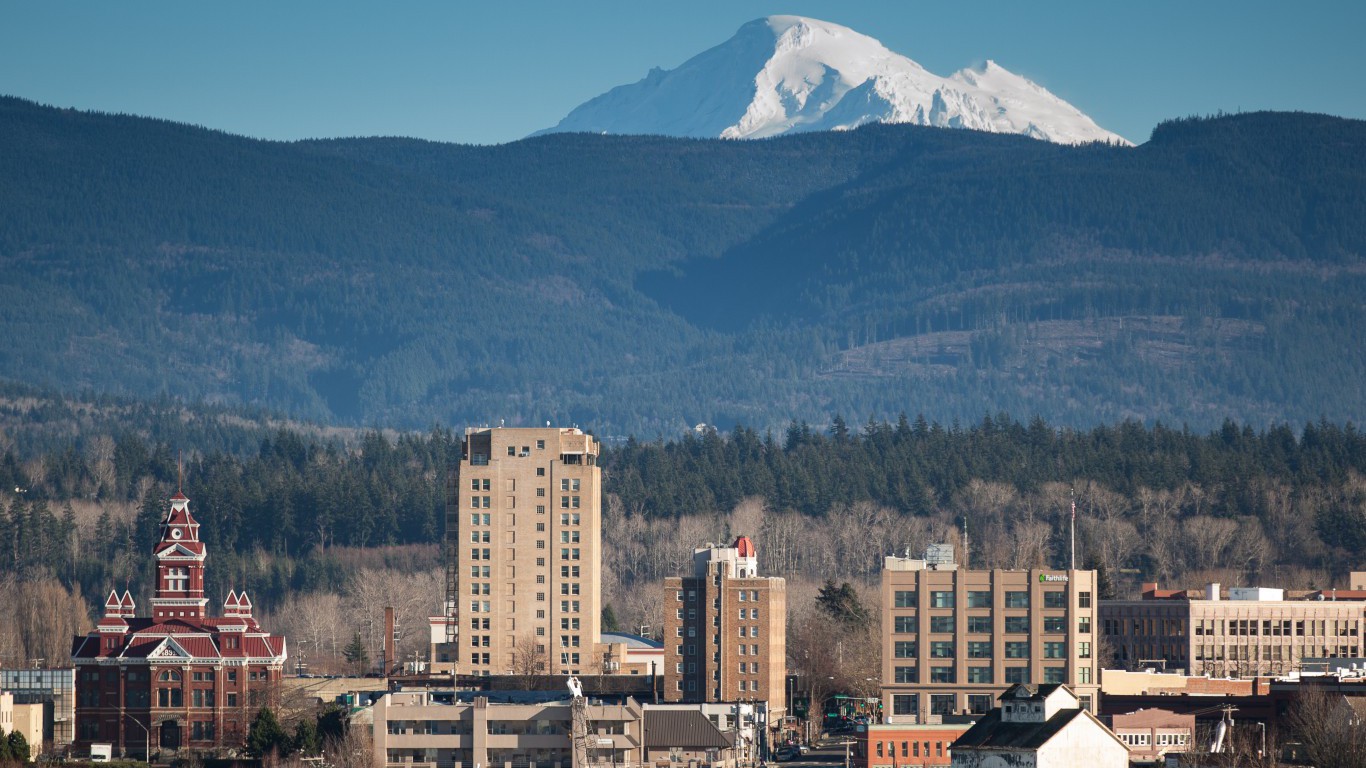
11. Bellingham
> State: Washington
> Population: 208,351
> Pct. of city residents reporting physical activity: 83.8%
> Fitness centers per 100,000 residents: 15
> Obesity rate: 25.1%
> Pct. of adults reporting fair/poor health: 11.4%
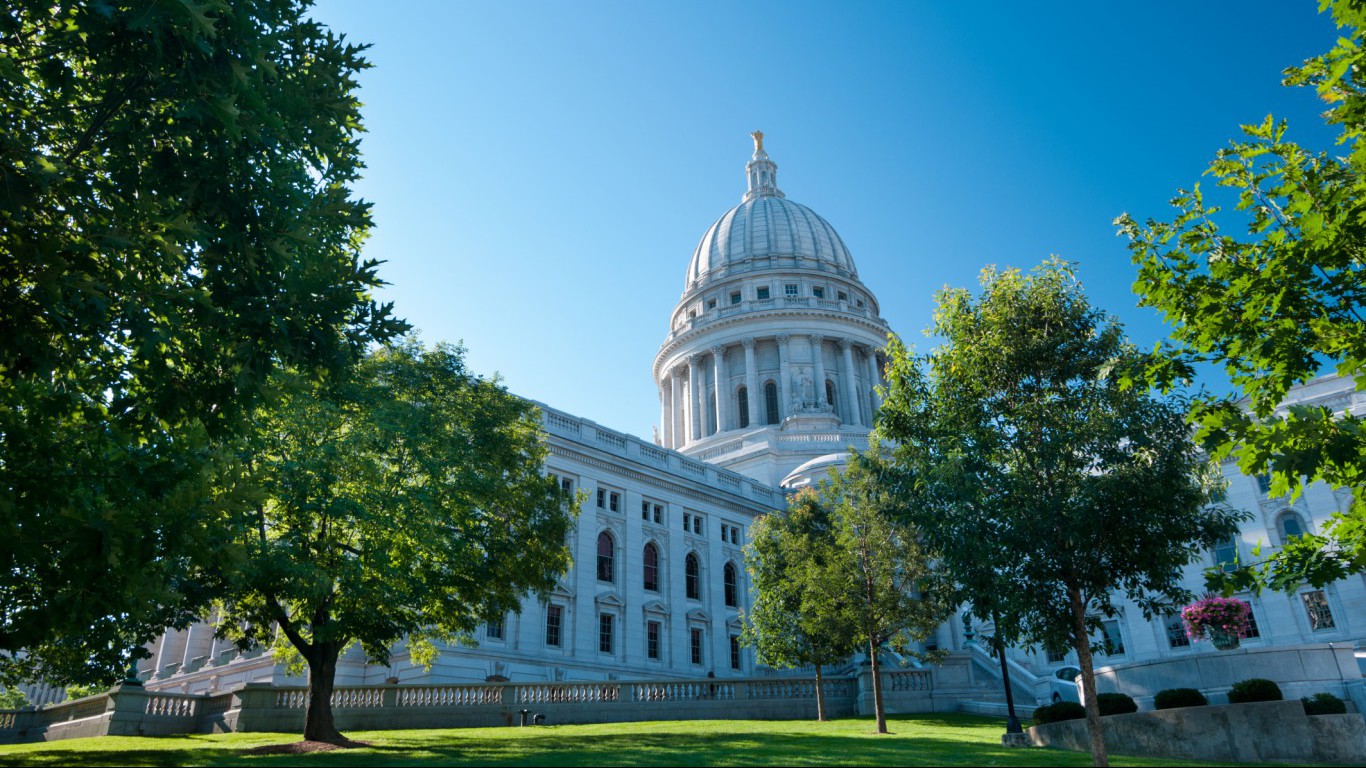
10. Madison
> State: Wisconsin
> Population: 633,787
> Pct. of city residents reporting physical activity: 82.0%
> Fitness centers per 100,000 residents: 17
> Obesity rate: 23.4%
> Pct. of adults reporting fair/poor health: 9.3%
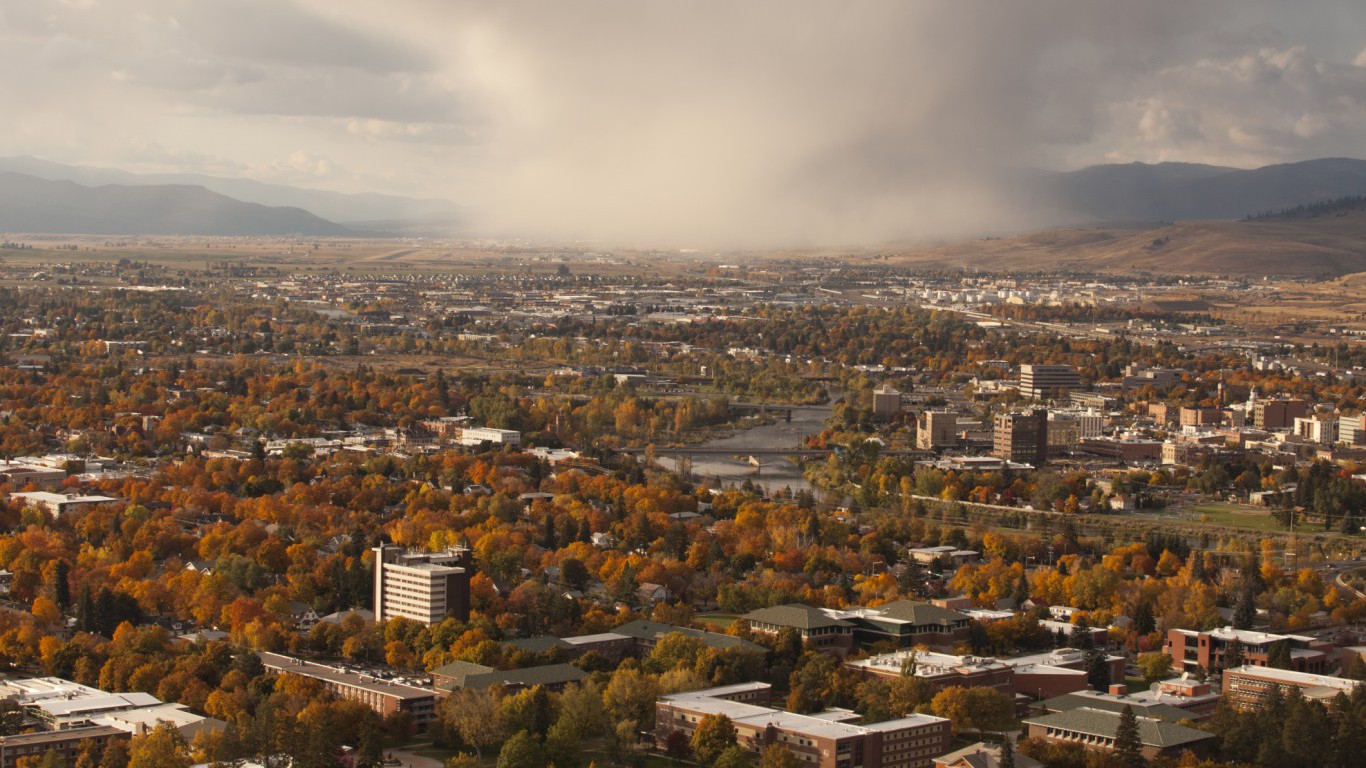
9. Missoula
> State: Montana
> Population: 112,684
> Pct. of city residents reporting physical activity: 83.0%
> Fitness centers per 100,000 residents: 16
> Obesity rate: 21.1%
> Pct. of adults reporting fair/poor health: 11.4%
8. Fort Collins
> State: Colorado
> Population: 324,122
> Pct. of city residents reporting physical activity: 87.8%
> Fitness centers per 100,000 residents: 13
> Obesity rate: 19.9%
> Pct. of adults reporting fair/poor health: 10.3%
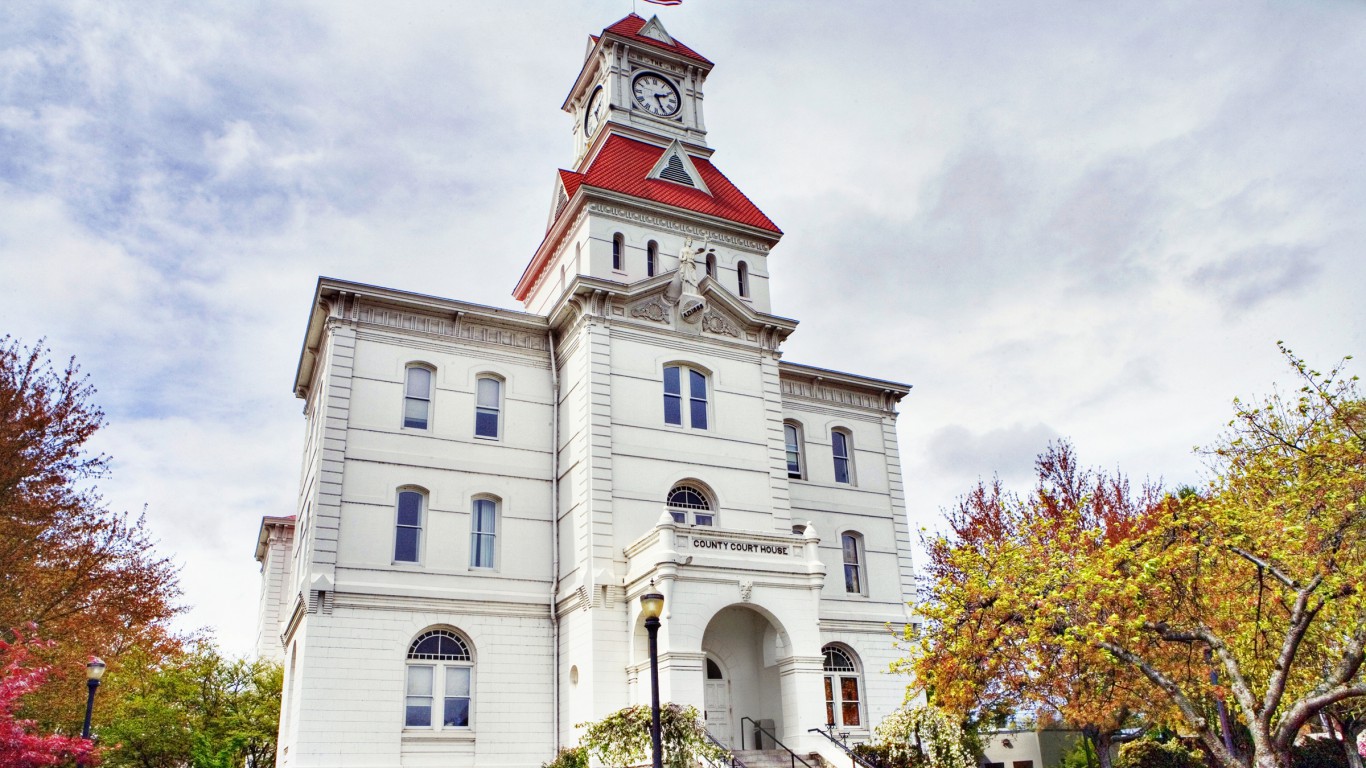
7. Corvallis
> State: Oregon
> Population: 86,316
> Pct. of city residents reporting physical activity: 84.7%
> Fitness centers per 100,000 residents: 15
> Obesity rate: 20.8%
> Pct. of adults reporting fair/poor health: 11.3%
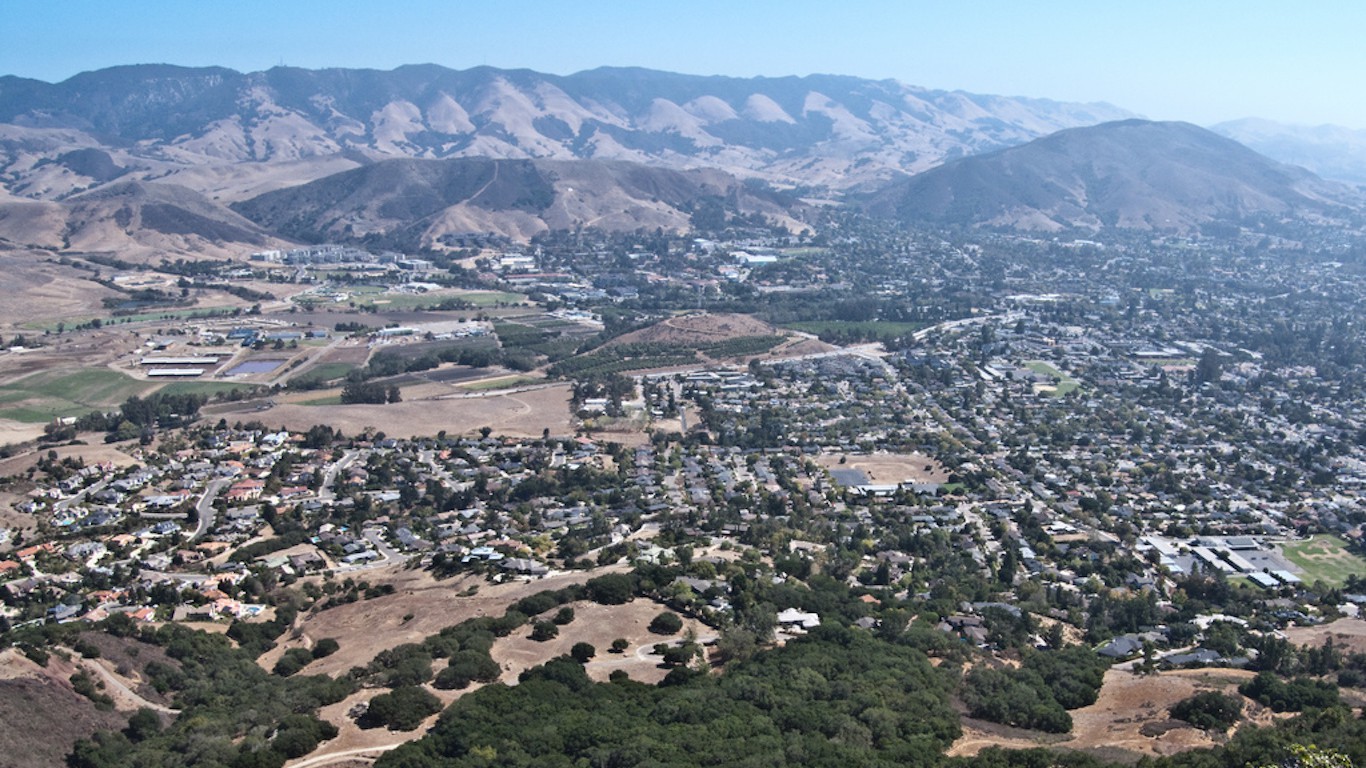
6. San Luis Obispo-Paso Robles-Arroyo Grande
> State: California
> Population: 279,083
> Pct. of city residents reporting physical activity: 86.4%
> Fitness centers per 100,000 residents: 14
> Obesity rate: 20.4%
> Pct. of adults reporting fair/poor health: 11.6%
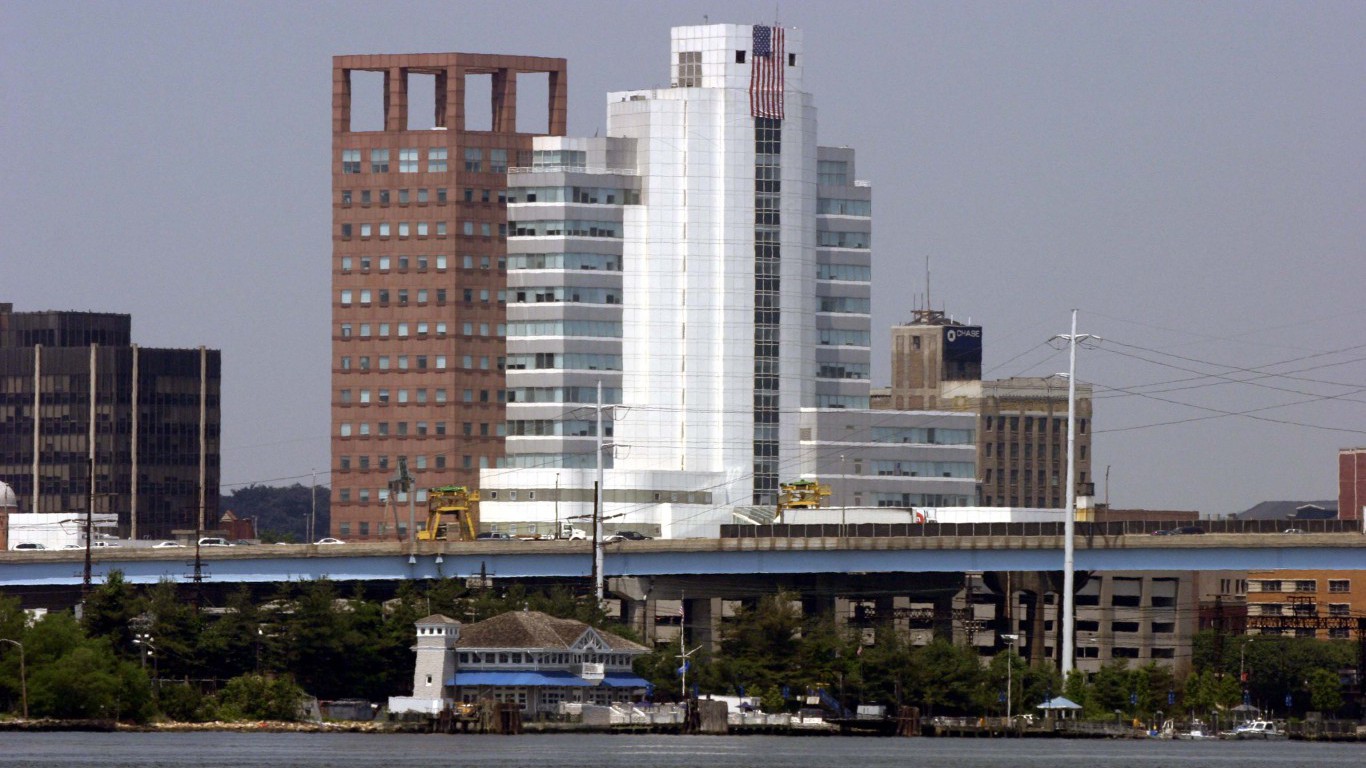
5. Bridgeport-Stamford-Norwalk
> State: Connecticut
> Population: 945,438
> Pct. of city residents reporting physical activity: 80.2%
> Fitness centers per 100,000 residents: 19
> Obesity rate: 19.6%
> Pct. of adults reporting fair/poor health: 10.0%

4. Napa
> State: California
> Population: 141,667
> Pct. of city residents reporting physical activity: 86.8%
> Fitness centers per 100,000 residents: 15
> Obesity rate: 24.1%
> Pct. of adults reporting fair/poor health: 16.7%
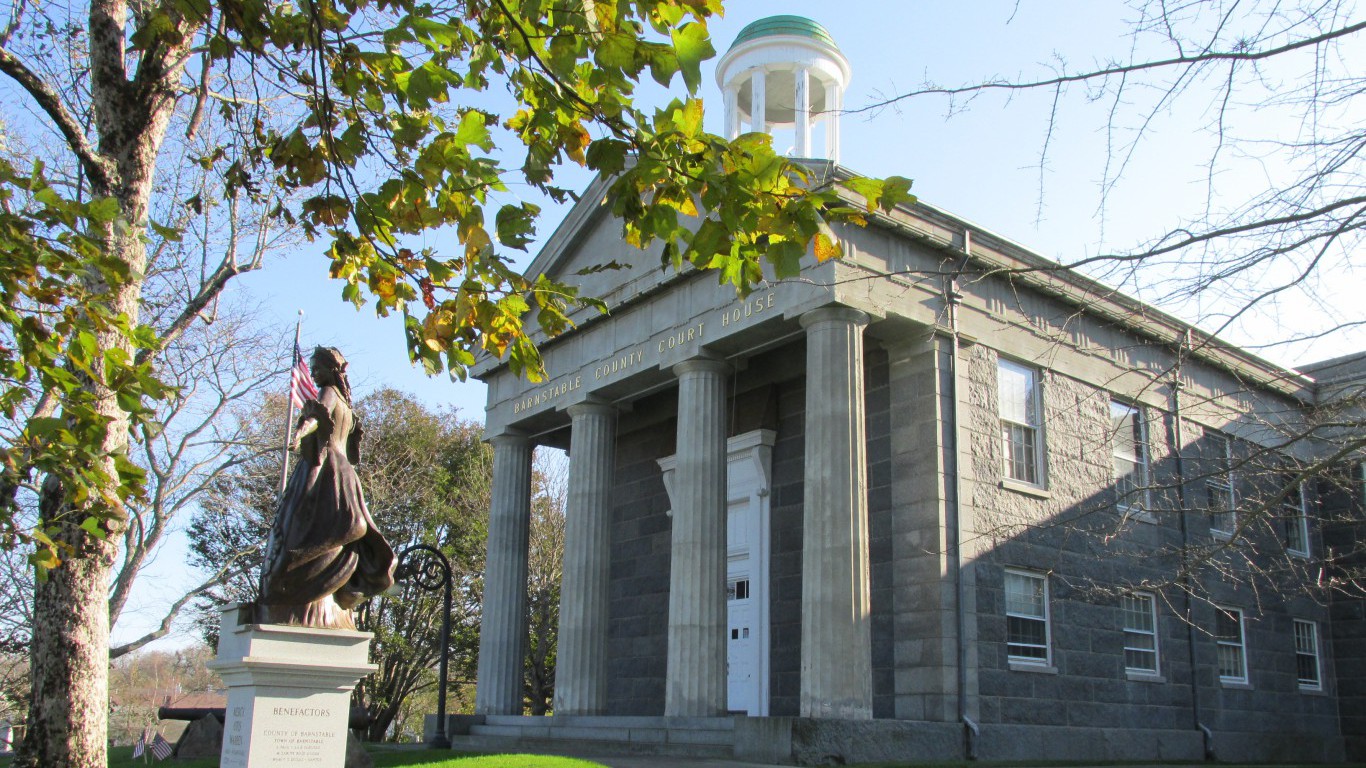
3. Barnstable Town
> State: Massachusetts
> Population: 214,914
> Pct. of city residents reporting physical activity: 82.7%
> Fitness centers per 100,000 residents: 18
> Obesity rate: 18.3%
> Pct. of adults reporting fair/poor health: 8.3%

2. Santa Cruz-Watsonville
> State: California
> Population: 271,804
> Pct. of city residents reporting physical activity: 89.6%
> Fitness centers per 100,000 residents: 14
> Obesity rate: 21.5%
> Pct. of adults reporting fair/poor health: 16.8%
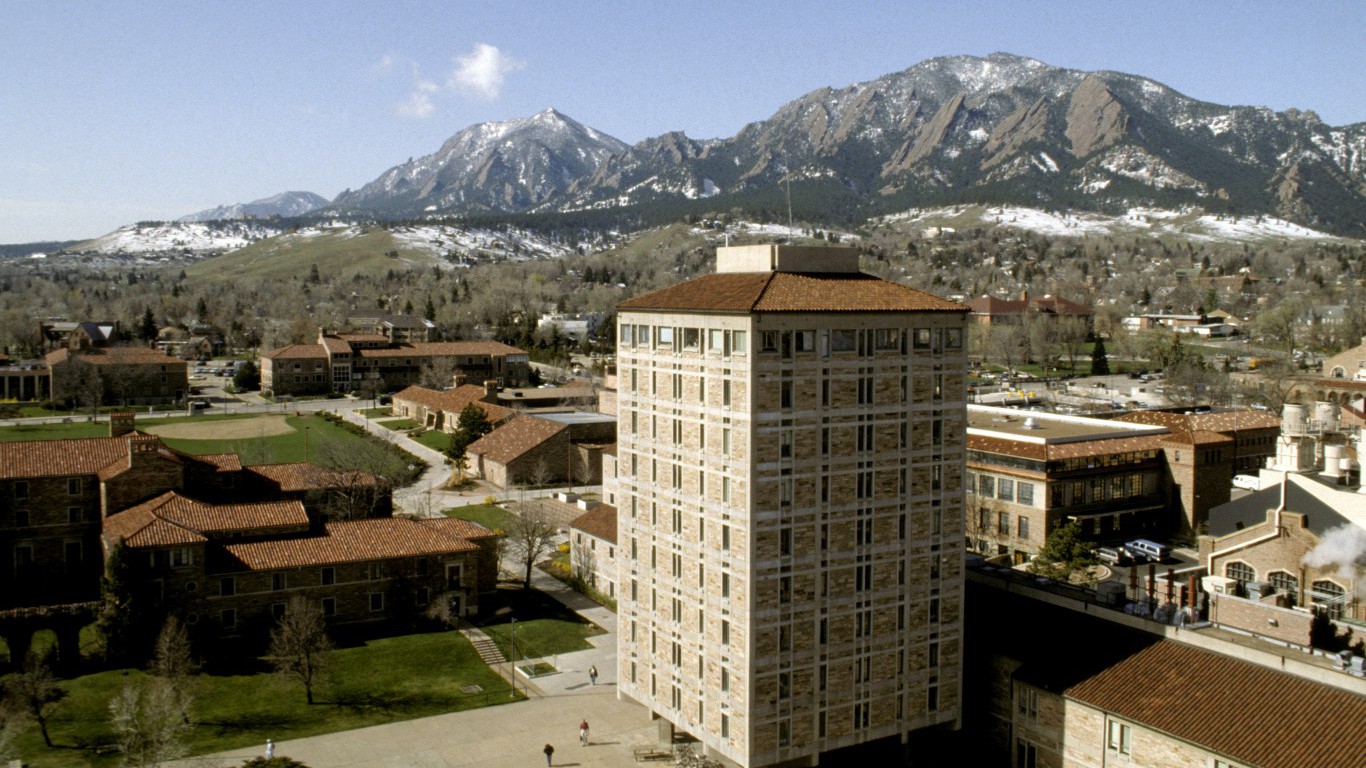
1. Boulder
> State: Colorado
> Population: 313,333
> Pct. of city residents reporting physical activity: 90.3%
> Fitness centers per 100,000 residents: 20
> Obesity rate: 15.0%
> Pct. of adults reporting fair/poor health: 9.1%
It’s Your Money, Your Future—Own It (sponsor)
Retirement can be daunting, but it doesn’t need to be.
Imagine having an expert in your corner to help you with your financial goals. Someone to help you determine if you’re ahead, behind, or right on track. With SmartAsset, that’s not just a dream—it’s reality. This free tool connects you with pre-screened financial advisors who work in your best interests. It’s quick, it’s easy, so take the leap today and start planning smarter!
Don’t waste another minute; get started right here and help your retirement dreams become a retirement reality.
Thank you for reading! Have some feedback for us?
Contact the 24/7 Wall St. editorial team.
 24/7 Wall St.
