
Money is the single largest cause of stress in the United States. Although the economy has been recovering from the Great Recession and aggregate income has been rising, many Americans face increasing debt burdens, stagnant wages, and rising poverty levels.
According to the American Psychological Association, Americans’ stress levels are trending downward. However, the improvements have been uneven. Just as the income gap has been growing, so has the gap between people who seem to manage stress well and those who do not.
In its latest annual review of stress in America, the APA identified money and work as the two largest sources of stress for Americans, followed by the economy, family responsibilities, and personal health concerns. 24/7 Wall St. reviewed a range of data in these categories in order to measure the likelihood of living in stress in urban areas.
Click here to see the 25 most stressed-out cities.
The APA also identified experiencing discrimination as a major source of stress in America. Of adults nationwide, 61% reported being threatened, harassed, or treated with less respect than others on a daily basis. More serious forms of discrimination such as unfair treatment by police, neighbors making life difficult for a family, or discouragement from teachers or advisers at some point in life have affected nearly half of all adults across the country.
Stress levels do not vary much across the United States. In an interview this January, Lynn Bufka, psychologist at the APA, explained this could be due to the relatively high level and overall prevalence of stress. “People are going to experience stress no matter what,” Bufka said.
While stress levels are somewhat uniform nationwide, they affect people in different regions very differently. The lack of variation in reported stress levels across the nation could therefore be due to the variety of coping strategies for dealing with stress, as well as the differences in how stress affects different demographics.
Bufka added that for many people, a certain level of stress can actually be necessary to follow through on stated intentions and accomplish work. Yet, there are healthy and unhealthy ways to manage stress. The APA has found that poor individuals are more likely to engage in unhealthy behaviors to manage their stress. Nearly three-quarters of Americans surveyed reported feeling stressed about money at least sometimes, and nearly one-quarter reported money concerns as causing stress on a regular basis.
Metropolitan areas are often some of the most expensive places to live in a state, and the most stressed areas tend to be less affordable. The affordability ratio calculates how much homeowners spend on their homes as a share of their total income — the higher the ratio, the less affordable the area. Of the 25 most stressed-out metro areas, 15 have less affordable housing compared to the average affordability ratio across all major U.S. metro areas. Similarly, the poverty rate in 17 of the 25 most stressed-out cities exceeds the national rate of 15.5%.
Americans tend to work longer hours than residents of other countries, and the United States is the only developed country where paid time off is not guaranteed. Perhaps it is no surprise that work is the next most common source of stress after finances. The typical American works approximately 35 hours per week. In all of the 25 most stressed-out cities, the average employee works more hours per week than the average American worker.
A growing body of research is connecting stress directly with premature death, depression, and lower productivity in the workplace. “Feeling stressed and overwhelmed diminishes our mental resources, diminishes our capacity to be flexible mentally, [and] diminishes our ability to generate new ideas,” Bufka said.
To identify the most stressed city in every state, 24/7 Wall St. created an index of data measuring the two most common sources of stress — money and work — in U.S. metropolitan areas. For possible money-related stressors, we reviewed poverty rates, housing affordability, and food insecurity. For possible work-related stressors, we included average weekly work hours, average daily commute times in hours, and annual unemployment rates. With the exception of food insecurity and unemployment rates, which came from the United States Department of Agriculture (USDA) and the Bureau of Labor Statistics (BLS), respectively, all data used in the index came from the U.S. Census Bureau’s 2014 American Community Survey (ACS). The incidence of violent crime in each area comes from the Federal Bureau of Investigation’s 2014 Uniform Crime Report. All data are for the most recent periods available. While the potential consequences of stress were not considered in our index, they were reviewed in each state’s MSAs.
These are the 25 most stressed-out cities.
Correction: Due to a transcription error, violent crime rates listed in a previous version of this article were incorrect. Violent crime rates have been updated for all metro areas. This error does not affect the ranking of the cities.

25. Augusta-Richmond County, GA-SC
> Total population: 583,010
> Poverty rate: 18.9%
> Avg. weekly hours worked: 37.6
> Unemployment rate: 7.3%
> Violent crime rate (per 100,000 people): 286.9
> Pct. of adults in fair/poor health: 15.3%

24. Lake Charles, LA
> Total population: 204,059
> Poverty rate: 18.2%
> Avg. weekly hours worked: 38.2
> Unemployment rate: 5.9%
> Violent crime rate (per 100,000 people): N/A
> Pct. of adults in fair/poor health: 19.9%

23. Texarkana, TX-AR
> Total population: 147,740
> Poverty rate: 20.0%
> Avg. weekly hours worked: 37.5
> Unemployment rate: 6.2%
> Violent crime rate (per 100,000 people): 532.8
> Pct. of adults in fair/poor health: 22.1%

22. Rome, GA
> Total population: 96,063
> Poverty rate: 20.8%
> Avg. weekly hours worked: 38.0
> Unemployment rate: 7.9%
> Violent crime rate (per 100,000 people): N/A
> Pct. of adults in fair/poor health: 21.6%

21. Detroit-Warren-Dearborn, MI
> Total population: 4,296,611
> Poverty rate: 16.1%
> Avg. weekly hours worked: 35.7
> Unemployment rate: 8.5%
> Violent crime rate (per 100,000 people): 529.4
> Pct. of adults in fair/poor health: 14.8%

20. Hinesville, GA
> Total population: 82,768
> Poverty rate: 15.6%
> Avg. weekly hours worked: 38.8
> Unemployment rate: 7.7%
> Violent crime rate (per 100,000 people): 346.6
> Pct. of adults in fair/poor health: 20.0%

19. San Angelo, TX
> Total population: 118,296
> Poverty rate: 15.1%
> Avg. weekly hours worked: 36.4
> Unemployment rate: 4.0%
> Violent crime rate (per 100,000 people): 239.6
> Pct. of adults in fair/poor health: 19.3%

18. Lafayette, LA
> Total population: 484,974
> Poverty rate: 16.3%
> Avg. weekly hours worked: 37.1
> Unemployment rate: 5.4%
> Violent crime rate (per 100,000 people): 441.8
> Pct. of adults in fair/poor health: 17.8%

17. Des Moines-West Des Moines, IA
> Total population: 611,549
> Poverty rate: 12.0%
> Avg. weekly hours worked: 35.8
> Unemployment rate: 4.2%
> Violent crime rate (per 100,000 people): 316.8
> Pct. of adults in fair/poor health: 10.8%

16. Macon, GA
> Total population: 233,212
> Poverty rate: 24.3%
> Avg. weekly hours worked: 38.4
> Unemployment rate: 7.7%
> Violent crime rate (per 100,000 people): N/A
> Pct. of adults in fair/poor health: 17.4%

15. Staunton-Waynesboro, VA
> Total population: 119,766
> Poverty rate: 11.7%
> Avg. weekly hours worked: 36.8
> Unemployment rate: 4.9%
> Violent crime rate (per 100,000 people): 147.6
> Pct. of adults in fair/poor health: 11.2%
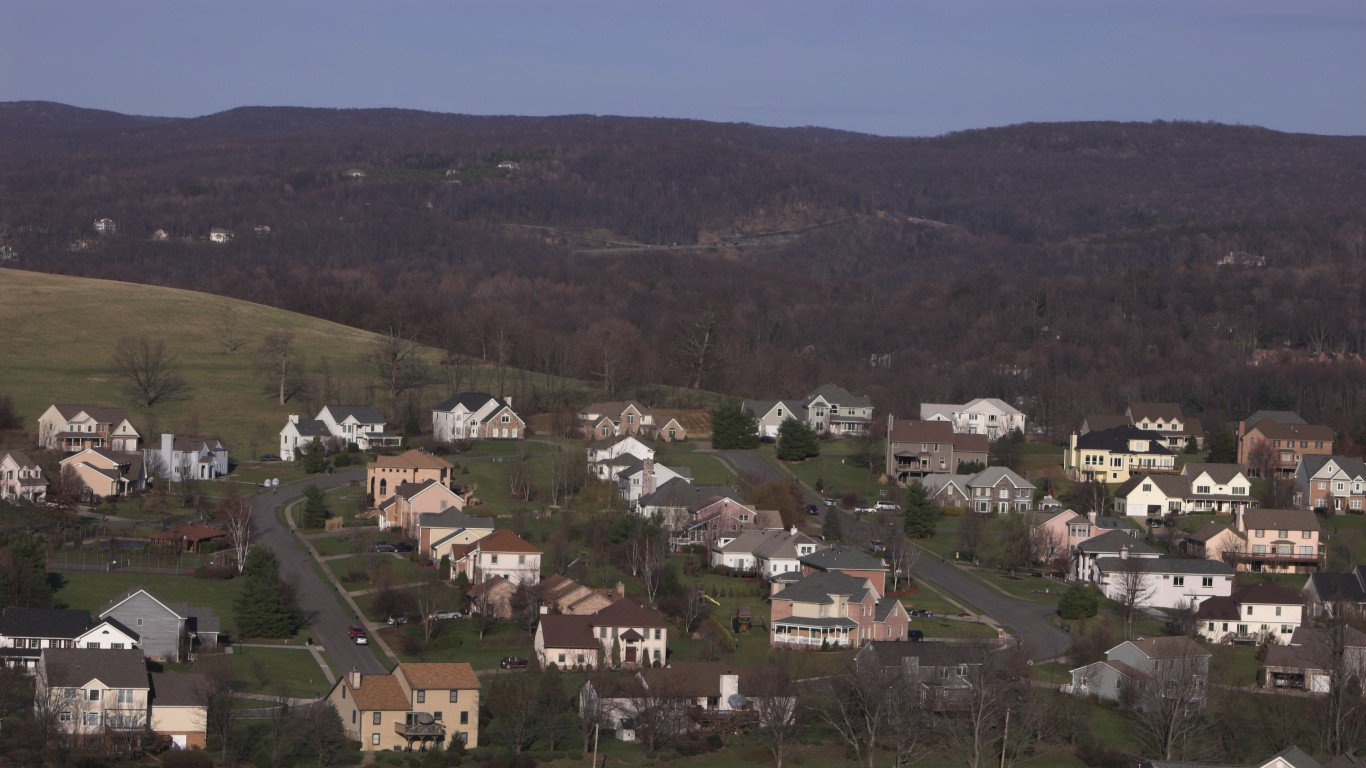
14. Morgantown, WV
> Total population: 137,251
> Poverty rate: 23.5%
> Avg. weekly hours worked: 37.4
> Unemployment rate: 4.7%
> Violent crime rate (per 100,000 people): 201.7
> Pct. of adults in fair/poor health: 17.2%
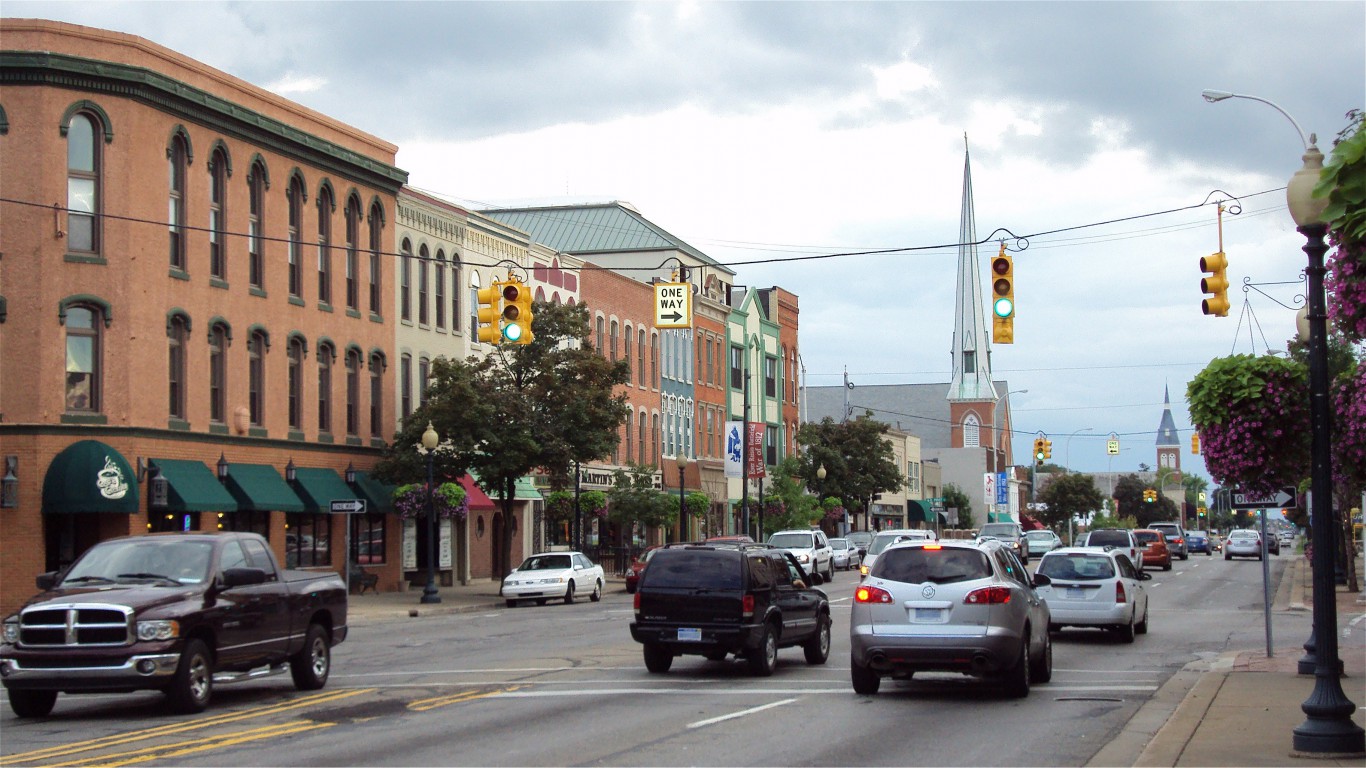
13. Monroe, MI
> Total population: 149,824
> Poverty rate: 9.7%
> Avg. weekly hours worked: 34.6
> Unemployment rate: 6.1%
> Violent crime rate (per 100,000 people): N/A
> Pct. of adults in fair/poor health: 15.0%
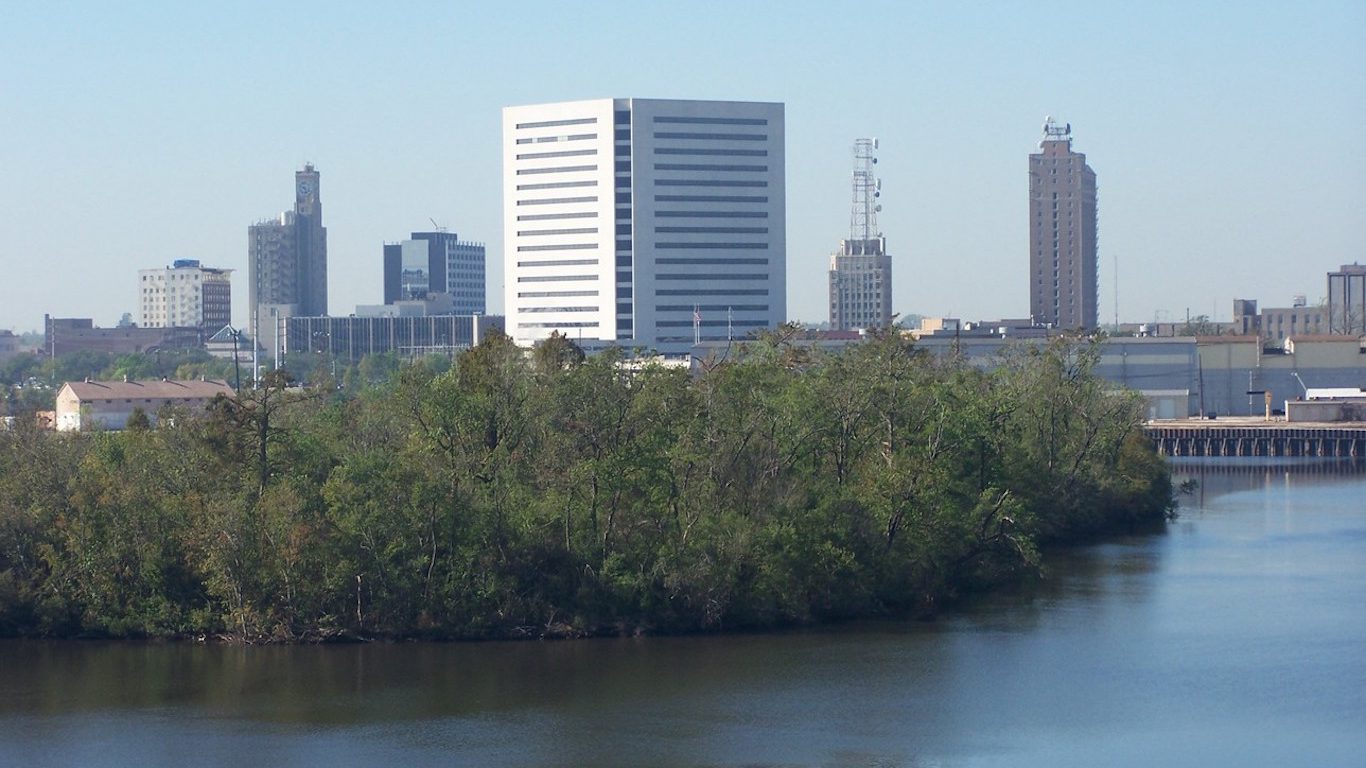
12. Beaumont-Port Arthur, TX
> Total population: 403,958
> Poverty rate: 18.6%
> Avg. weekly hours worked: 39.7
> Unemployment rate: 7.9%
> Violent crime rate (per 100,000 people): 494
> Pct. of adults in fair/poor health: 15.4%
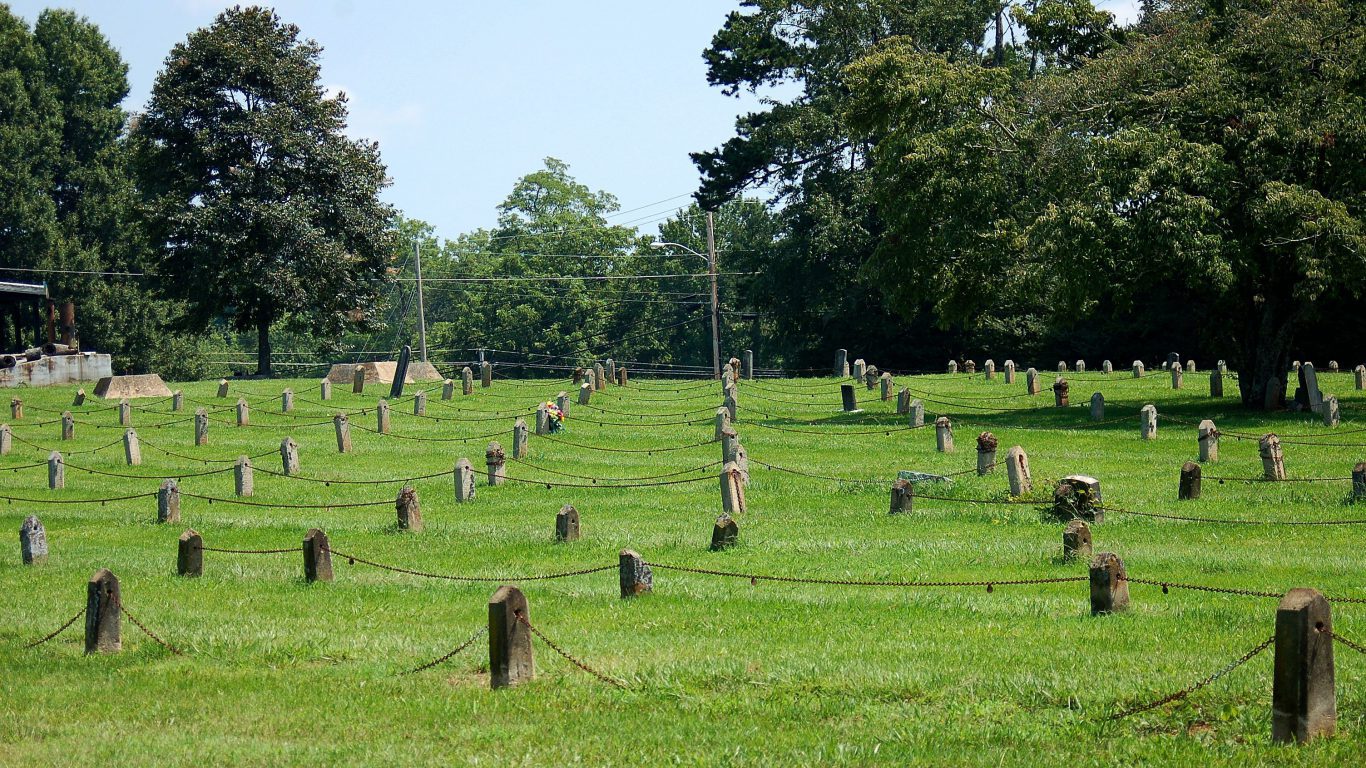
11. Hickory-Lenoir-Morganton, NC
> Total population: 362,896
> Poverty rate: 18.9%
> Avg. weekly hours worked: 37.1
> Unemployment rate: 6.4%
> Violent crime rate (per 100,000 people): 193.7
> Pct. of adults in fair/poor health: 19.8%

10. Wichita Falls, TX
> Total population: 151,536
> Poverty rate: 19.2%
> Avg. weekly hours worked: 37.2
> Unemployment rate: 4.8%
> Violent crime rate (per 100,000 people): 343.5
> Pct. of adults in fair/poor health: 20.2%

9. Dalton, GA
> Total population: 142,952
> Poverty rate: 21.6%
> Avg. weekly hours worked: 39.1
> Unemployment rate: 8.3%
> Violent crime rate (per 100,000 people): 221.5
> Pct. of adults in fair/poor health: 25.2%

8. Longview, TX
> Total population: 217,481
> Poverty rate: 16.2%
> Avg. weekly hours worked: 38.9
> Unemployment rate: 4.9%
> Violent crime rate (per 100,000 people): 344.1
> Pct. of adults in fair/poor health: 18.7%

7. Columbus, IN
> Total population: 80,217
> Poverty rate: 12.7%
> Avg. weekly hours worked: 39.2
> Unemployment rate: 4.5%
> Violent crime rate (per 100,000 people): 109.5
> Pct. of adults in fair/poor health: 14.8%

6. Victoria, TX
> Total population: 99,536
> Poverty rate: 16.7%
> Avg. weekly hours worked: 40.0
> Unemployment rate: 4.1%
> Violent crime rate (per 100,000 people): 429.9
> Pct. of adults in fair/poor health: 22.7%

5. Midland, TX
> Total population: 163,470
> Poverty rate: 7.8%
> Avg. weekly hours worked: 41.3
> Unemployment rate: 2.9%
> Violent crime rate (per 100,000 people): 322.3
> Pct. of adults in fair/poor health: 14.9%

4. Houston-The Woodlands-Sugar Land, TX
> Total population: 6,490,180
> Poverty rate: 15.3%
> Avg. weekly hours worked: 37.1
> Unemployment rate: 4.9%
> Violent crime rate (per 100,000 people): 567.4
> Pct. of adults in fair/poor health: 15.9%
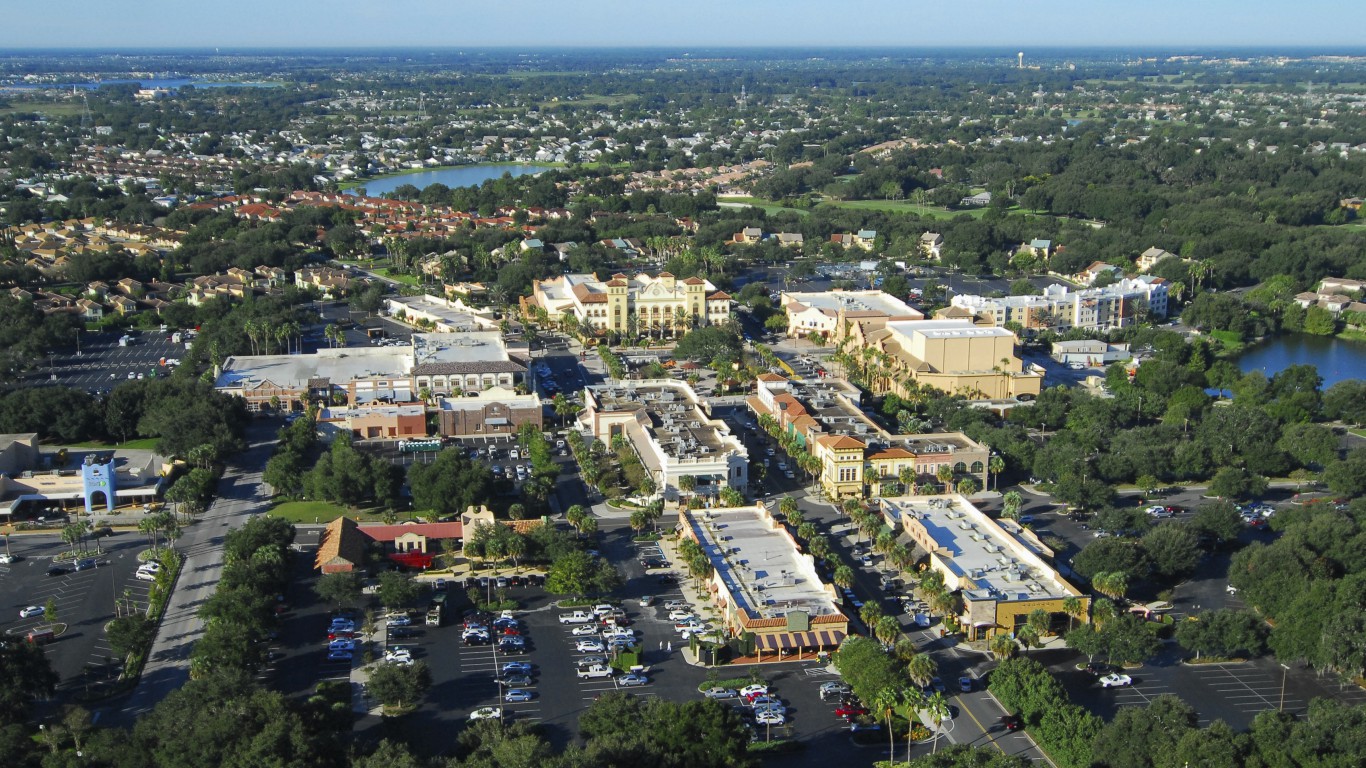
3. The Villages, FL
> Total population: 114,350
> Poverty rate: 9.3%
> Avg. weekly hours worked: 39.3
> Unemployment rate: 7.7%
> Violent crime rate (per 100,000 people): 189.4
> Pct. of adults in fair/poor health: 14.8%
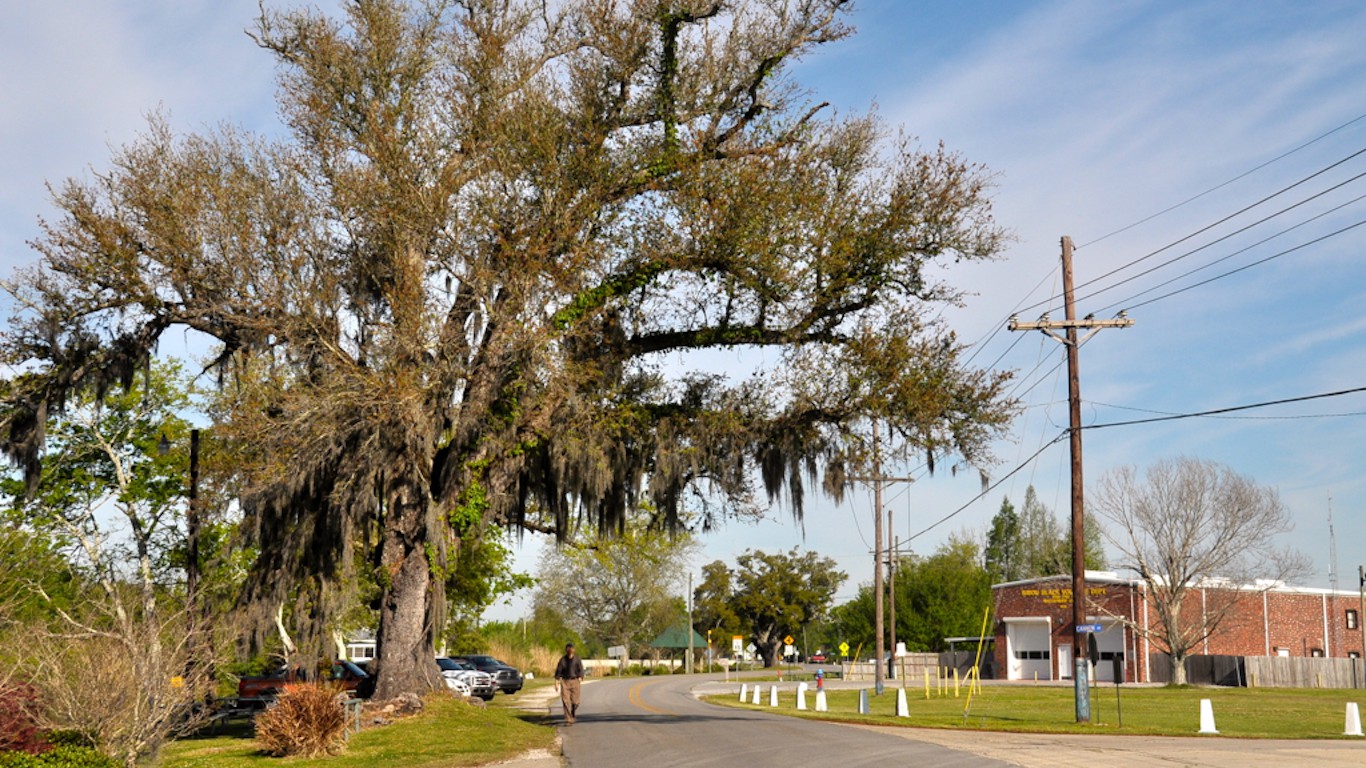
2. Houma-Thibodaux, LA
> Total population: 211,348
> Poverty rate: 20.9%
> Avg. weekly hours worked: 43.2
> Unemployment rate: 4.8%
> Violent crime rate (per 100,000 people): 242.3
> Pct. of adults in fair/poor health: 21.4%

1. Odessa, TX
> Total population: 153,904
> Poverty rate: 10.0%
> Avg. weekly hours worked: 42.9
> Unemployment rate: 3.4%
> Violent crime rate (per 100,000 people): N/A
> Pct. of adults in fair/poor health: 20.7%
Travel Cards Are Getting Too Good To Ignore (sponsored)
Credit card companies are pulling out all the stops, with the issuers are offering insane travel rewards and perks.
We’re talking huge sign-up bonuses, points on every purchase, and benefits like lounge access, travel credits, and free hotel nights. For travelers, these rewards can add up to thousands of dollars in flights, upgrades, and luxury experiences every year.
It’s like getting paid to travel — and it’s available to qualified borrowers who know where to look.
We’ve rounded up some of the best travel credit cards on the market. Click here to see the list. Don’t miss these offers — they won’t be this good forever.
Thank you for reading! Have some feedback for us?
Contact the 24/7 Wall St. editorial team.


