Special Report
Counties With the Worst Allergies in Every State
Published:
Last Updated:

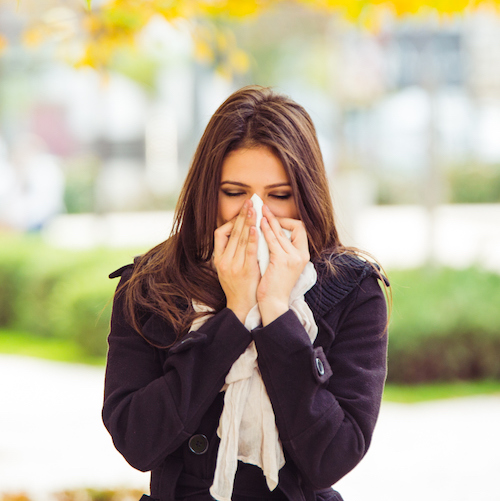
An estimated 50 million Americans suffer from nasal allergies — and an additional 26 million have asthma. These conditions take a toll on the health of a city’s population as well as its economy. Seasonal allergies alone account for an estimated 3.8 million missed work and school days each year. According to a recent report by the Natural Resources Defense Council, as many as one in three Americans live in areas that put them at increased risk of respiratory allergies and asthma.
Both poor air quality and the presence of pollen can exacerbate respiratory conditions, and these environmental factors are far more common in certain parts of the country. 24/7 Wall St. reviewed county-level data on the presence of ragweed pollen, a seasonal allergen, and the number of low air quality days per year to determine the worst county in every state for allergies.
Ragweed is a pollen-producing plant that can cause allergic rhinitis, commonly known as hay fever, and asthma. The symptoms of hay fever include sinus, nose, throat, and eye irritation, often accompanied by sneezing and a runny nose. Asthma is an incurable, chronic lung disease that can constrict air passages and make it difficult to breathe. Children and the elderly are particularly vulnerable to negative health effects of ragweed.
Click here to see the counties with the worst allergies in every state.
Ragweed pollen thrives in hot weather. With the 10 warmest years on record since 1880 occurring been between 2000 and 2015, increasing temperatures will likely only worsen conditions for those with asthma and ragweed allergies.
Urban environments tend to be far worse for those with asthma and ragweed allergies than rural environments. According to the NRDC’s report, cities tend to be hotter than rural areas because “building and pavement materials capture heat and re-radiate it more slowly than natural, vegetated areas, creating an urban heat island effect that could contribute to higher pollen and ozone production in cities.”
Along with warmer temperatures, cities also tend to be worse due to higher CO2 content in the atmosphere. The NRDC cites several laboratory and field tests that show “that when there is more CO2 in the environment, ragweed produces significantly more pollen.” This is especially problematic in cities where “vehicle and industrial emissions from fossil fuel combustion create ‘CO2 domes.’” All but seven of the 48 worst counties are primarily urban.
While asthma and hay fever are distinct health conditions, people who suffer from one, often also suffer from the other. According to the World Health Organization, 70% of asthmatics around the world also suffer from hay fever.
To identify the worst counties for asthma and allergies, 24/7 Wall St. reviewed ozone levels in U.S. counties from the Environmental Protection Agency for 2011-2015. The EPA measures ozone as the number of days when average concentrations of ozone reach unhealthy levels. Only counties where monitors performed at least 75% of scheduled observations, and where monitors collected data for at least four of the five years considered, were included. We also considered the presence of ragweed pollen in each county from the USDA Natural Resources Conservation Service PLANTS database. Ragweed pollen data for counties in Alaska and Maryland is not available from the USDA, and those two states were excluded from our analysis.
These are the counties with the worst allergies in every state.
Correction: An earlier version of this article failed to mention the omission of two states from our analysis. The methodology has been corrected.

1. Alabama
> County: Mobile
> Population: 415,395
> Children with asthma: 11,446
> Pct. of population living in urban area: 80.0%

2. Arizona
> County: Maricopa
> Population: 4,167,947
> Children with asthma: 86,239
> Pct. of population living in urban area: 97.6%

3. Arkansas
> County: Crittenden
> Population: 48,963
> Children with asthma: 1,251
> Pct. of population living in urban area: 79.1%

4. California
> County: Los Angeles
> Population: 10,170,292
> Children with asthma: 207,040
> Pct. of population living in urban area: 99.4%
5. Colorado
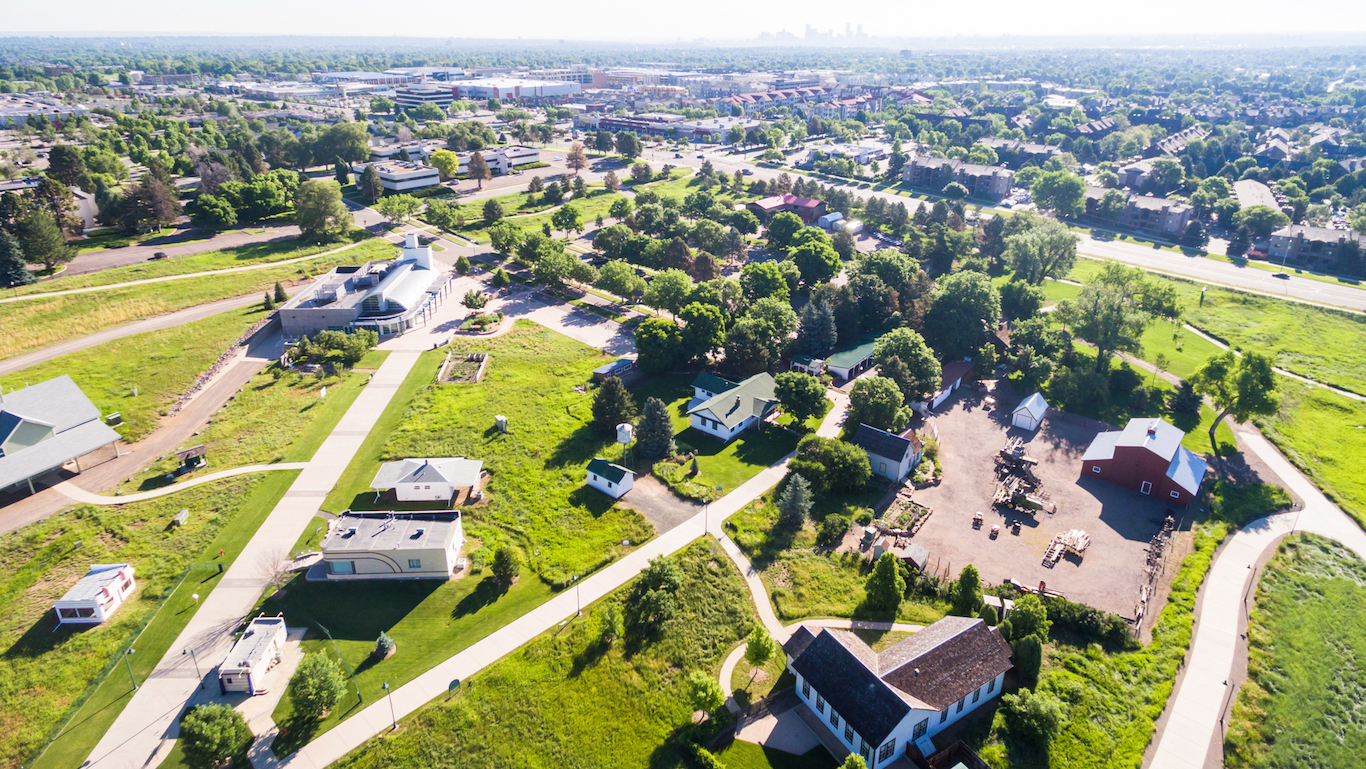
> County: Jefferson
> Population: 565,524
> Children with asthma: 10,264
> Pct. of population living in urban area: 93.1%

6. Connecticut
> County: Fairfield
> Population: 948,053
> Children with asthma: 27,176
> Pct. of population living in urban area: 95.4%

7. Delaware
> County: New Castle
> Population: 556,779
> Children with asthma: 10,877
> Pct. of population living in urban area: 95.4%

8. Florida
> County: Orange
> Population: 1,288,126
> Children with asthma: 24,422
> Pct. of population living in urban area: 98.0%

9. Georgia
> County: Fulton
> Population: 1,010,562
> Children with asthma: 24,667
> Pct. of population living in urban area: 98.9%

10. Hawaii
> County: Honolulu
> Population: 998,714
> Children with asthma: 23,601
> Pct. of population living in urban area: 99.1%
11. Idaho
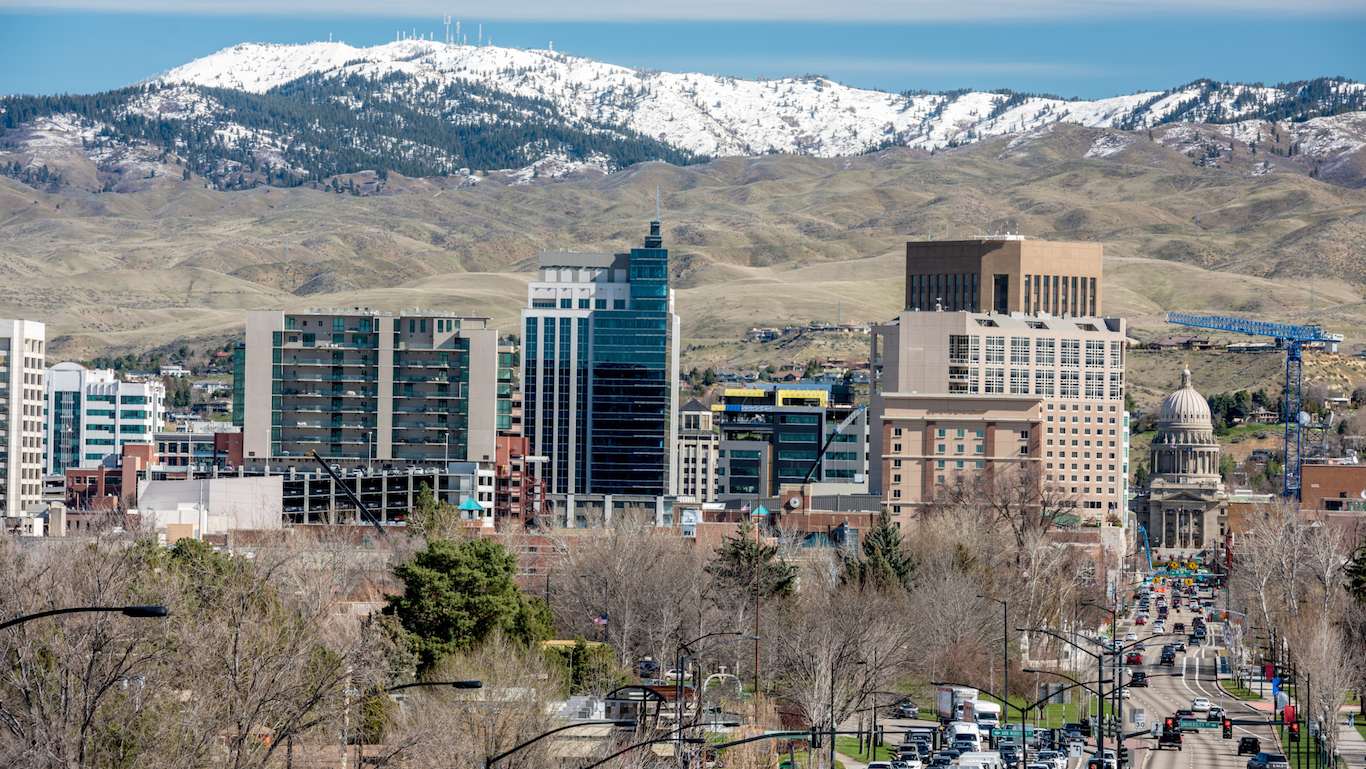
> County: Ada
> Population: 434,211
> Children with asthma: 9,254
> Pct. of population living in urban area: 94.5%

12. Illinois
> County: Lake
> Population: 703,910
> Children with asthma: 17,230
> Pct. of population living in urban area: 98.7%
13. Indiana
> County: Clark
> Population: 115,371
> Children with asthma: 2,493
> Pct. of population living in urban area: 79.5%
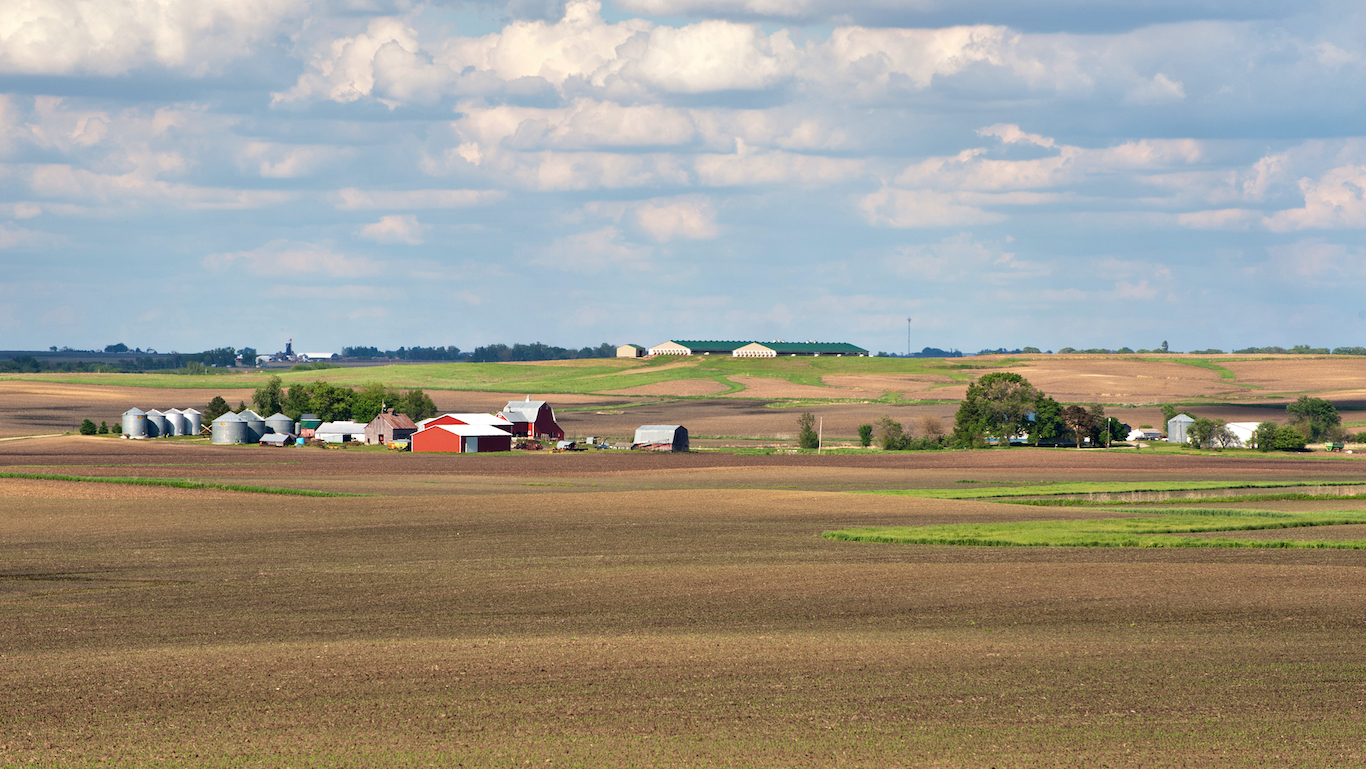
14. Iowa
> County: Harrison
> Population: 14,265
> Children with asthma: 194
> Pct. of population living in urban area: 18.9%

15. Kansas
> County: Sedgwick
> Population: 511,574
> Children with asthma: 14,120
> Pct. of population living in urban area: 92.3%

16. Kentucky
> County: Oldham
> Population: 64,875
> Children with asthma: 1,656
> Pct. of population living in urban area: 79.7%

17. Louisiana
> County: Bossier
> Population: 125,175
> Children with asthma: 2,571
> Pct. of population living in urban area: 75.7%

18. Maine
> County: Knox
> Population: 39,855
> Children with asthma: 707
> Pct. of population living in urban area: 32.1%

19. Massachusetts
> County: Dukes
> Population: 17,299
> Children with asthma: 328
> Pct. of population living in urban area: 61.0%
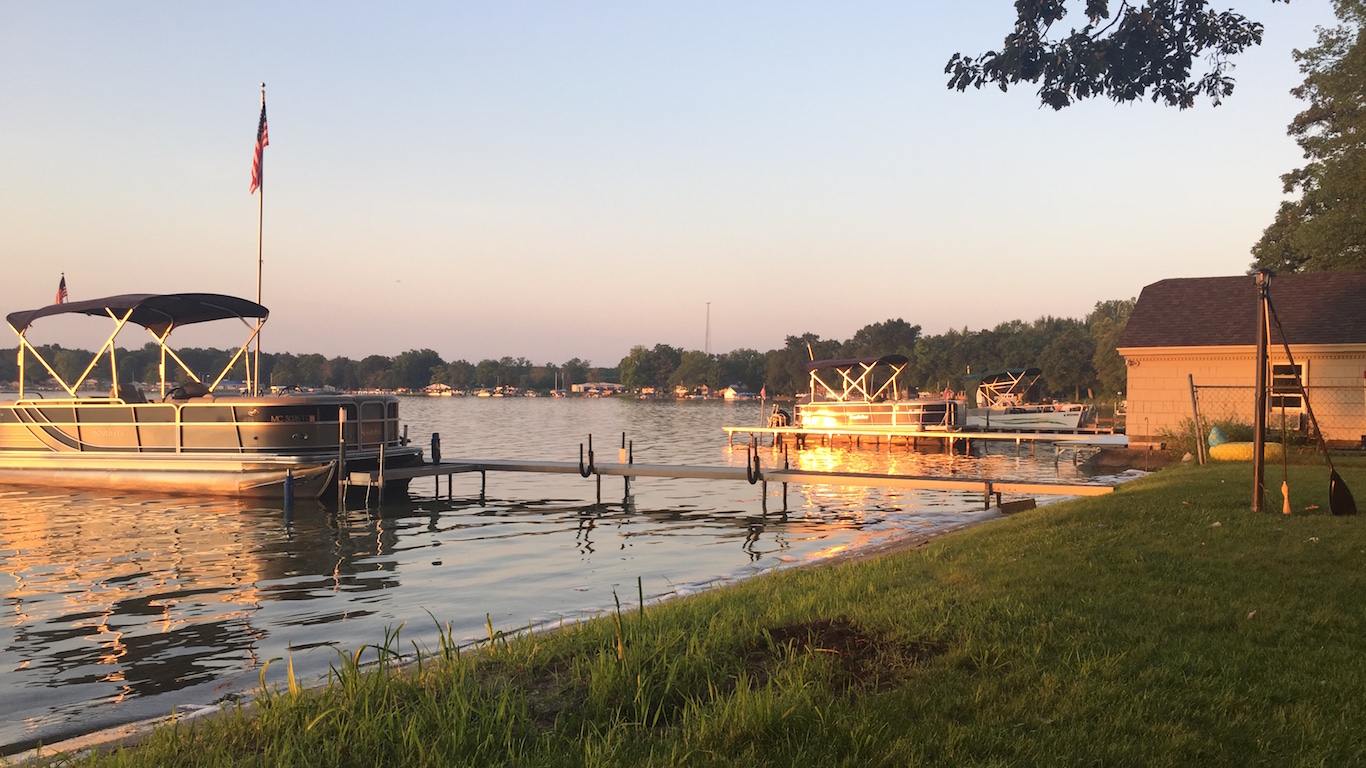
20. Michigan
> County: Allegan
> Population: 114,625
> Children with asthma: 2,690
> Pct. of population living in urban area: 35.5%

21. Minnesota
> County: Anoka
> Population: 344,151
> Children with asthma: 7,406
> Pct. of population living in urban area: 86.5%

22. Mississippi
> County: DeSoto
> Population: 173,323
> Children with asthma: 4,503
> Pct. of population living in urban area: 79.6%

23. Missouri
> County: St. Charles
> Population: 385,590
> Children with asthma: 9,243
> Pct. of population living in urban area: 94.2%

24. Montana
> County: Flathead
> Population: 96,165
> Children with asthma: 1,589
> Pct. of population living in urban area: 48.5%

25. Nebraska
> County: Knox
> Population: 8,543
> Children with asthma: 143
> Pct. of population living in urban area: 0.0%

26. Nevada
> County: Churchill
> Population: 24,200
> Children with asthma: 379
> Pct. of population living in urban area: 65.3%

27. New Hampshire
> County: Hillsborough
> Population: 406,678
> Children with asthma: 9,458
> Pct. of population living in urban area: 78.8%

28. New Jersey
> County: Middlesex
> Population: 840,900
> Children with asthma: 16,156
> Pct. of population living in urban area: 99.3%

29. New Mexico
> County: Doña Ana
> Population: 214,295
> Children with asthma: 4,136
> Pct. of population living in urban area: 80.7%

30. New York
> County: Richmond
> Population: 474,558
> Children with asthma: 9,763
> Pct. of population living in urban area: 100.0%

31. North Carolina
> County: Rowan
> Population: 139,142
> Children with asthma: 2,800
> Pct. of population living in urban area: 61.2%

32. North Dakota
> County: Burleigh
> Population: 92,991
> Children with asthma: 1,239
> Pct. of population living in urban area: 81.5%

33. Ohio
> County: Hamilton
> Population: 807,598
> Children with asthma: 16,079
> Pct. of population living in urban area: 97.8%
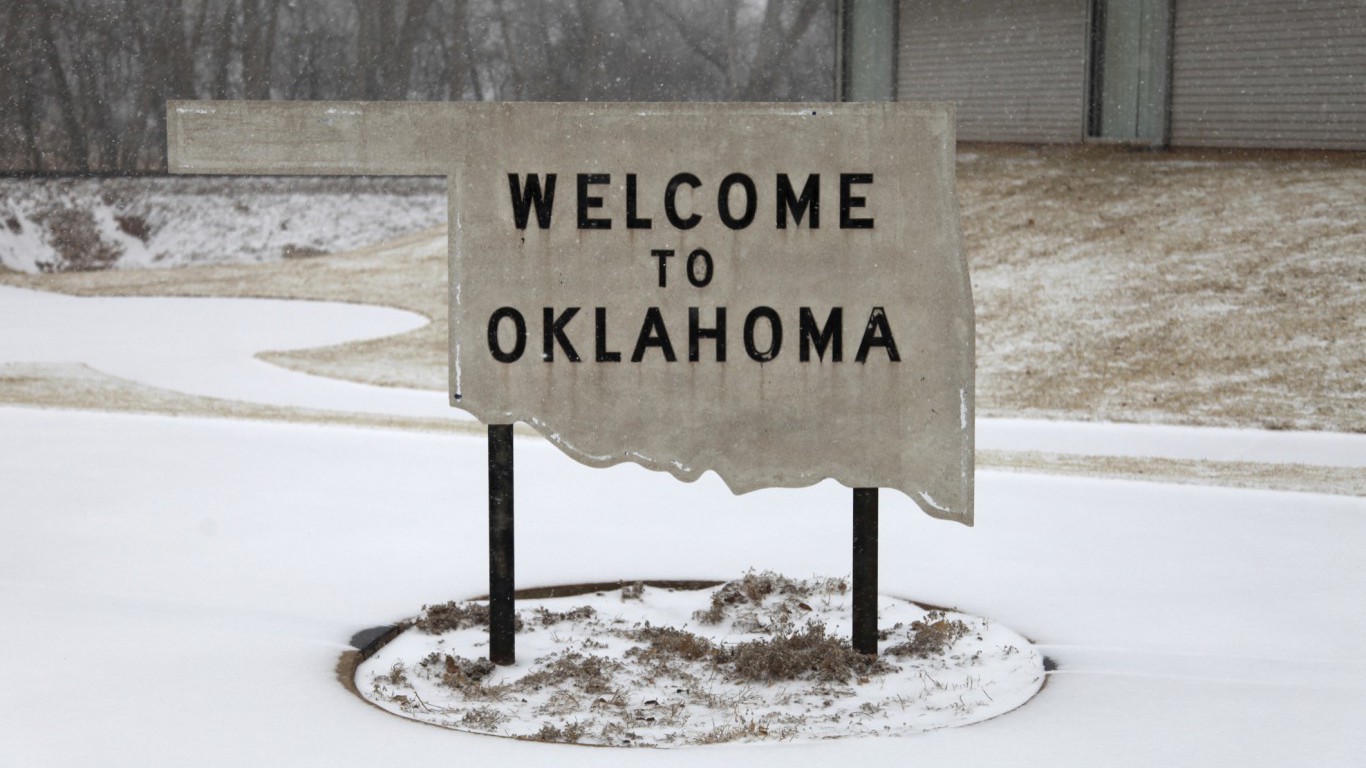
34. Oklahoma
> County: Oklahoma
> Population: 776,864
> Children with asthma: 16,121
> Pct. of population living in urban area: 93.7%

35. Oregon
> County: Marion
> Population: 330,700
> Children with asthma: 6,129
> Pct. of population living in urban area: 86.9%
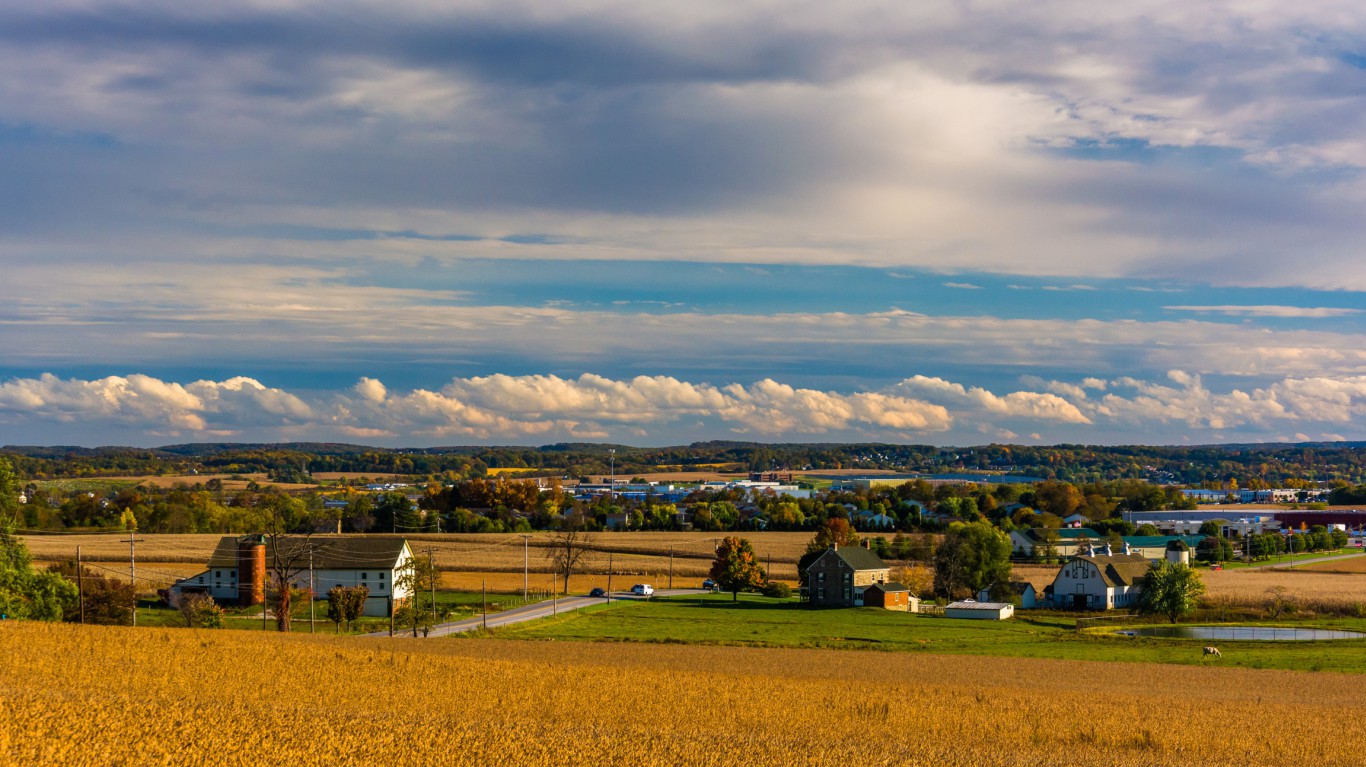
36. Pennsylvania
> County: Bucks
> Population: 627,367
> Children with asthma: 14,398
> Pct. of population living in urban area: 91.2%

37. Rhode Island
> County: Washington
> Population: 126,517
> Children with asthma: 2,160
> Pct. of population living in urban area: 69.2%

38. South Carolina
> County: Spartanburg
> Population: 297,302
> Children with asthma: 6,105
> Pct. of population living in urban area: 72.6%

39. South Dakota
> County: Meade
> Population: 26,986
> Children with asthma: 543
> Pct. of population living in urban area: 62.0%
40. Tennessee
> County: Sumner
> Population: 175,989
> Children with asthma: 3,336
> Pct. of population living in urban area: 72.1%

41. Texas
> County: Dallas
> Population: 2,553,385
> Children with asthma: 52,192
> Pct. of population living in urban area: 99.3%

42. Utah
> County: Duchesne
> Population: 20,862
> Children with asthma: 458
> Pct. of population living in urban area: 31.8%

43. Vermont
> County: Bennington
> Population: 36,317
> Children with asthma: 579
> Pct. of population living in urban area: 35.5%

44. Virginia
> County: Fairfax
> Population: 1,142,234
> Children with asthma: 23,441
> Pct. of population living in urban area: 98.6%

45. Washington
> County: King
> Population: 2,117,125
> Children with asthma: 28,263
> Pct. of population living in urban area: 96.8%

46. West Virginia
> County: Kanawha
> Population: 188,332
> Children with asthma: 3,061
> Pct. of population living in urban area: 74.8%

47. Wisconsin
> County: Sheboygan
> Population: 115,569
> Children with asthma: 2,047
> Pct. of population living in urban area: 71.7%

48. Wyoming
> County: Campbell
> Population: 49,220
> Children with asthma: 1,145
> Pct. of population living in urban area: 70.9%
Start by taking a quick retirement quiz from SmartAsset that will match you with up to 3 financial advisors that serve your area and beyond in 5 minutes, or less.
Each advisor has been vetted by SmartAsset and is held to a fiduciary standard to act in your best interests.
Here’s how it works:
1. Answer SmartAsset advisor match quiz
2. Review your pre-screened matches at your leisure. Check out the advisors’ profiles.
3. Speak with advisors at no cost to you. Have an introductory call on the phone or introduction in person and choose whom to work with in the future
Get started right here.
Thank you for reading! Have some feedback for us?
Contact the 24/7 Wall St. editorial team.