Based on cost of living data recently released by the Bureau of Economic Analysis, 24/7 Wall St. reviewed the most expensive cities in every state. In Honolulu, Hawaii, prices of goods and services are 23.5% greater than the national average, with prices in the San Jose, California and New York City, New York areas following nearly as high. By contrast, the cost of living is 20.3% less than the national average in Beckley, West Virginia.
Goods and services tend to cost more in areas where residents earn higher incomes, while prices are typically lower in poorer areas. Prices in only six metro areas are at least 20% greater than national average prices. Of the 16 metro areas where the cost of living is 10% or higher than the national average, nine are in California.
Click here to see the most expensive city in each state.
Many of the least expensive urban areas are located in the Southern United States, which is home to some of the nation’s poorest towns. There are exceptions, however, such as Rome, Illinois, where goods and services are second cheapest of any U.S. metro area.
The most expensive city in a relatively poor state is almost always still less expensive than the nation on average. The costs of goods and services in the most expensive cities in each of the five least expensive states — Mississippi, Arkansas, Alabama, South Dakota, and Kentucky — are still well below price levels nationwide. This is not always the case, however. In seven of the states where prices are below the national average, the cost of living in the most expensive city exceeds that of the nation.
To identify the most expensive cities in every state, 24/7 Wall St. reviewed 2014 regional price parities, or cost of living, in each of the nation’s 381 metropolitan statistical areas. RPPs are calculated by the Bureau of Economic Analysis using price quotes for a wide range of items from the Consumer Price Index, as well as rent costs from the Census Bureau’s American Community Survey. The cost of living for states also came from the BEA. Poverty rates and median household income for each MSA came from the U.S. Census Bureau’s American Community Survey.
These are the most expensive cities in every state.

1. Daphne-Fairhope-Foley, Alabama
> Cost of living compared to nation: 7.7% less expensive
> State cost of living compared to nation: 12.2% less expensive (3rd lowest)
> Poverty rate: 12.7%
> Median household income: $48,461
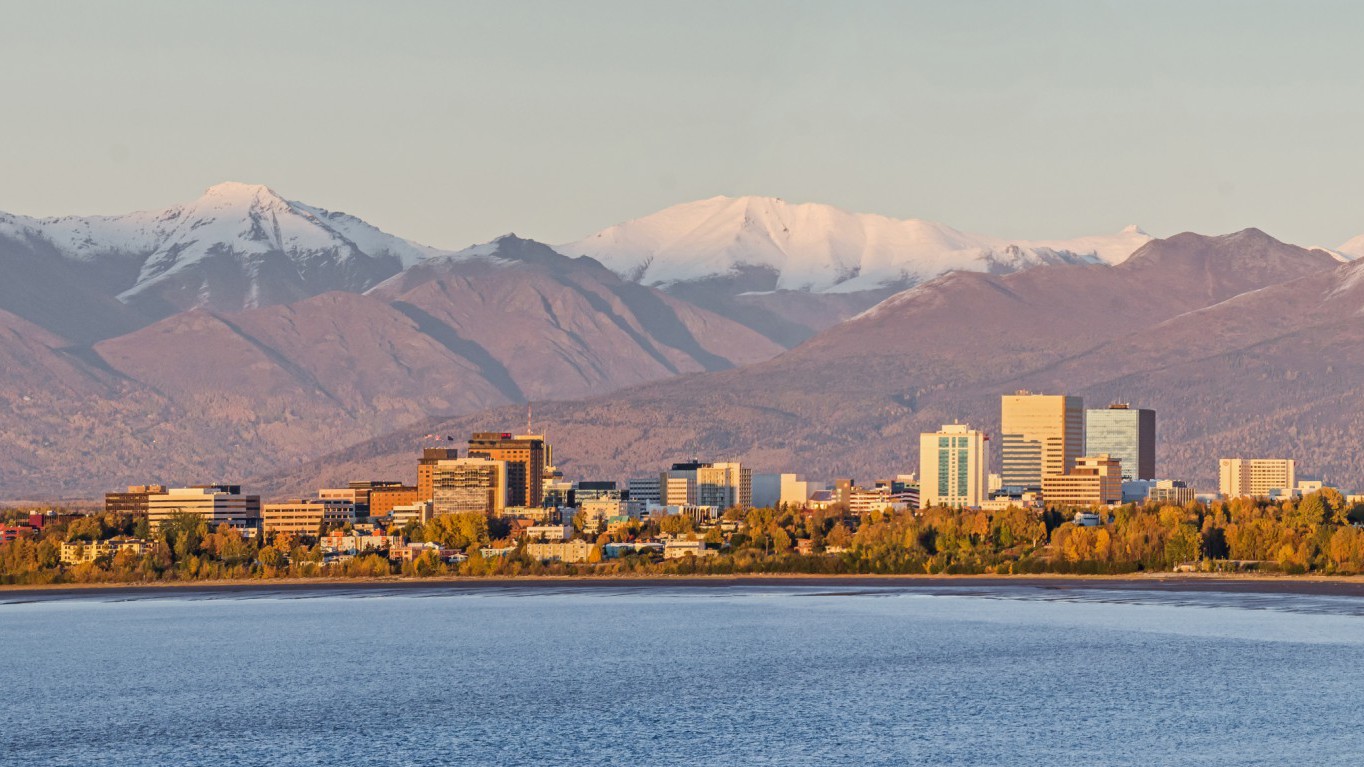
2. Anchorage, Alaska
> Cost of living compared to nation: 9.6% more expensive
> State cost of living compared to nation: 5.7% more expensive (8th highest)
> Poverty rate: 9.9%
> Median household income: $75,682

3. Phoenix-Mesa-Scottsdale, Arizona
> Cost of living compared to nation: 2.3% less expensive
> State cost of living compared to nation: 3.6% less expensive (25th highest)
> Poverty rate: 17.2%
> Median household income: $53,365
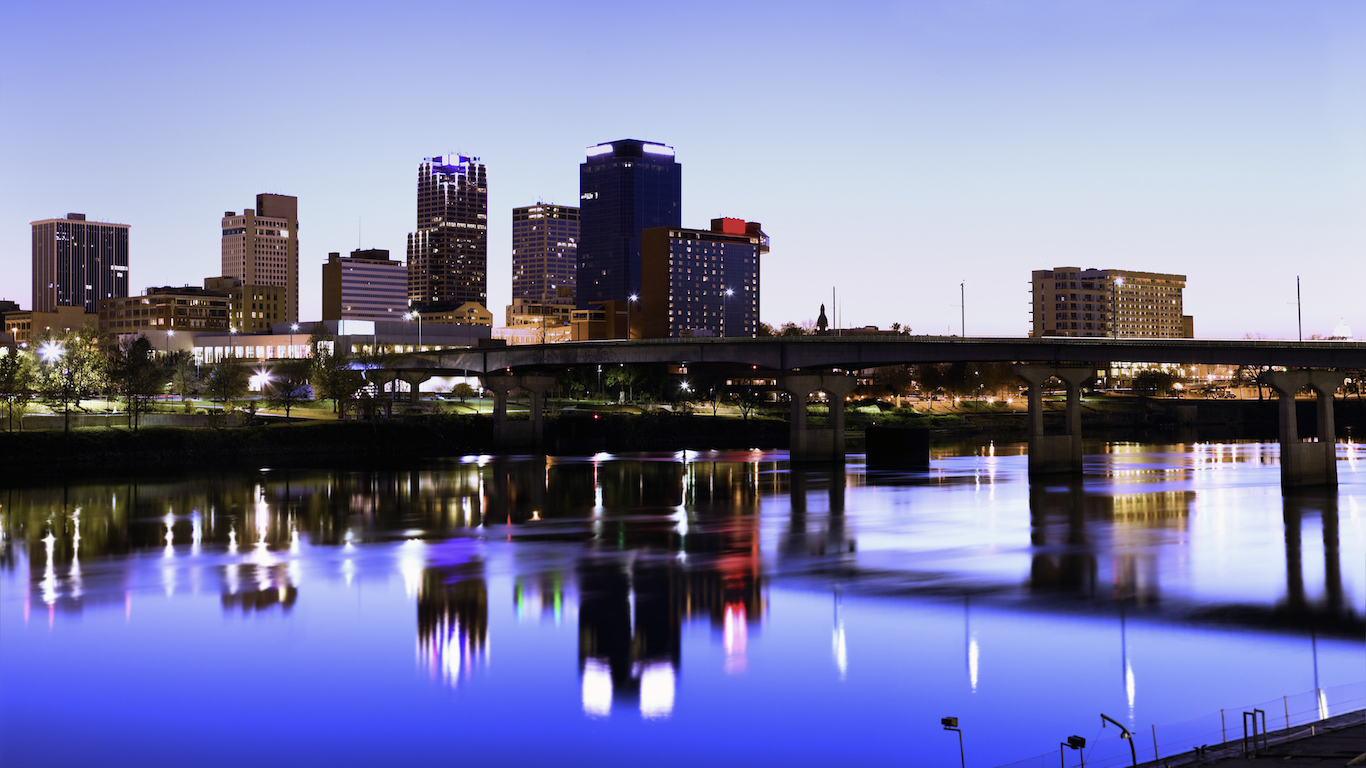
4. Little Rock-North Little Rock-Conway, Arkansas
> Cost of living compared to nation: 9.3% less expensive
> State cost of living compared to nation: 12.5% less expensive (2nd lowest)
> Poverty rate: 14.0%
> Median household income: $48,330
 24/7 Wall St.
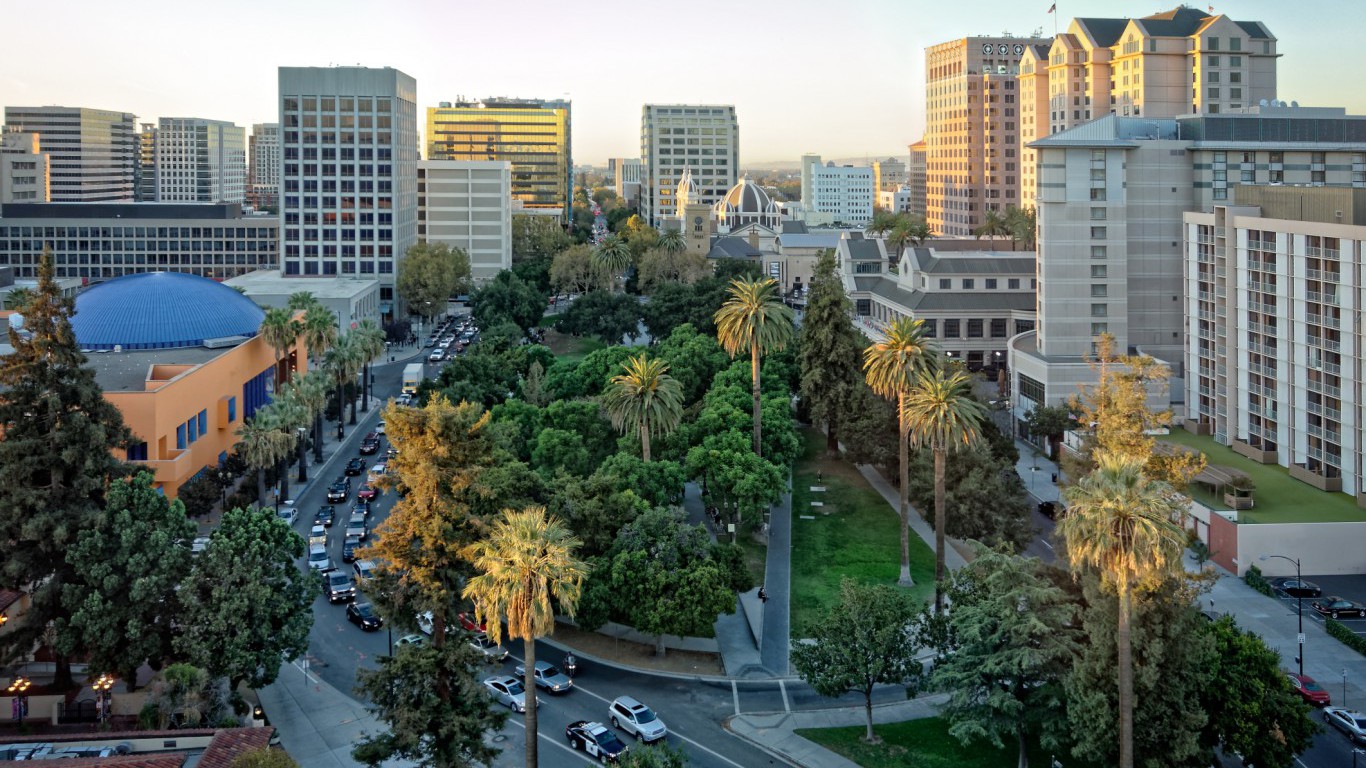
5. San Jose-Sunnyvale-Santa Clara, California
> Cost of living compared to nation: 22.9% more expensive
> State cost of living compared to nation: 12.4% more expensive (4th highest)
> Poverty rate: 8.7%
> Median household income: $96,481
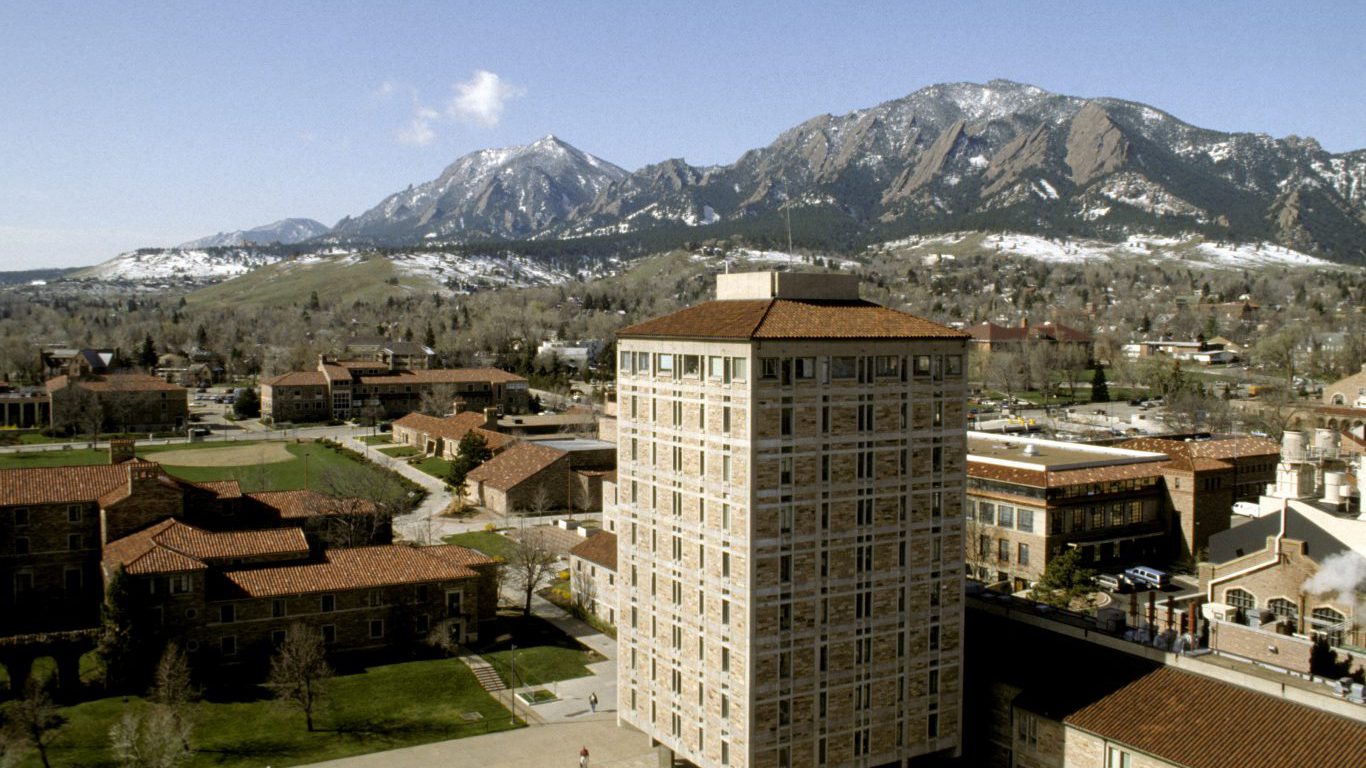
6. Boulder, Colorado
> Cost of living compared to nation: 9.1% more expensive
> State cost of living compared to nation: 2.0% more expensive (12th highest)
> Poverty rate: 14.1%
> Median household income: $71,540
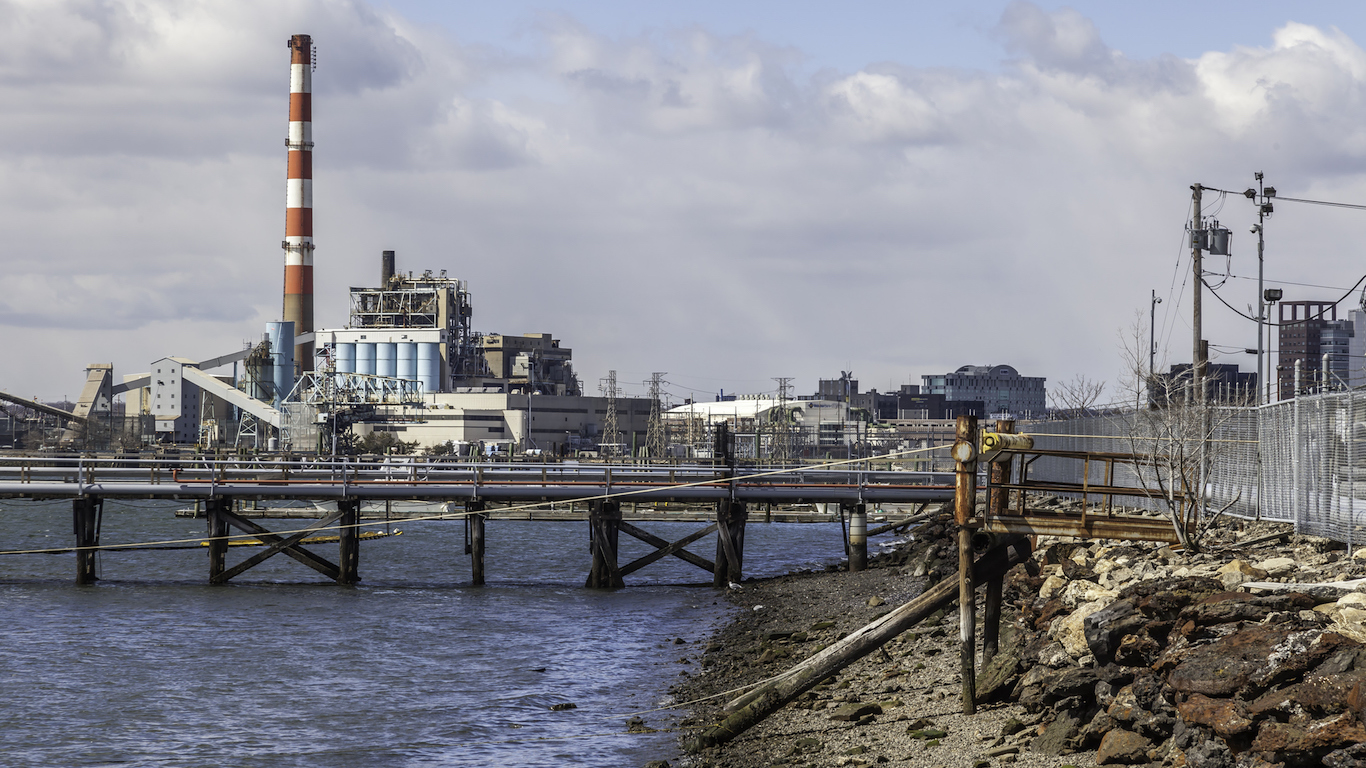
7. Bridgeport-Stamford-Norwalk, Connecticut
> Cost of living compared to nation: 20.4% more expensive
> State cost of living compared to nation: 8.8% more expensive (6th highest)
> Poverty rate: 8.9%
> Median household income: $85,925
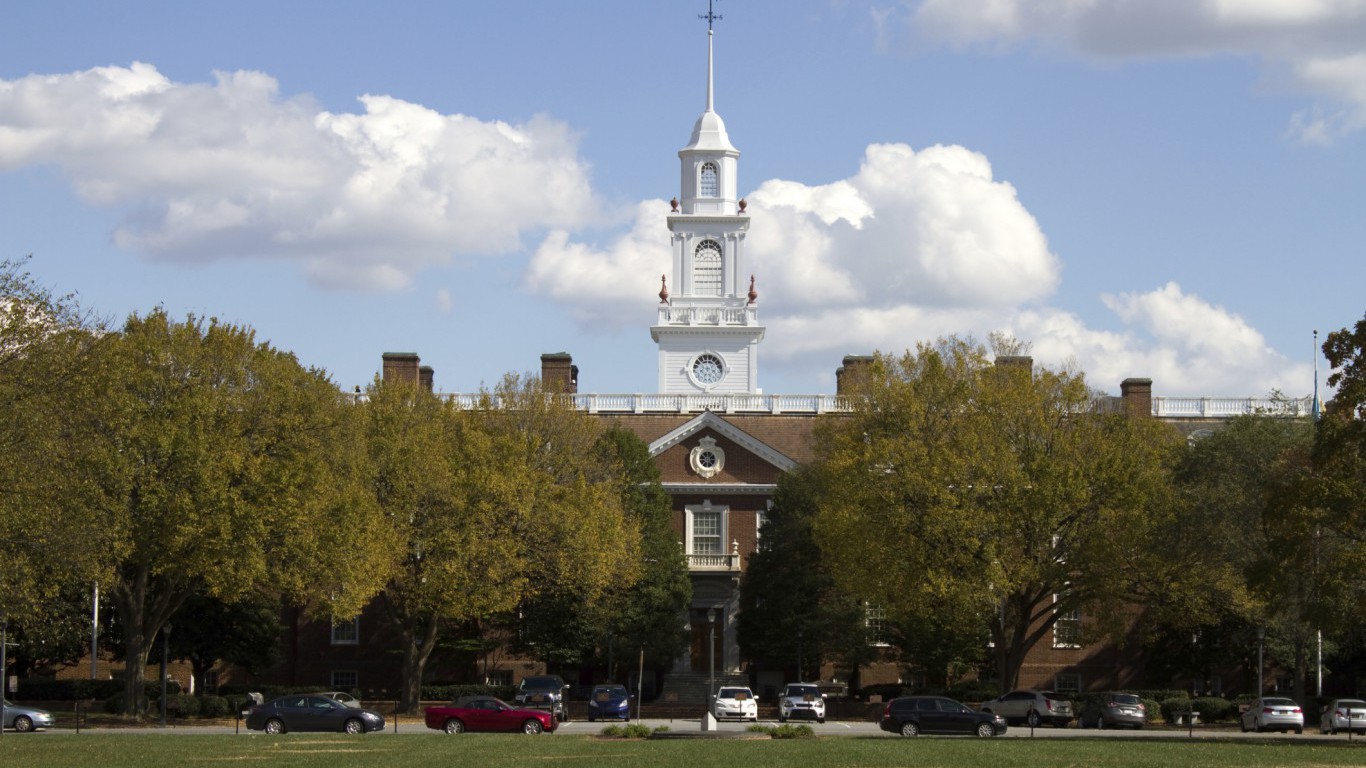
8. Dover, Delaware
> Cost of living compared to nation: 5.8% less expensive
> State cost of living compared to nation: 1.9% more expensive (13th highest)
> Poverty rate: 13.4%
> Median household income: $55,227
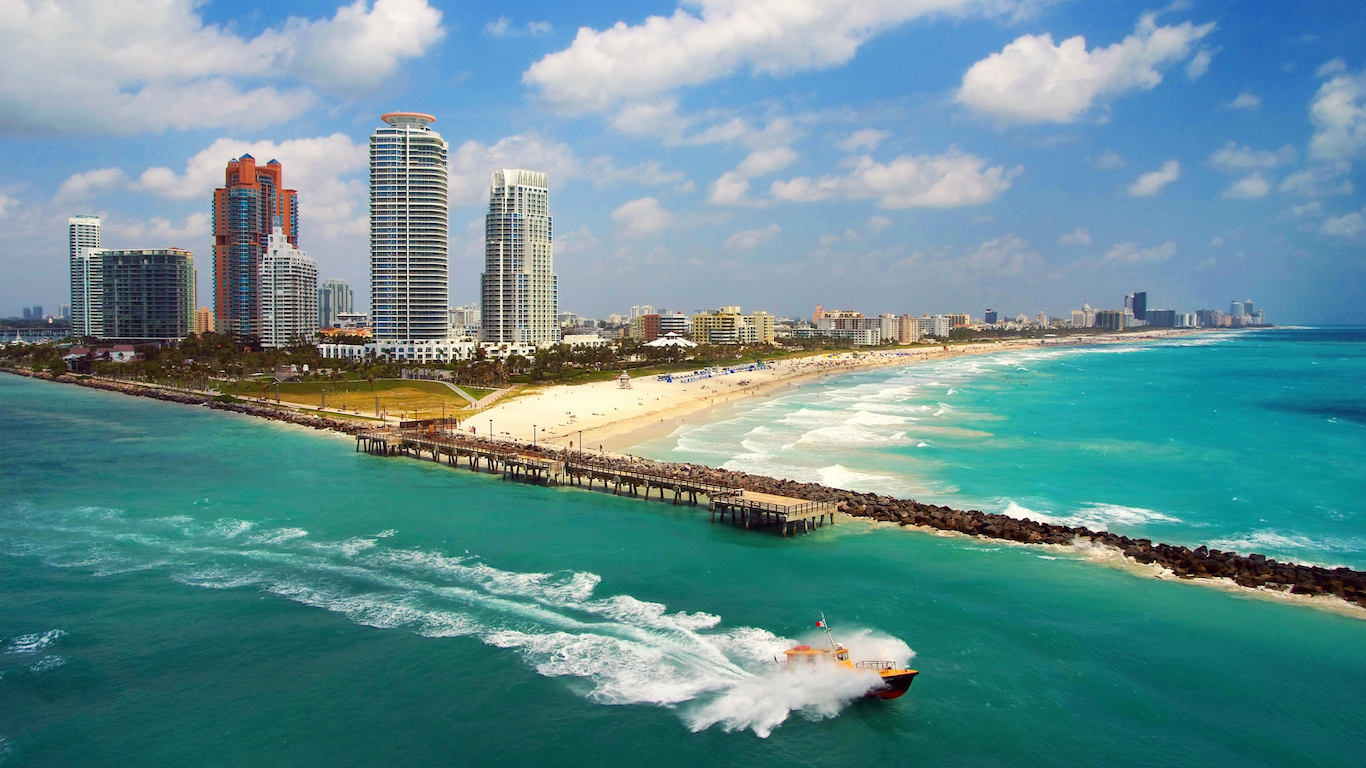
9. Miami-Fort Lauderdale-West Palm Beach, Florida
> Cost of living compared to nation: 5.9% more expensive
> State cost of living compared to nation: 0.9% less expensive (16th highest)
> Poverty rate: 17.2%
> Median household income: $48,458

10. Atlanta-Sandy Springs-Roswell, Georgia
> Cost of living compared to nation: 4.4% less expensive
> State cost of living compared to nation: 8.0% less expensive (19th lowest)
> Poverty rate: 15.5%
> Median household income: $56,166
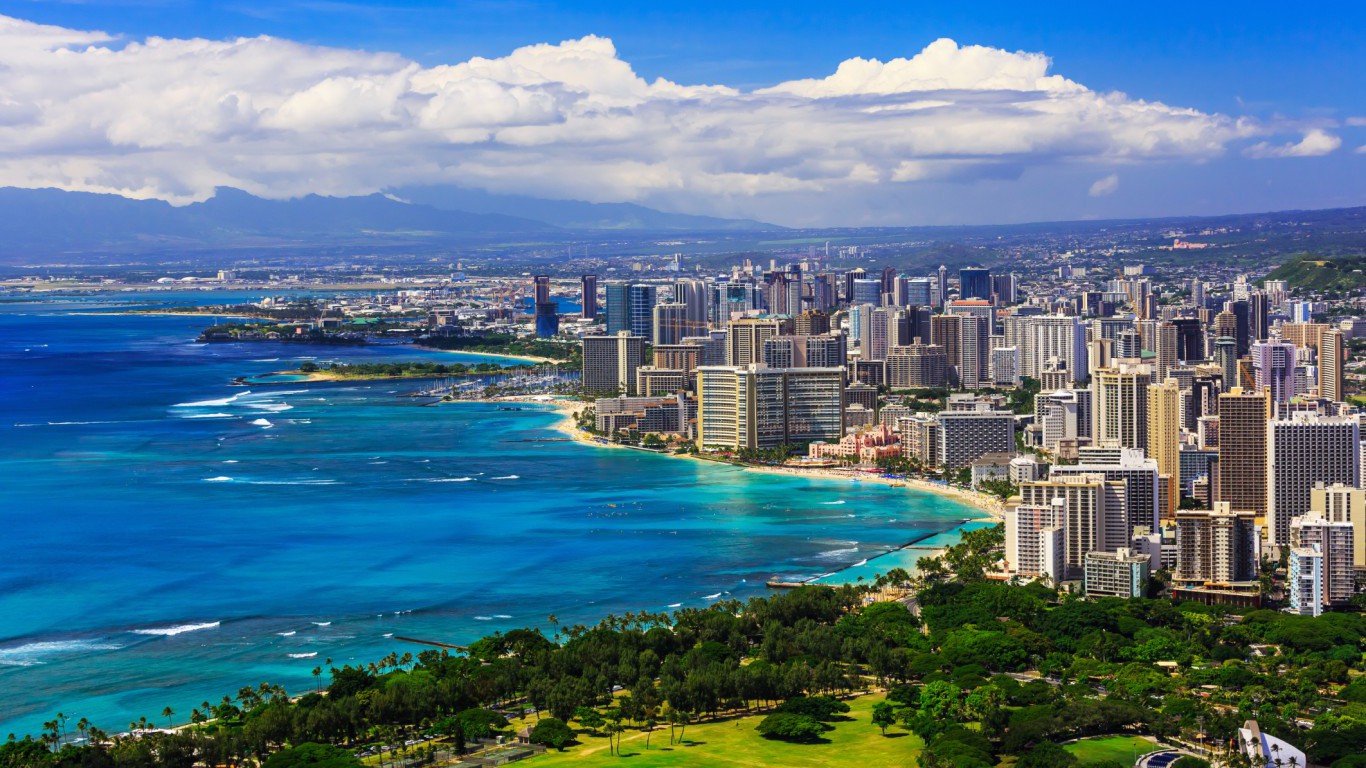
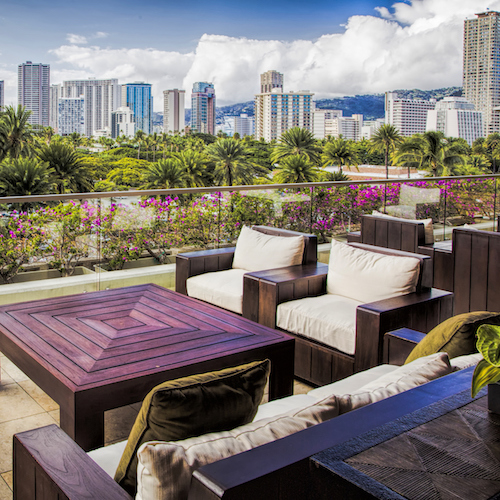
11. Urban Honolulu, Hawaii
> Cost of living compared to nation: 23.5% more expensive
> State cost of living compared to nation: 16.8% more expensive (the highest)
> Poverty rate: 9.7%
> Median household income: $74,634
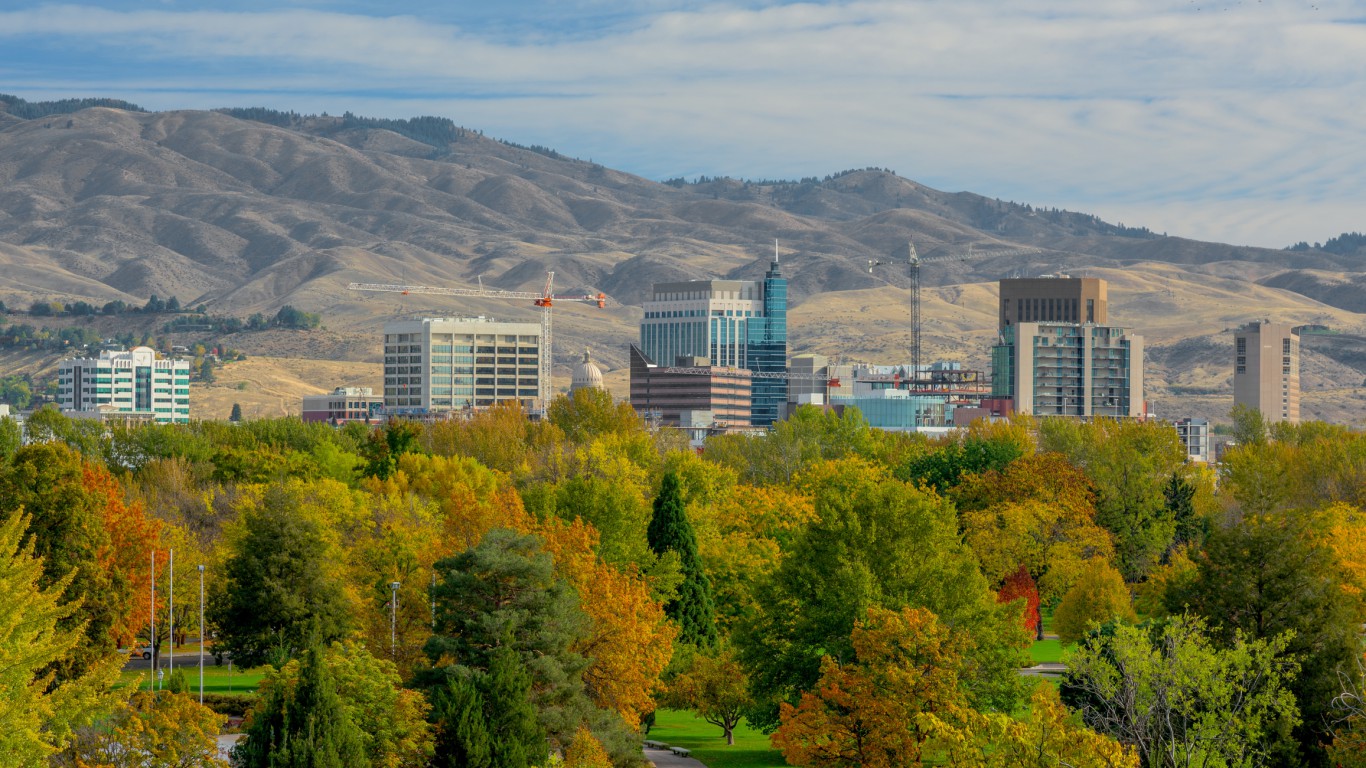
12. Boise City, Idaho
> Cost of living compared to nation: 4.9% less expensive
> State cost of living compared to nation: 6.6% less expensive (21st lowest)
> Poverty rate: 13.9%
> Median household income: $51,826
 24/7 Wall St.
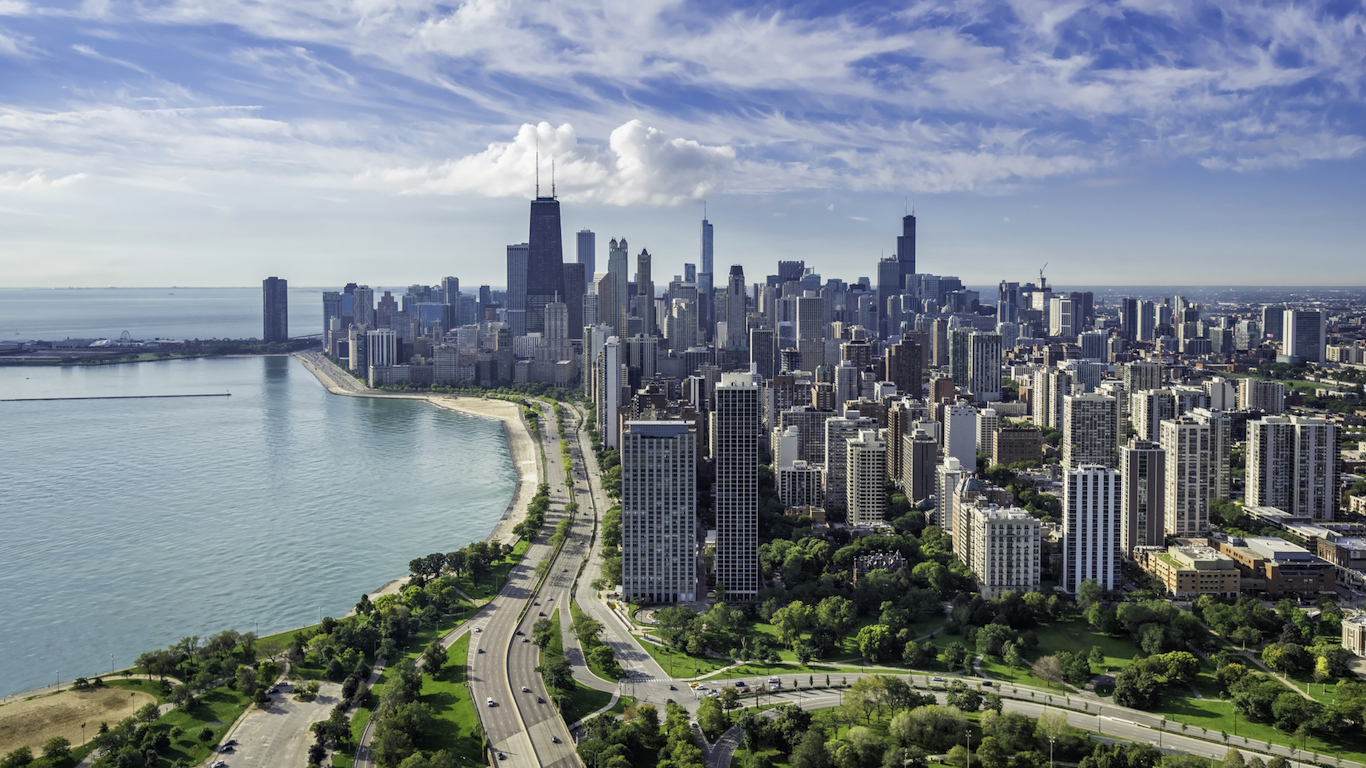
13. Chicago-Naperville-Elgin, Illinois
> Cost of living compared to nation: 6.0% more expensive
> State cost of living compared to nation: 0.7% more expensive (15th highest)
> Poverty rate: 13.9%
> Median household income: $61,598

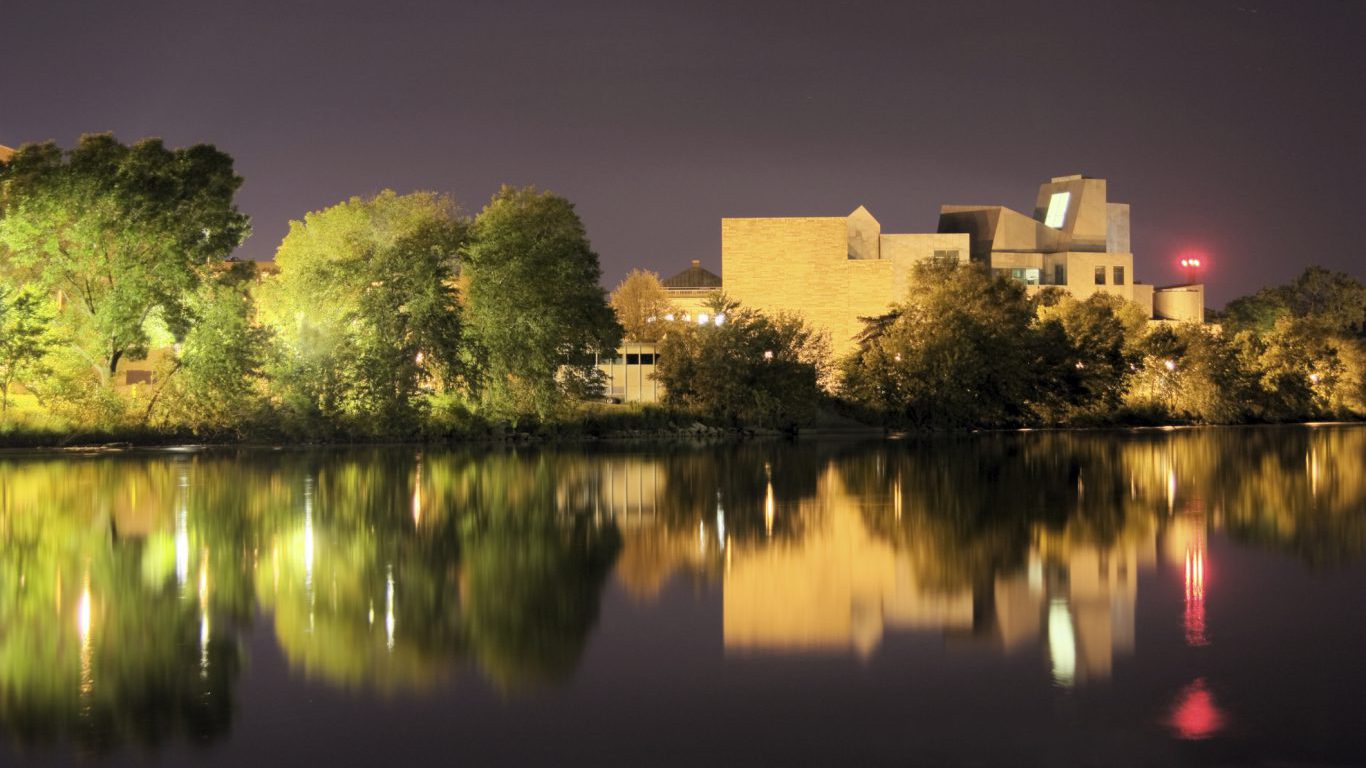
14. Bloomington, Indiana
> Cost of living compared to nation: 5.1% less expensive
> State cost of living compared to nation: 8.6% less expensive (16th lowest)
> Poverty rate: 24.1%
> Median household income: $44,963
15. Iowa City, Iowa
> Cost of living compared to nation: 3.7% less expensive
> State cost of living compared to nation: 9.7% less expensive (11th lowest)
> Poverty rate: 16.0%
> Median household income: $59,791
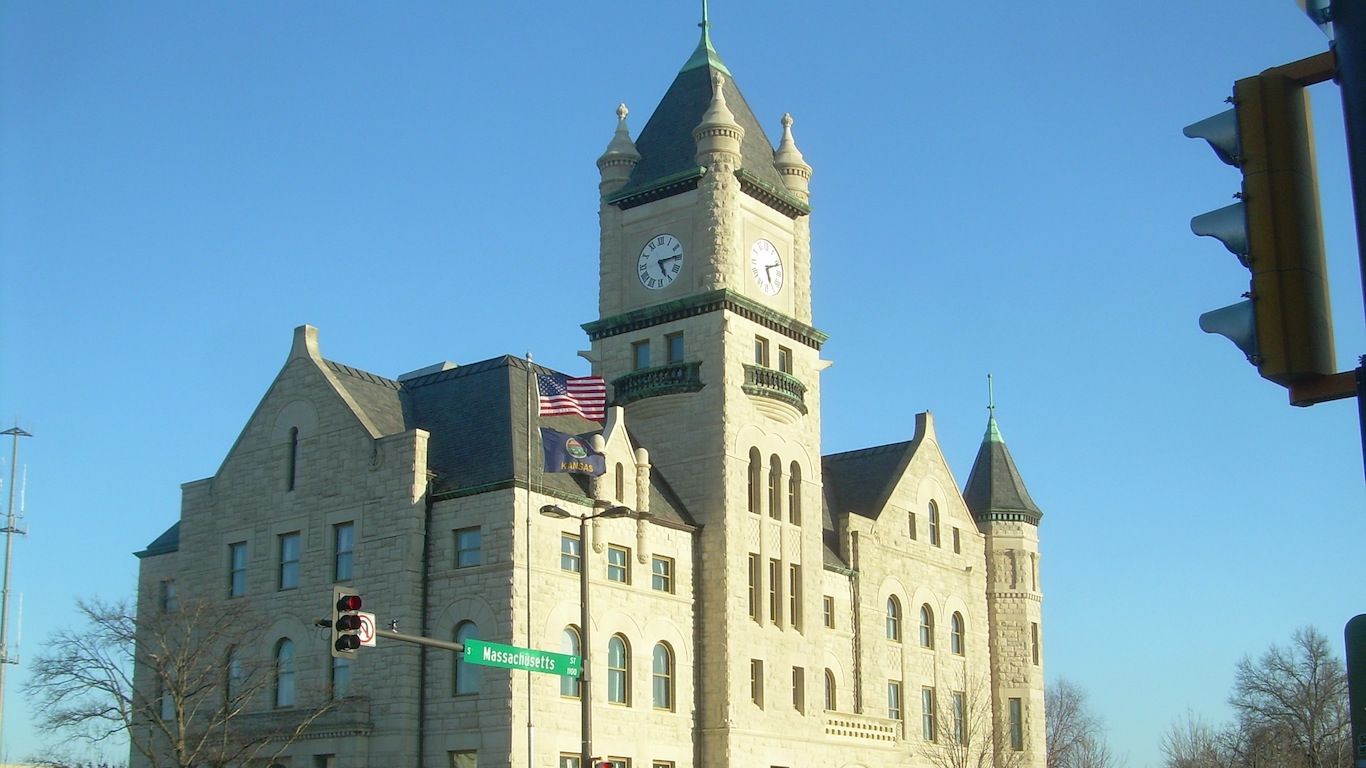
16. Lawrence, Kansas
> Cost of living compared to nation: 5.7% less expensive
> State cost of living compared to nation: 9.3% less expensive (14th lowest)
> Poverty rate: 20.5%
> Median household income: $48,565

17. Lexington-Fayette, Kentucky
> Cost of living compared to nation: 7.6% less expensive
> State cost of living compared to nation: 11.3% less expensive (5th lowest)
> Poverty rate: 18.2%
> Median household income: $50,270

18. New Orleans-Metairie, Louisiana
> Cost of living compared to nation: 4.0% less expensive
> State cost of living compared to nation: 8.6% less expensive (16th lowest)
> Poverty rate: 18.1%
> Median household income: $46,784

19. Portland-South Portland, Maine
> Cost of living compared to nation: 0.7% more expensive
> State cost of living compared to nation: 2.9% less expensive (22nd highest)
> Poverty rate: 11.0%
> Median household income: $59,573
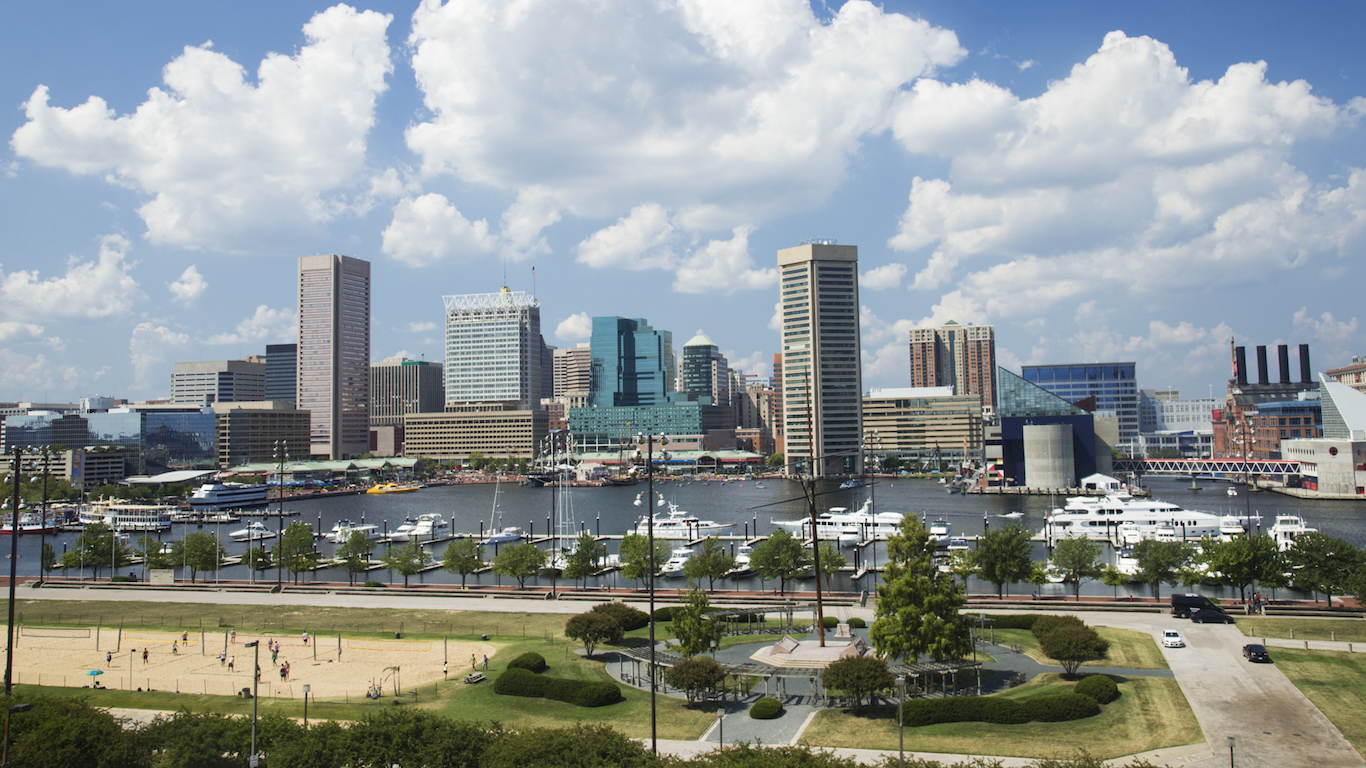
20. Baltimore-Columbia-Towson, Maryland
> Cost of living compared to nation: 8.0% more expensive
> State cost of living compared to nation: 10.3% more expensive (5th highest)
> Poverty rate: 11.1%
> Median household income: $71,501

21. Boston-Cambridge-Newton, Massachusetts
> Cost of living compared to nation: 10.3% more expensive
> State cost of living compared to nation: 7.1% more expensive (7th highest)
> Poverty rate: 10.6%
> Median household income: $75,667

22. Ann Arbor, Michigan
> Cost of living compared to nation: 2.0% more expensive
> State cost of living compared to nation: 5.9% less expensive (22nd lowest)
> Poverty rate: 14.5%
> Median household income: $62,845

23. Minneapolis-St. Paul-Bloomington, Minnesota
> Cost of living compared to nation: 2.6% more expensive
> State cost of living compared to nation: 2.4% less expensive (21st highest)
> Poverty rate: 10.3%
> Median household income: $69,111
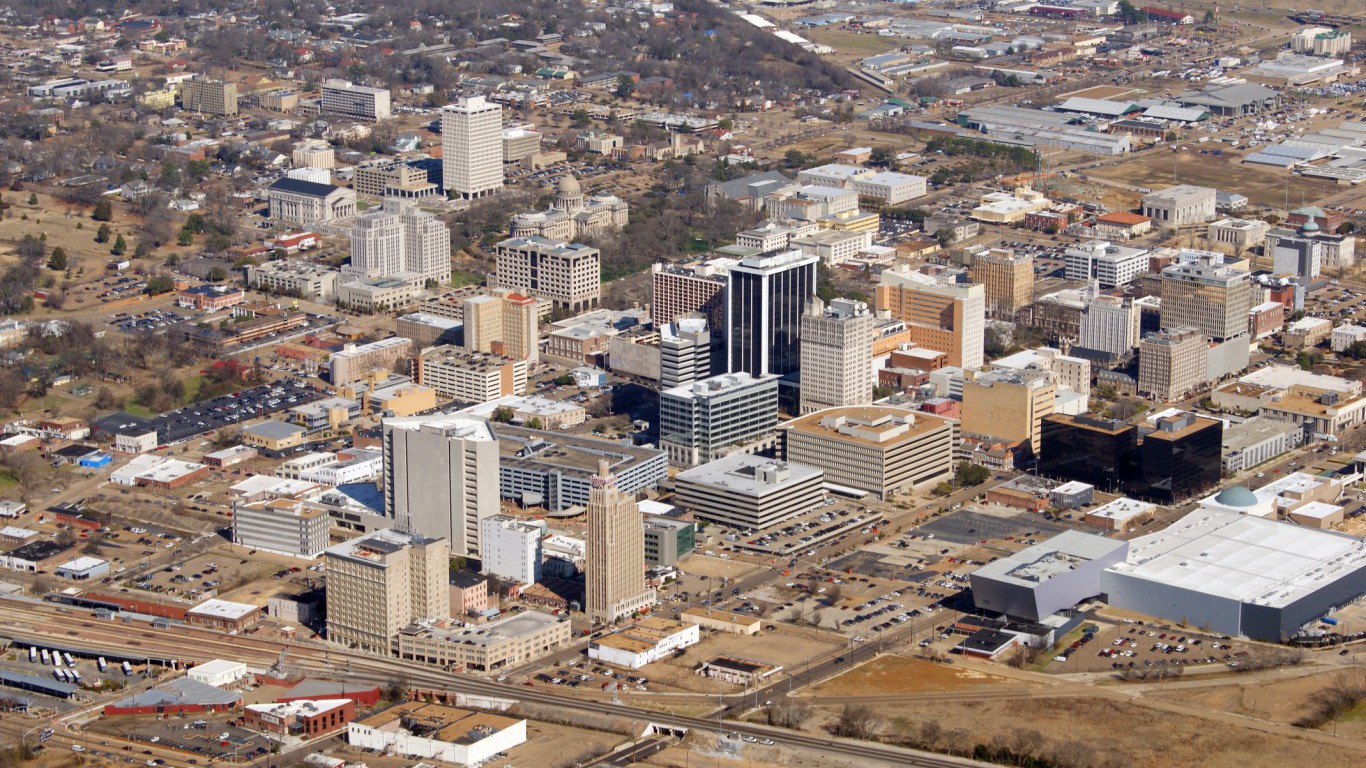
24. Jackson, Mississippi
> Cost of living compared to nation: 9.4% less expensive
> State cost of living compared to nation: 13.3% less expensive (the lowest)
> Poverty rate: 18.5%
> Median household income: $46,967
 24/7 Wall St.
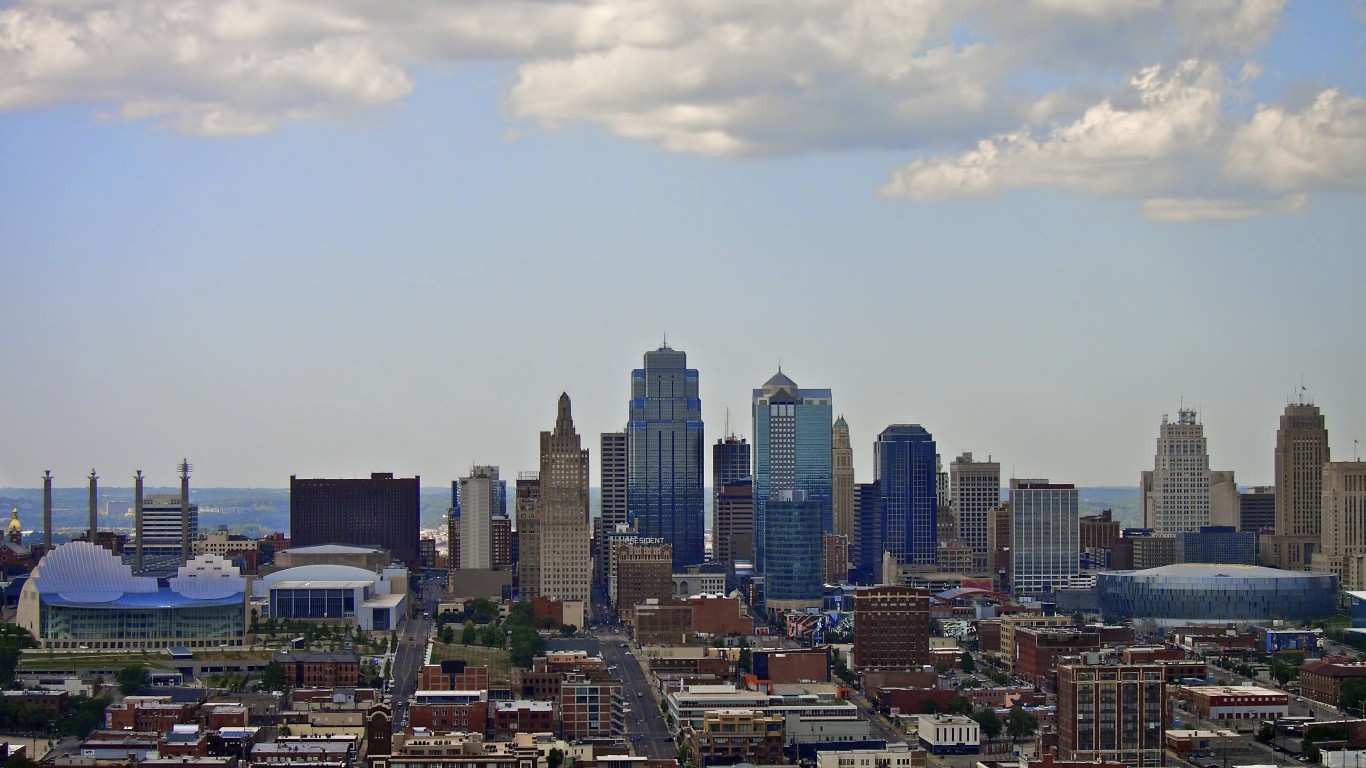
25. Kansas City, Missouri
> Cost of living compared to nation: 6.6% less expensive
> State cost of living compared to nation: 10.6% less expensive (8th lowest)
> Poverty rate: 12.6%
> Median household income: $56,994
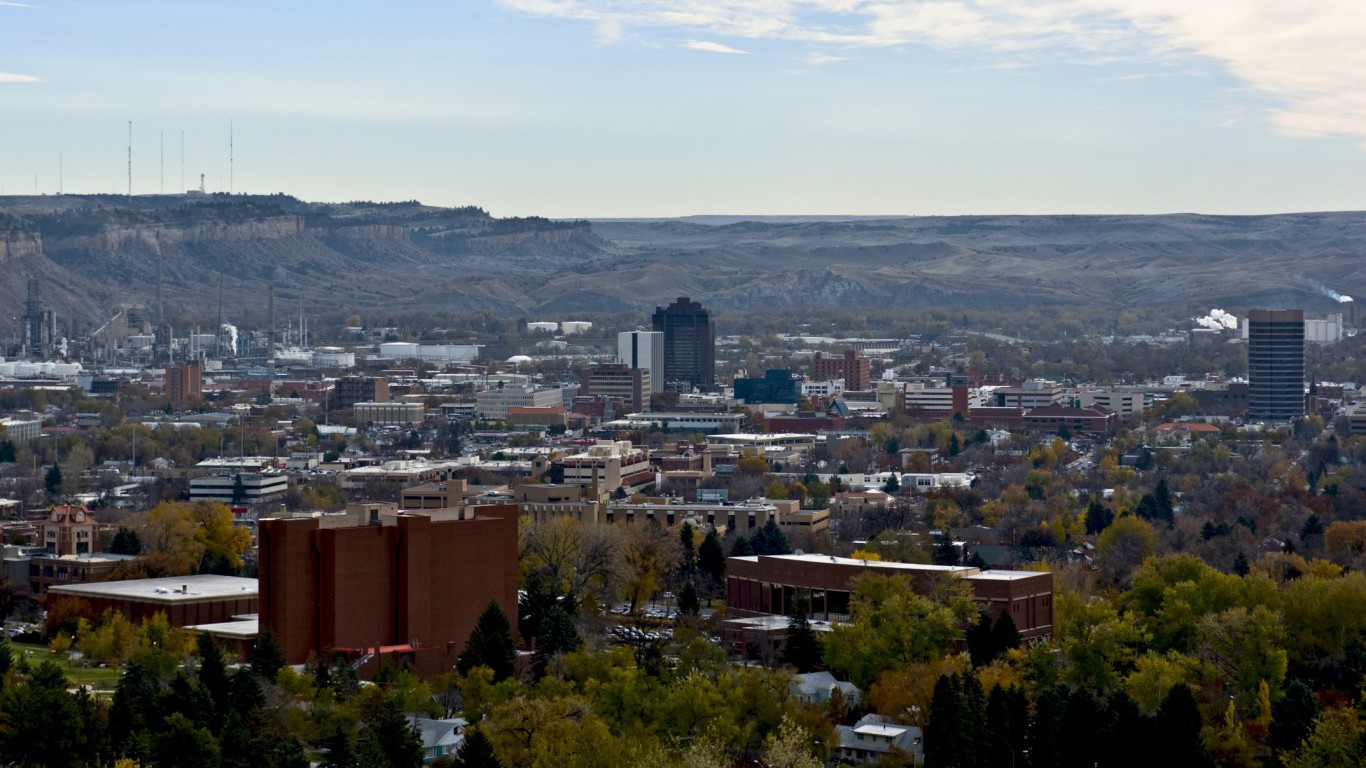
26. Billings, Montana
> Cost of living compared to nation: 2.3% less expensive
> State cost of living compared to nation: 5.8% less expensive (23rd lowest)
> Poverty rate: 12.2%
> Median household income: $51,111
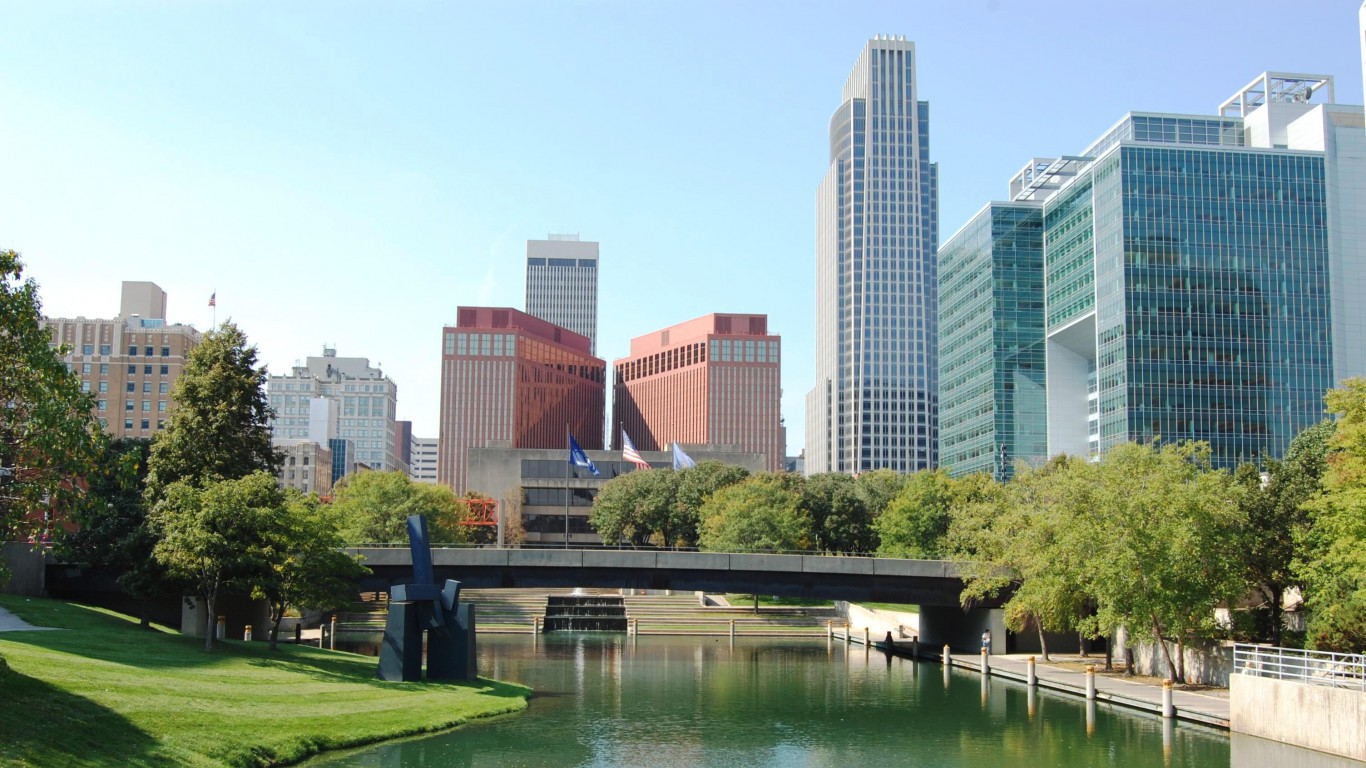
27. Omaha-Council Bluffs, Nebraska
> Cost of living compared to nation: 5.9% less expensive
> State cost of living compared to nation: 9.4% less expensive (13th lowest)
> Poverty rate: 11.3%
> Median household income: $57,527
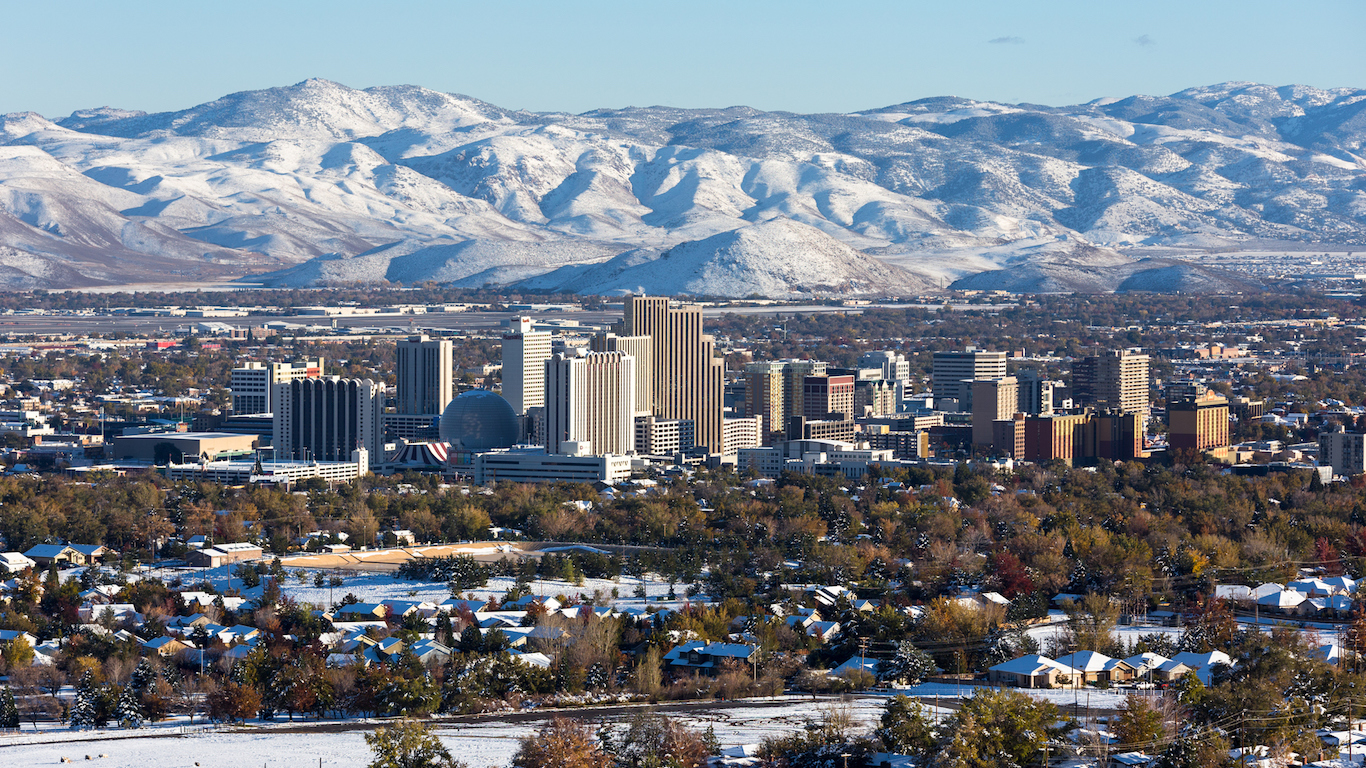
28. Reno, Nevada
> Cost of living compared to nation: 0.9% less expensive
> State cost of living compared to nation: 2.3% less expensive (20th highest)
> Poverty rate: 15.5%
> Median household income: $52,728
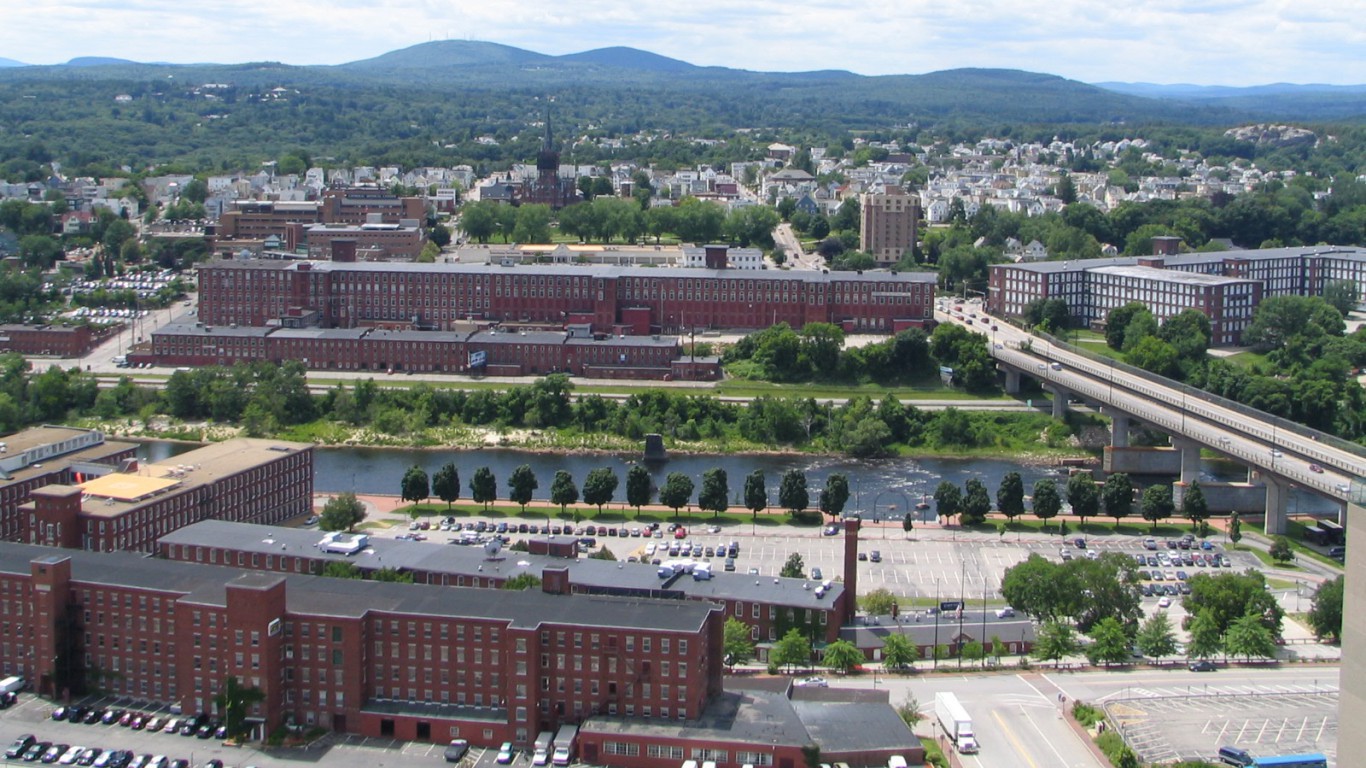
29. Manchester-Nashua, New Hampshire
> Cost of living compared to nation: 8.2% more expensive
> State cost of living compared to nation: 5.2% more expensive (9th highest)
> Poverty rate: 8.7%
> Median household income: $71,422
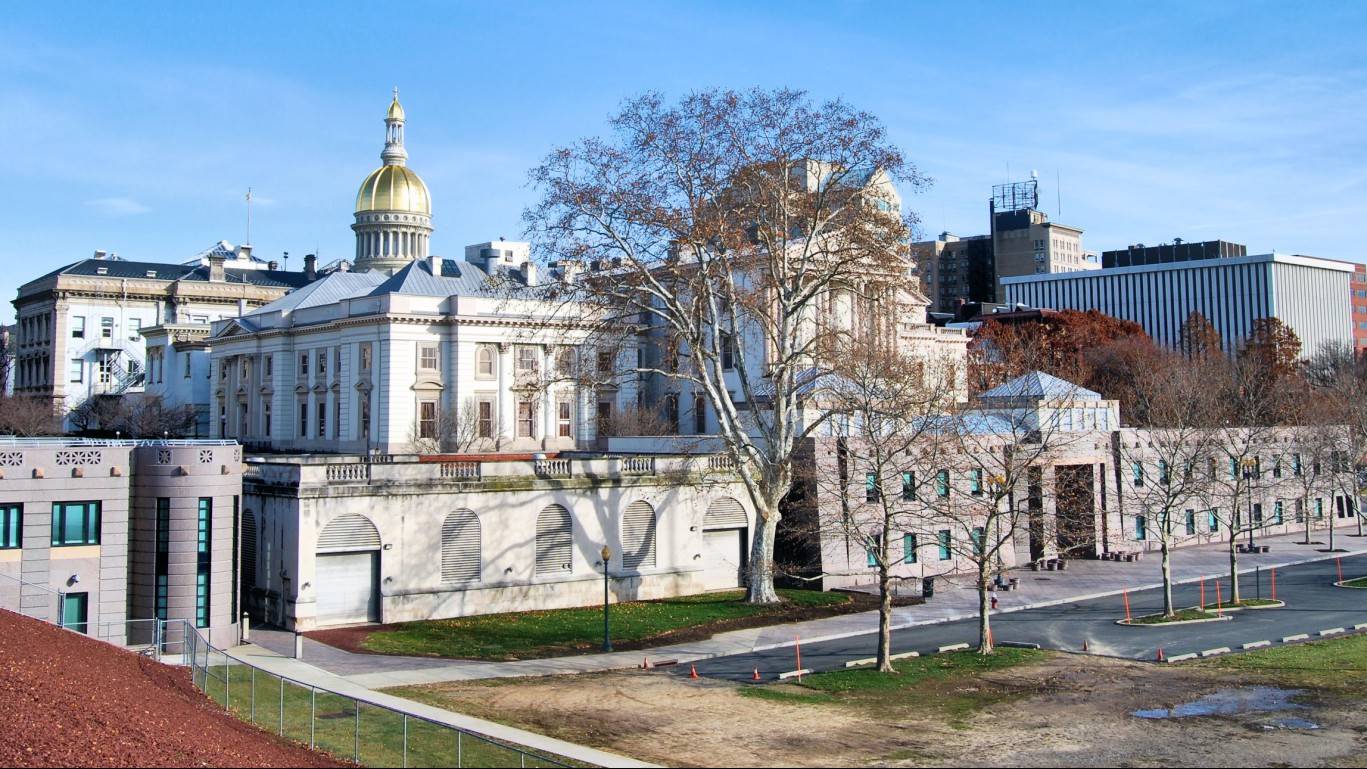
30. Trenton, New Jersey
> Cost of living compared to nation: 12.5% more expensive
> State cost of living compared to nation: 14.5% more expensive (3rd highest)
> Poverty rate: 11.9%
> Median household income: $74,961
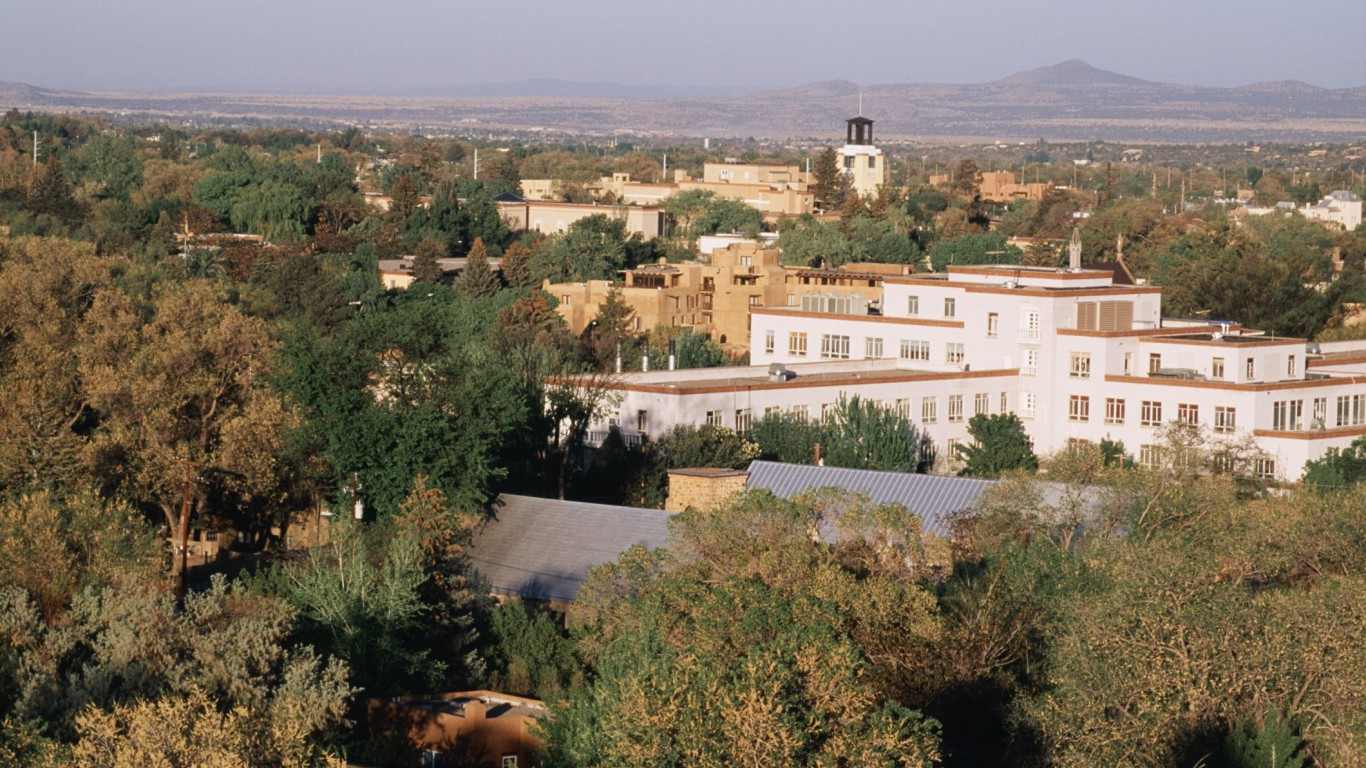
31. Santa Fe, New Mexico
> Cost of living compared to nation: 0.3% less expensive
> State cost of living compared to nation: 5.0% less expensive (24th lowest)
> Poverty rate: 14.2%
> Median household income: $52,809
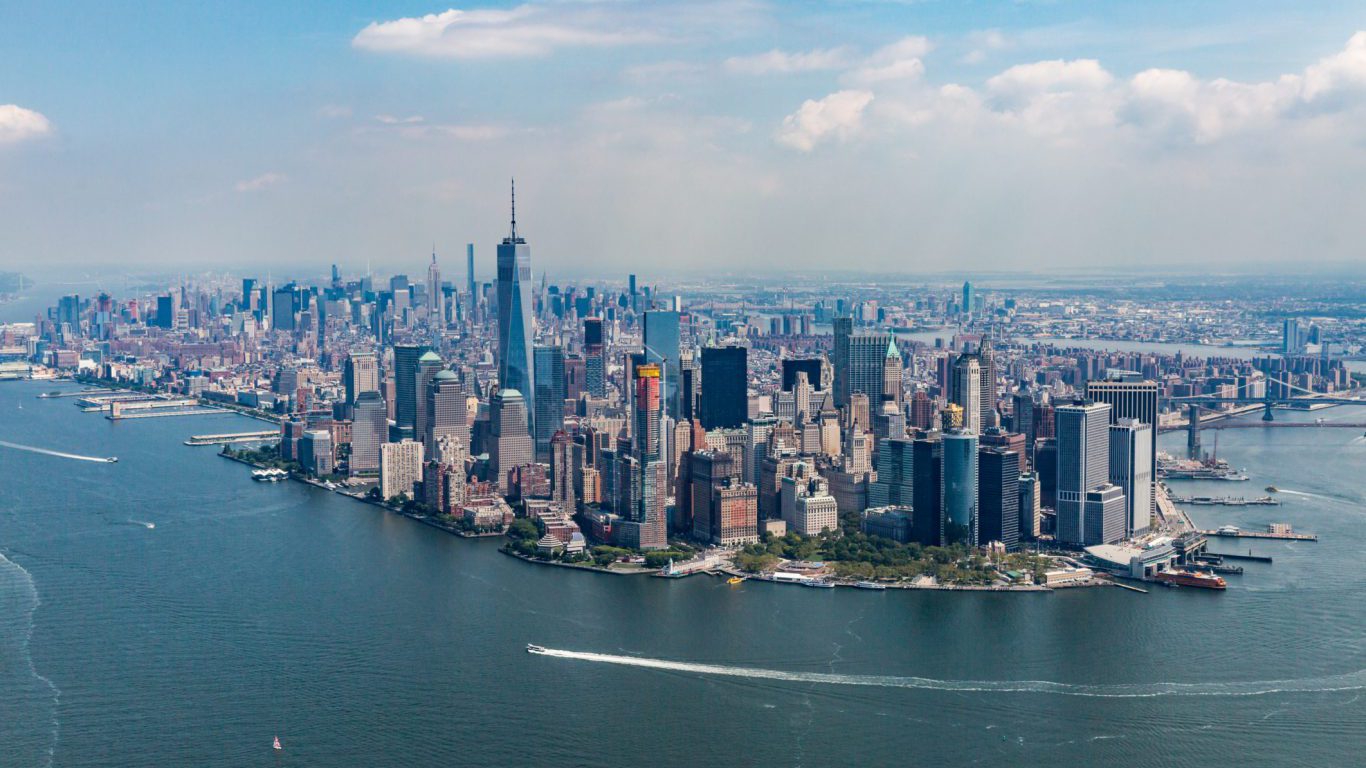
32. New York-Newark-Jersey City, New York
> Cost of living compared to nation: 22.3% more expensive
> State cost of living compared to nation: 15.7% more expensive (2nd highest)
> Poverty rate: 14.6%
> Median household income: $67,066
 24/7 Wall St.
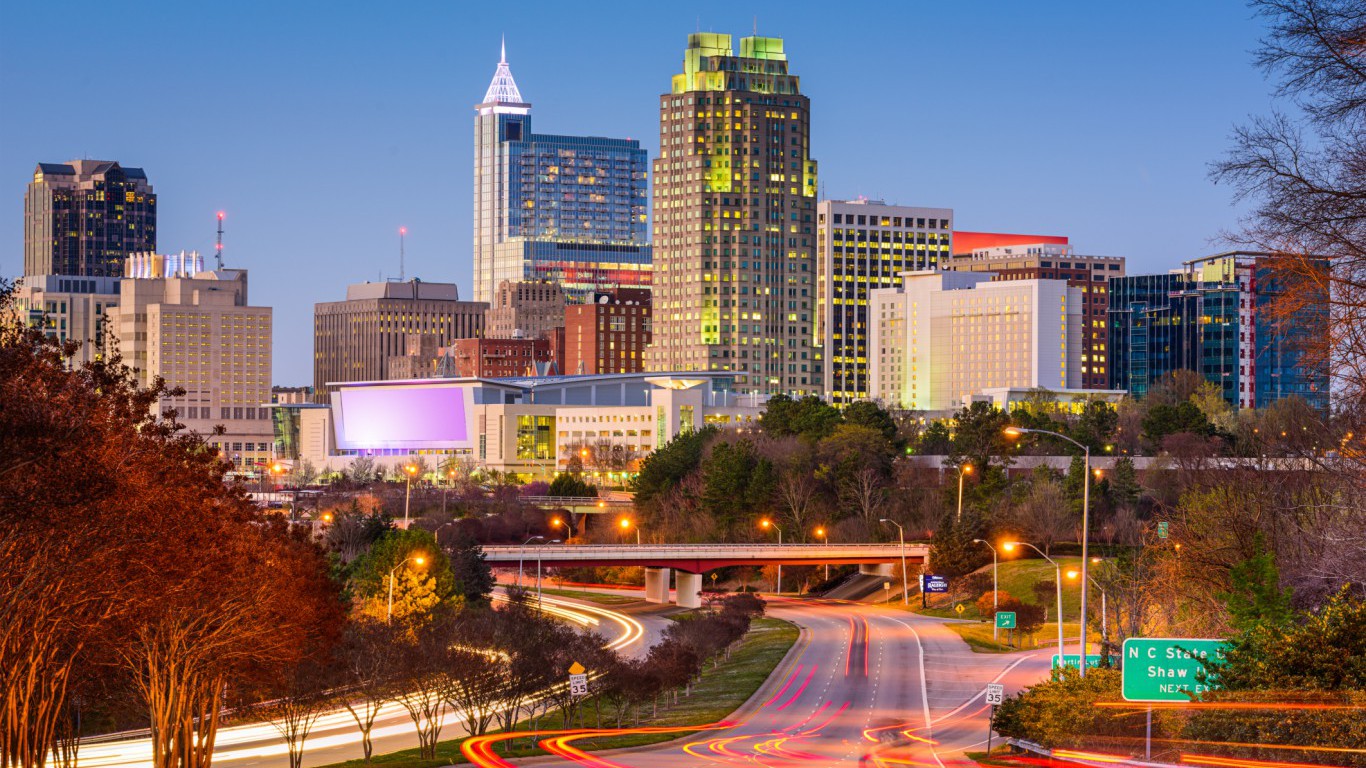
33. Raleigh, North Carolina
> Cost of living compared to nation: 4.1% less expensive
> State cost of living compared to nation: 8.3% less expensive (18th lowest)
> Poverty rate: 12.2%
> Median household income: $62,313
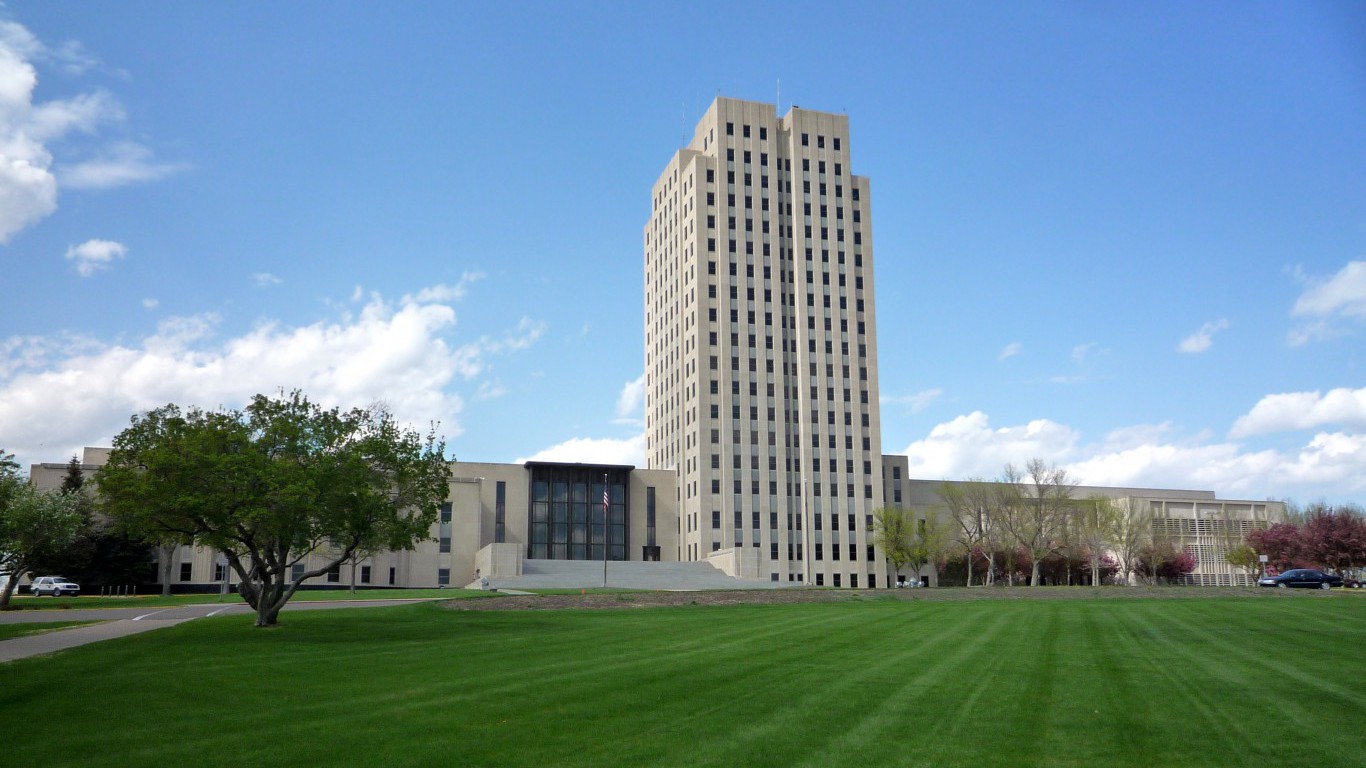
34. Bismarck, North Dakota
> Cost of living compared to nation: 6.0% less expensive
> State cost of living compared to nation: 8.5% less expensive (17th lowest)
> Poverty rate: 9.8%
> Median household income: $63,356
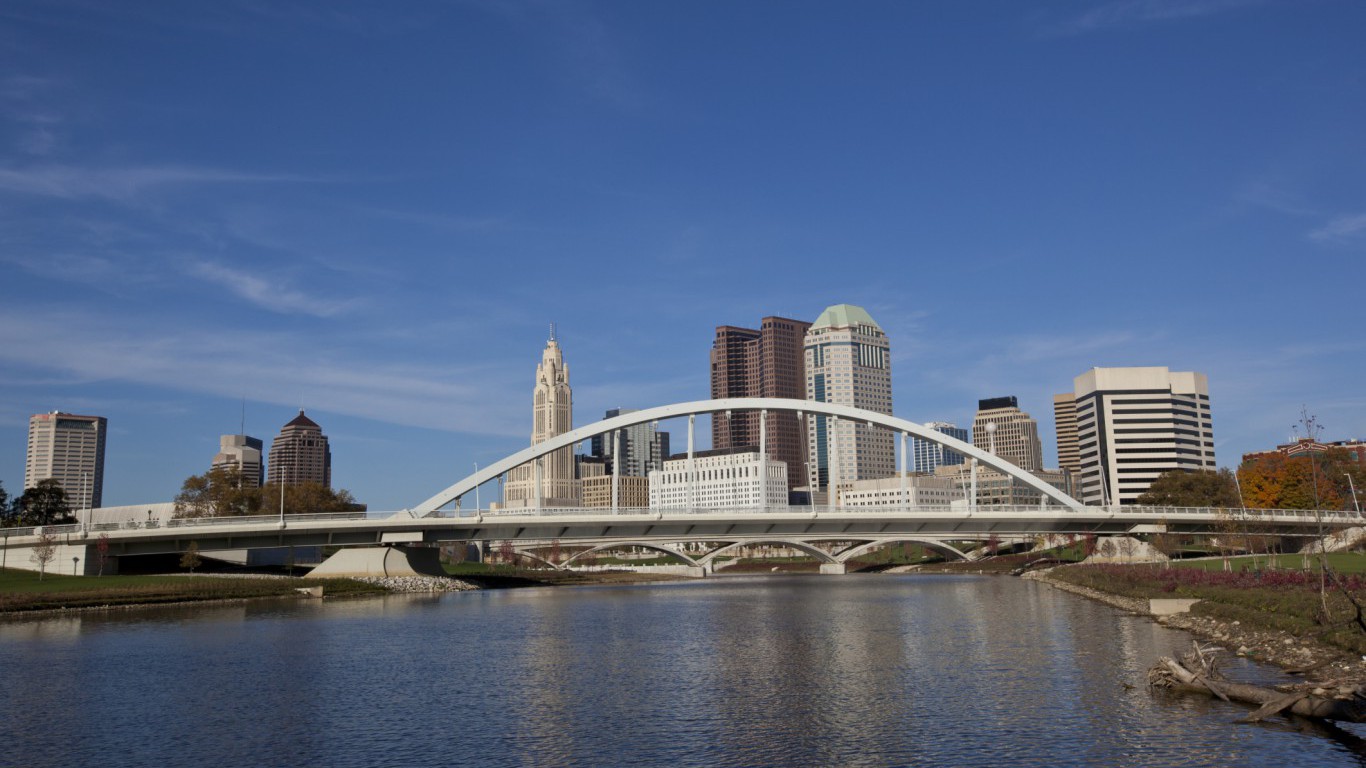
35. Columbus, Ohio
> Cost of living compared to nation: 6.6% less expensive
> State cost of living compared to nation: 10.7% less expensive (7th lowest)
> Poverty rate: 14.5%
> Median household income: $56,371

36. Oklahoma City, Oklahoma
> Cost of living compared to nation: 7.6% less expensive
> State cost of living compared to nation: 9.9% less expensive (9th lowest)
> Poverty rate: 15.3%
> Median household income: $52,416
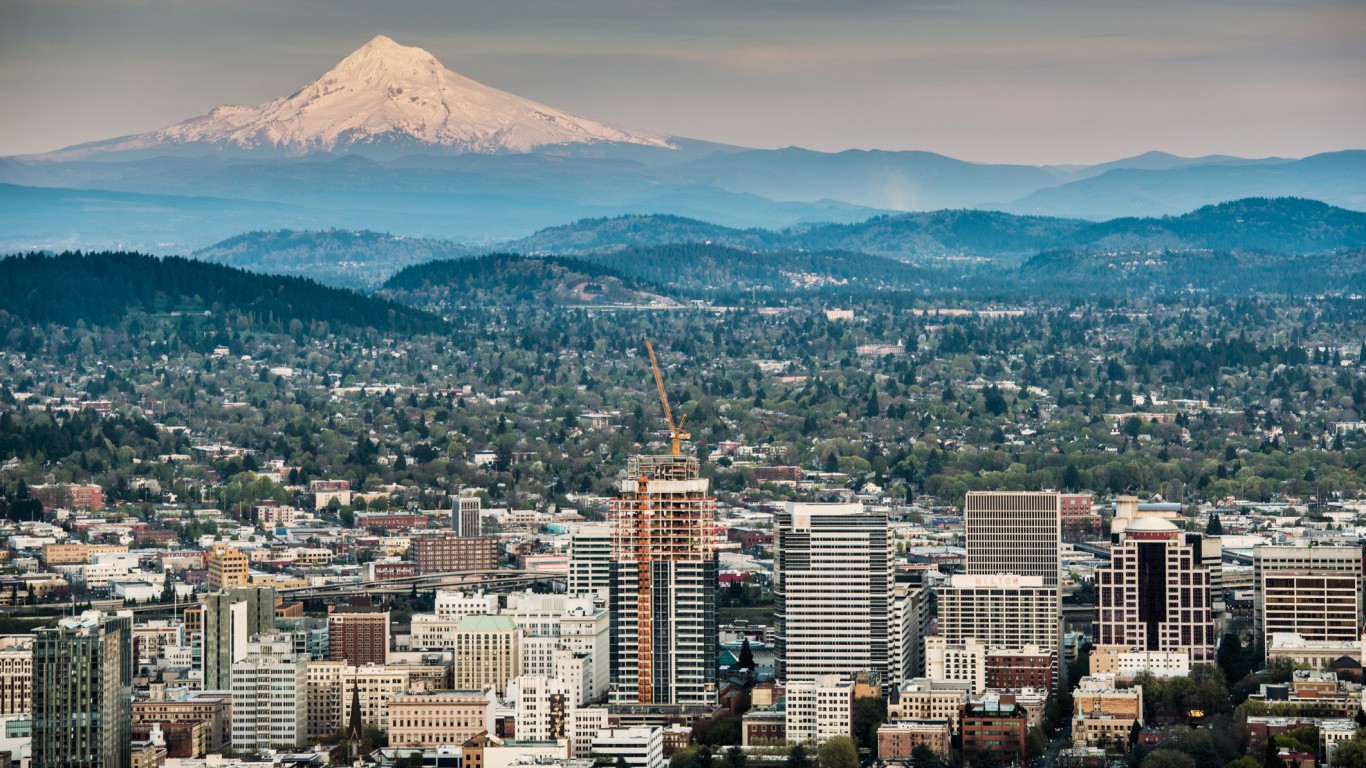
37. Portland-Vancouver-Hillsboro, Oregon
> Cost of living compared to nation: 1.3% more expensive
> State cost of living compared to nation: 1.0% less expensive (17th highest)
> Poverty rate: 13.6%
> Median household income: $60,248

38. Philadelphia-Camden-Wilmington, Pennsylvania
> Cost of living compared to nation: 7.2% more expensive
> State cost of living compared to nation: 1.8% less expensive (19th highest)
> Poverty rate: 13.4%
> Median household income: $62,171

39. Providence-Warwick, Rhode Island
> Cost of living compared to nation: 1.0% less expensive
> State cost of living compared to nation: 1.3% less expensive (18th highest)
> Poverty rate: 13.6%
> Median household income: $55,836

40. Charleston-North Charleston, South Carolina
> Cost of living compared to nation: 3.7% less expensive
> State cost of living compared to nation: 9.5% less expensive (12th lowest)
> Poverty rate: 15.1%
> Median household income: $53,572

41. Sioux Falls, South Dakota
> Cost of living compared to nation: 7.2% less expensive
> State cost of living compared to nation: 12.0% less expensive (4th lowest)
> Poverty rate: 9.7%
> Median household income: $58,849

42. Nashville-Davidson–Murfreesboro–Franklin, Tennessee
> Cost of living compared to nation: 6.1% less expensive
> State cost of living compared to nation: 9.8% less expensive (10th lowest)
> Poverty rate: 15.1%
> Median household income: $52,640
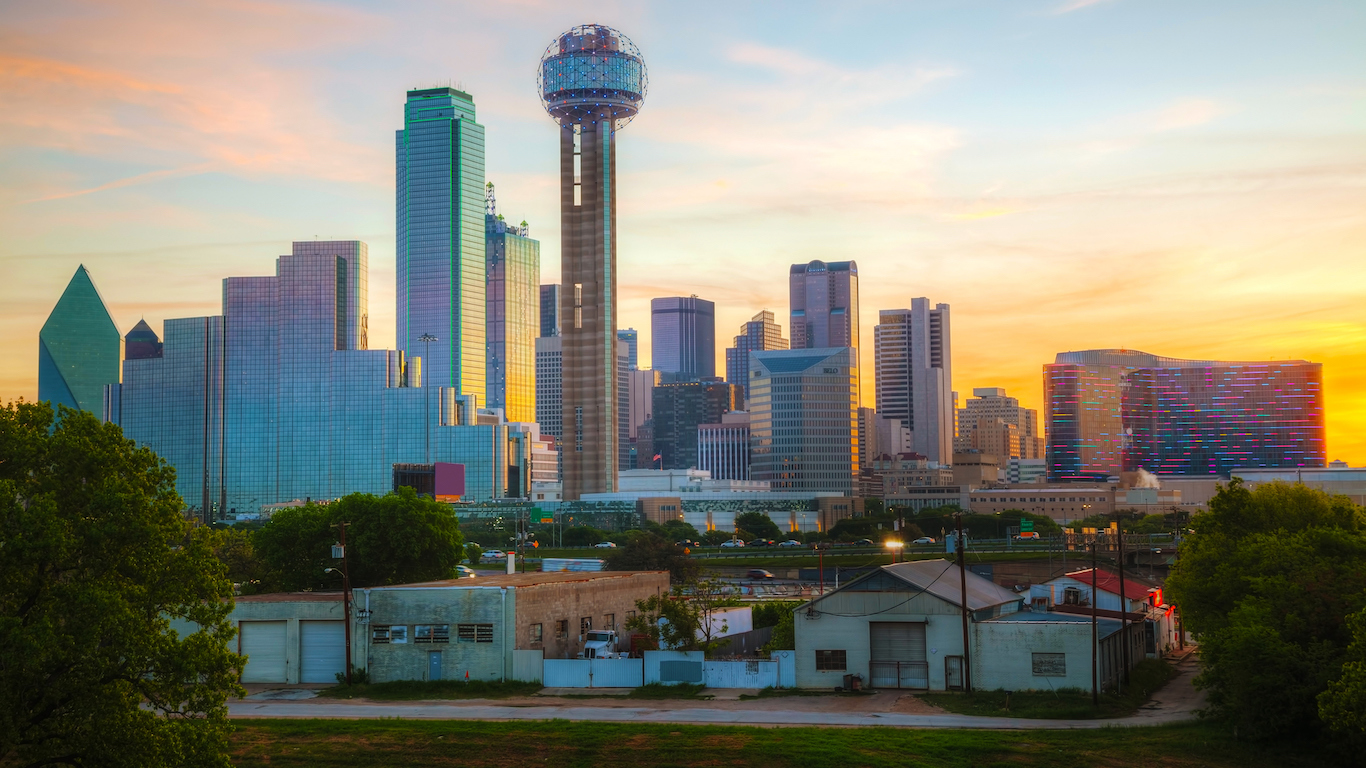
43. Dallas-Fort Worth-Arlington, Texas
> Cost of living compared to nation: 0.4% more expensive
> State cost of living compared to nation: 3.4% less expensive (24th highest)
> Poverty rate: 14.8%
> Median household income: $59,530
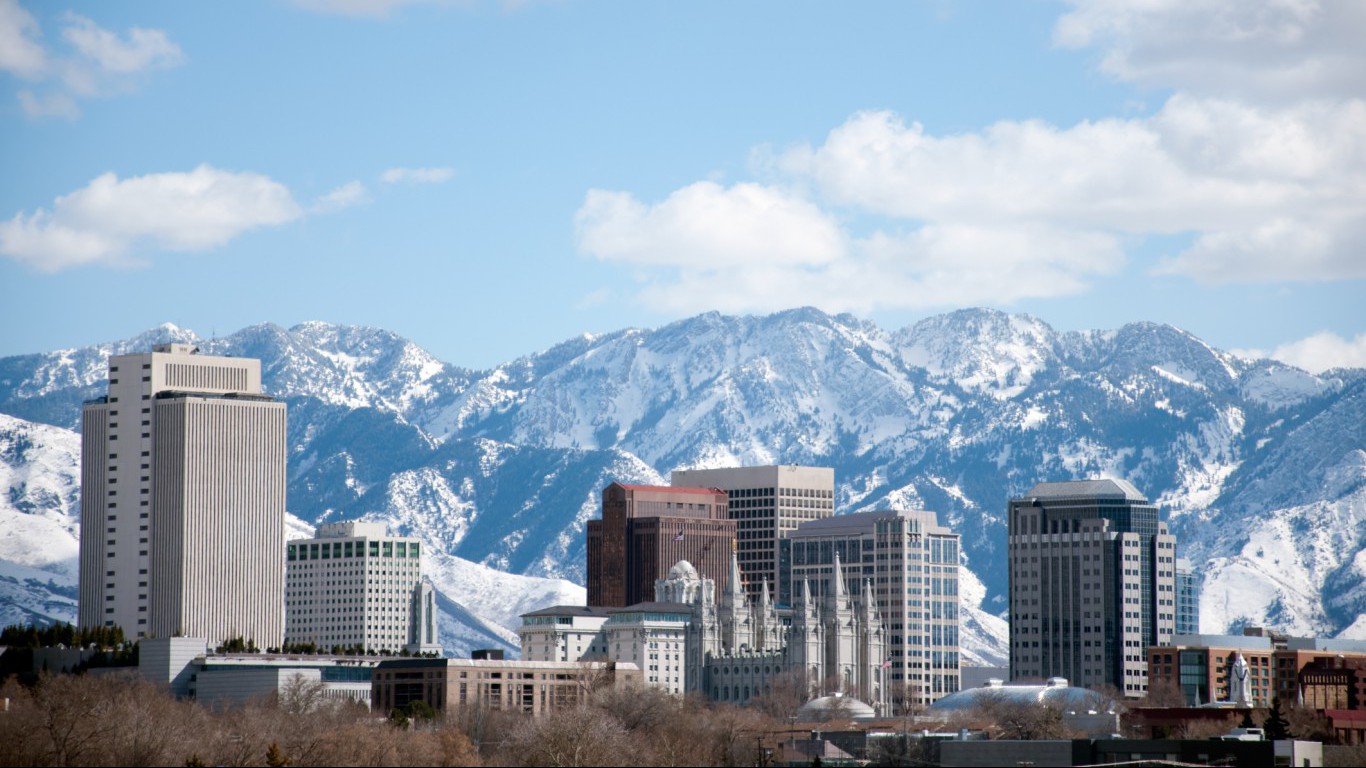
44. Salt Lake City, Utah
> Cost of living compared to nation: 0.3% less expensive
> State cost of living compared to nation: 3.0% less expensive (23rd highest)
> Poverty rate: 11.4%
> Median household income: $62,642
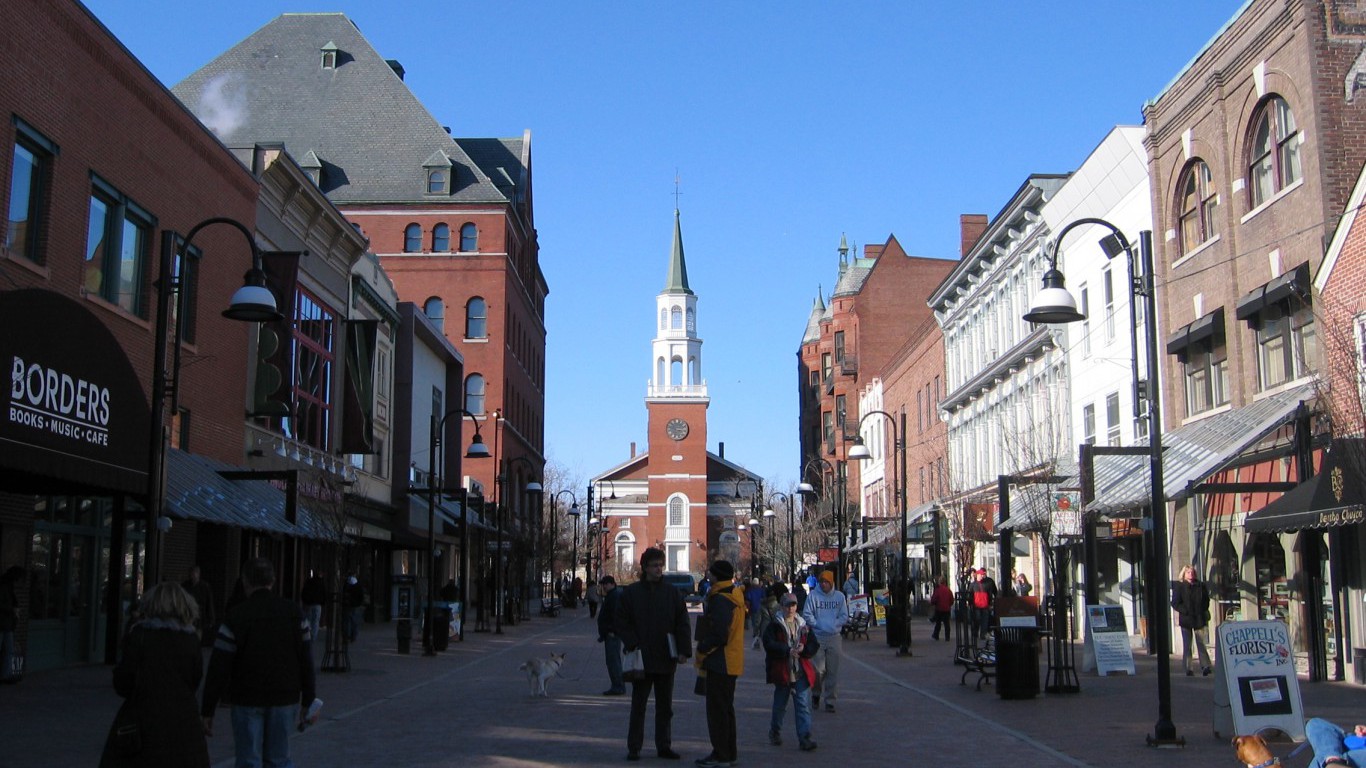
45. Burlington-South Burlington, Vermont
> Cost of living compared to nation: 2.7% more expensive
> State cost of living compared to nation: 1.2% more expensive (14th highest)
> Poverty rate: 10.4%
> Median household income: $61,947
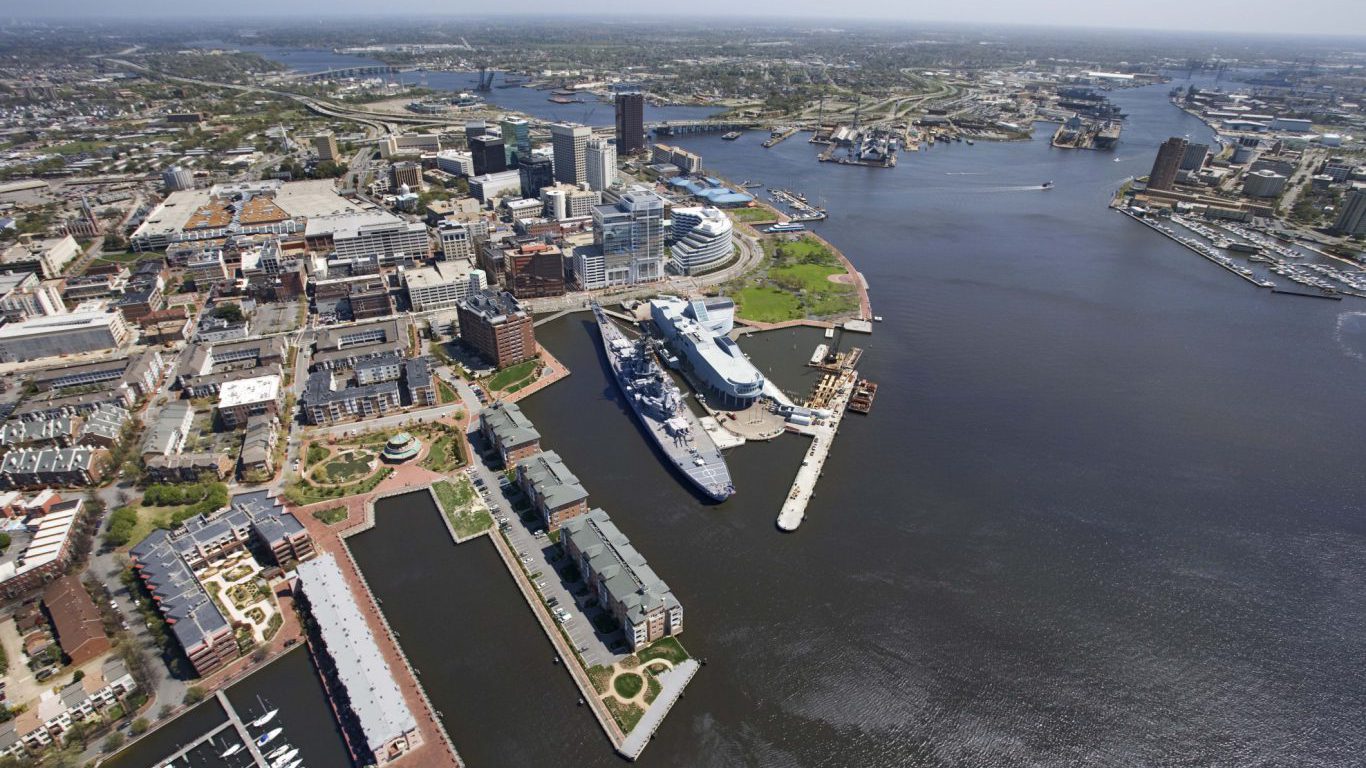
46. Virginia Beach-Norfolk-Newport News, Virginia
> Cost of living compared to nation: 1.6% less expensive
> State cost of living compared to nation: 2.6% more expensive (11th highest)
> Poverty rate: 12.4%
> Median household income: $58,871
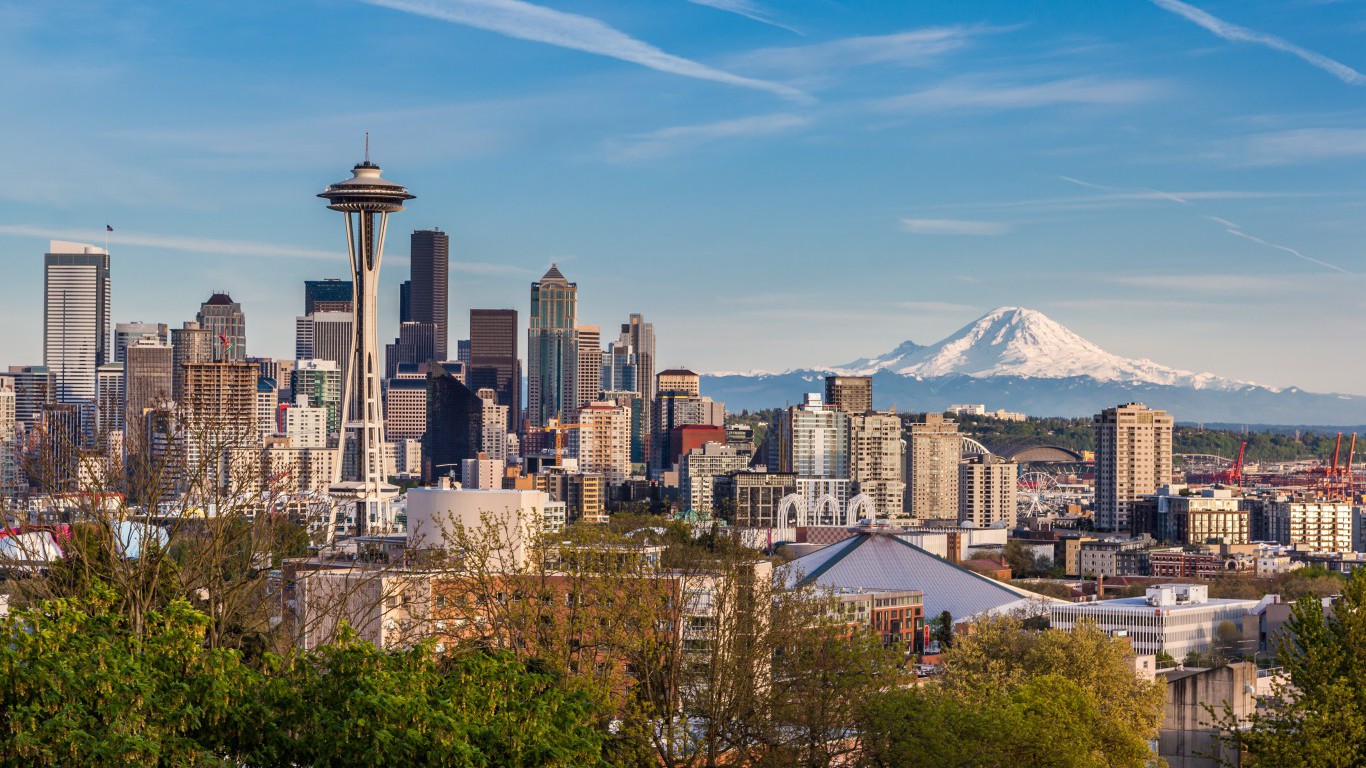
47. Seattle-Tacoma-Bellevue, Washington
> Cost of living compared to nation: 7.8% more expensive
> State cost of living compared to nation: 3.8% more expensive (10th highest)
> Poverty rate: 11.3%
> Median household income: $71,273
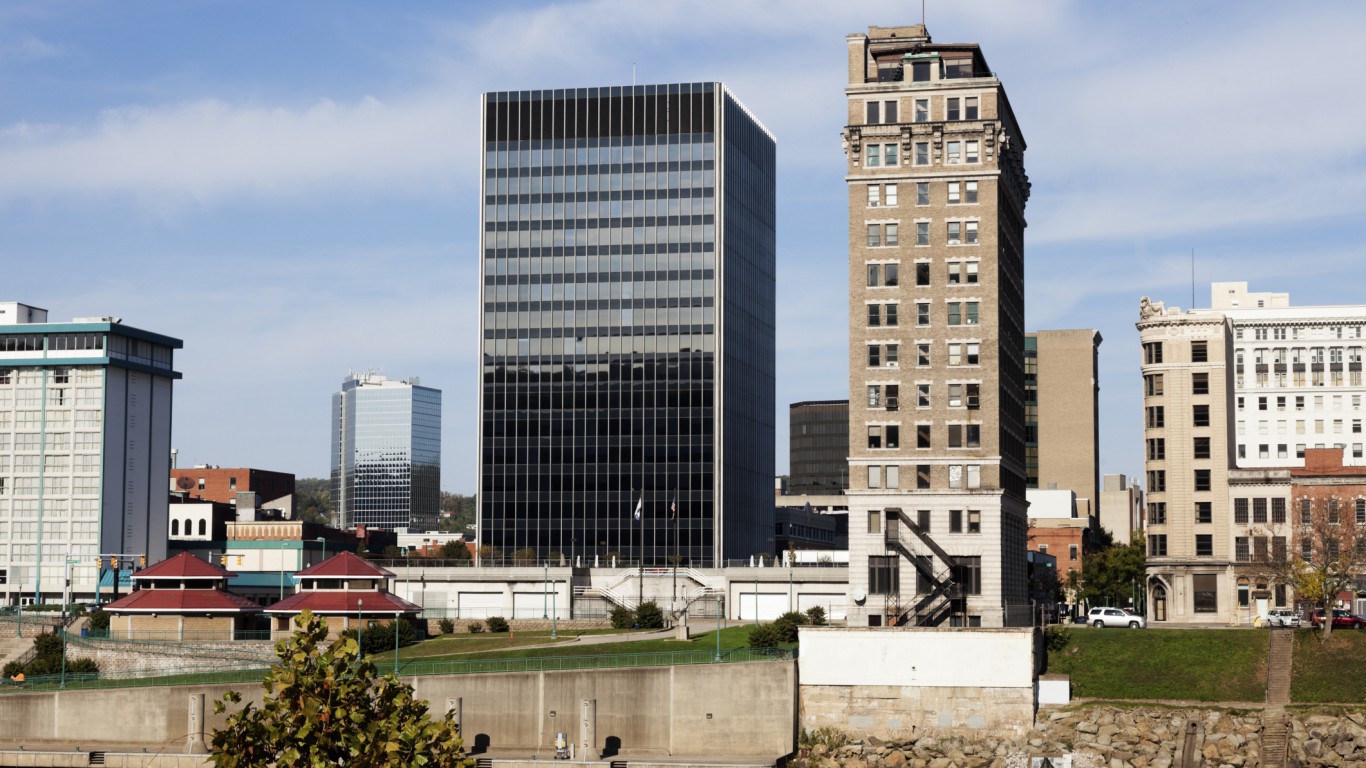
48. Charleston, West Virginia
> Cost of living compared to nation: 11.0% less expensive
> State cost of living compared to nation: 11.1% less expensive (6th lowest)
> Poverty rate: 17.9%
> Median household income: $42,761
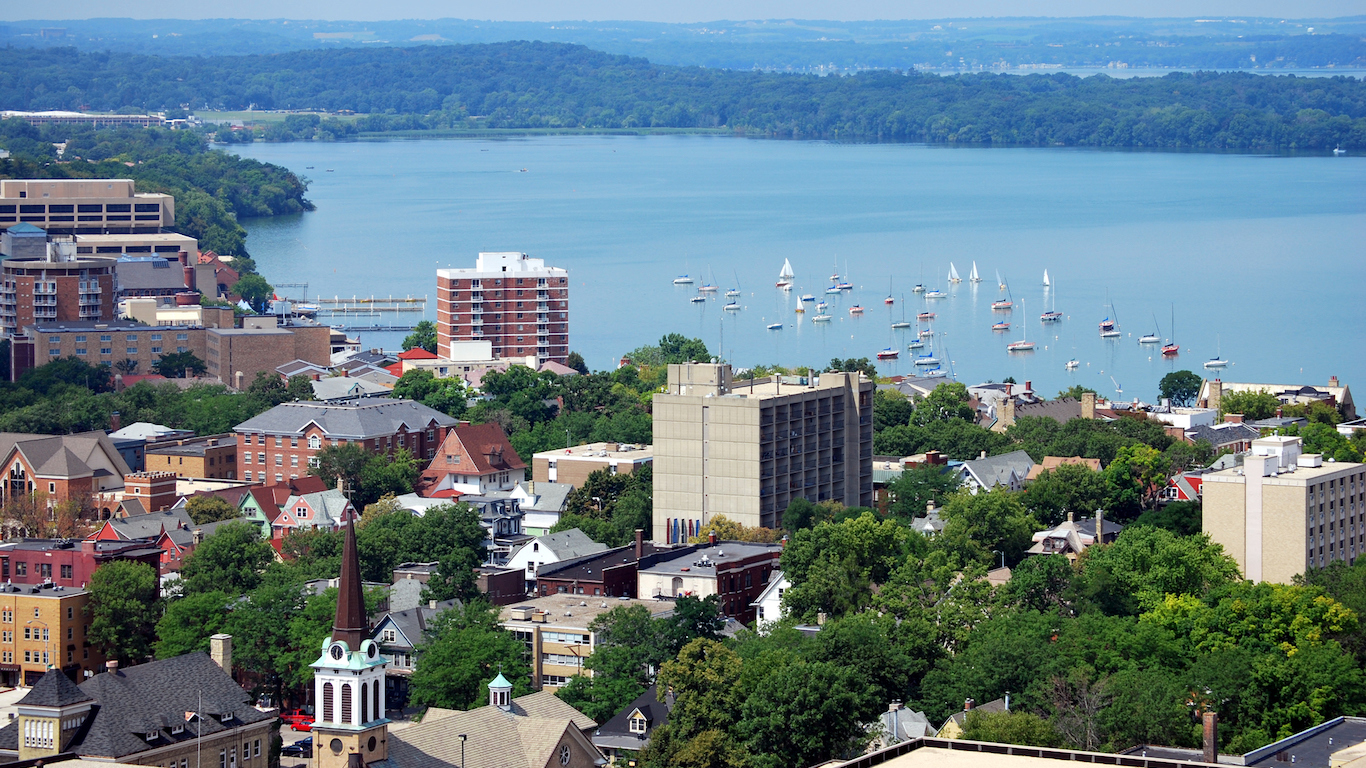
49. Madison, Wisconsin
> Cost of living compared to nation: 2.2% less expensive
> State cost of living compared to nation: 6.6% less expensive (21st lowest)
> Poverty rate: 12.7%
> Median household income: $60,903
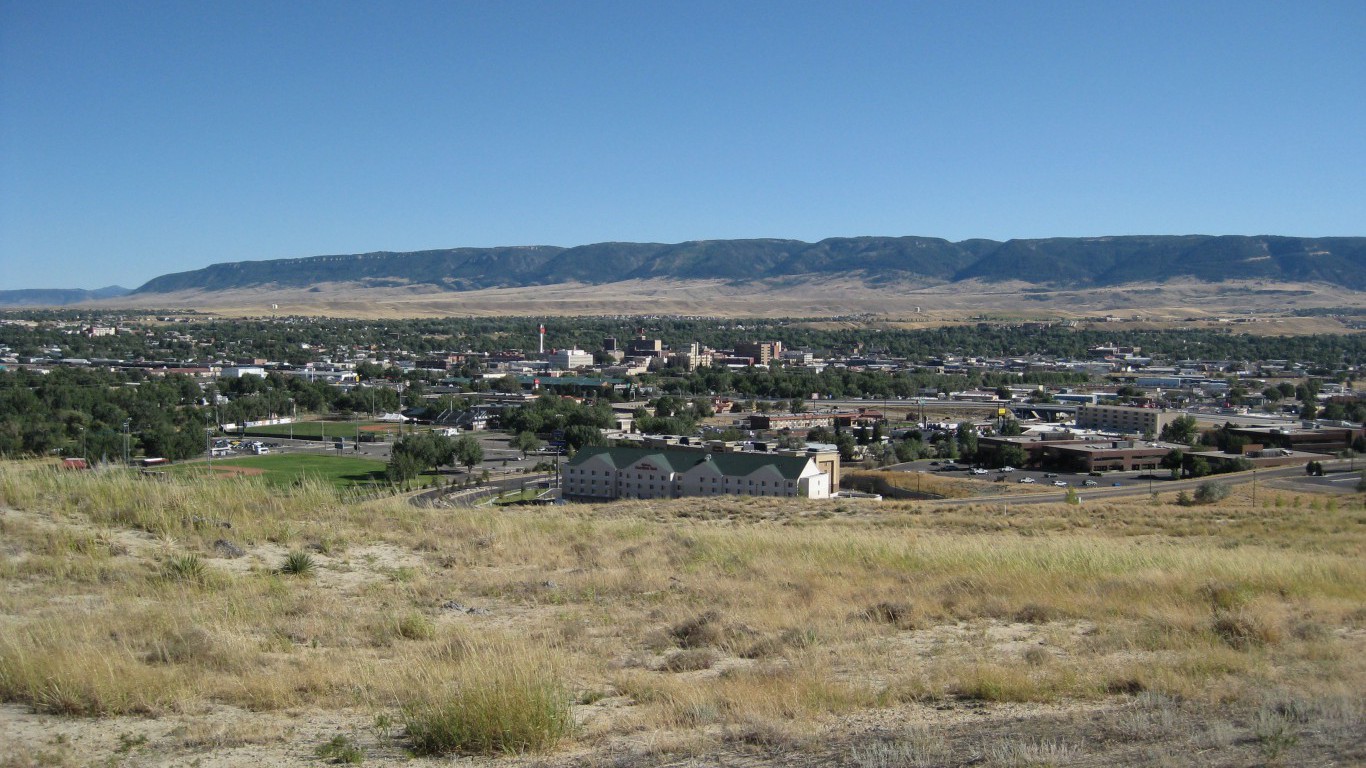
50. Casper, Wyoming
> Cost of living compared to nation: 2.1% less expensive
> State cost of living compared to nation: 3.8% less expensive (25th lowest)
> Poverty rate: 9.3%
> Median household income: $56,392
“The Next NVIDIA” Could Change Your Life
If you missed out on NVIDIA’s historic run, your chance to see life-changing profits from AI isn’t over.
The 24/7 Wall Street Analyst who first called NVIDIA’s AI-fueled rise in 2009 just published a brand-new research report named “The Next NVIDIA.”
Click here to download your FREE copy.
Thank you for reading! Have some feedback for us?
Contact the 24/7 Wall St. editorial team.
Latest from 24/7