Special Report
Cities With the Best (and Worst) Health Insurance Coverage
Published:
Last Updated:

Around one third of U.S. residents are covered by public programs, namely Medicaid and Medicare. Including private coverage, 88.3% of Americans have health insurance. Despite covering fewer residents, health care spending in the United State is far higher than in any other high income nation.
To determine the metropolitan areas with the best and worst health insurance coverage rates, 24/7 Wall St. reviewed the percentage of people under 65 in U.S. metro areas without health insurance in 2014 from the Census Bureau.
Click here to see the cities with the best health insurance coverage.
Click here to see the cities with the worst health insurance coverage.
In Brownsville-Harlingen, Texas, 35.4% of residents under 65 do not have health insurance, the highest rate in the nation. This is more than 10 times the rate in Worcester, Maine where only 3.4% of residents of this age group are not insured, the lowest uninsured rate of any U.S. city.
Under the Affordable Care Act, which went into effect on January 1, 2014, states could opt to expand Medicaid coverage to persons under 65 earning incomes of up to 138% of the federal poverty level. Prior to this law taking effect, a U.S. Supreme Court ruling in 2012 allowed states to opt out of this Medicaid expansion, and 19 states chose to do so. States that adopted the Medicaid expansion tended to have higher health insurance coverage rates than states that did not adopt the expansion.
Mostly, this holds true for cities within these states. Of the 25 cities with the highest uninsured rates, 24 are located in states that opted out of the Medicaid expansion. By contrast, 22 of the 25 cities with the lowest uninsured rates are located in states that adopted the Medicaid expansion.
Because the Medicaid expansion is aimed at providing health insurance to poor residents, opting out of the Medicaid expansion has had a larger effect on cities with greater levels of poverty. In eight of the 10 metro areas with the highest rates of uninsured people, poverty rates are higher than the national rate. In addition, the three cities with the highest shares of uninsured residents also have the nation’s three highest poverty rates.
In metro areas with lower health insurance coverage rates, residents tend to report feeling generally worse about their health than those with higher coverage rates. When asked about their health, 14% of adults nationwide rate their health as fair or poor. In 23 of the 25 cities with the lowest coverage rates, a higher share of adults report fair or poor health, and in three of these cities more than 30% of adults report such poor health. By contrast, only two of the 25 cities with the best coverage rates report worse health than the nation as a whole.
To identify the cities with the highest uninsured rates, 24/7 Wall St. reviewed the percentage of individuals younger than 65 without health insurance by metropolitan statistical area from the U.S. Census Bureau’s 2014 American Community Survey. Poverty rates in these areas are also from the American Community Survey. Percentages of adults reporting fair or poor health are from the 2015 County Health Rankings. Data for whether a state has accepted federal funds and adopted the Medicaid expansion under the Affordable Care Act are from the Henry J. Kaiser Family Foundation.
These are the cities with the highest (and lowest) uninsured rates.
Cities With the Best Health Insurance Coverage
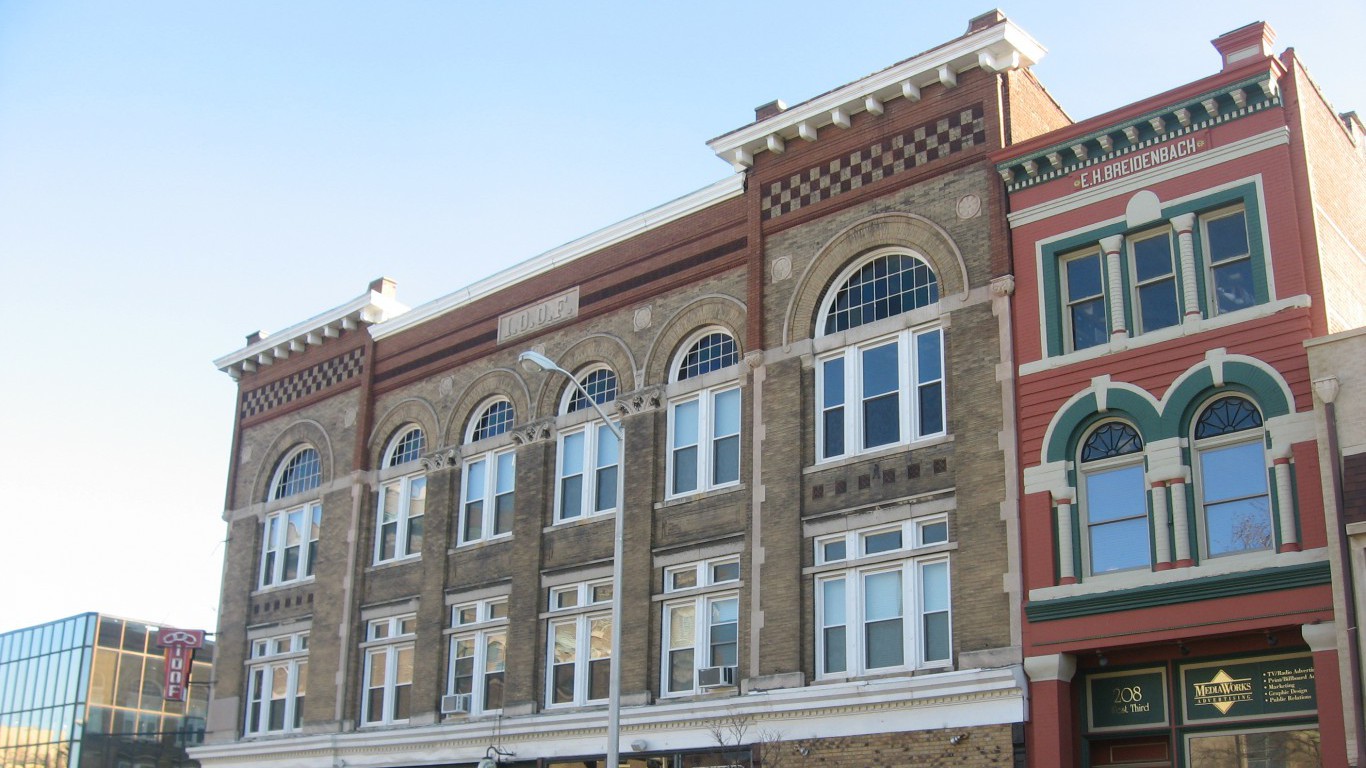
25. Owensboro, KY
> Pct. of adults under 65 without health insurance: 6.3%
> Poverty rate: 14.9%
> Pct. of adults in fair or poor health: 18.9%
> Medicaid expansion under ACA: Yes

24. Des Moines-West Des Moines, IA
> Pct. of adults under 65 without health insurance: 6.3%
> Poverty rate: 12.0%
> Pct. of adults in fair or poor health: 11.7%
> Medicaid expansion under ACA: Yes
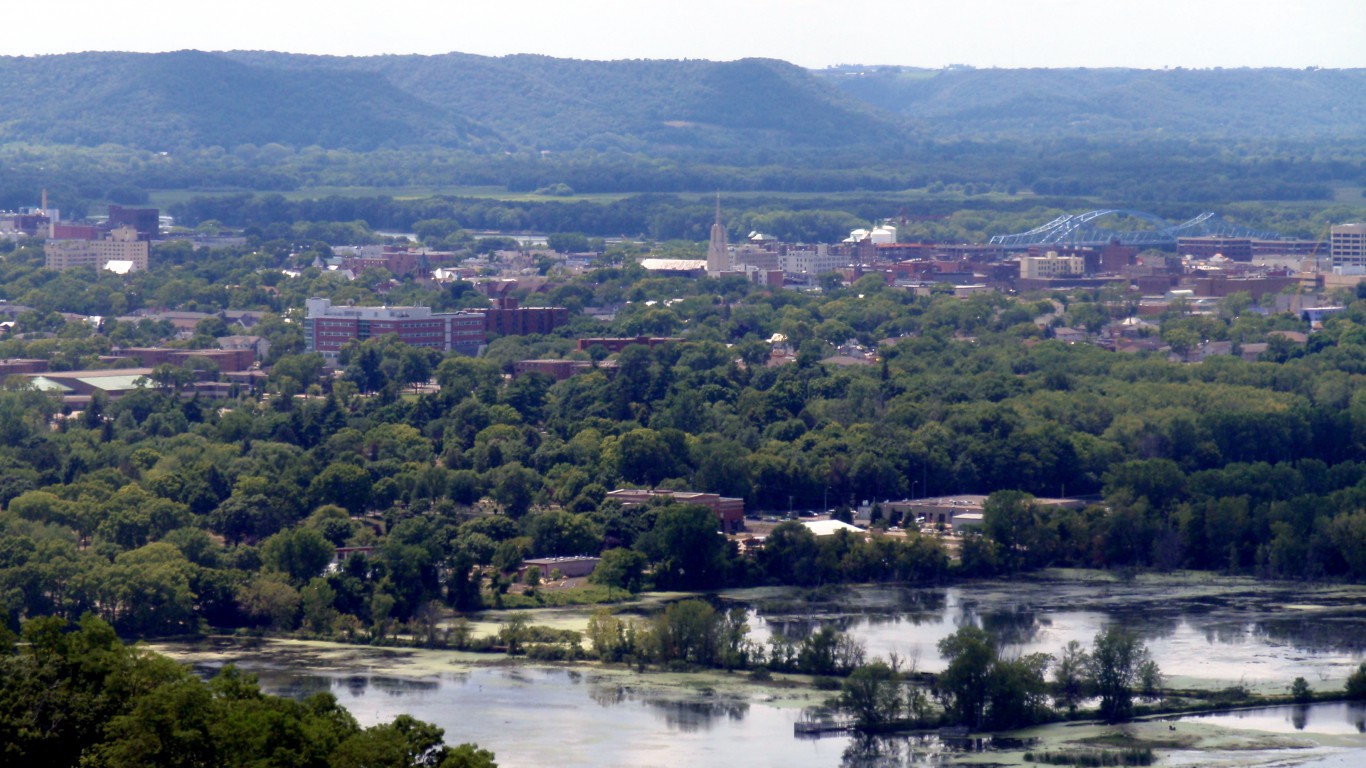
23. La Crosse-Onalaska, WI-MN
> Pct. of adults under 65 without health insurance: 6.3%
> Poverty rate: 11.8%
> Pct. of adults in fair or poor health: 11.9%
> Medicaid expansion under ACA: No

22. California-Lexington Park, MD
> Pct. of adults under 65 without health insurance: 6.3%
> Poverty rate: 7.5%
> Pct. of adults in fair or poor health: 12.5%
> Medicaid expansion under ACA: Yes
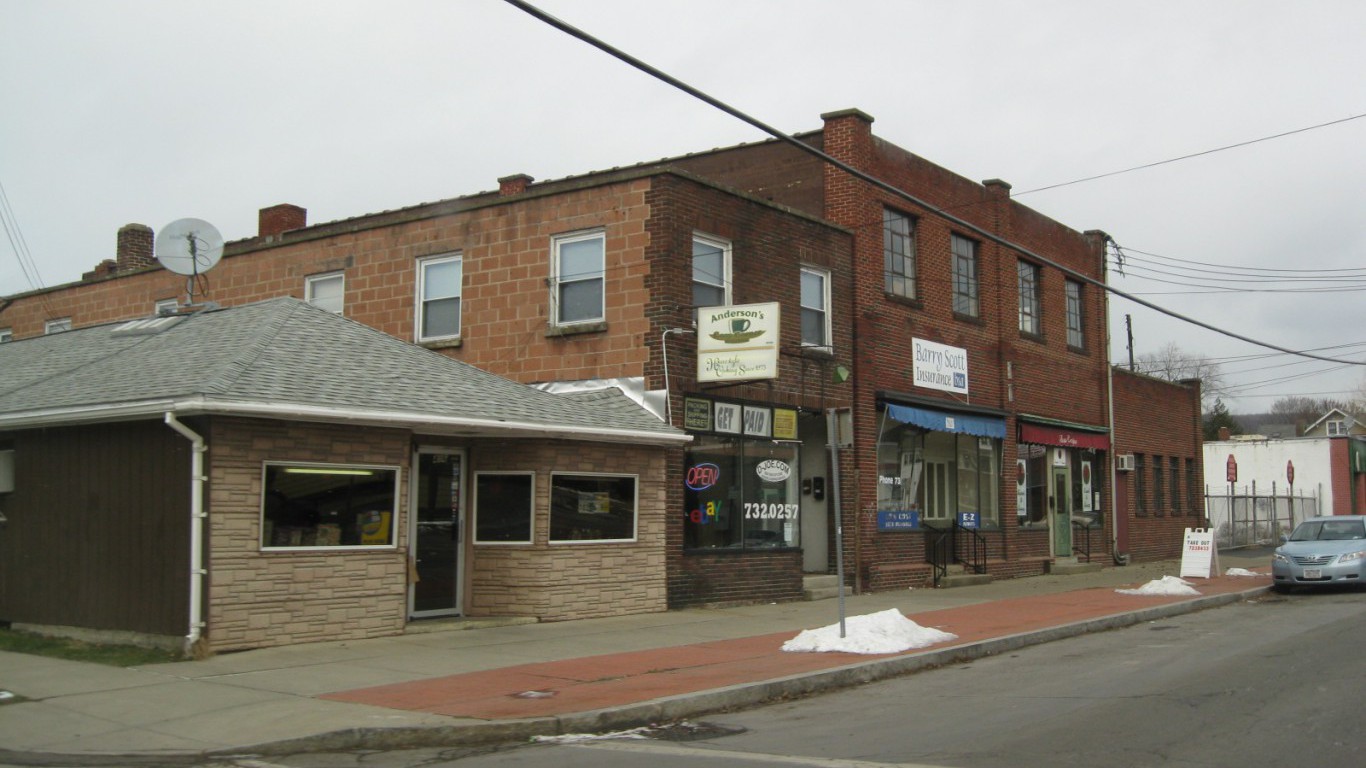
21. Elmira, NY
> Pct. of adults under 65 without health insurance: 6.3%
> Poverty rate: 18.7%
> Pct. of adults in fair or poor health: 12.7%
> Medicaid expansion under ACA: Yes
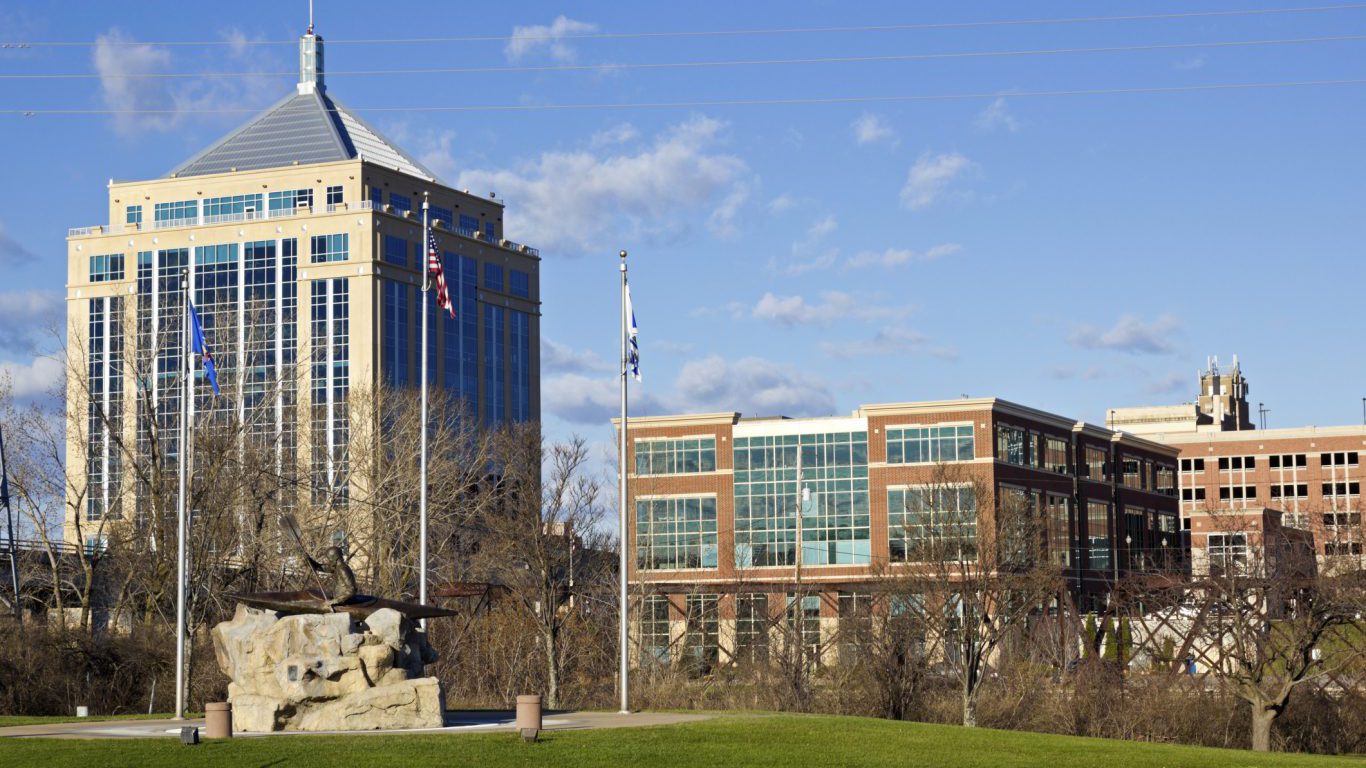
20. Wausau, WI
> Pct. of adults under 65 without health insurance: 6.3%
> Poverty rate: 9.4%
> Pct. of adults in fair or poor health: 11.8%
> Medicaid expansion under ACA: No
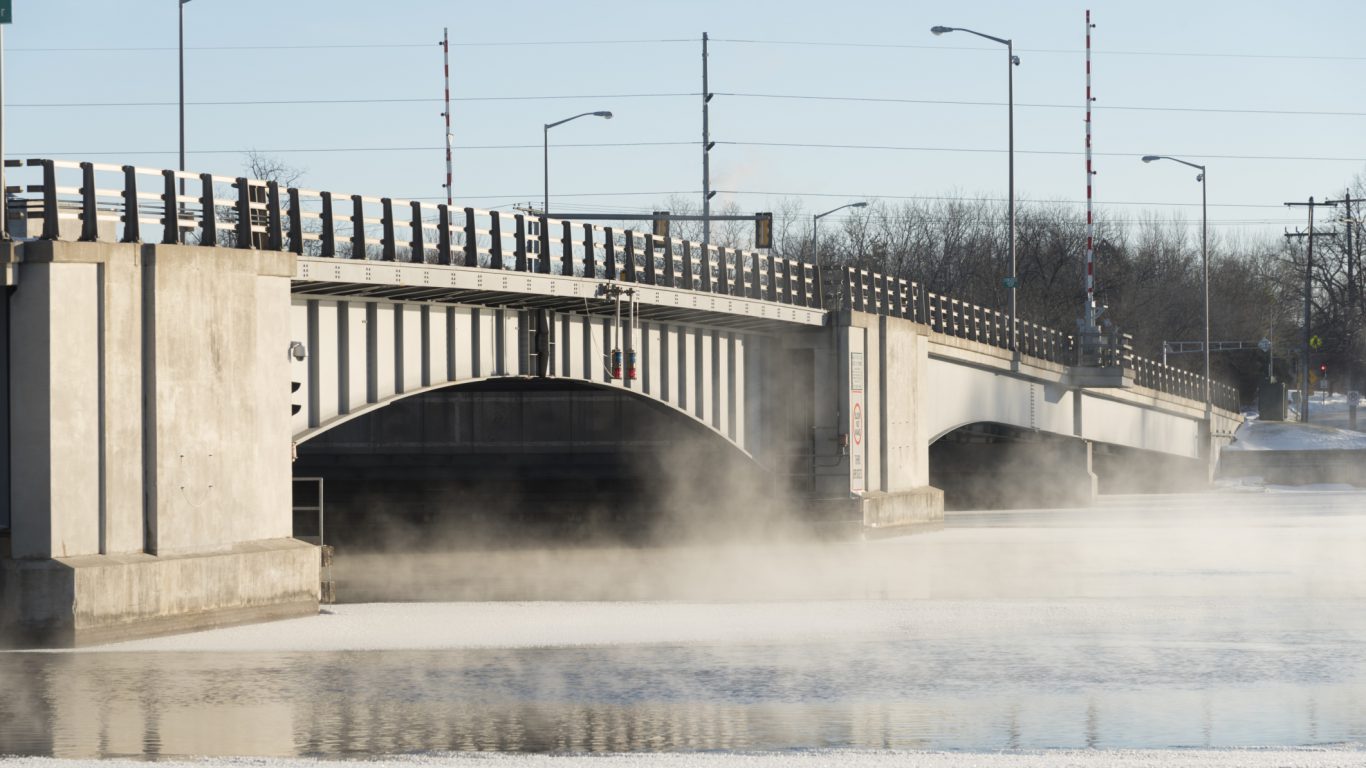
19. Oshkosh-Neenah, WI
> Pct. of adults under 65 without health insurance: 6.3%
> Poverty rate: 12.4%
> Pct. of adults in fair or poor health: 12.3%
> Medicaid expansion under ACA: No

18. Iowa City, IA
> Pct. of adults under 65 without health insurance: 6.2%
> Poverty rate: 16.0%
> Pct. of adults in fair or poor health: 11.8%
> Medicaid expansion under ACA: Yes

17. Rochester, MN
> Pct. of adults under 65 without health insurance: 6.2%
> Poverty rate: 9.5%
> Pct. of adults in fair or poor health: 9.2%
> Medicaid expansion under ACA: Yes

16. Dubuque, IA
> Pct. of adults under 65 without health insurance: 6.2%
> Poverty rate: 12.2%
> Pct. of adults in fair or poor health: 10.7%
> Medicaid expansion under ACA: Yes

15. Hartford-West Hartford-East Hartford, CT
> Pct. of adults under 65 without health insurance: 6.1%
> Poverty rate: 11.1%
> Pct. of adults in fair or poor health: 11.9%
> Medicaid expansion under ACA: Yes

14. Buffalo-Cheektowaga-Niagara Falls, NY
> Pct. of adults under 65 without health insurance: 6.1%
> Poverty rate: 14.8%
> Pct. of adults in fair or poor health: 13.5%
> Medicaid expansion under ACA: Yes
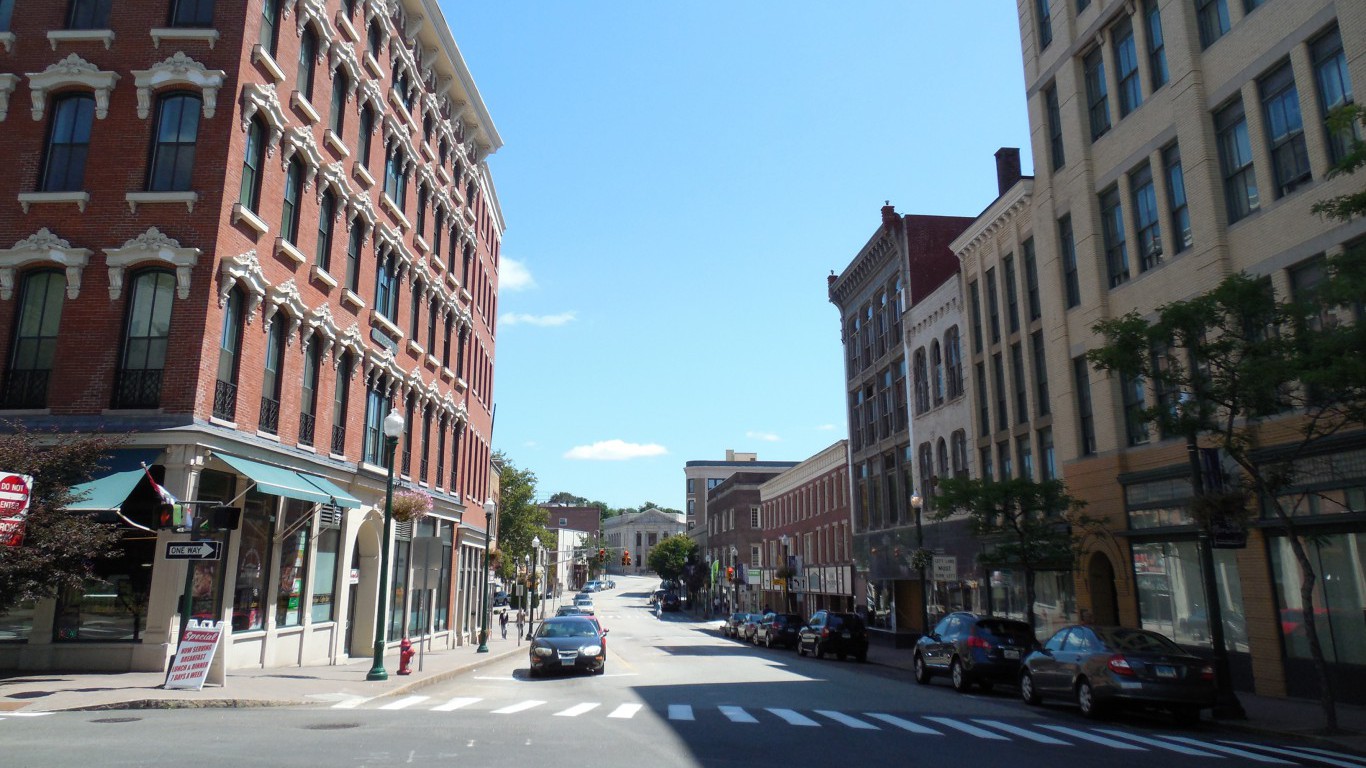
13. Norwich-New London, CT
> Pct. of adults under 65 without health insurance: 5.9%
> Poverty rate: 11.3%
> Pct. of adults in fair or poor health: 10.9%
> Medicaid expansion under ACA: Yes
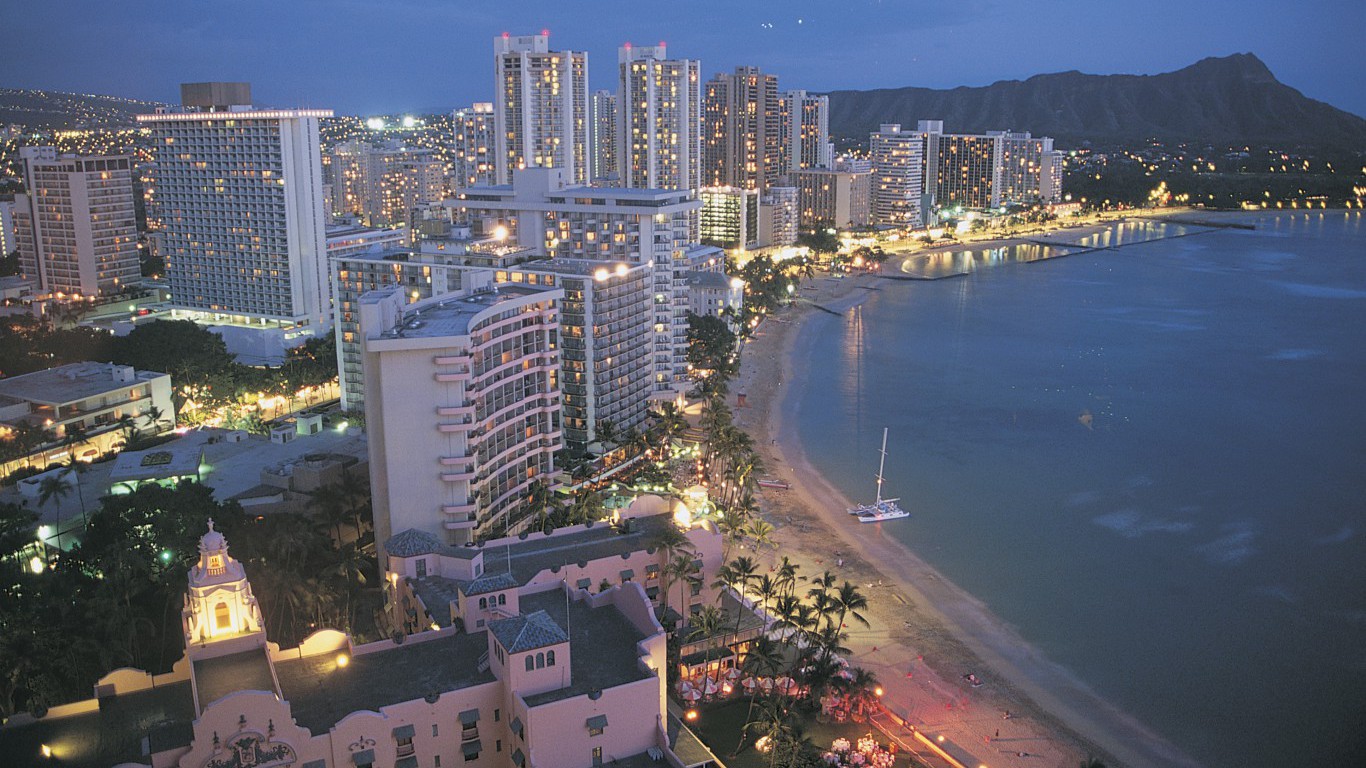
12. Urban Honolulu, HI
> Pct. of adults under 65 without health insurance: 5.5%
> Poverty rate: 9.7%
> Pct. of adults in fair or poor health: 12.6%
> Medicaid expansion under ACA: Yes

11. Binghamton, NY
> Pct. of adults under 65 without health insurance: 5.5%
> Poverty rate: 15.6%
> Pct. of adults in fair or poor health: 13.1%
> Medicaid expansion under ACA: Yes
10. Bloomington, IL
> Pct. of adults under 65 without health insurance: 5.4%
> Poverty rate: 14.4%
> Pct. of adults in fair or poor health: 12.9%
> Medicaid expansion under ACA: Yes

9. Ithaca, NY
> Pct. of adults under 65 without health insurance: 5.2%
> Poverty rate: 19.8%
> Pct. of adults in fair or poor health: 12.9%
> Medicaid expansion under ACA: Yes

8. Cedar Rapids, IA
> Pct. of adults under 65 without health insurance: 5.0%
> Poverty rate: 9.2%
> Pct. of adults in fair or poor health: 10.9%
> Medicaid expansion under ACA: Yes
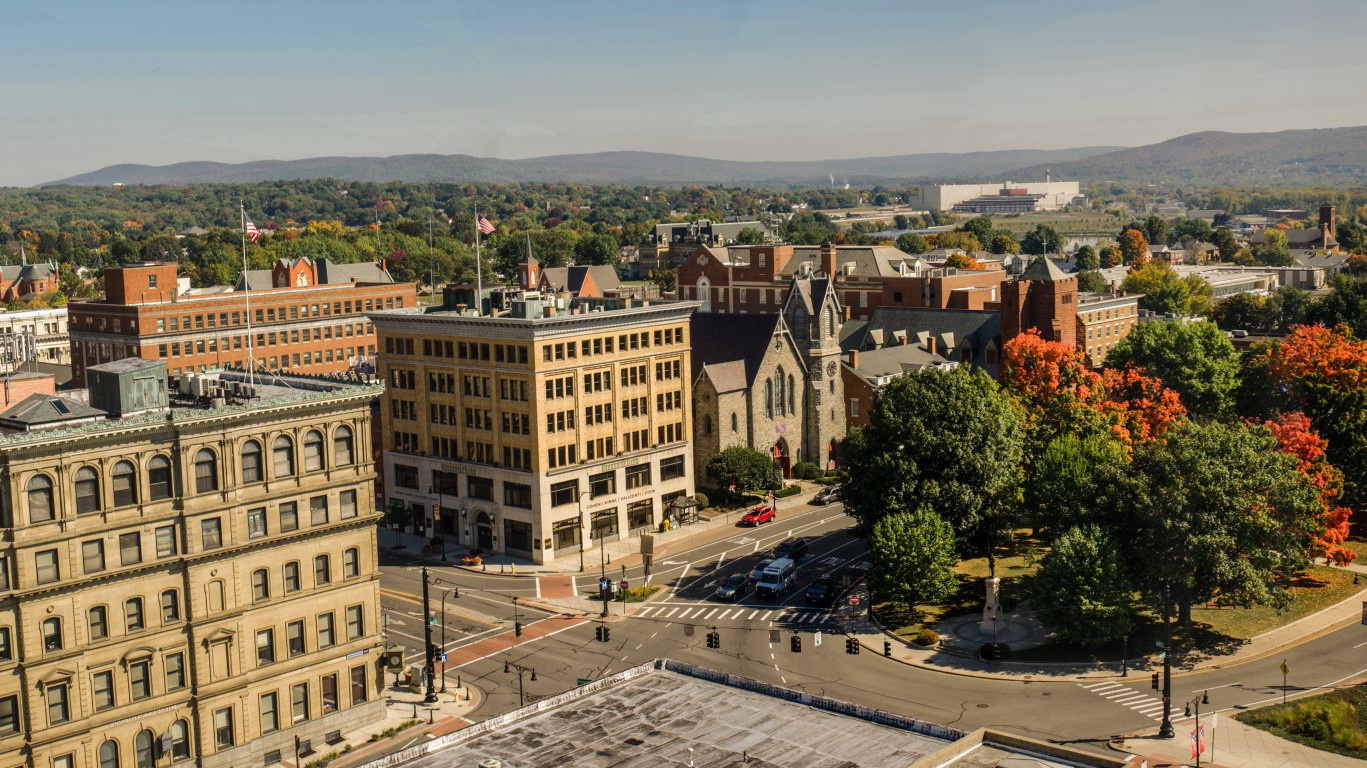
7. Pittsfield, MA
> Pct. of adults under 65 without health insurance: 4.9%
> Poverty rate: 12.4%
> Pct. of adults in fair or poor health: 12.7%
> Medicaid expansion under ACA: Yes

6. Burlington-South Burlington, VT
> Pct. of adults under 65 without health insurance: 4.6%
> Poverty rate: 10.4%
> Pct. of adults in fair or poor health: 8.9%
> Medicaid expansion under ACA: Yes
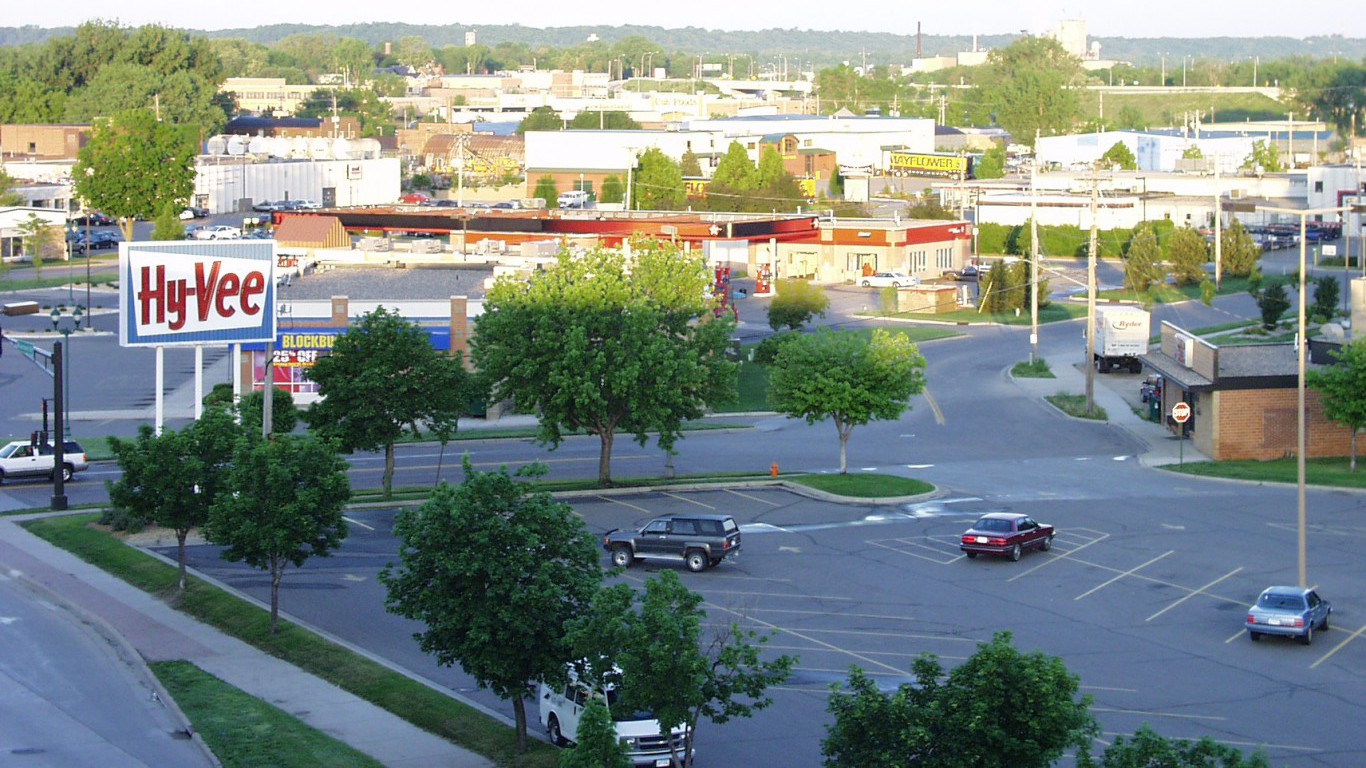
5. Mankato-North Mankato, MN
> Pct. of adults under 65 without health insurance: 4.5%
> Poverty rate: 16.3%
> Pct. of adults in fair or poor health: 11.5%
> Medicaid expansion under ACA: Yes

4. Barnstable Town, MA
> Pct. of adults under 65 without health insurance: 4.3%
> Poverty rate: 7.7%
> Pct. of adults in fair or poor health: 9.2%
> Medicaid expansion under ACA: Yes

3. Boston-Cambridge-Newton, MA-NH
> Pct. of adults under 65 without health insurance: 4.3%
> Poverty rate: 10.6%
> Pct. of adults in fair or poor health: 13.0%
> Medicaid expansion under ACA: Yes

2. Springfield, MA
> Pct. of adults under 65 without health insurance: 4.0%
> Poverty rate: 17.4%
> Pct. of adults in fair or poor health: 16.9%
> Medicaid expansion under ACA: Yes
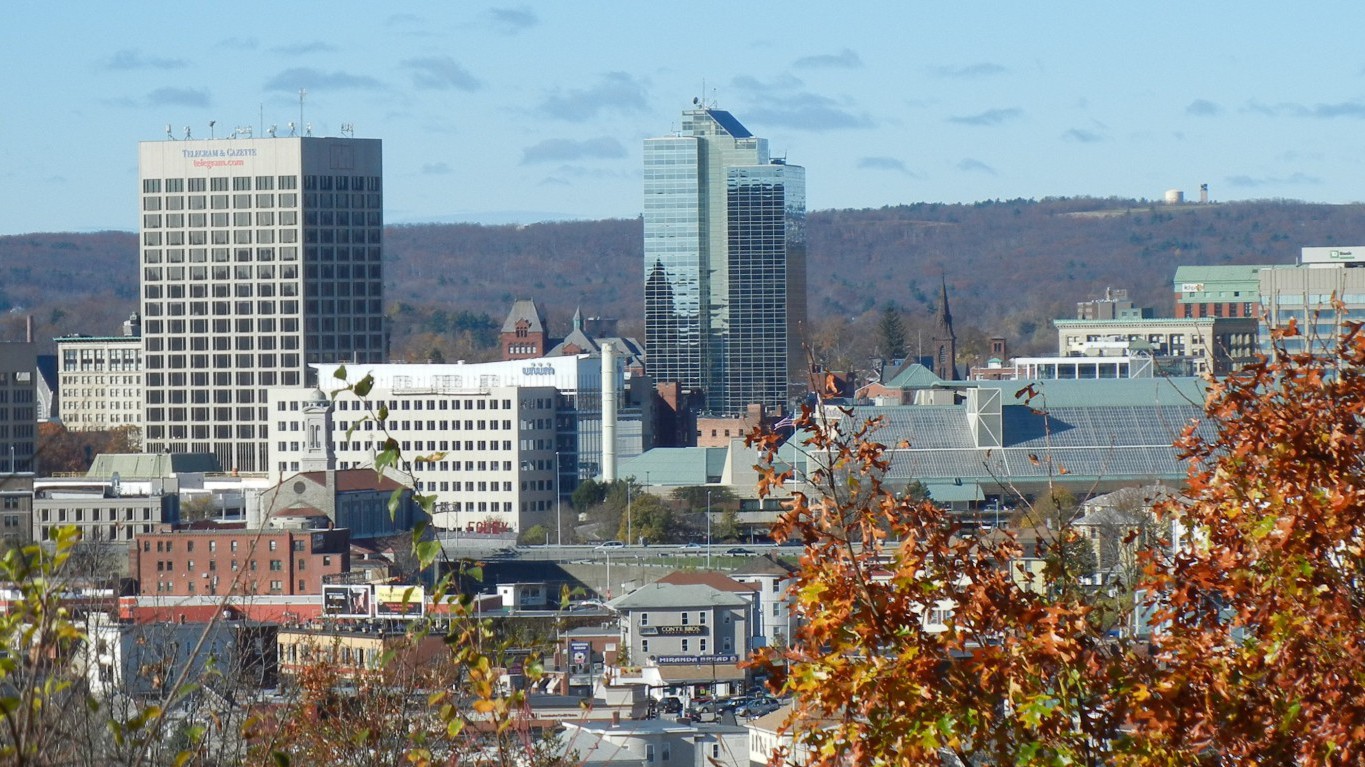
1. Worcester, MA-CT
> Pct. of adults under 65 without health insurance: 3.4%
> Poverty rate: 11.2%
> Pct. of adults in fair or poor health: 12.2%
> Medicaid expansion under ACA: Yes
Cities With the Worst Health Insurance Coverage
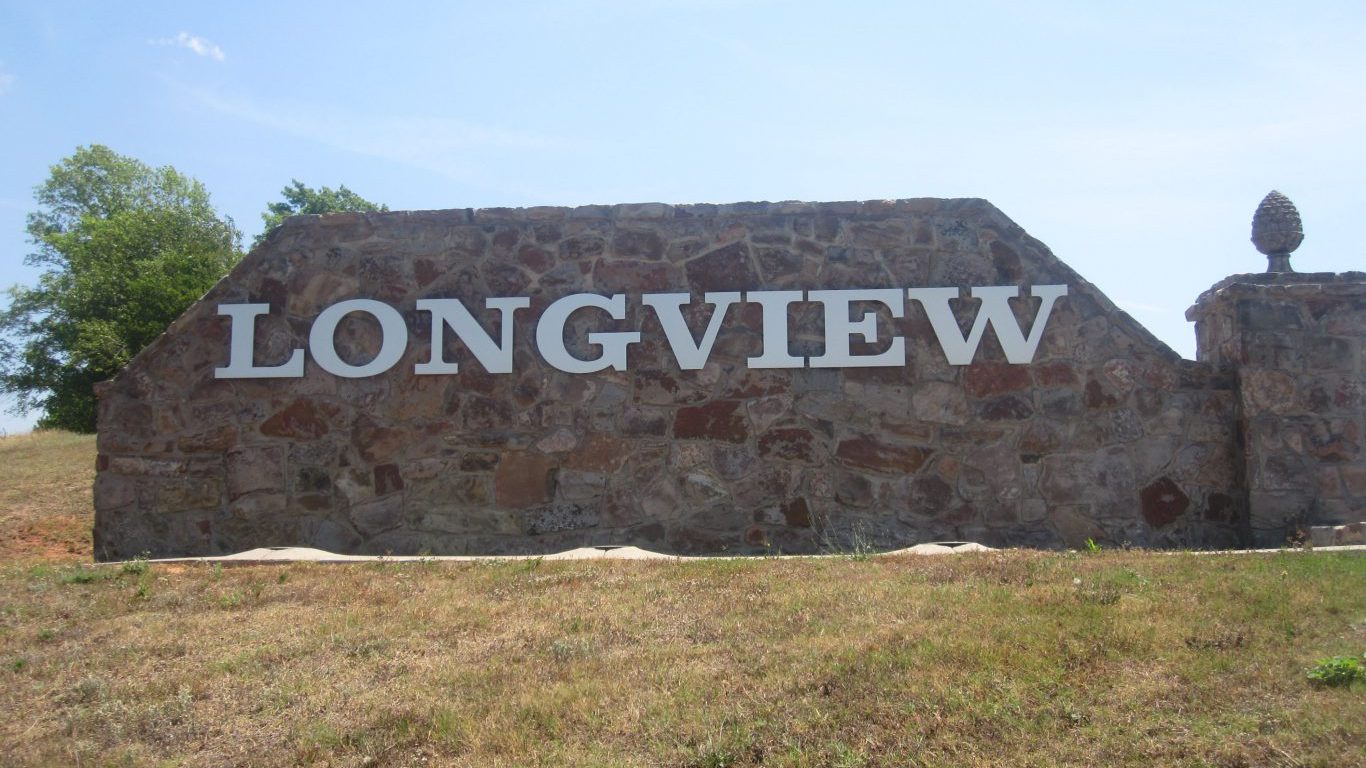
25. Longview, TX
> Pct. of adults under 65 without health insurance: 21.1%
> Poverty rate: 16.2%
> Pct. of adults in fair or poor health: 17.2%
> Medicaid expansion under ACA: No
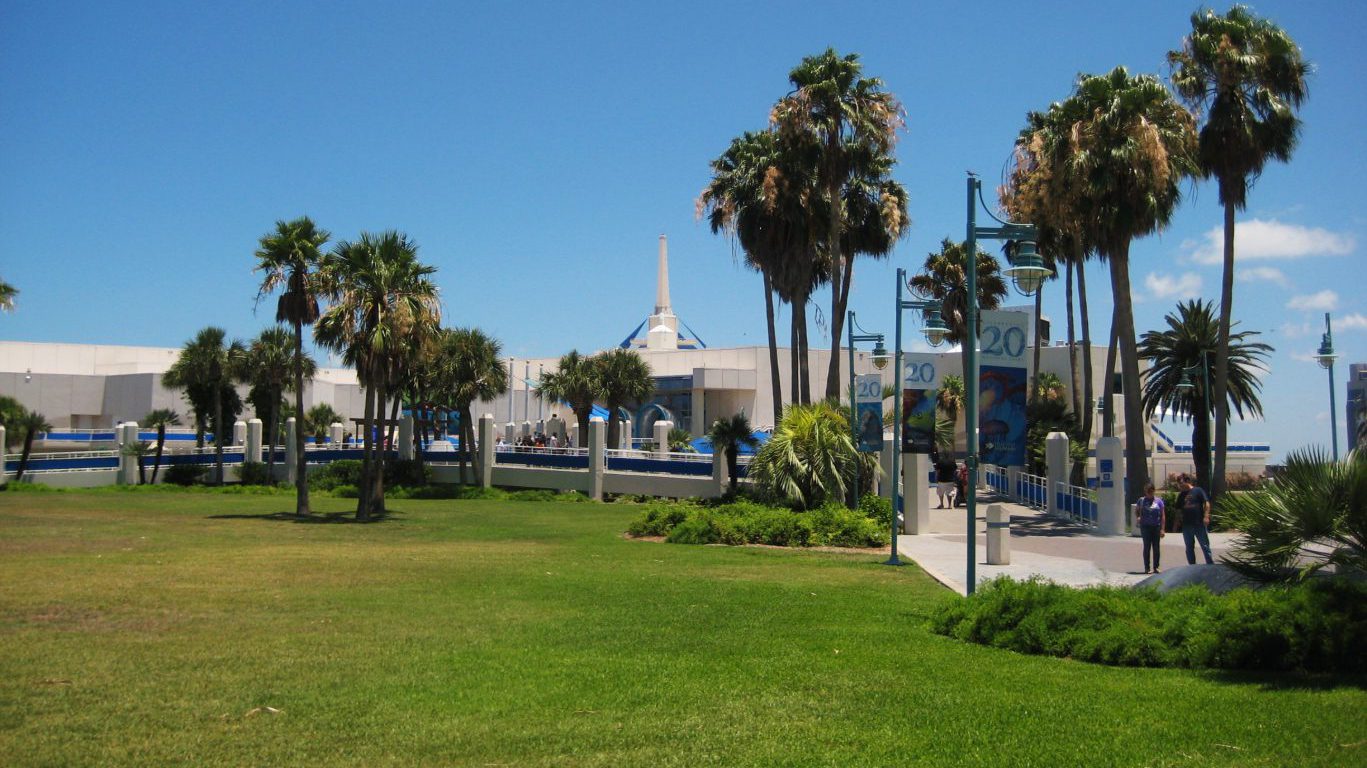

23. Myrtle Beach-Conway-North Myrtle Beach, SC-NC
> Pct. of adults under 65 without health insurance: 21.2%
> Poverty rate: 17.4%
> Pct. of adults in fair or poor health: 17.7%
> Medicaid expansion under ACA: No

22. Houston-The Woodlands-Sugar Land, TX
> Pct. of adults under 65 without health insurance: 21.4%
> Poverty rate: 15.3%
> Pct. of adults in fair or poor health: 18.1%
> Medicaid expansion under ACA: No

21. Midland, TX
> Pct. of adults under 65 without health insurance: 21.6%
> Poverty rate: 7.8%
> Pct. of adults in fair or poor health: 16.1%
> Medicaid expansion under ACA: No

20. Valdosta, GA
> Pct. of adults under 65 without health insurance: 21.6%
> Poverty rate: 26.0%
> Pct. of adults in fair or poor health: 20.0%
> Medicaid expansion under ACA: No

19. Deltona-Daytona Beach-Ormond Beach, FL
> Pct. of adults under 65 without health insurance: 21.6%
> Poverty rate: 16.4%
> Pct. of adults in fair or poor health: 15.6%
> Medicaid expansion under ACA: No

18. St. George, UT
> Pct. of adults under 65 without health insurance: 22.5%
> Poverty rate: 12.0%
> Pct. of adults in fair or poor health: 12.5%
> Medicaid expansion under ACA: No

17. Punta Gorda, FL
> Pct. of adults under 65 without health insurance: 22.6%
> Poverty rate: 10.7%
> Pct. of adults in fair or poor health: 13.2%
> Medicaid expansion under ACA: No

16. Miami-Fort Lauderdale-West Palm Beach, FL
> Pct. of adults under 65 without health insurance: 22.8%
> Poverty rate: 17.2%
> Pct. of adults in fair or poor health: 18.9%
> Medicaid expansion under ACA: No

15. Tyler, TX
> Pct. of adults under 65 without health insurance: 22.9%
> Poverty rate: 19.0%
> Pct. of adults in fair or poor health: 17.0%
> Medicaid expansion under ACA: No

14. Dalton, GA
> Pct. of adults under 65 without health insurance: 22.9%
> Poverty rate: 21.6%
> Pct. of adults in fair or poor health: 21.5%
> Medicaid expansion under ACA: No
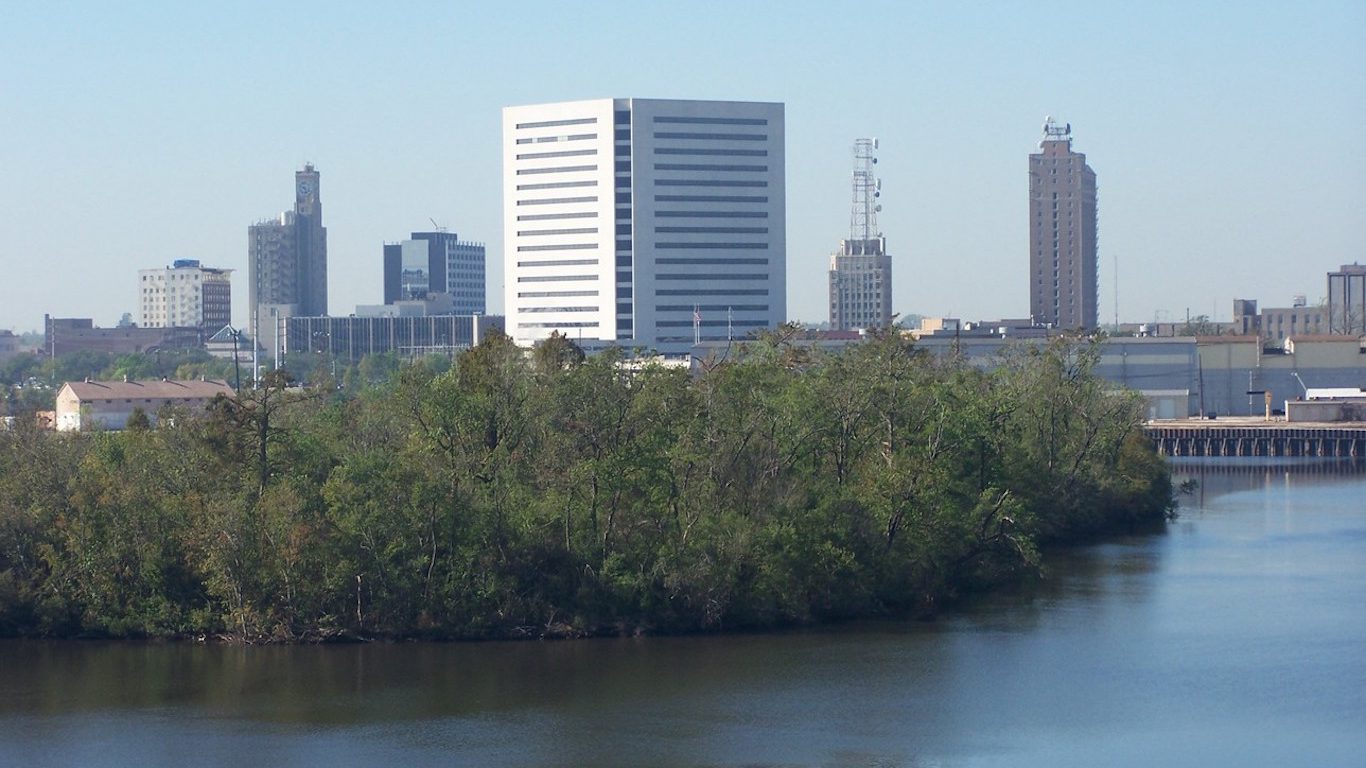
13. Beaumont-Port Arthur, TX
> Pct. of adults under 65 without health insurance: 23.2%
> Poverty rate: 18.6%
> Pct. of adults in fair or poor health: 17.6%
> Medicaid expansion under ACA: No

12. Sebastian-Vero Beach, FL
> Pct. of adults under 65 without health insurance: 23.2%
> Poverty rate: 15.1%
> Pct. of adults in fair or poor health: 14.7%
> Medicaid expansion under ACA: No
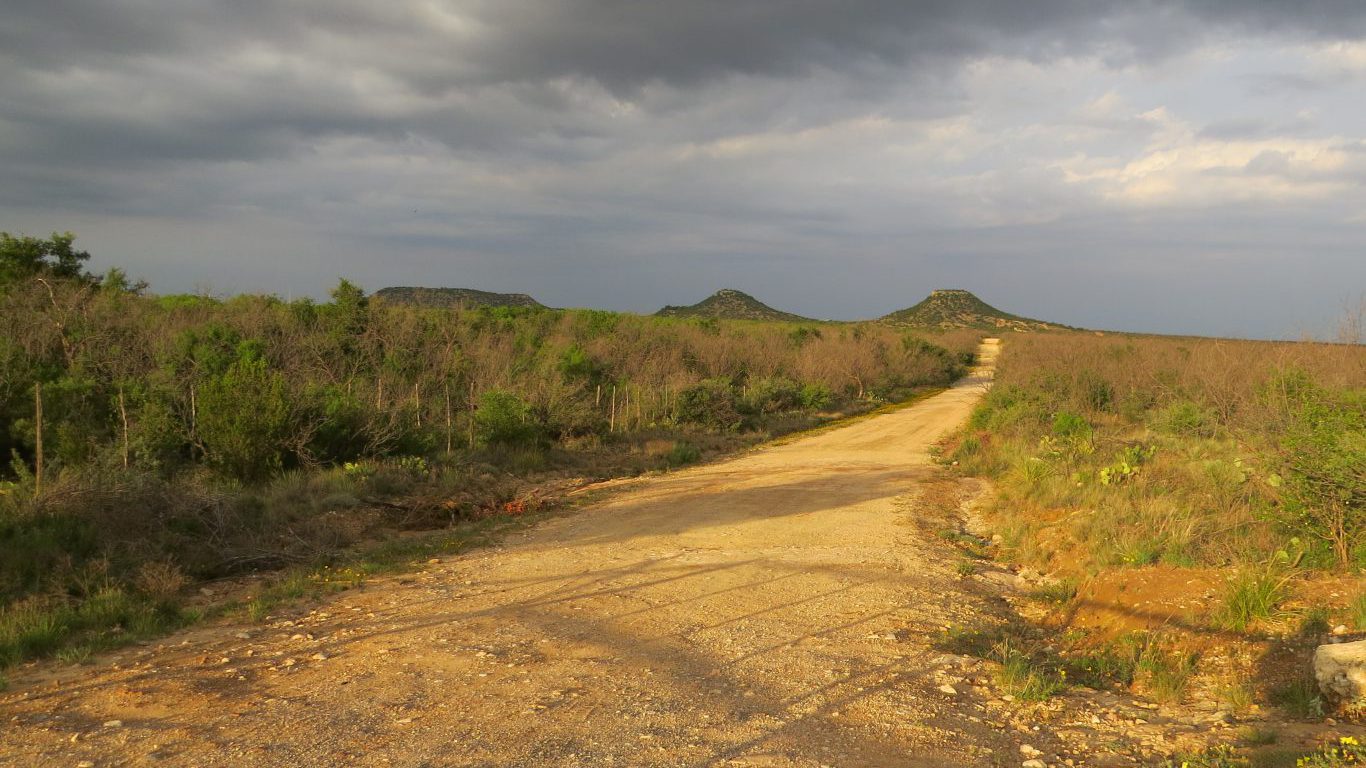
11. San Angelo, TX
> Pct. of adults under 65 without health insurance: 23.4%
> Poverty rate: 15.1%
> Pct. of adults in fair or poor health: 18.9%
> Medicaid expansion under ACA: No
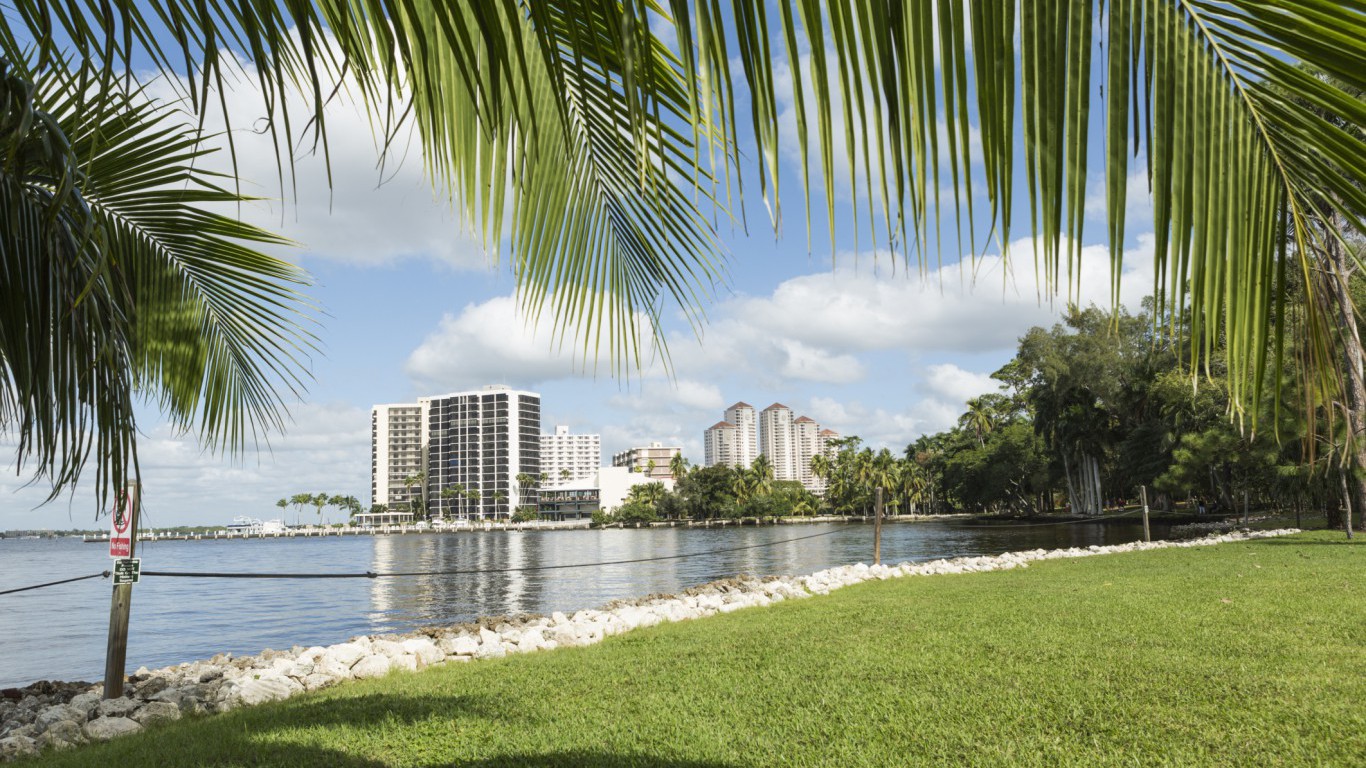
10. Cape Coral-Fort Myers, FL
> Pct. of adults under 65 without health insurance: 23.5%
> Poverty rate: 16.3%
> Pct. of adults in fair or poor health: 15.8%
> Medicaid expansion under ACA: No
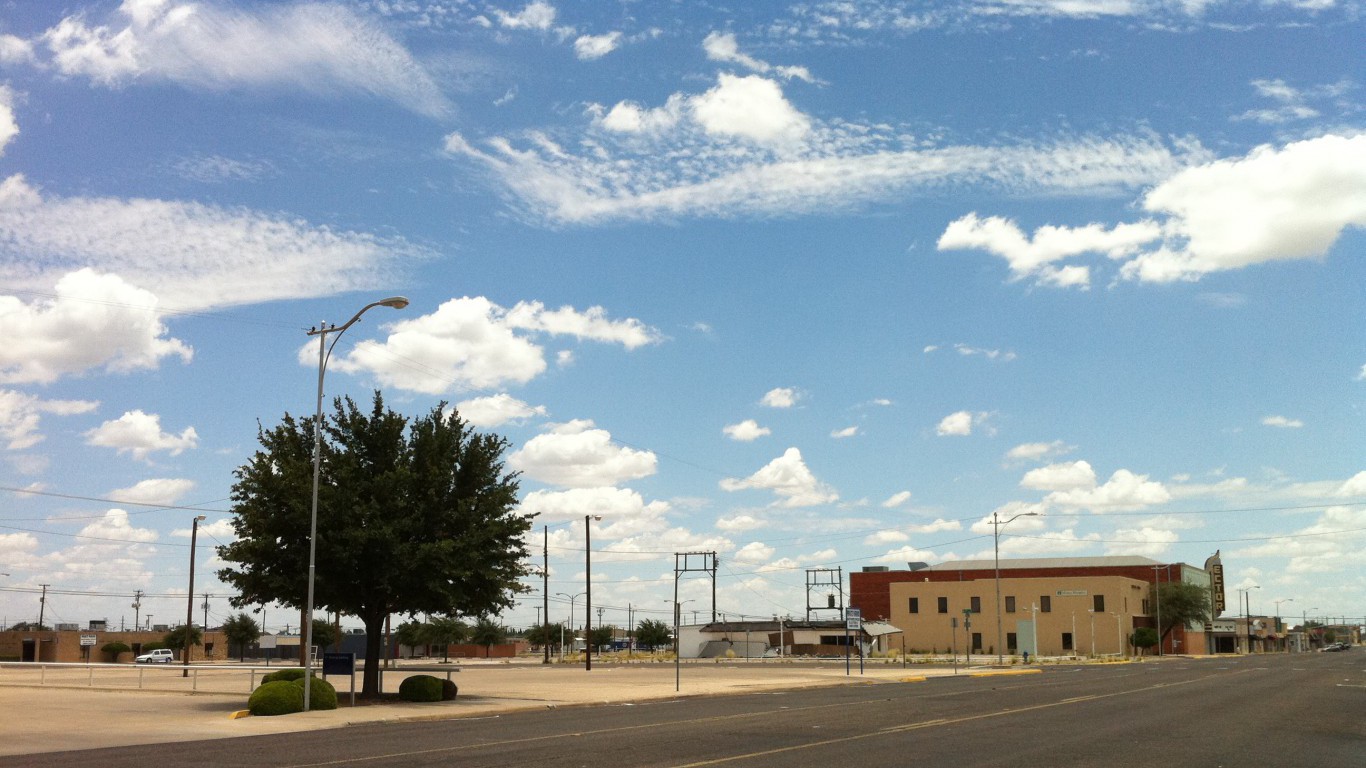
9. Odessa, TX
> Pct. of adults under 65 without health insurance: 23.6%
> Poverty rate: 10.0%
> Pct. of adults in fair or poor health: 20.8%
> Medicaid expansion under ACA: No

8. Lake Havasu City-Kingman, AZ
> Pct. of adults under 65 without health insurance: 23.7%
> Poverty rate: 20.6%
> Pct. of adults in fair or poor health: 19.3%
> Medicaid expansion under ACA: Yes
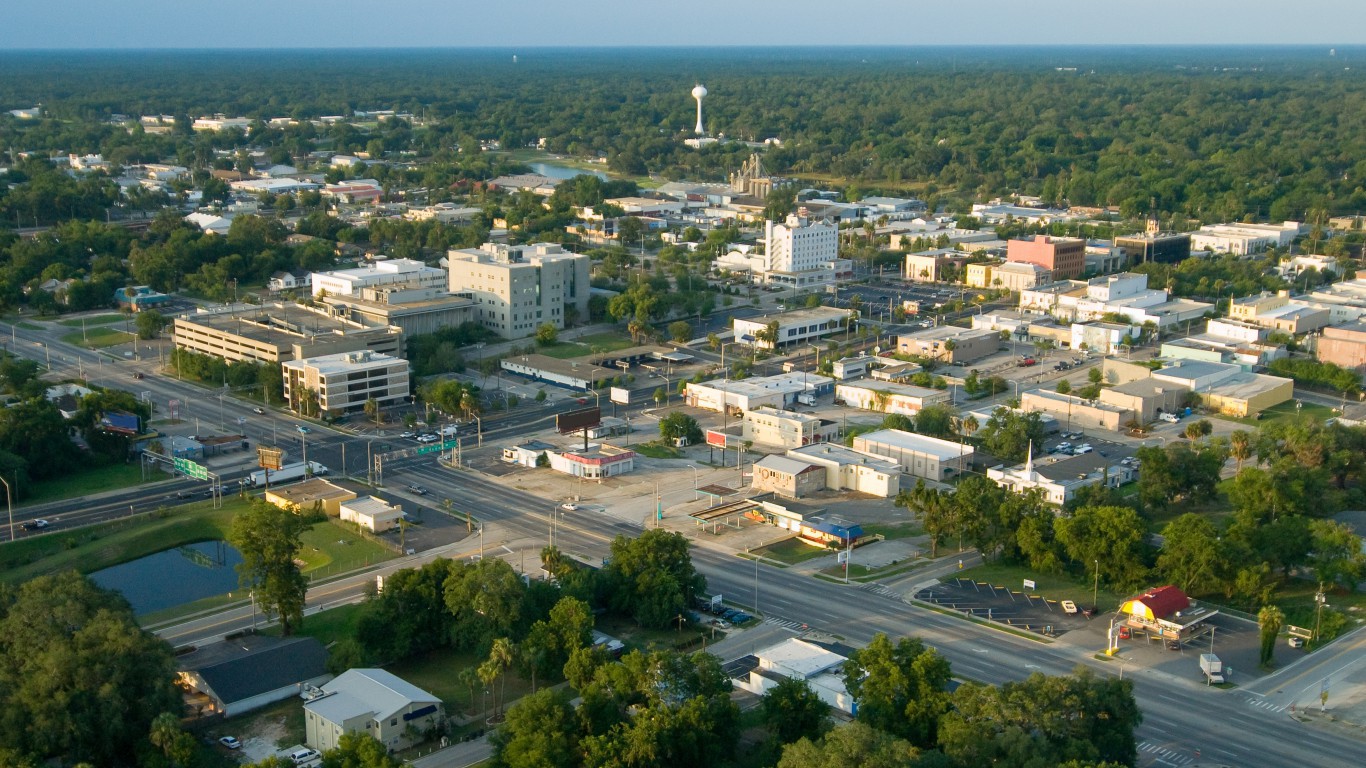
7. Ocala, FL
> Pct. of adults under 65 without health insurance: 23.7%
> Poverty rate: 17.4%
> Pct. of adults in fair or poor health: 17.6%
> Medicaid expansion under ACA: No

6. El Paso, TX
> Pct. of adults under 65 without health insurance: 25.1%
> Poverty rate: 23.4%
> Pct. of adults in fair or poor health: 27.8%
> Medicaid expansion under ACA: No
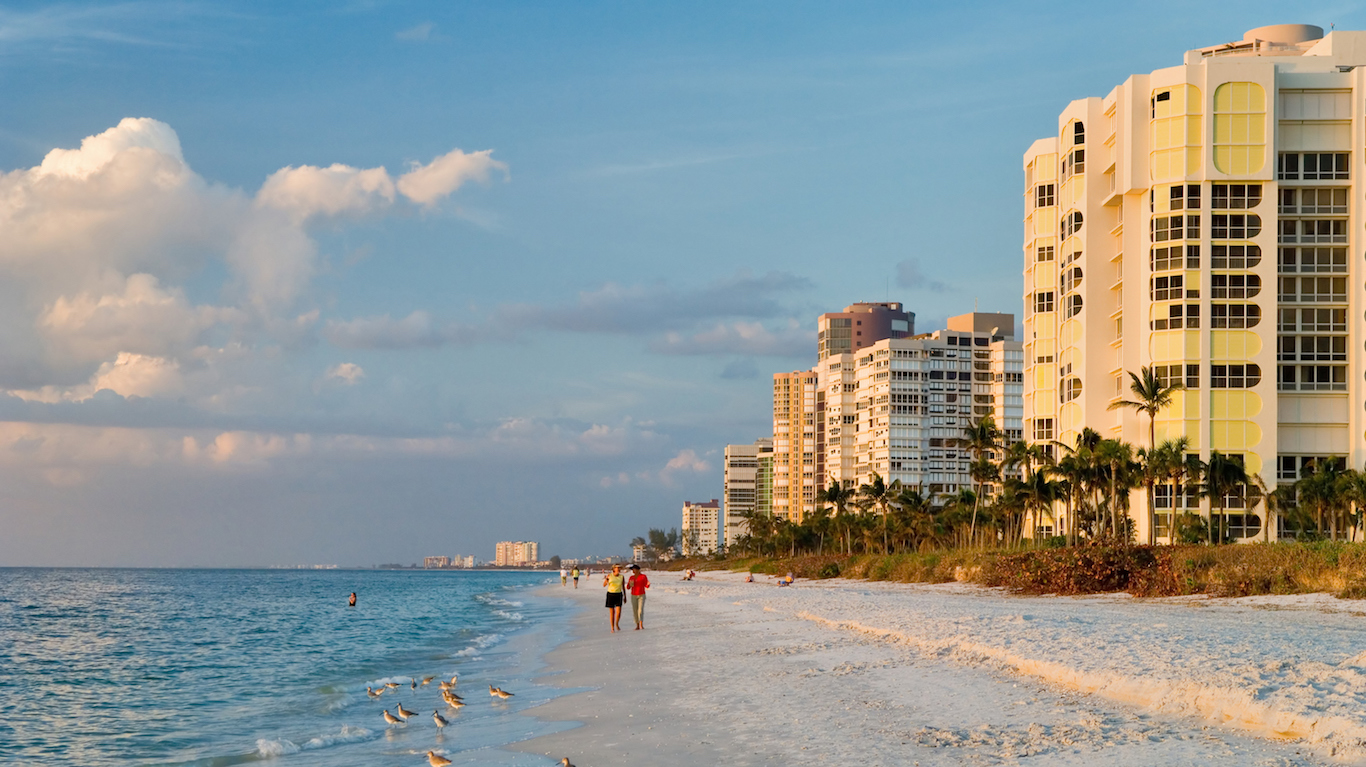
5. Naples-Immokalee-Marco Island, FL
> Pct. of adults under 65 without health insurance: 25.9%
> Poverty rate: 14.5%
> Pct. of adults in fair or poor health: 16.4%
> Medicaid expansion under ACA: No
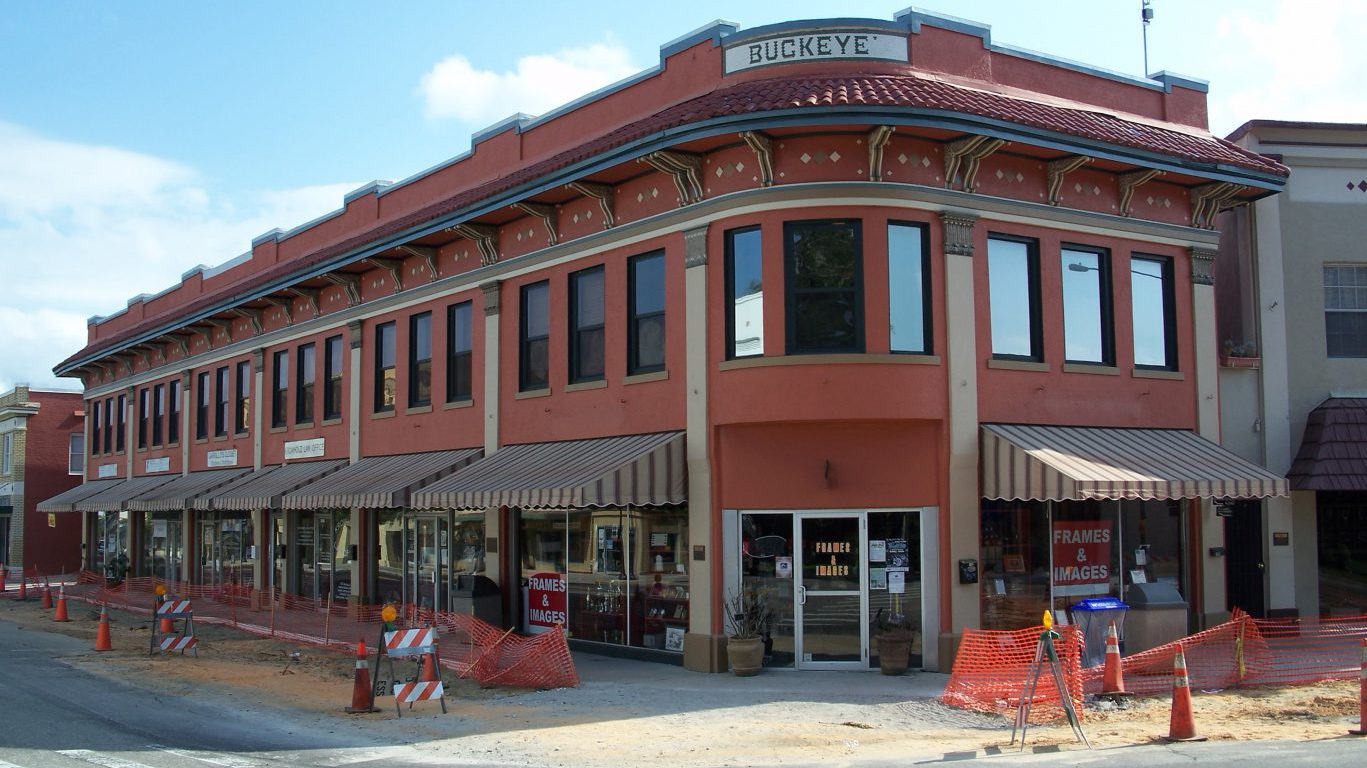
4. Sebring, FL
> Pct. of adults under 65 without health insurance: 27.2%
> Poverty rate: 18.1%
> Pct. of adults in fair or poor health: 17.4%
> Medicaid expansion under ACA: No
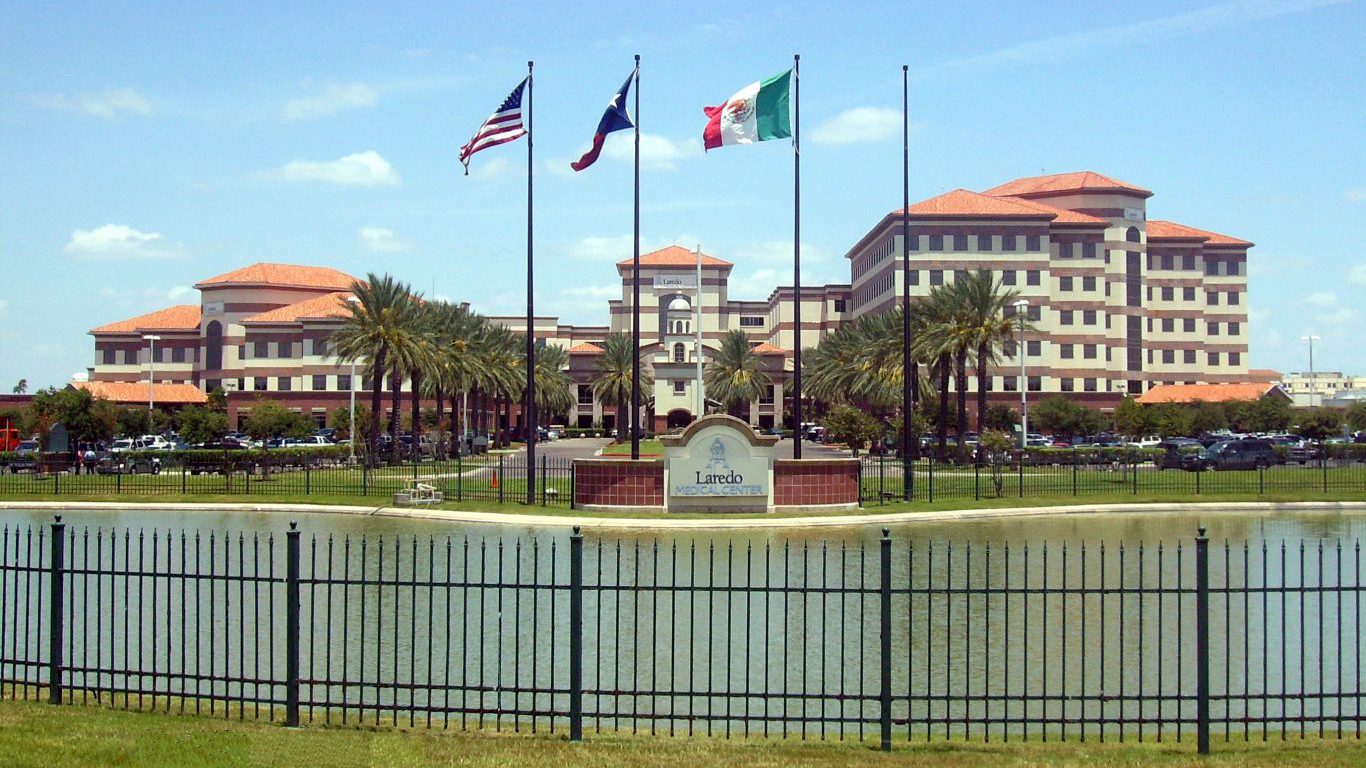
3. Laredo, TX
> Pct. of adults under 65 without health insurance: 33.4%
> Poverty rate: 33.4%
> Pct. of adults in fair or poor health: 35.1%
> Medicaid expansion under ACA: No
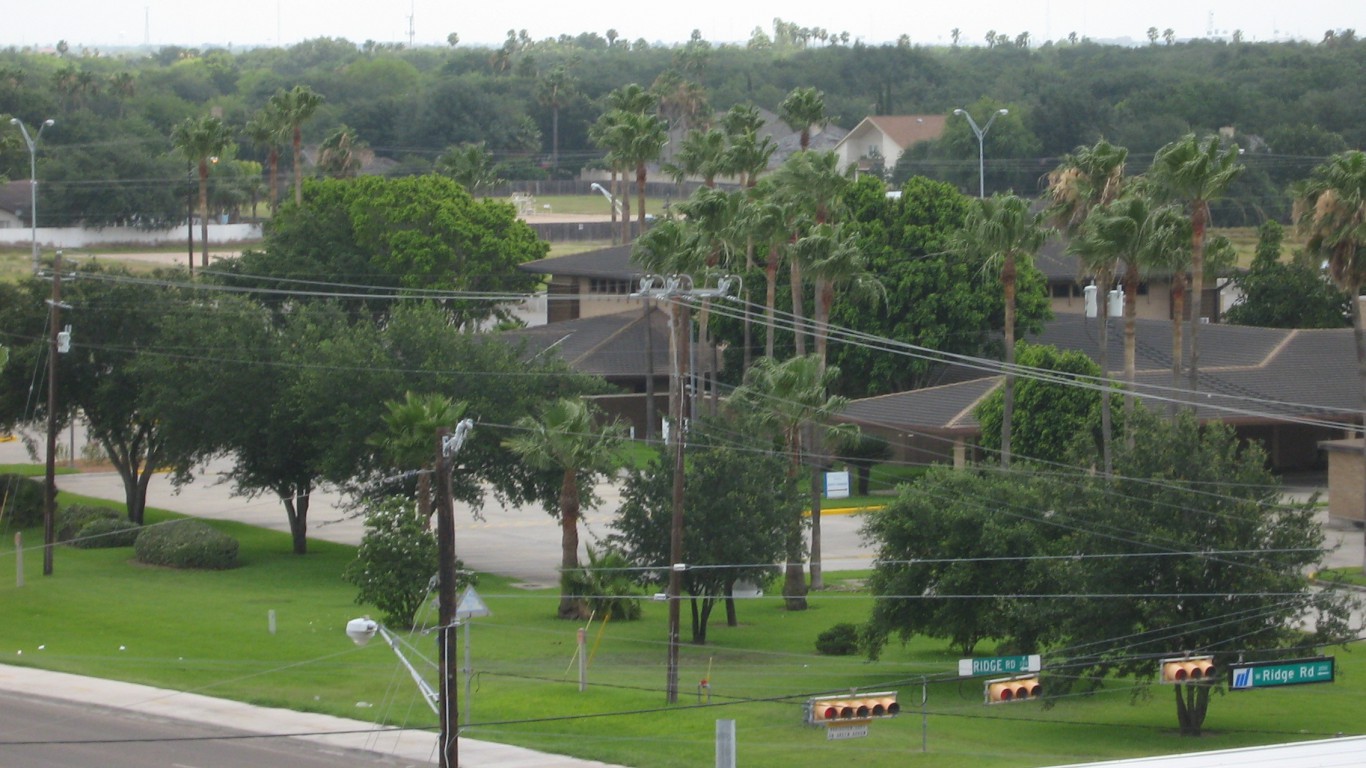
2. McAllen-Edinburg-Mission, TX
> Pct. of adults under 65 without health insurance: 35.1%
> Poverty rate: 34.0%
> Pct. of adults in fair or poor health: 30.4%
> Medicaid expansion under ACA: No

1. Brownsville-Harlingen, TX
> Pct. of adults under 65 without health insurance: 35.4%
> Poverty rate: 35.2%
> Pct. of adults in fair or poor health: 34.1%
> Medicaid expansion under ACA: No
After two decades of reviewing financial products I haven’t seen anything like this. Credit card companies are at war, handing out free rewards and benefits to win the best customers.
A good cash back card can be worth thousands of dollars a year in free money, not to mention other perks like travel, insurance, and access to fancy lounges.
Our top pick today pays up to 5% cash back, a $200 bonus on top, and $0 annual fee. Click here to apply before they stop offering rewards this generous.
Flywheel Publishing has partnered with CardRatings for our coverage of credit card products. Flywheel Publishing and CardRatings may receive a commission from card issuers.
Thank you for reading! Have some feedback for us?
Contact the 24/7 Wall St. editorial team.