
Life expectancy in the United States has increased steadily over the course of the past century. Longer lifespans are perhaps the ultimate bellwether of progress as they are largely due to medical advancements and overall improvements in the standard of living.
However, while Americans live longer today than they did 100 years ago, a rising incidence of alcohol poisoning, suicide, and certain diseases — especially among white men — has hindered this upward trend in recent years.
American lifespans vary considerably by geography. 24/7 Wall St. reviewed total mortality data in U.S. counties from the Centers of Disease Control and Prevention — specifically, the share of each county’s deaths a year that are of people younger than 35 years old. In Kusilvak, Alaska, nearly one-third of all deaths are of people people younger than 35 years — the highest such share in the nation. Nationwide, just 3.4% of all deaths are of people younger than 35.
Click here to see the 37 counties where people die young.
Click here to see the 17 counties where people die old.
This list consists of 37 counties, boroughs, and other areas tracked by the Census Bureau where at least 10% of deaths are of younger people.
Based on prevailing mortality rates, a child born in the United States today is expected to live around 78.5 years. Therefore, death before the age of 35 is extremely unusual and unexpected — what’s more, often such deaths are preventable.
In the United States, the rate of infant mortality — babies dying at or before one year old — is very high compared to other developed nations. Of all U.S. deaths before the age of 35, 23% are infants. Infant mortality often reflects a county’s overall health, and in areas with generally poorer health outcomes, infant mortality is higher.
Accidents make up much of the remaining deaths of the younger population. Although young people are far less vulnerable to diseases that afflict older people, many behave more recklessly than their older peers and are therefore perhaps more susceptible to accidents. The three most common causes of death among children and adults 10 to 35 years old are car crashes, drowning, and poisoning.
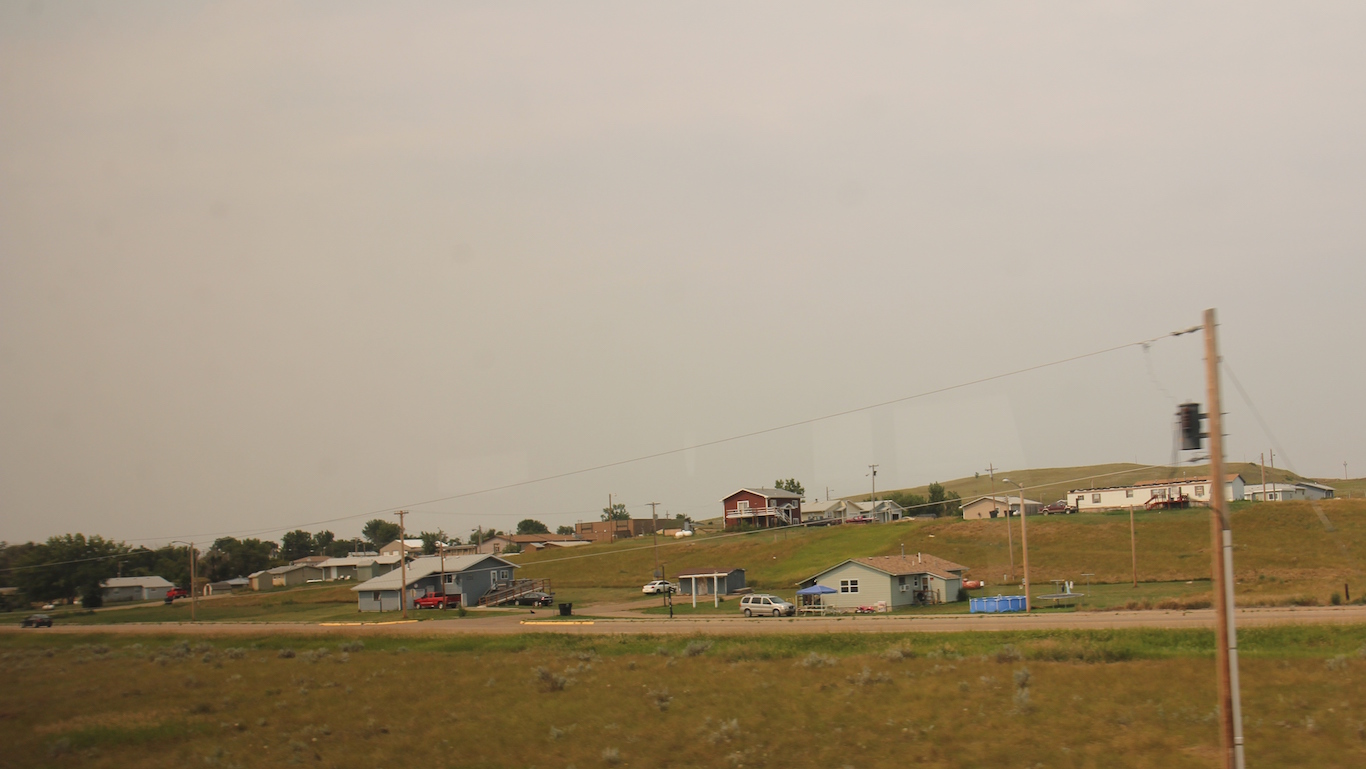
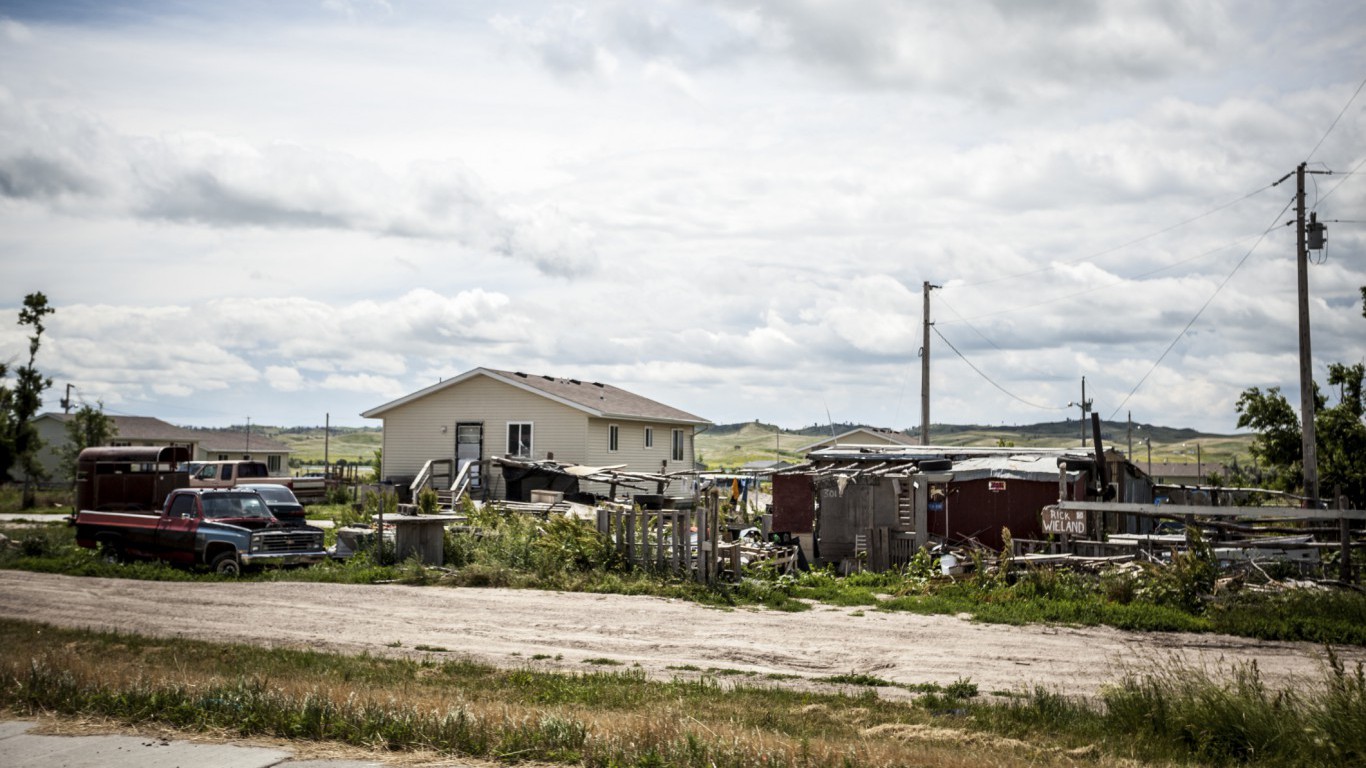
For a host of reasons, the most economically depressed areas in the United States are frequently Indian reservations. The populations of American Indians living in these areas tend to report some of the nation’s worst health outcomes overall, including premature death. Of the 37 areas reviewed on this list, a majority of residents in 20 of the areas identify as American Indian or Alaskan Native.
To determine the counties where a high percentage of overall deaths are of young people, 24/7 Wall St. reviewed the number of deaths of people under 35 between 2011 and 2013 as a percentage of all deaths from the Centers for Disease Control and Prevention. Life expectancy data on a county level came from the Institute for Health Metrics and Evaluation for 2010. Additionally, we considered median household incomes from the United States Census Bureau’s five-year American Community Survey. Infant mortality figures, as well as mortality data for various age groups, were based on five-year estimates from 2009-2013 and are from the Centers for Disease Control and Prevention’s National Center for Health Statistics.
These are the counties where people die young.

37. Onslow County, North Carolina
> Pct. of deaths under 35 yrs.: 10.0%
> Total number of deaths 2009-2013: 4,455
> Total deaths under 35 yrs. 2009-2013: 446
> Life expectancy: 77.3 years
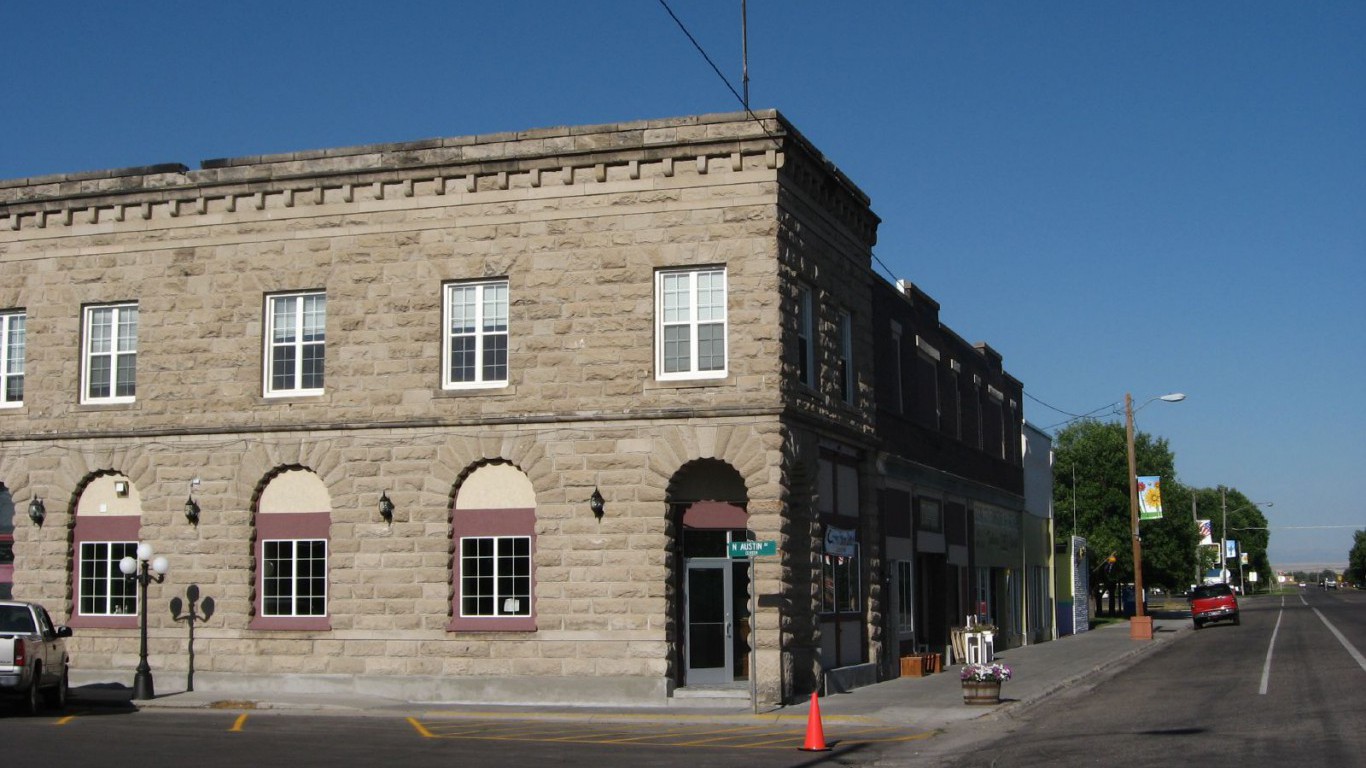
36. Madison County, Idaho
> Pct. of deaths under 35 yrs.: 10.0%
> Total number of deaths 2009-2013: 639
> Total deaths under 35 yrs. 2009-2013: 64
> Life expectancy: 79.5 years

35. Rio Arriba County, New Mexico
> Pct. of deaths under 35 yrs.: 10.2%
> Total number of deaths 2009-2013: 1,852
> Total deaths under 35 yrs. 2009-2013: 188
> Life expectancy: 75.0 years
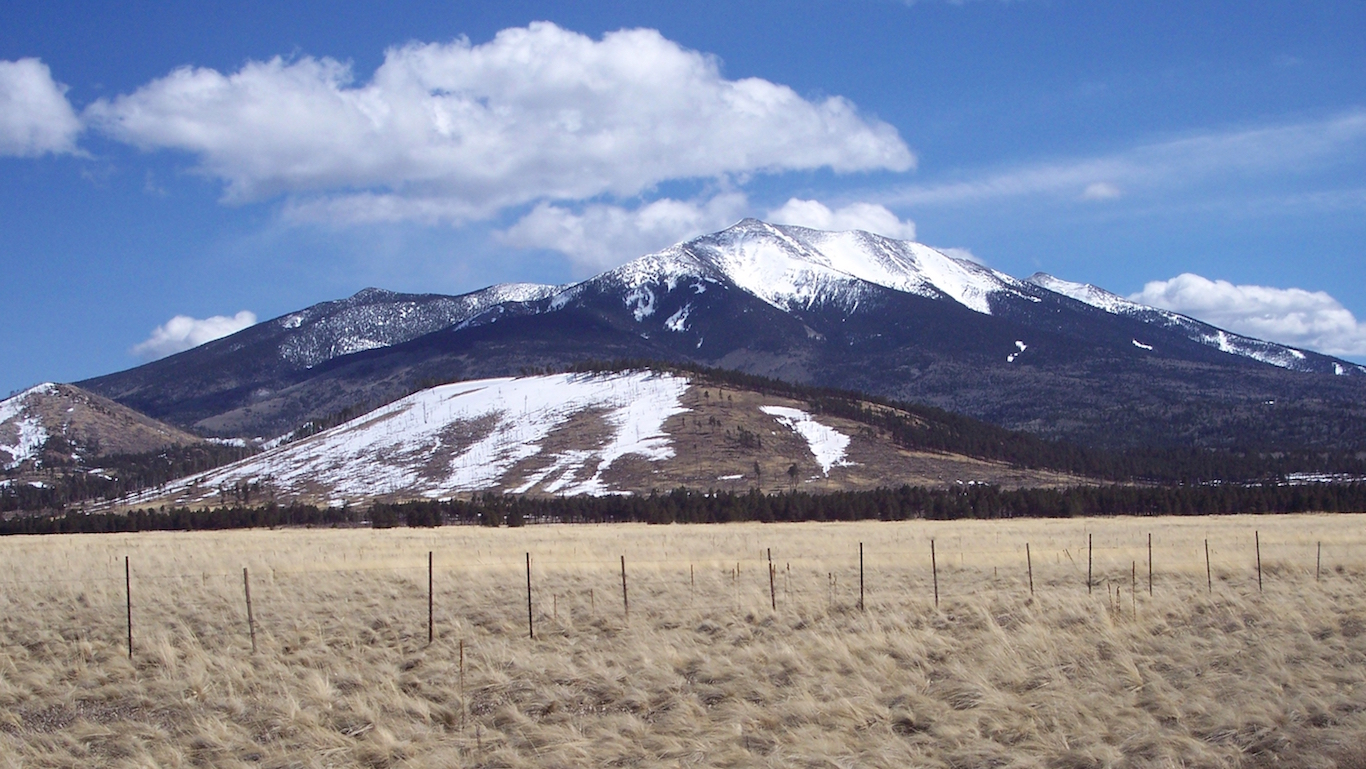
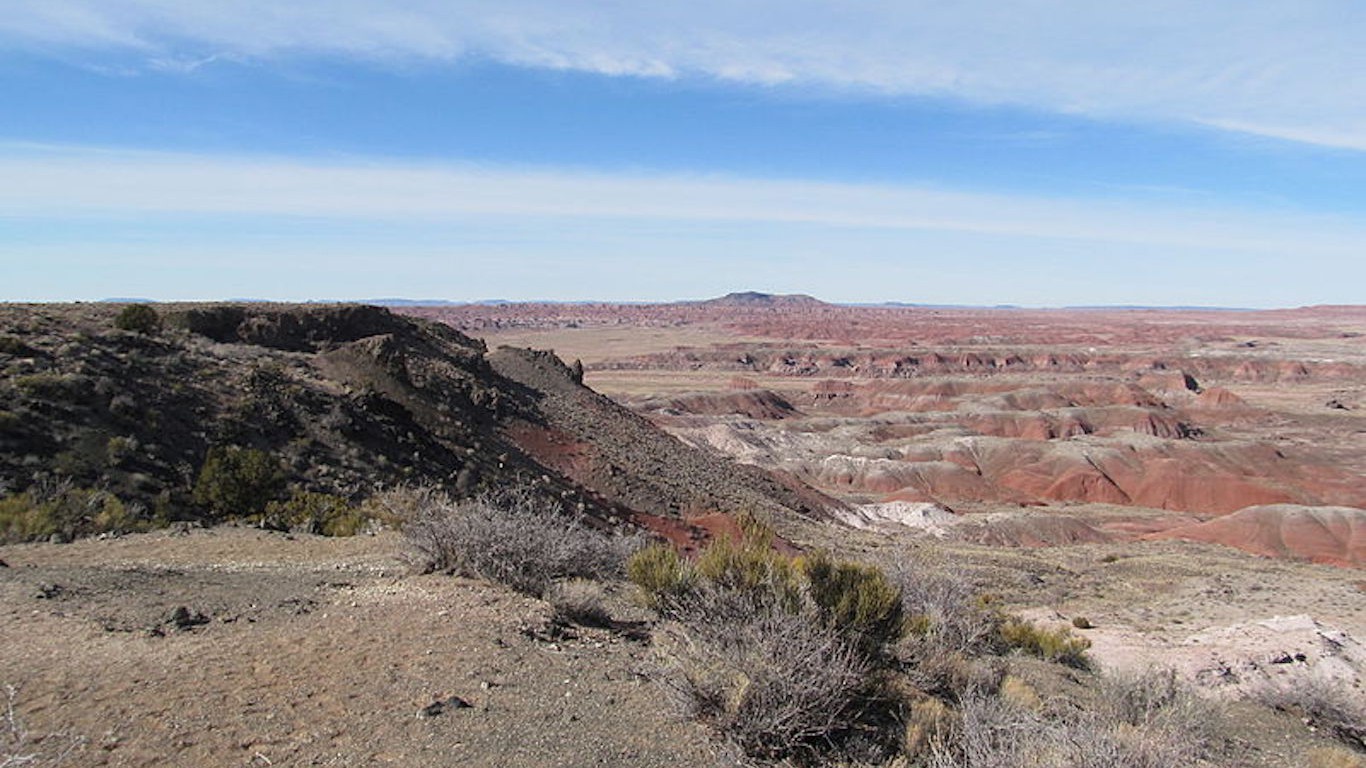
34. Coconino County, Arizona
> Pct. of deaths under 35 yrs.: 10.2%
> Total number of deaths 2009-2013: 3,563
> Total deaths under 35 yrs. 2009-2013: 362
> Life expectancy: 78.8 years
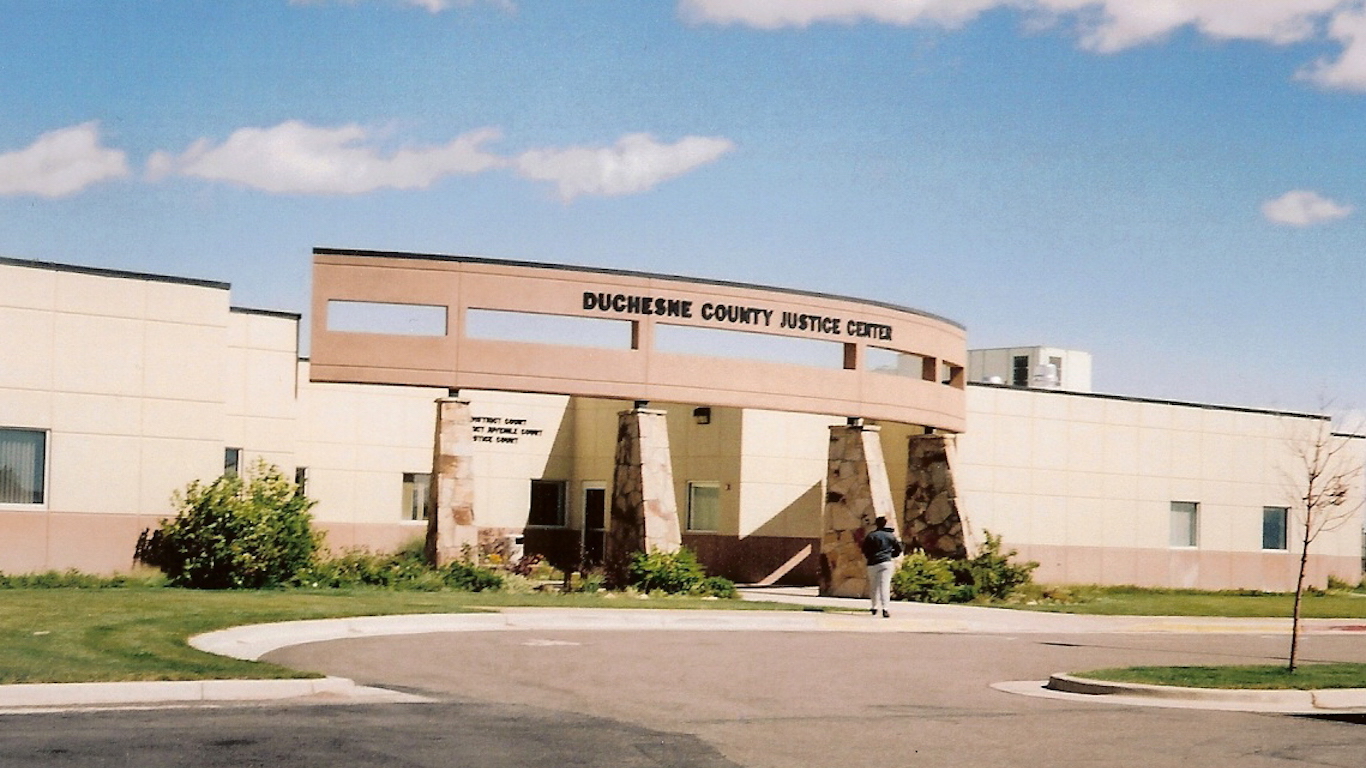
33. Duchesne County, Utah
> Pct. of deaths under 35 yrs.: 10.2%
> Total number of deaths 2009-2013: 636
> Total deaths under 35 yrs. 2009-2013: 65
> Life expectancy: 77.7 years
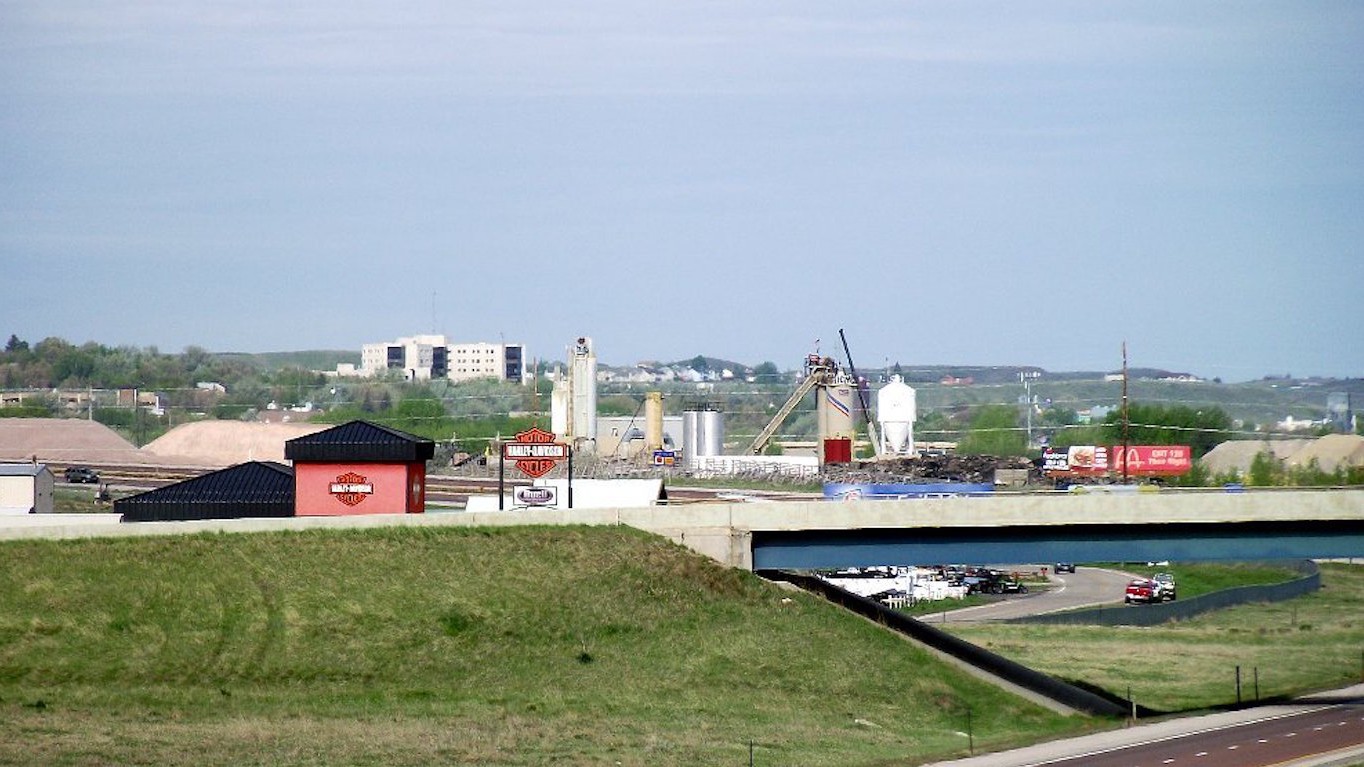
32. Campbell County, Wyoming
> Pct. of deaths under 35 yrs.: 10.5%
> Total number of deaths 2009-2013: 1,219
> Total deaths under 35 yrs. 2009-2013: 128
> Life expectancy: 76.5 years

31. Navajo County, Arizona
> Pct. of deaths under 35 yrs.: 10.8%
> Total number of deaths 2009-2013: 4,424
> Total deaths under 35 yrs. 2009-2013: 477
> Life expectancy: 75.3 years

30. Rolette County, North Dakota
> Pct. of deaths under 35 yrs.: 10.9%
> Total number of deaths 2009-2013: 670
> Total deaths under 35 yrs. 2009-2013: 73
> Life expectancy: 76.8 years

29. Teton County, Idaho
> Pct. of deaths under 35 yrs.: 11.0%
> Total number of deaths 2009-2013: 182
> Total deaths under 35 yrs. 2009-2013: 20
> Life expectancy: 79.4 years
28. McKenzie County, North Dakota
> Pct. of deaths under 35 yrs.: 11.0%
> Total number of deaths 2009-2013: 309
> Total deaths under 35 yrs. 2009-2013: 34
> Life expectancy: 79.7 years

27. Glacier County, Montana
> Pct. of deaths under 35 yrs.: 11.7%
> Total number of deaths 2009-2013: 632
> Total deaths under 35 yrs. 2009-2013: 74
> Life expectancy: 76.3 years
26. Geary County, Kansas
> Pct. of deaths under 35 yrs.: 11.8%
> Total number of deaths 2009-2013: 1,022
> Total deaths under 35 yrs. 2009-2013: 121
> Life expectancy: 76.0 years
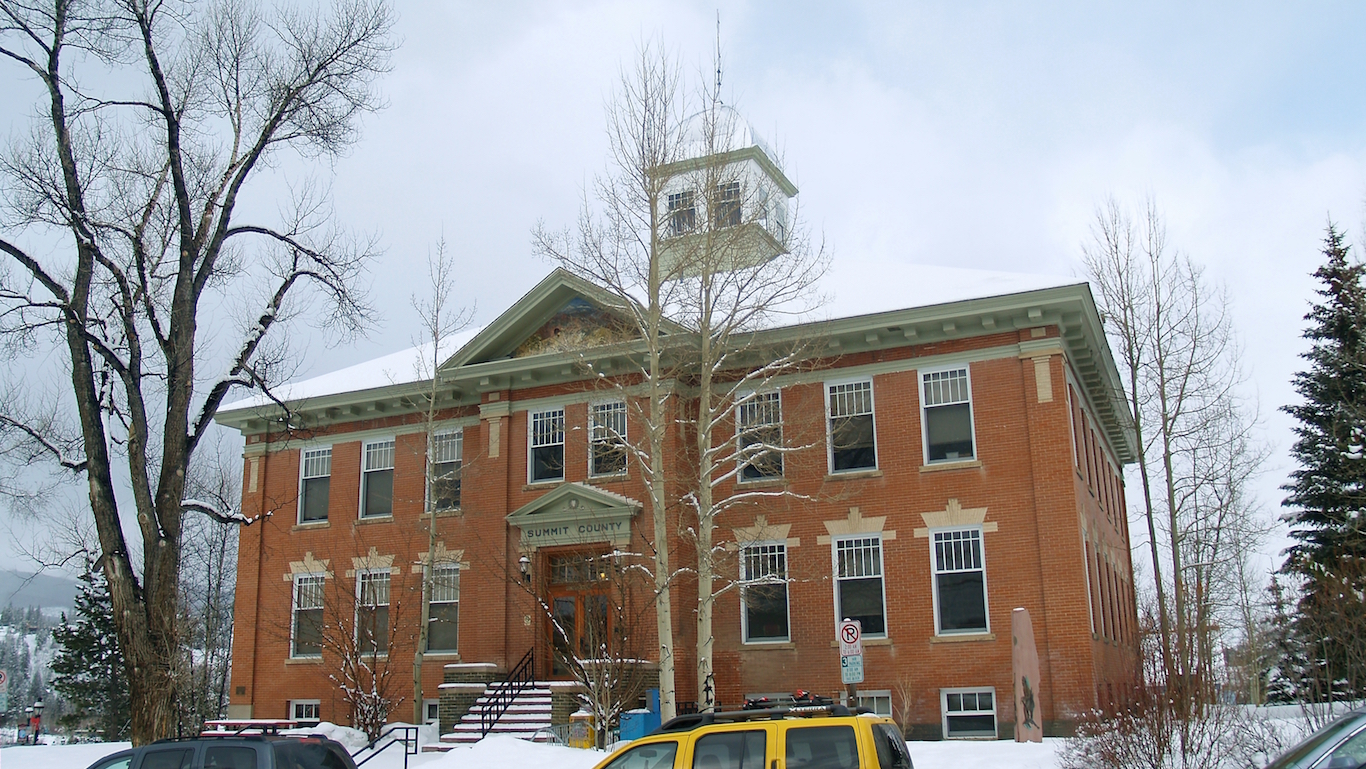
25. Summit County, Colorado
> Pct. of deaths under 35 yrs.: 11.9%
> Total number of deaths 2009-2013: 277
> Total deaths under 35 yrs. 2009-2013: 33
> Life expectancy: 81.6 years
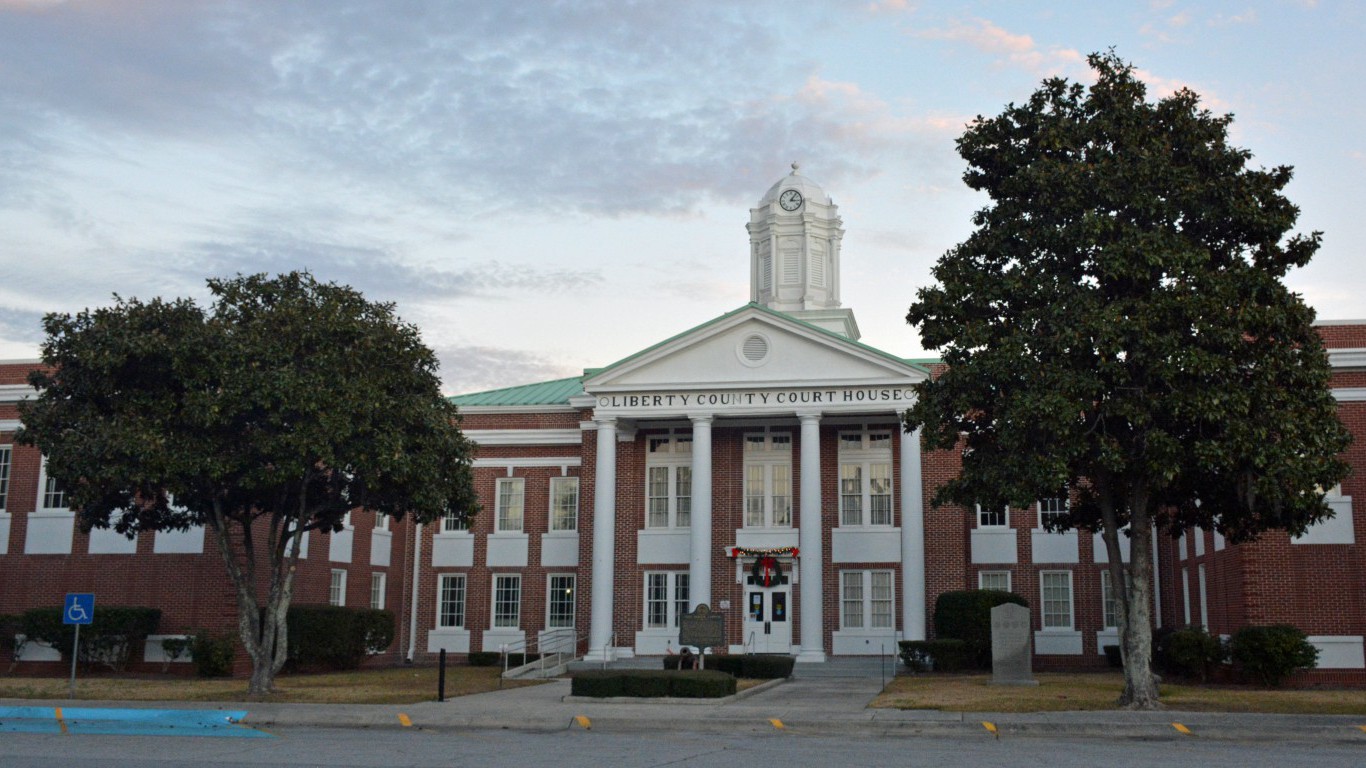
24. Liberty County, Georgia
> Pct. of deaths under 35 yrs.: 12.0%
> Total number of deaths 2009-2013: 1,492
> Total deaths under 35 yrs. 2009-2013: 179
> Life expectancy: 76.5 years

23. San Juan County, Utah
> Pct. of deaths under 35 yrs.: 12.0%
> Total number of deaths 2009-2013: 457
> Total deaths under 35 yrs. 2009-2013: 55
> Life expectancy: 78.5 years

22. Chattahoochee County, Georgia
> Pct. of deaths under 35 yrs.: 12.2%
> Total number of deaths 2009-2013: 180
> Total deaths under 35 yrs. 2009-2013: 22
> Life expectancy: 74.7 years

21. McKinley County, New Mexico
> Pct. of deaths under 35 yrs.: 12.3%
> Total number of deaths 2009-2013: 2,573
> Total deaths under 35 yrs. 2009-2013: 317
> Life expectancy: 75.0 years

20. Yukon-Koyukuk, Alaska
> Pct. of deaths under 35 yrs.: 12.5%
> Total number of deaths 2009-2013: 264
> Total deaths under 35 yrs. 2009-2013: 33
> Life expectancy: 77.8 years
19. Roosevelt County, Montana
> Pct. of deaths under 35 yrs.: 12.6%
> Total number of deaths 2009-2013: 602
> Total deaths under 35 yrs. 2009-2013: 76
> Life expectancy: 75.6 years
18. Apache County, Arizona
> Pct. of deaths under 35 yrs.: 12.8%
> Total number of deaths 2009-2013: 2,958
> Total deaths under 35 yrs. 2009-2013: 378
> Life expectancy: 73.0 years
17. Big Horn County, Montana
> Pct. of deaths under 35 yrs.: 12.9%
> Total number of deaths 2009-2013: 542
> Total deaths under 35 yrs. 2009-2013: 70
> Life expectancy: 77.4 years

16. Rosebud County, Montana
> Pct. of deaths under 35 yrs.: 13.4%
> Total number of deaths 2009-2013: 411
> Total deaths under 35 yrs. 2009-2013: 55
> Life expectancy: 78.0 years
15. Dewey County, South Dakota
> Pct. of deaths under 35 yrs.: 13.5%
> Total number of deaths 2009-2013: 289
> Total deaths under 35 yrs. 2009-2013: 39
> Life expectancy: 75.3 years

14. Eagle County, Colorado
> Pct. of deaths under 35 yrs.: 13.8%
> Total number of deaths 2009-2013: 516
> Total deaths under 35 yrs. 2009-2013: 71
> Life expectancy: 82.1 years
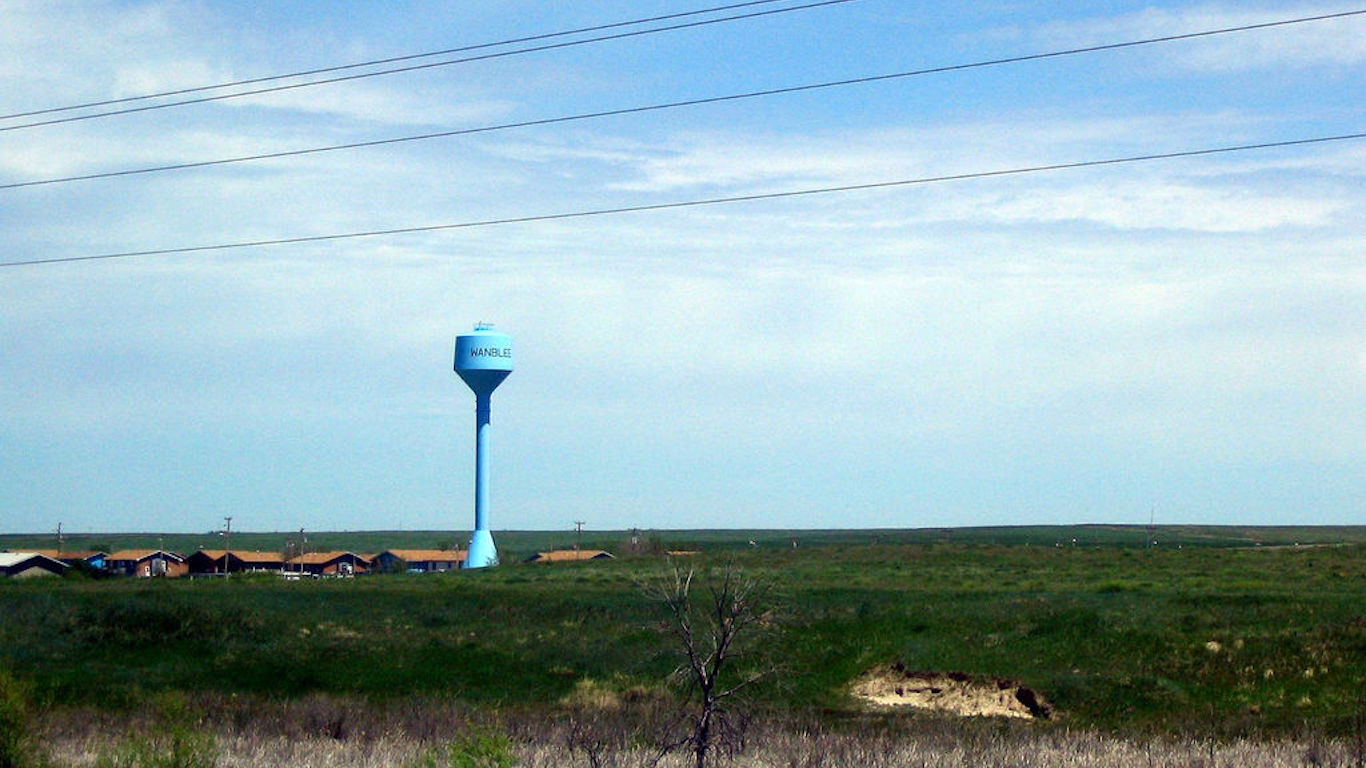
13. Jackson County, South Dakota
> Pct. of deaths under 35 yrs.: 15.8%
> Total number of deaths 2009-2013: 165
> Total deaths under 35 yrs. 2009-2013: 26
> Life expectancy: 73.2 years
12. Benson County, North Dakota
> Pct. of deaths under 35 yrs.: 15.9%
> Total number of deaths 2009-2013: 353
> Total deaths under 35 yrs. 2009-2013: 56
> Life expectancy: 79.0 years
11. Bennett County, South Dakota
> Pct. of deaths under 35 yrs.: 17.7%
> Total number of deaths 2009-2013: 158
> Total deaths under 35 yrs. 2009-2013: 28
> Life expectancy: 73.3 years

10. Dillingham, Alaska
> Pct. of deaths under 35 yrs.: 17.8%
> Total number of deaths 2009-2013: 174
> Total deaths under 35 yrs. 2009-2013: 31
> Life expectancy: 77.8 years

9. North Slope Borough, Alaska
> Pct. of deaths under 35 yrs.: 18.0%
> Total number of deaths 2009-2013: 222
> Total deaths under 35 yrs. 2009-2013: 40
> Life expectancy: 77.4 years
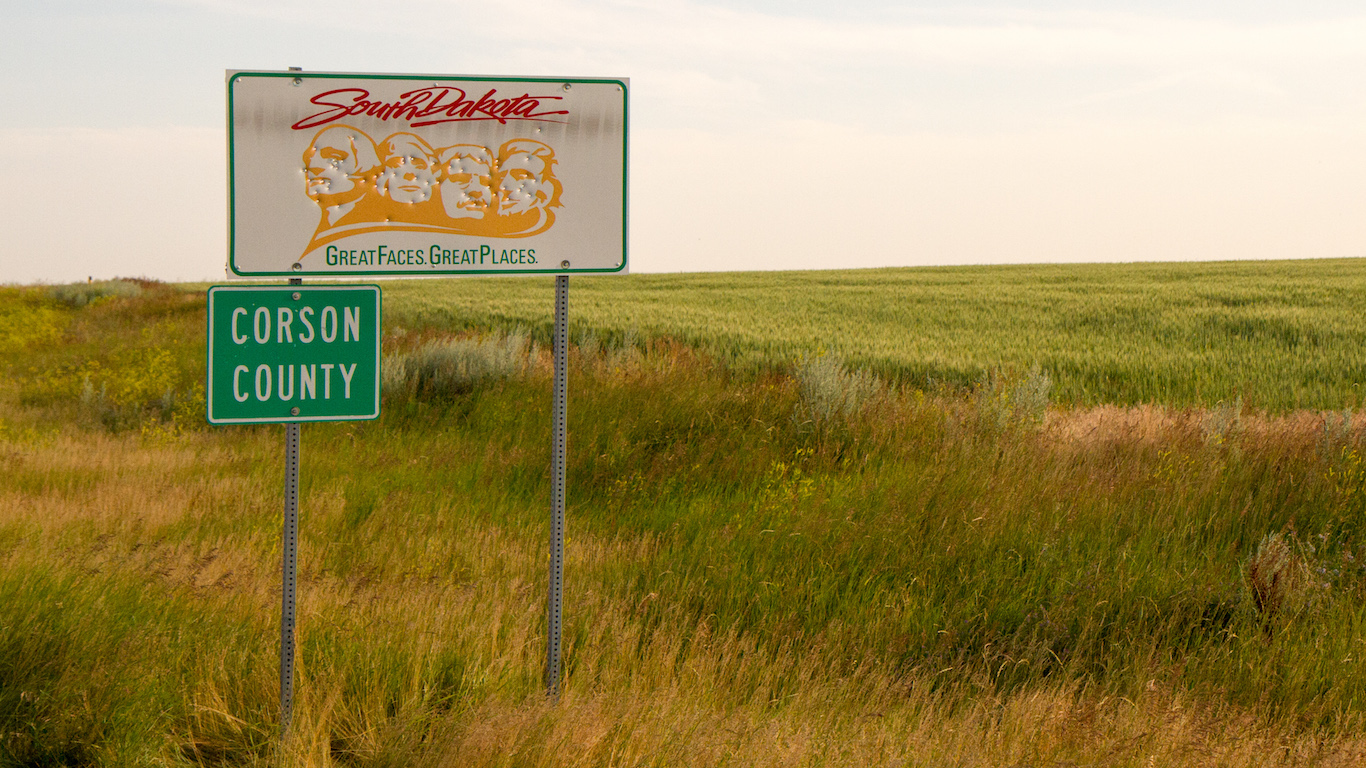
8. Corson County, South Dakota
> Pct. of deaths under 35 yrs.: 18.1%
> Total number of deaths 2009-2013: 227
> Total deaths under 35 yrs. 2009-2013: 41
> Life expectancy: 75.2 years

7. Todd County, South Dakota
> Pct. of deaths under 35 yrs.: 18.6%
> Total number of deaths 2009-2013: 436
> Total deaths under 35 yrs. 2009-2013: 81
> Life expectancy: 73.3 years

6. Northwest Arctic Borough, Alaska
> Pct. of deaths under 35 yrs.: 20.5%
> Total number of deaths 2009-2013: 219
> Total deaths under 35 yrs. 2009-2013: 45
> Life expectancy: 77.8 years
 24/7 Wall St.
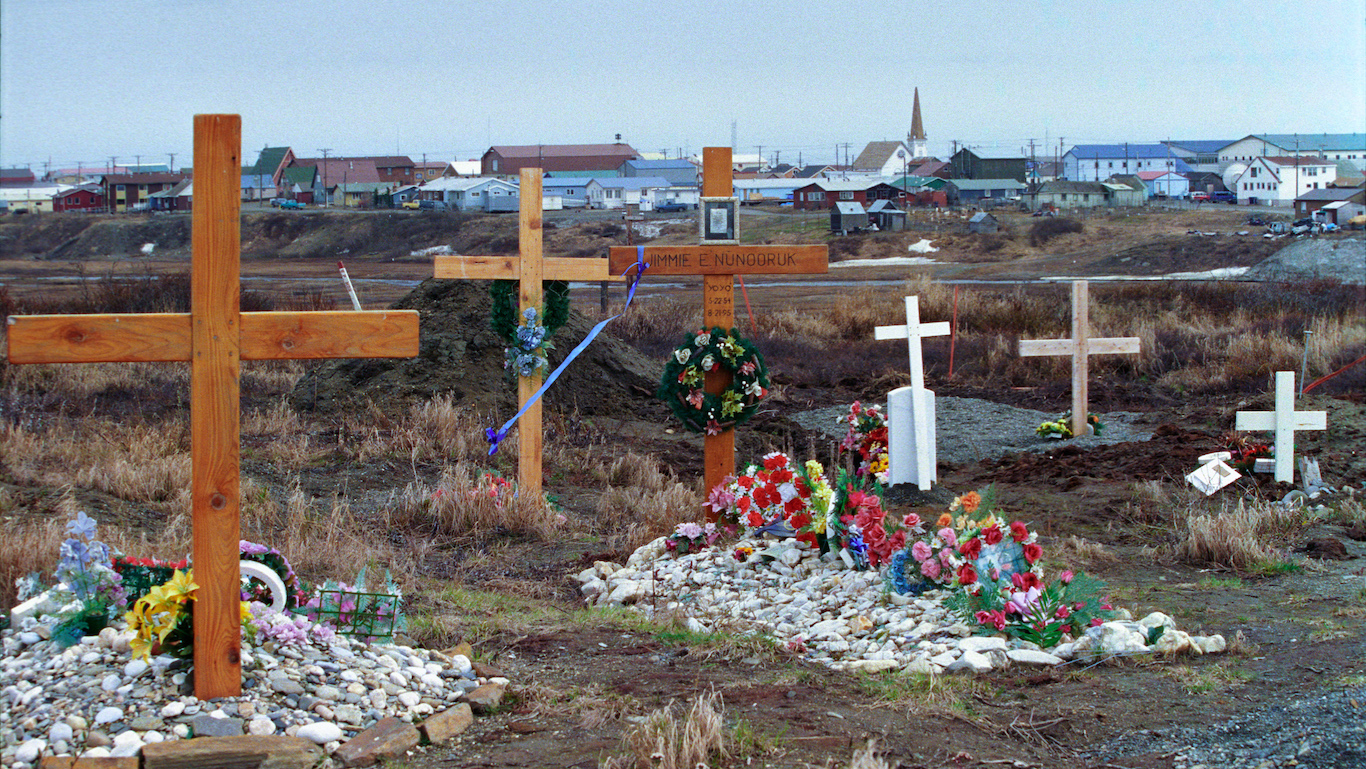
5. Nome, Alaska
> Pct. of deaths under 35 yrs.: 21.0%
> Total number of deaths 2009-2013: 367
> Total deaths under 35 yrs. 2009-2013: 77
> Life expectancy: 77.8 years
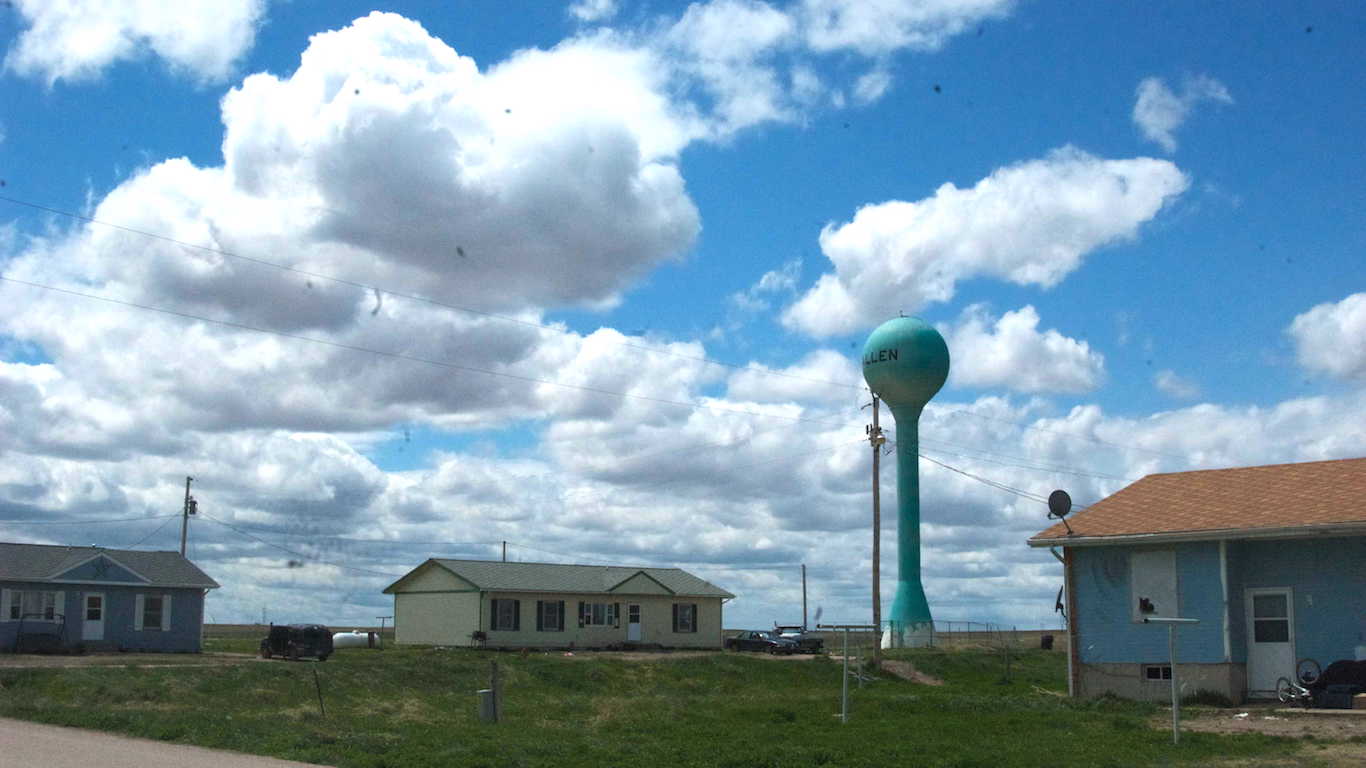
4. Oglala Lakota County, South Dakota
> Pct. of deaths under 35 yrs.: 22.5%
> Total number of deaths 2009-2013: 605
> Total deaths under 35 yrs. 2009-2013: 136
> Life expectancy: 73.7 years

3. Bethel, Alaska
> Pct. of deaths under 35 yrs.: 22.9%
> Total number of deaths 2009-2013: 498
> Total deaths under 35 yrs. 2009-2013: 114
> Life expectancy: 77.9 years
2. Sioux County, North Dakota
> Pct. of deaths under 35 yrs.: 23.8%
> Total number of deaths 2009-2013: 214
> Total deaths under 35 yrs. 2009-2013: 51
> Life expectancy: 77.5 years

1. Kusilvak, Alaska
> Pct. of deaths under 35 yrs.: 33.1%
> Total number of deaths 2009-2013: 302
> Total deaths under 35 yrs. 2009-2013: 100
> Life expectancy: 77.8 years
Are You Ahead, or Behind on Retirement? (sponsor)
If you’re one of the over 4 Million Americans set to retire this year, you may want to pay attention.
Finding a financial advisor who puts your interest first can be the difference between a rich retirement and barely getting by, and today it’s easier than ever. SmartAsset’s free tool matches you with up to three fiduciary financial advisors that serve your area in minutes. Each advisor has been carefully vetted, and must act in your best interests. Start your search now.
Don’t waste another minute; get started right here and help your retirement dreams become a retirement reality.
Thank you for reading! Have some feedback for us?
Contact the 24/7 Wall St. editorial team.
Latest from 24/7


Our expert who first called NVIDIA in 2009 is predicting 2025 will see a historic AI breakthrough.
You can follow him investing $500,000 of his own money on our top AI stocks for free.