
The United States has created more than 10 million jobs in the past four years. Over this time, the unemployment rate fell from 8.2% to 4.9%, the lowest in nearly a decade.
24/7 Wall St. compared the most recent employment levels in U.S. metro areas with levels four years ago. With the economic recovery, the vast majority of metro areas report at least some job growth over this time. In some cities, the number of jobs has grown dramatically. Employment levels in nine metro areas grew by at least 15%, and in Bend-Redmond, Oregon, the four-year employment growth of 20.9% was the fastest in the country.
Despite the nationwide trend, job markets in some cities did not improve. Most notable was the 6.8% decline in the number of jobs in Atlantic City-Hammonton, New Jersey over the past four years, the largest decline in the nation.
Click here to see the cities adding the most jobs.
Click here to see the cities losing the most jobs.
Job gains, or losses, in an area are usually tied to particular industries — typically the nation’s largest. Health care and social assistance, retail trade, state and local government, and the professional and business services sectors are the nation’s major industry employers.
The professional and business services sector was among the primary drivers of job growth, accounting for the most jobs added in seven of the 25 cities with the most job growth.
To identify the cities with the highest job growth, 24/7 Wall St. reviewed metropolitan statistical areas with the largest changes in employment — the number of jobs from June 2012 through June 2016. Unemployment rates, the size of the labor force, and employment levels are from the Current Population Survey (CPS), a monthly survey of households jointly administered by the Bureau of Labor Statistics (BLS) and U.S. Census Bureau. Industry-specific growth rates for the same period are from the Current Employment Survey (CES), also from the BLS.
These are the cities adding the most jobs.
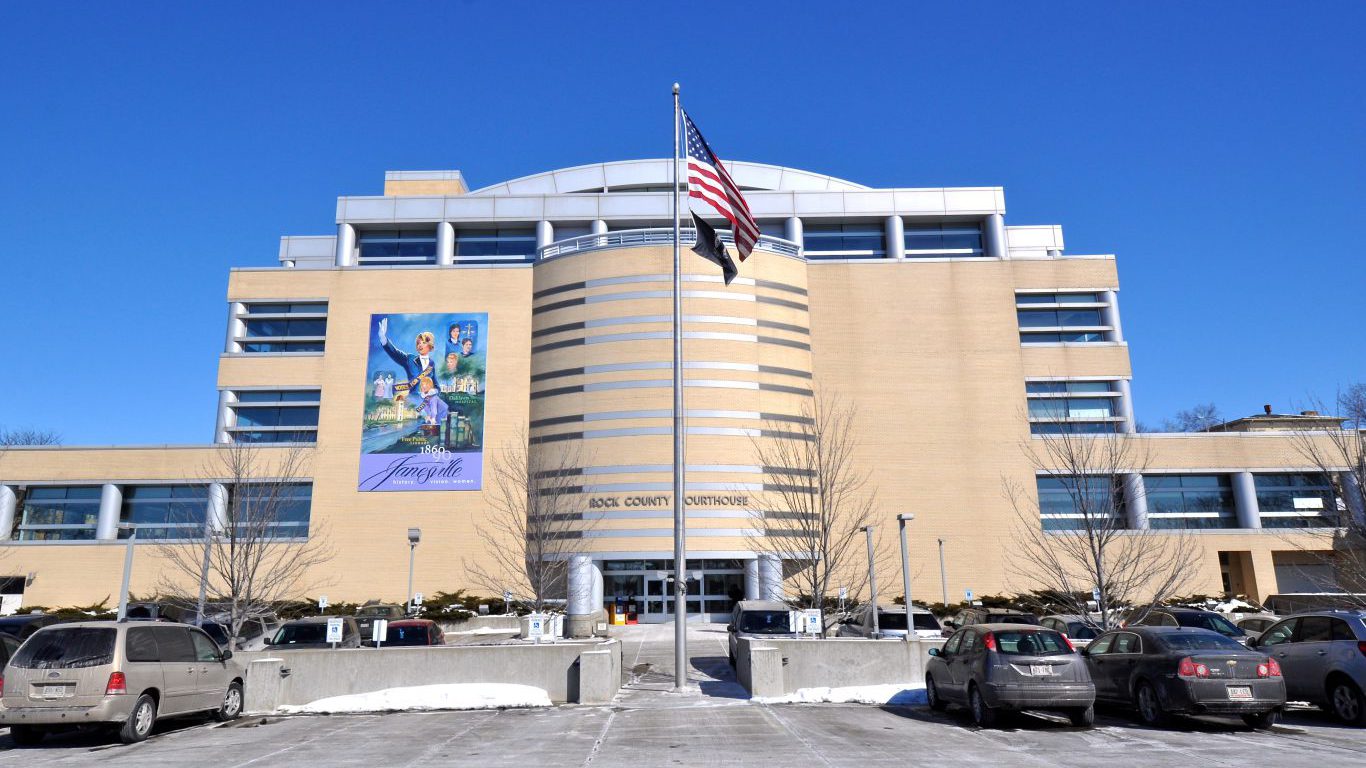
50. Janesville-Beloit, WI
> Employment increase: 10.4%
> No. of jobs June 2012: 74,660
> No. of jobs June 2016: 82,448
> Unemployment rate June 2016: 4.5%
49. Greenville-Anderson-Mauldin, SC
> Employment increase: 10.4%
> No. of jobs June 2012: 364,865
> No. of jobs June 2016: 402,929
> Unemployment rate June 2016: 4.7%

48. Columbia, SC
> Employment increase: 10.5%
> No. of jobs June 2012: 348,309
> No. of jobs June 2016: 384,732
> Unemployment rate June 2016: 4.8%

47. Ann Arbor, MI
> Employment increase: 10.5%
> No. of jobs June 2012: 171,337
> No. of jobs June 2016: 189,268
> Unemployment rate June 2016: 2.8%

46. Salem, OR
> Employment increase: 10.5%
> No. of jobs June 2012: 168,053
> No. of jobs June 2016: 185,651
> Unemployment rate June 2016: 5.5%
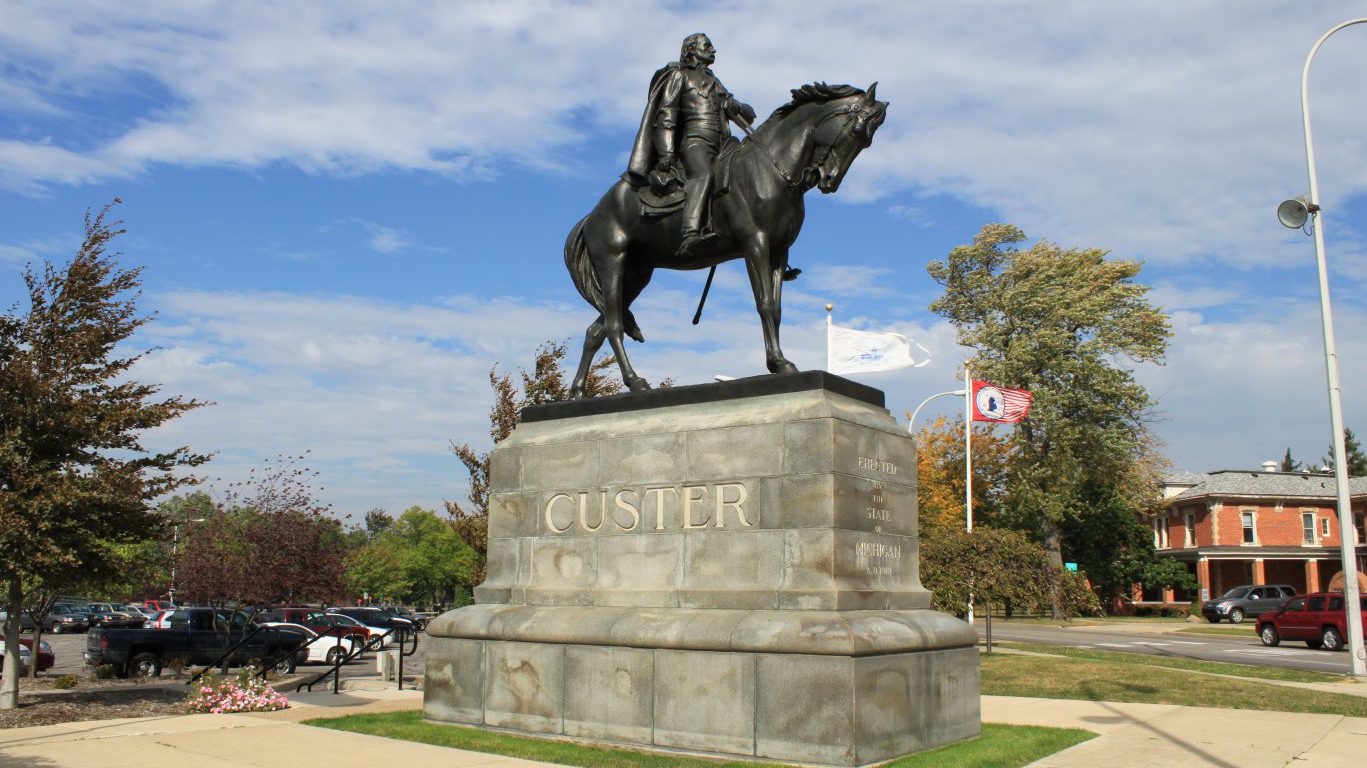
45. Monroe, MI
> Employment increase: 10.5%
> No. of jobs June 2012: 67,912
> No. of jobs June 2016: 75,055
> Unemployment rate June 2016: 3.7%
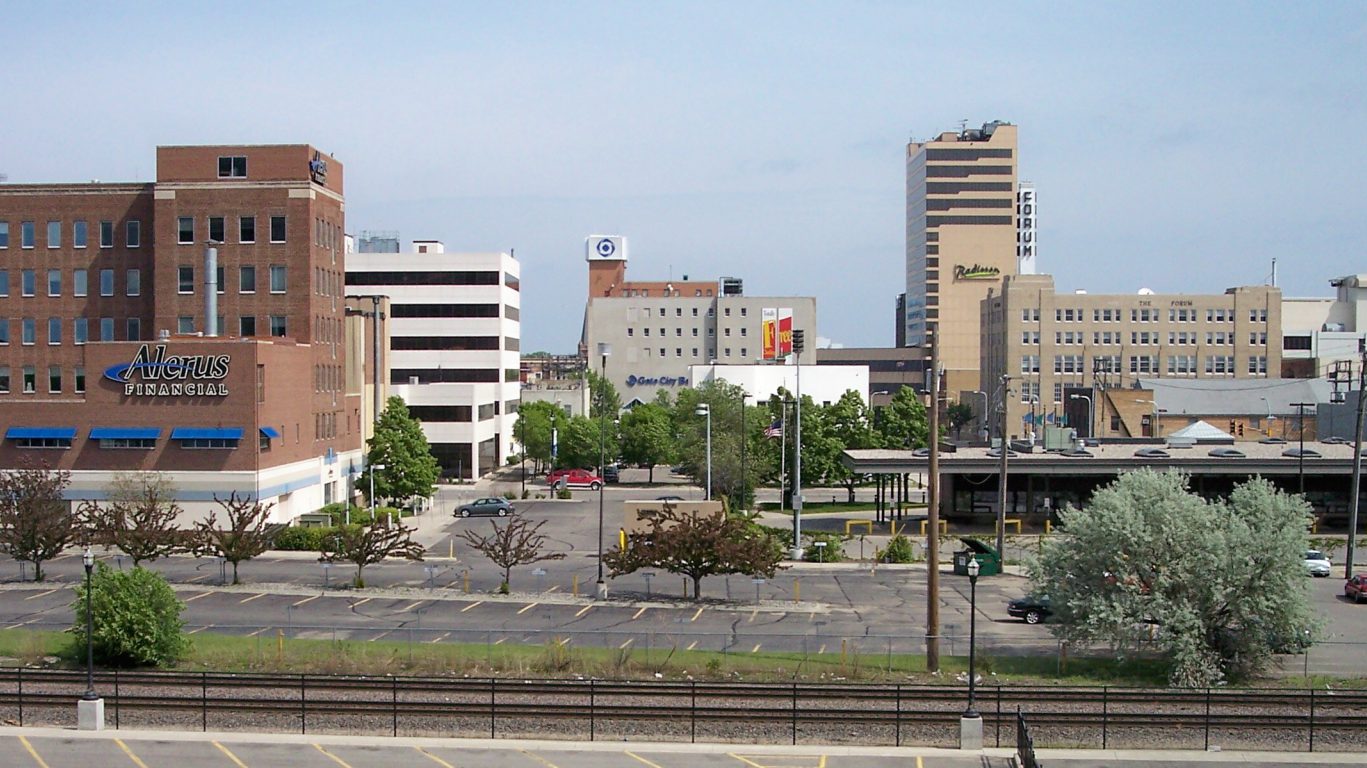
44. Fargo, ND-MN
> Employment increase: 10.6%
> No. of jobs June 2012: 120,224
> No. of jobs June 2016: 132,977
> Unemployment rate June 2016: 2.5%

43. College Station-Bryan, TX
> Employment increase: 10.6%
> No. of jobs June 2012: 108,859
> No. of jobs June 2016: 120,432
> Unemployment rate June 2016: 3.4%
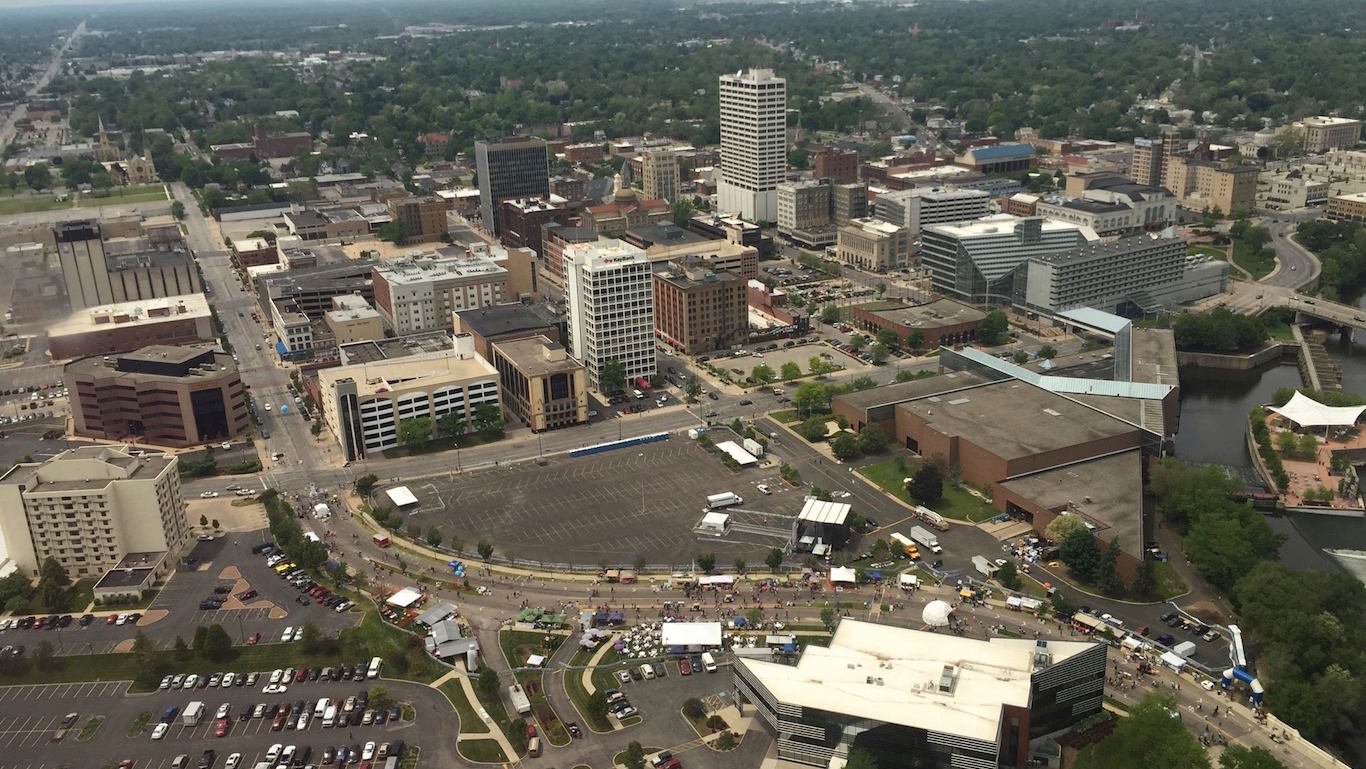
42. South Bend-Mishawaka, IN-MI
> Employment increase: 10.8%
> No. of jobs June 2012: 137,175
> No. of jobs June 2016: 152,037
> Unemployment rate June 2016: 4.5%
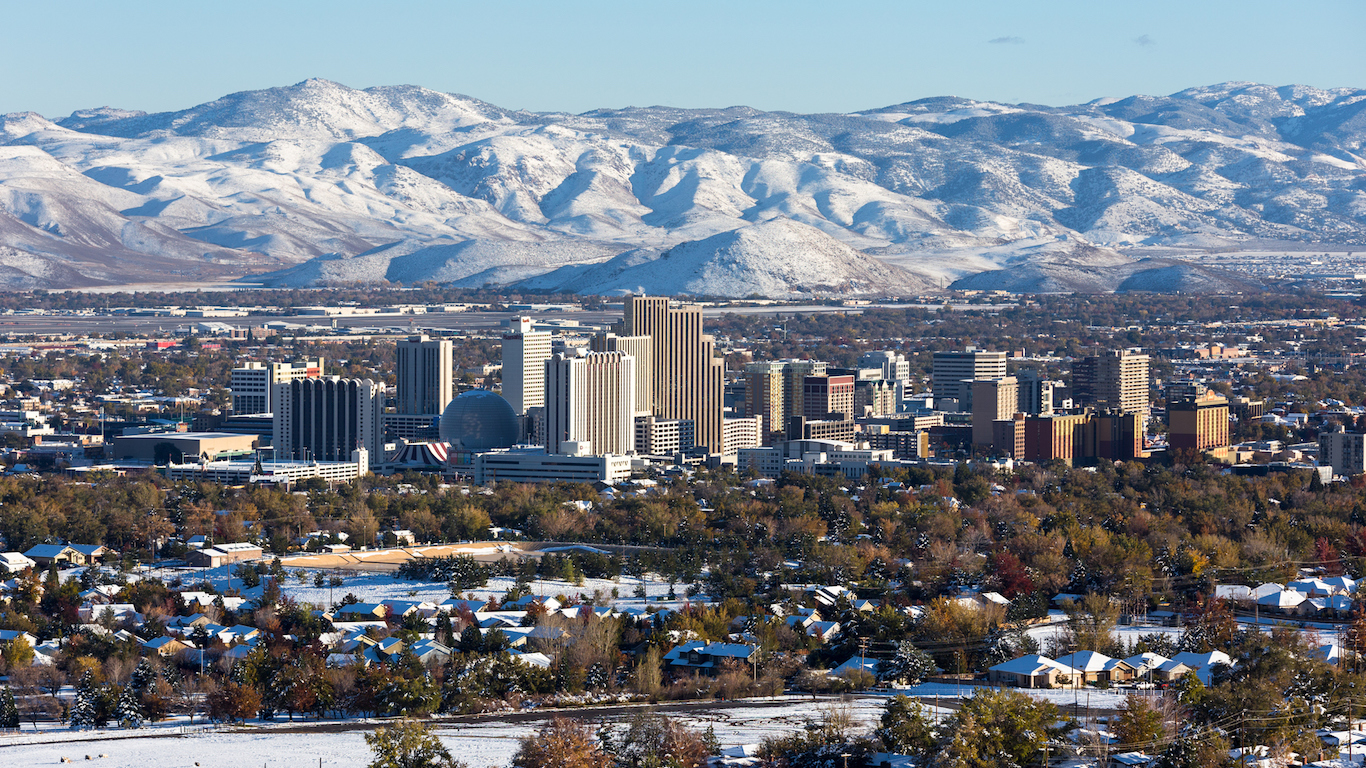
41. Reno, NV
> Employment increase: 10.9%
> No. of jobs June 2012: 198,375
> No. of jobs June 2016: 220,082
> Unemployment rate June 2016: 5.8%
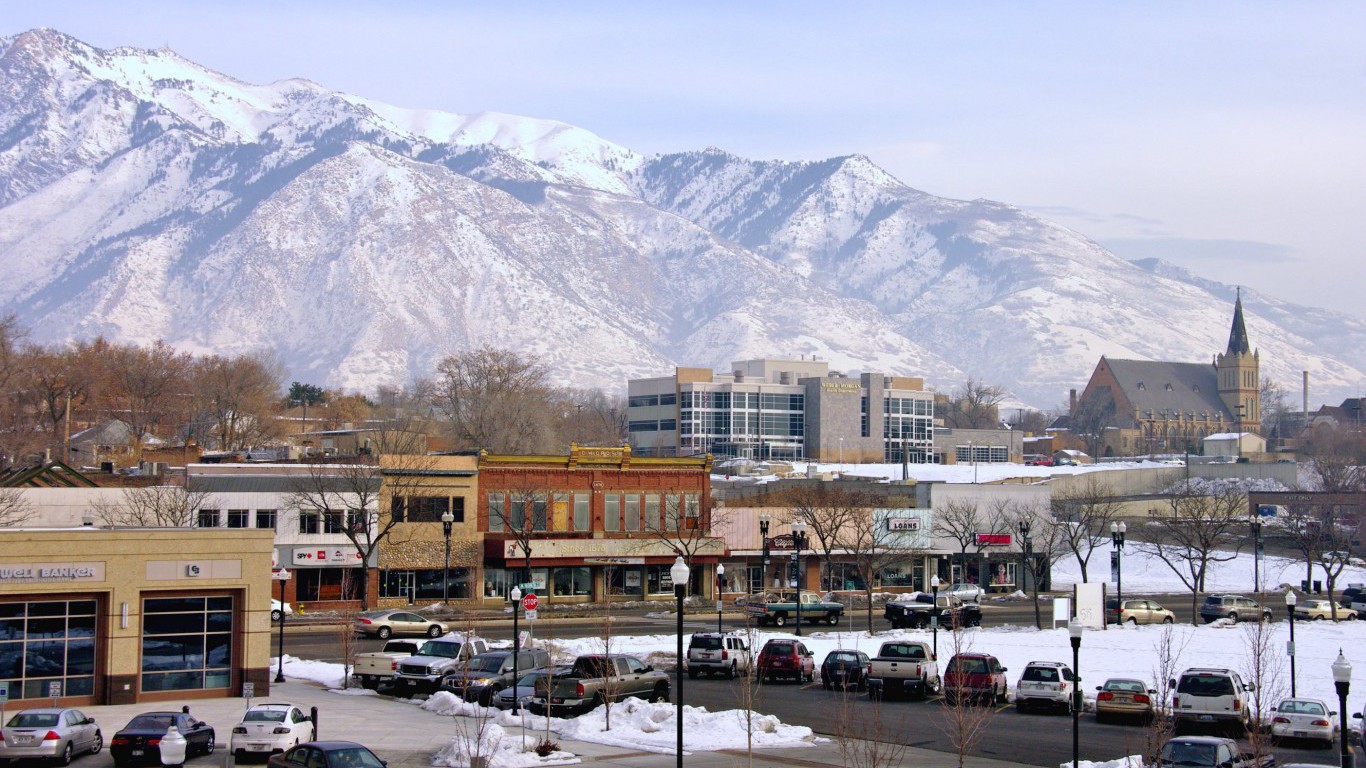
40. Ogden-Clearfield, UT
> Employment increase: 11.0%
> No. of jobs June 2012: 273,023
> No. of jobs June 2016: 303,064
> Unemployment rate June 2016: 3.9%
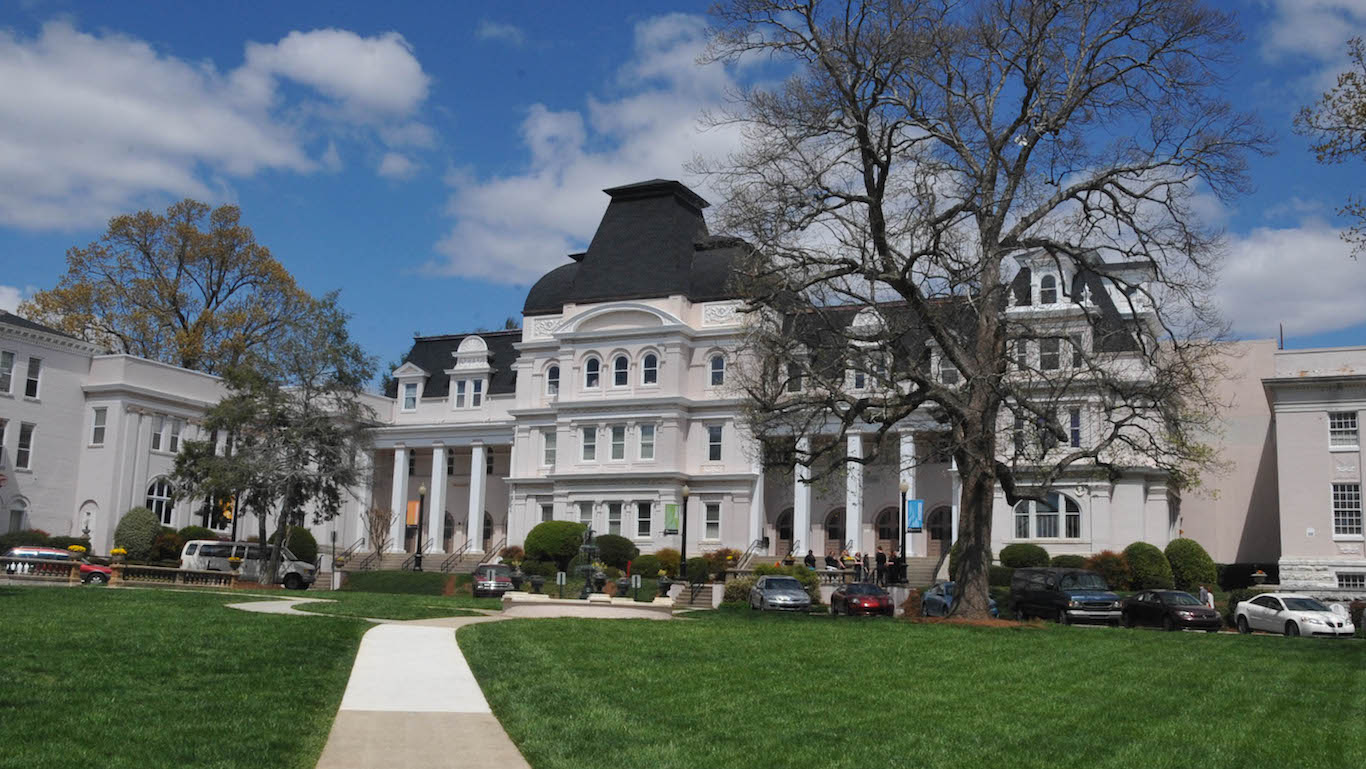
39. Gainesville, GA
> Employment increase: 11.1%
> No. of jobs June 2012: 82,324
> No. of jobs June 2016: 91,487
> Unemployment rate June 2016: 4.2%
 24/7 Wall St.
38. Las Vegas-Henderson-Paradise, NV
> Employment increase: 11.1%
> No. of jobs June 2012: 887,838
> No. of jobs June 2016: 986,816
> Unemployment rate June 2016: 6.8%
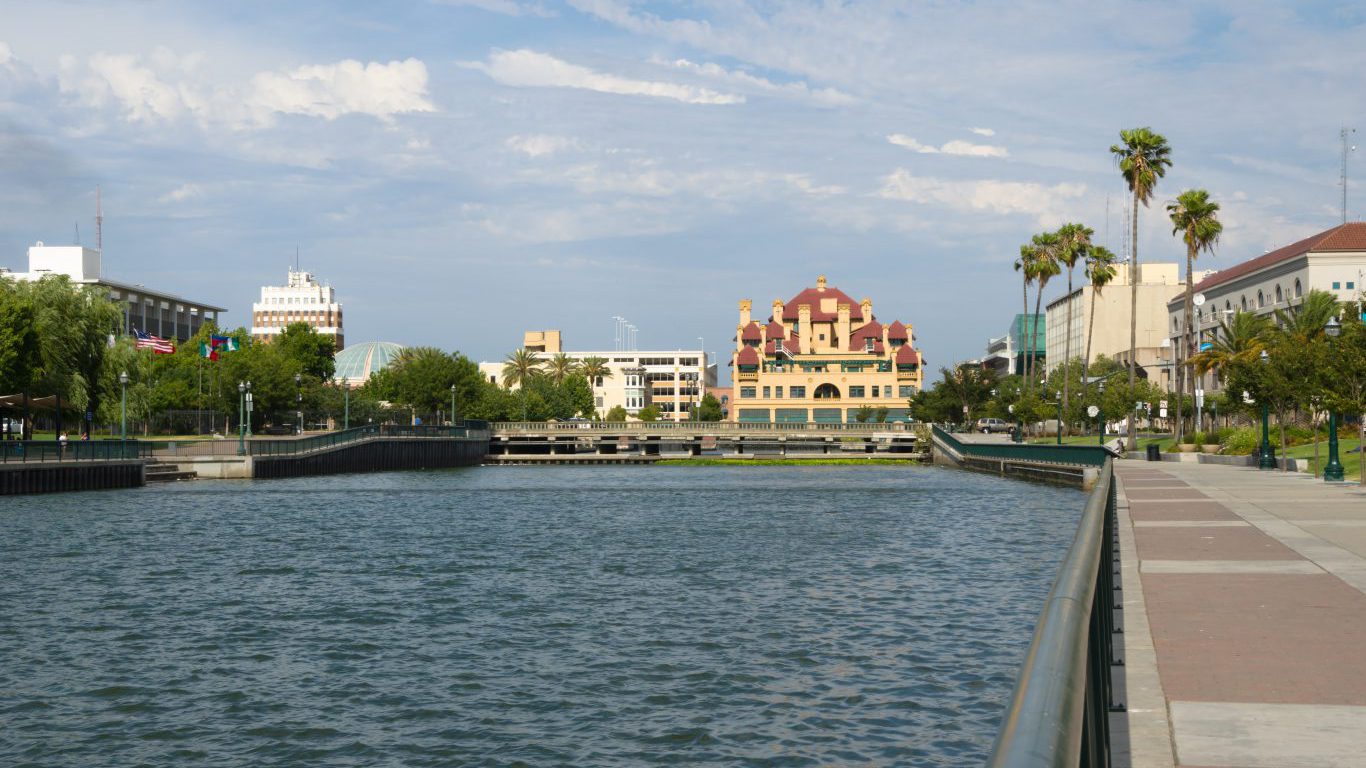
37. Stockton-Lodi, CA
> Employment increase: 11.2%
> No. of jobs June 2012: 266,107
> No. of jobs June 2016: 295,786
> Unemployment rate June 2016: 8.3%

36. Dallas-Fort Worth-Arlington, TX
> Employment increase: 11.2%
> No. of jobs June 2012: 3,189,674
> No. of jobs June 2016: 3,545,745
> Unemployment rate June 2016: 3.6%
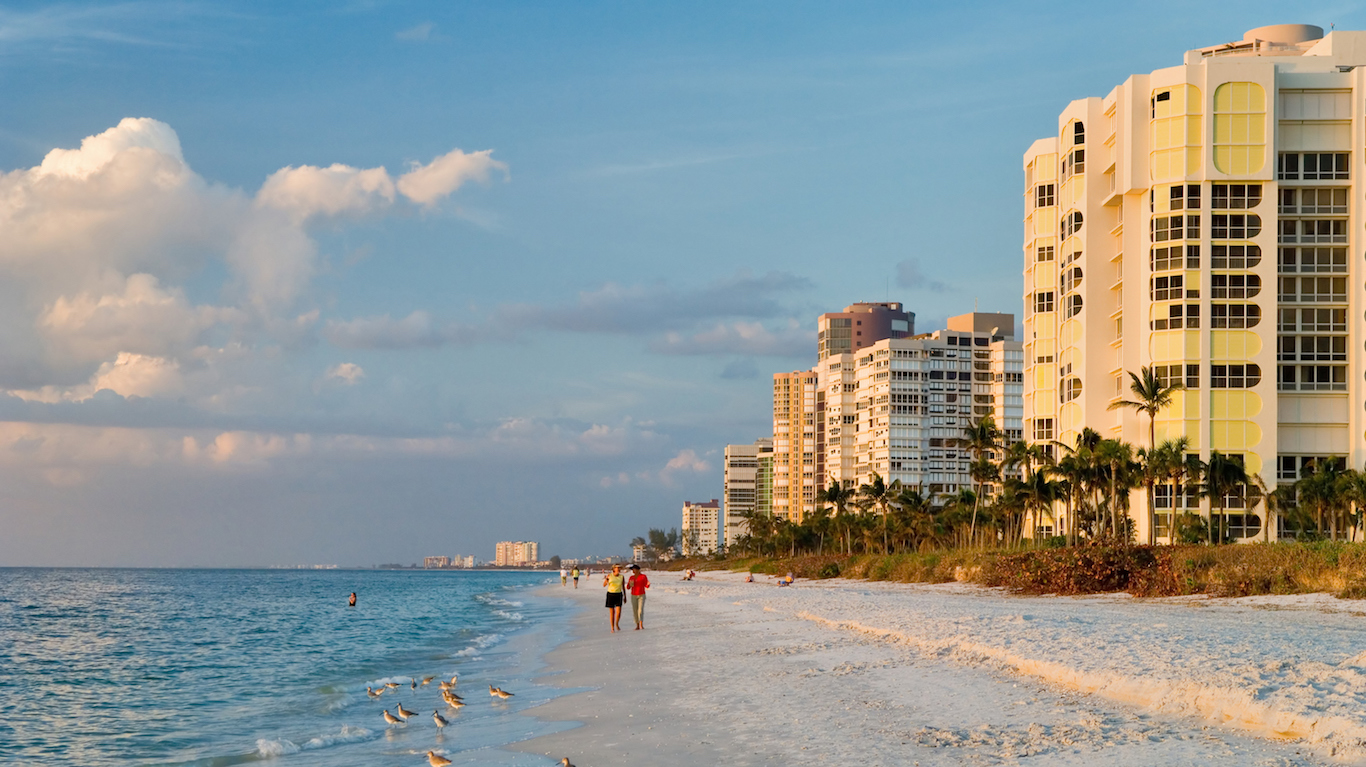
35. Naples-Immokalee-Marco Island, FL
> Employment increase: 11.2%
> No. of jobs June 2012: 139,638
> No. of jobs June 2016: 155,284
> Unemployment rate June 2016: 4.5%
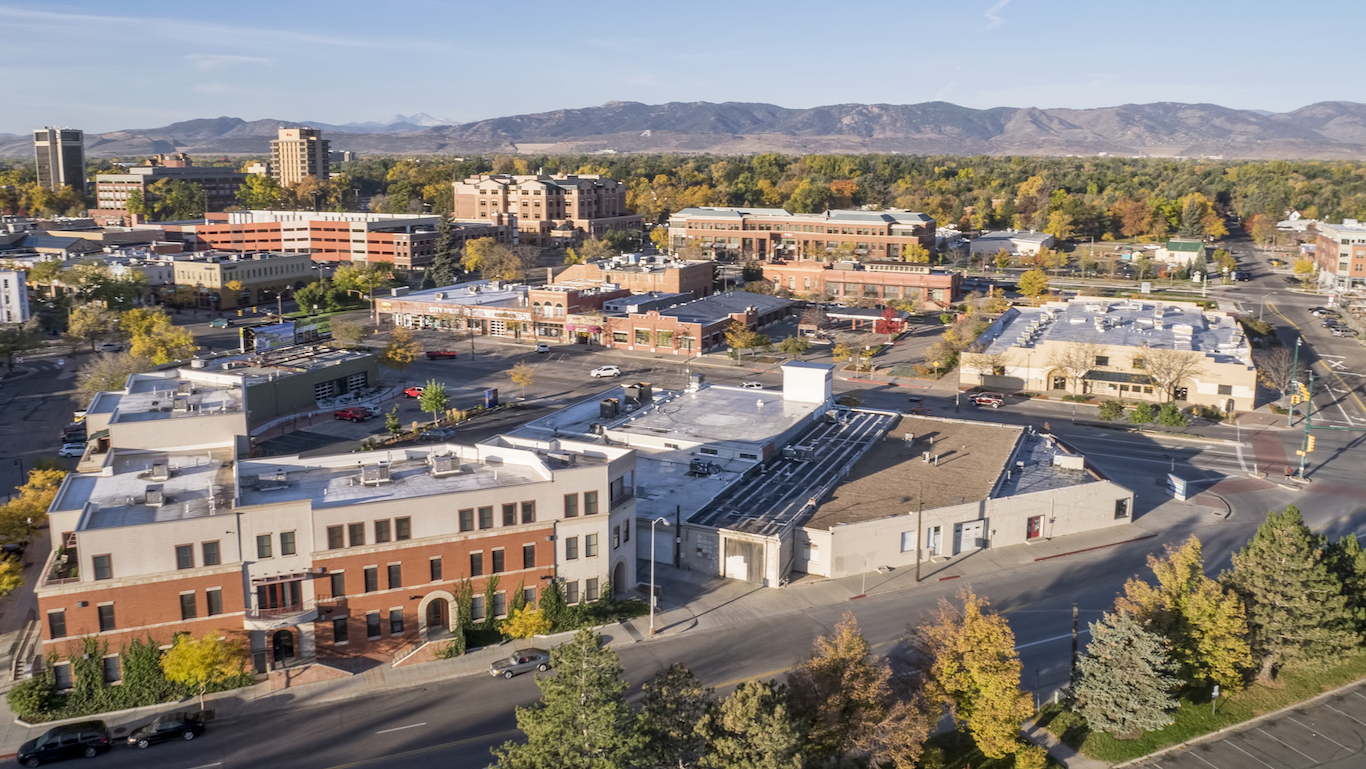
34. Fort Collins, CO
> Employment increase: 11.3%
> No. of jobs June 2012: 161,042
> No. of jobs June 2016: 179,258
> Unemployment rate June 2016: 3.2%

33. Nashville-Davidson–Murfreesboro–Franklin, TN
> Employment increase: 11.3%
> No. of jobs June 2012: 841,201
> No. of jobs June 2016: 936,463
> Unemployment rate June 2016: 3.5%

32. Phoenix-Mesa-Scottsdale, AZ
> Employment increase: 11.5%
> No. of jobs June 2012: 1,892,337
> No. of jobs June 2016: 2,109,566
> Unemployment rate June 2016: 5.1%
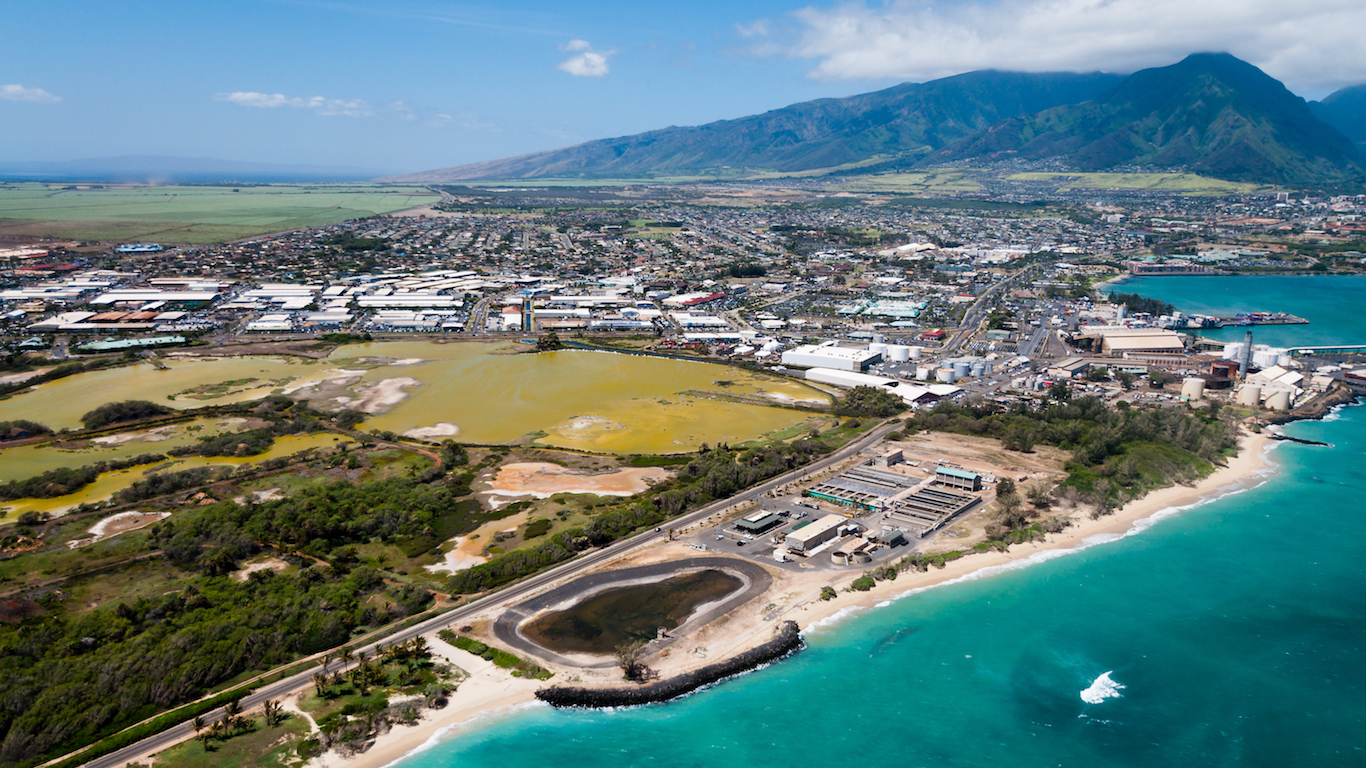
31. Kahului-Wailuku-Lahaina, HI
> Employment increase: 11.5%
> No. of jobs June 2012: 73,855
> No. of jobs June 2016: 82,349
> Unemployment rate June 2016: 3.5%

30. Lafayette-West Lafayette, IN
> Employment increase: 11.5%
> No. of jobs June 2012: 95,832
> No. of jobs June 2016: 106,857
> Unemployment rate June 2016: 4.0%

29. Charleston-North Charleston, SC
> Employment increase: 11.6%
> No. of jobs June 2012: 316,755
> No. of jobs June 2016: 353,427
> Unemployment rate June 2016: 4.4%
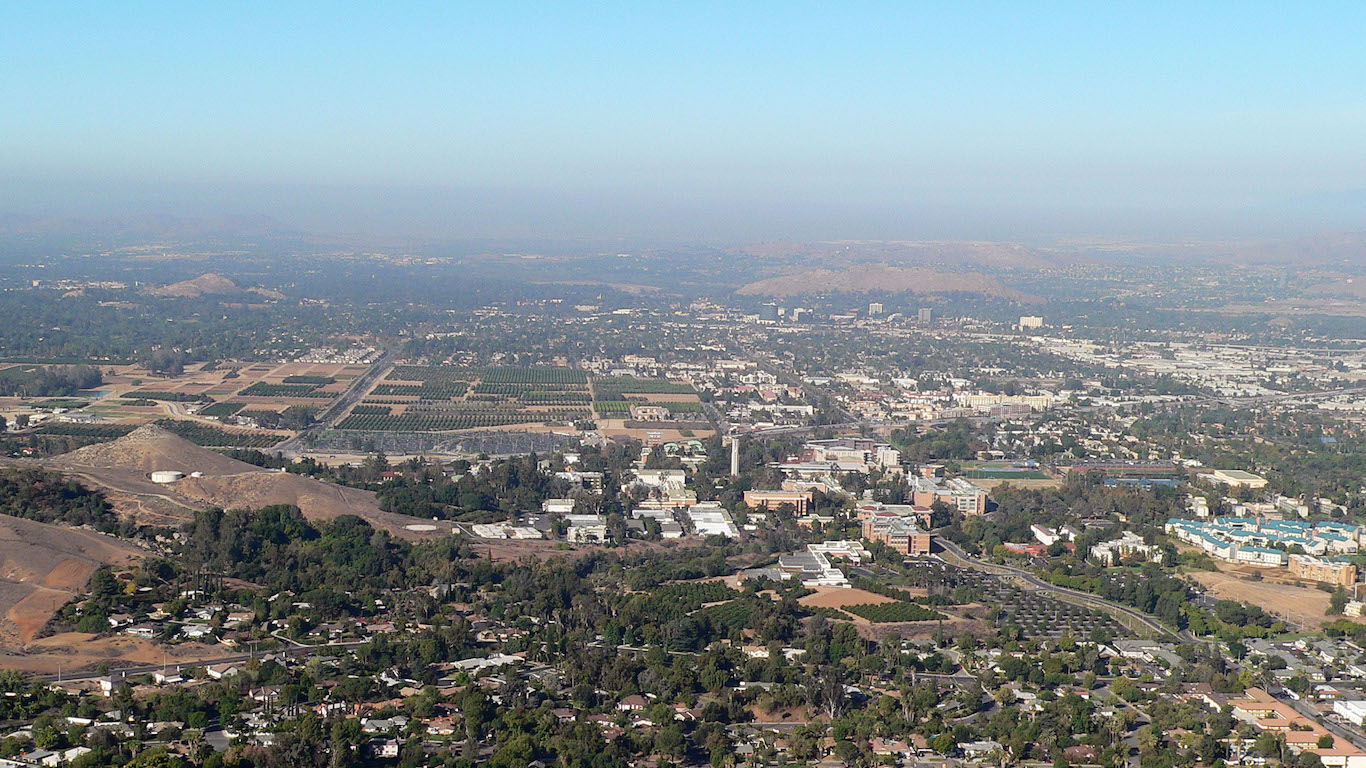
28. Riverside-San Bernardino-Ontario, CA
> Employment increase: 11.6%
> No. of jobs June 2012: 1,659,676
> No. of jobs June 2016: 1,852,895
> Unemployment rate June 2016: 6.2%

27. Denver-Aurora-Lakewood, CO
> Employment increase: 11.7%
> No. of jobs June 2012: 1,332,802
> No. of jobs June 2016: 1,488,539
> Unemployment rate June 2016: 3.6%

26. Baton Rouge, LA
> Employment increase: 11.7%
> No. of jobs June 2012: 364,027
> No. of jobs June 2016: 406,636
> Unemployment rate June 2016: 5.2%
25. Kokomo, IN
> Employment increase: 11.8%
> No. of jobs June 2012: 32,585
> No. of jobs June 2016: 36,420
> Unemployment rate June 2016: 4.8%

24. Fort Wayne, IN
> Employment increase: 11.9%
> No. of jobs June 2012: 186,675
> No. of jobs June 2016: 208,888
> Unemployment rate June 2016: 4.3%

23. Santa Rosa, CA
> Employment increase: 12.0%
> No. of jobs June 2012: 224,387
> No. of jobs June 2016: 251,357
> Unemployment rate June 2016: 4.1%

22. Boise City, ID
> Employment increase: 12.2%
> No. of jobs June 2012: 284,846
> No. of jobs June 2016: 319,645
> Unemployment rate June 2016: 3.7%
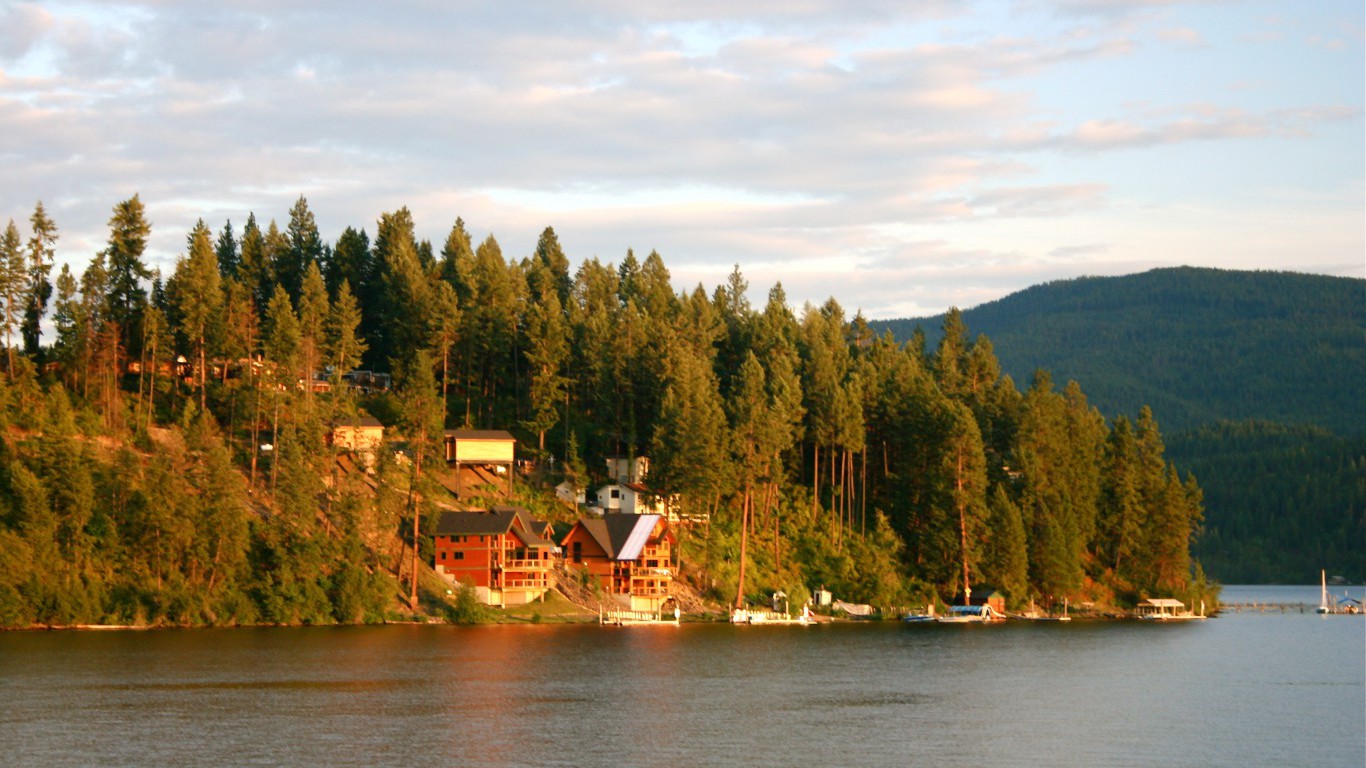
21. Coeur d’Alene, ID
> Employment increase: 12.8%
> No. of jobs June 2012: 62,213
> No. of jobs June 2016: 70,179
> Unemployment rate June 2016: 4.7%
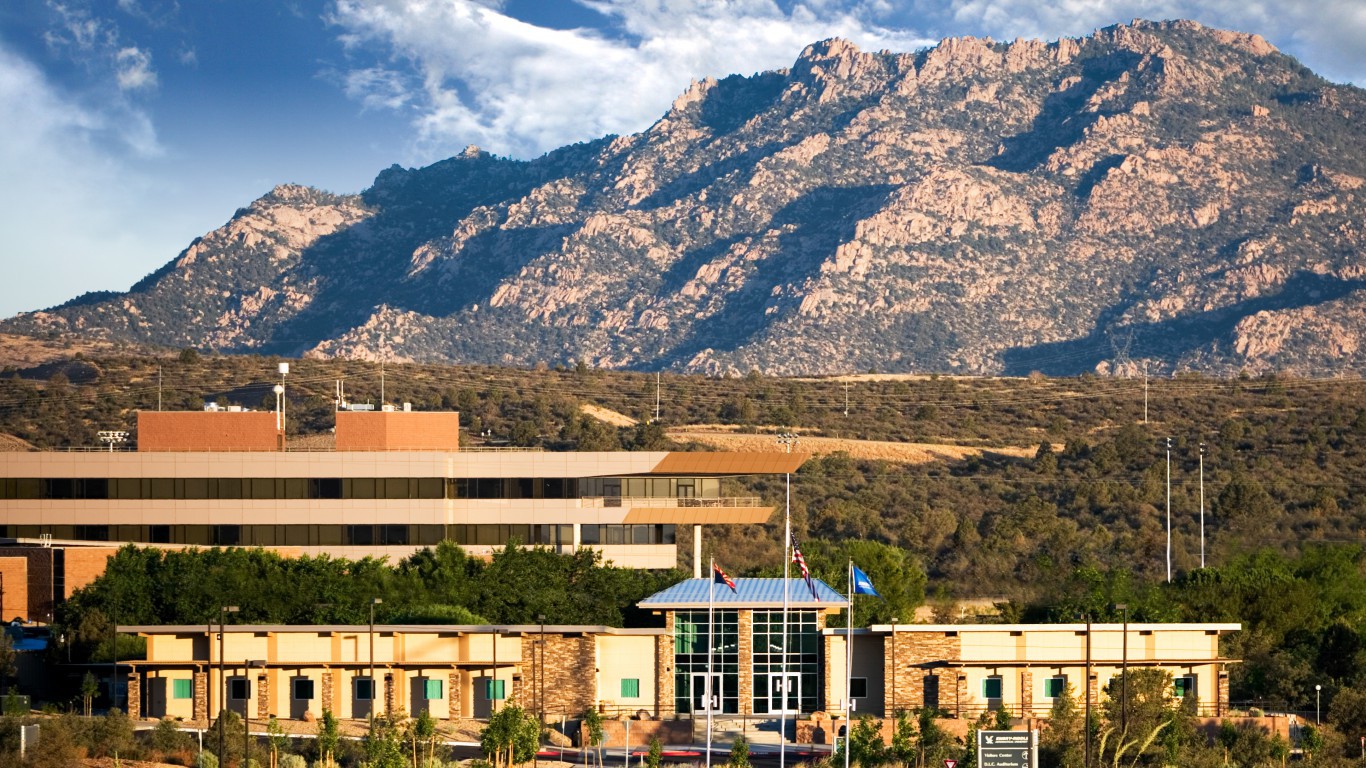
20. Prescott, AZ
> Employment increase: 13.0%
> No. of jobs June 2012: 84,991
> No. of jobs June 2016: 96,003
> Unemployment rate June 2016: 5.2%

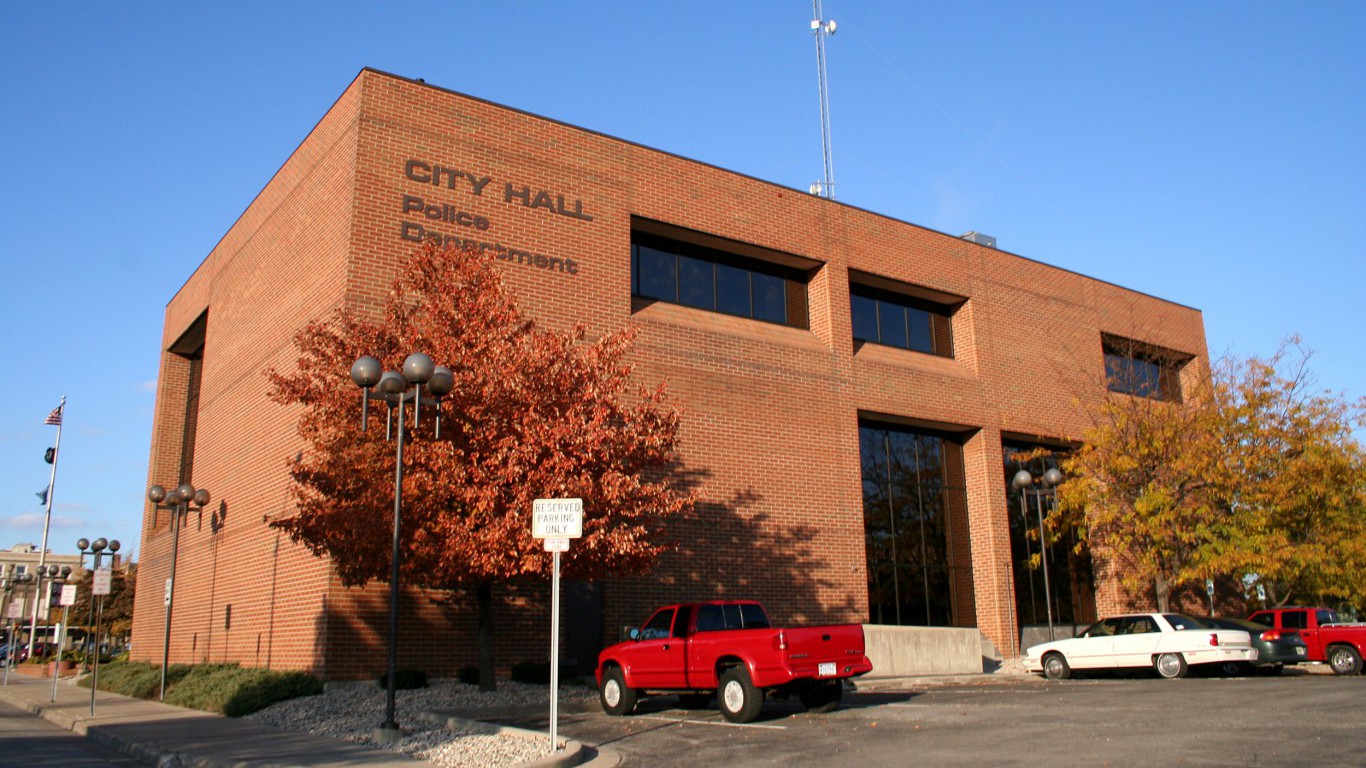
19. Columbus, IN
> Employment increase: 13.0%
> No. of jobs June 2012: 38,842
> No. of jobs June 2016: 43,889
> Unemployment rate June 2016: 3.4%
 24/7 Wall St.
18. Orlando-Kissimmee-Sanford, FL
> Employment increase: 13.1%
> No. of jobs June 2012: 1,061,241
> No. of jobs June 2016: 1,199,855
> Unemployment rate June 2016: 4.3%

17. Indianapolis-Carmel-Anderson, IN
> Employment increase: 13.2%
> No. of jobs June 2012: 882,399
> No. of jobs June 2016: 998,653
> Unemployment rate June 2016: 4.1%

16. San Jose-Sunnyvale-Santa Clara, CA
> Employment increase: 13.2%
> No. of jobs June 2012: 905,627
> No. of jobs June 2016: 1,025,158
> Unemployment rate June 2016: 3.9%

15. Grand Rapids-Wyoming, MI
> Employment increase: 13.3%
> No. of jobs June 2012: 481,718
> No. of jobs June 2016: 545,839
> Unemployment rate June 2016: 2.9%
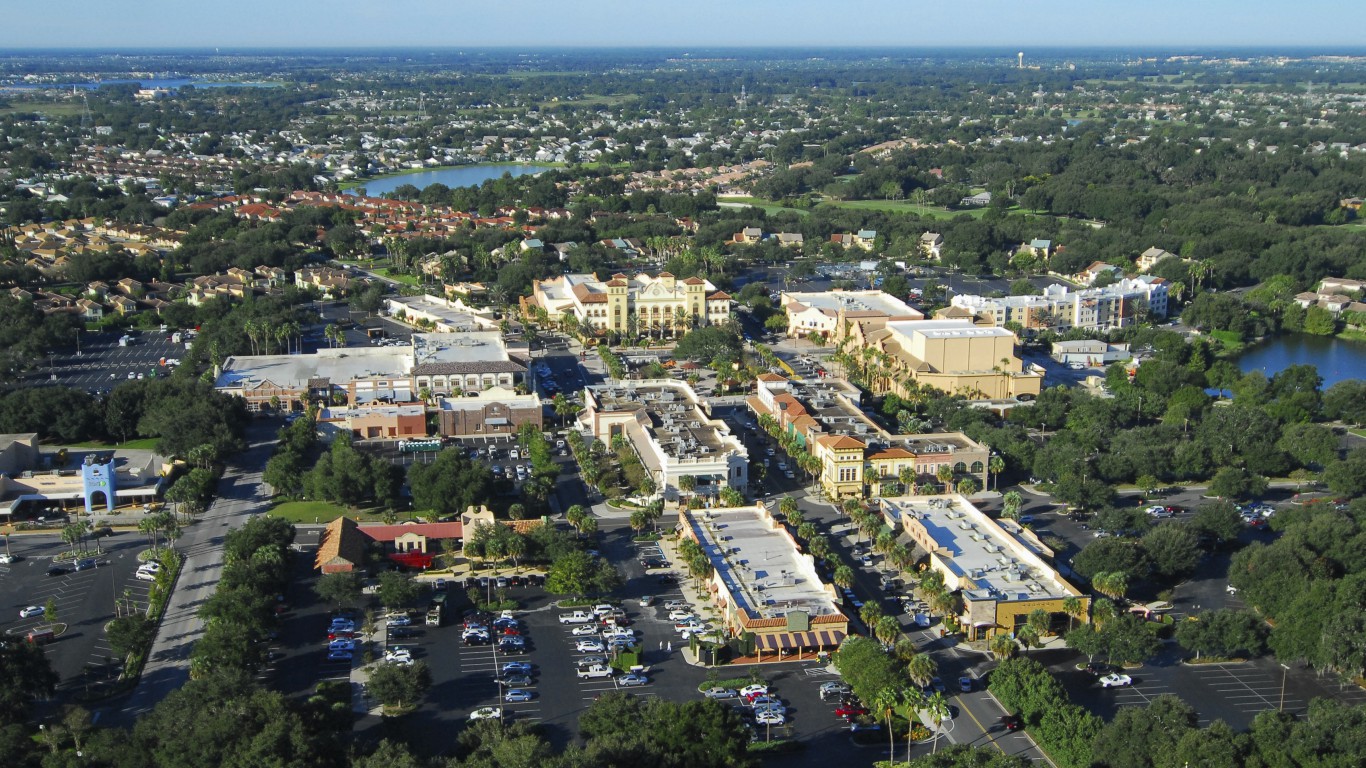
14. The Villages, FL
> Employment increase: 13.3%
> No. of jobs June 2012: 23,898
> No. of jobs June 2016: 27,081
> Unemployment rate June 2016: 6.4%
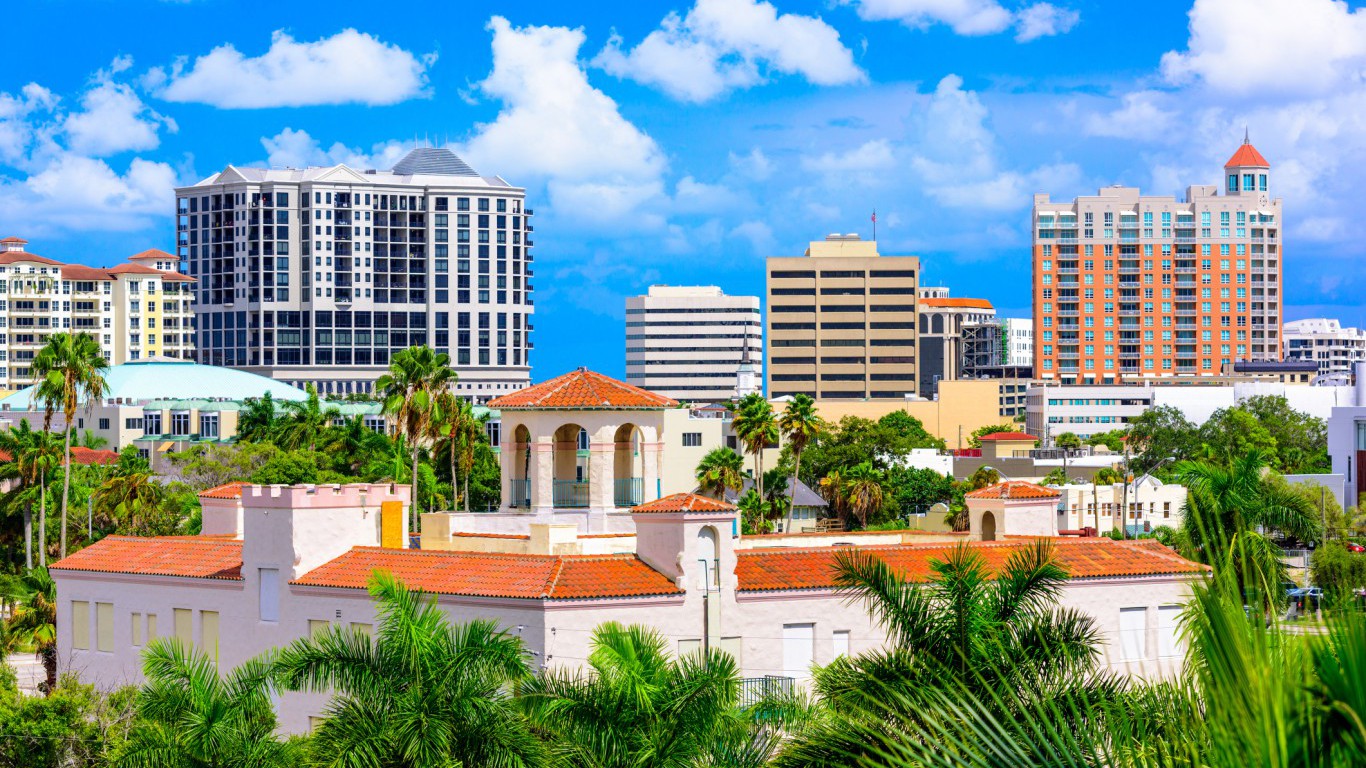
13. North Port-Sarasota-Bradenton, FL
> Employment increase: 13.5%
> No. of jobs June 2012: 291,128
> No. of jobs June 2016: 330,540
> Unemployment rate June 2016: 4.3%

12. Charlotte-Concord-Gastonia, NC-SC
> Employment increase: 13.8%
> No. of jobs June 2012: 1,061,344
> No. of jobs June 2016: 1,208,076
> Unemployment rate June 2016: 4.6%
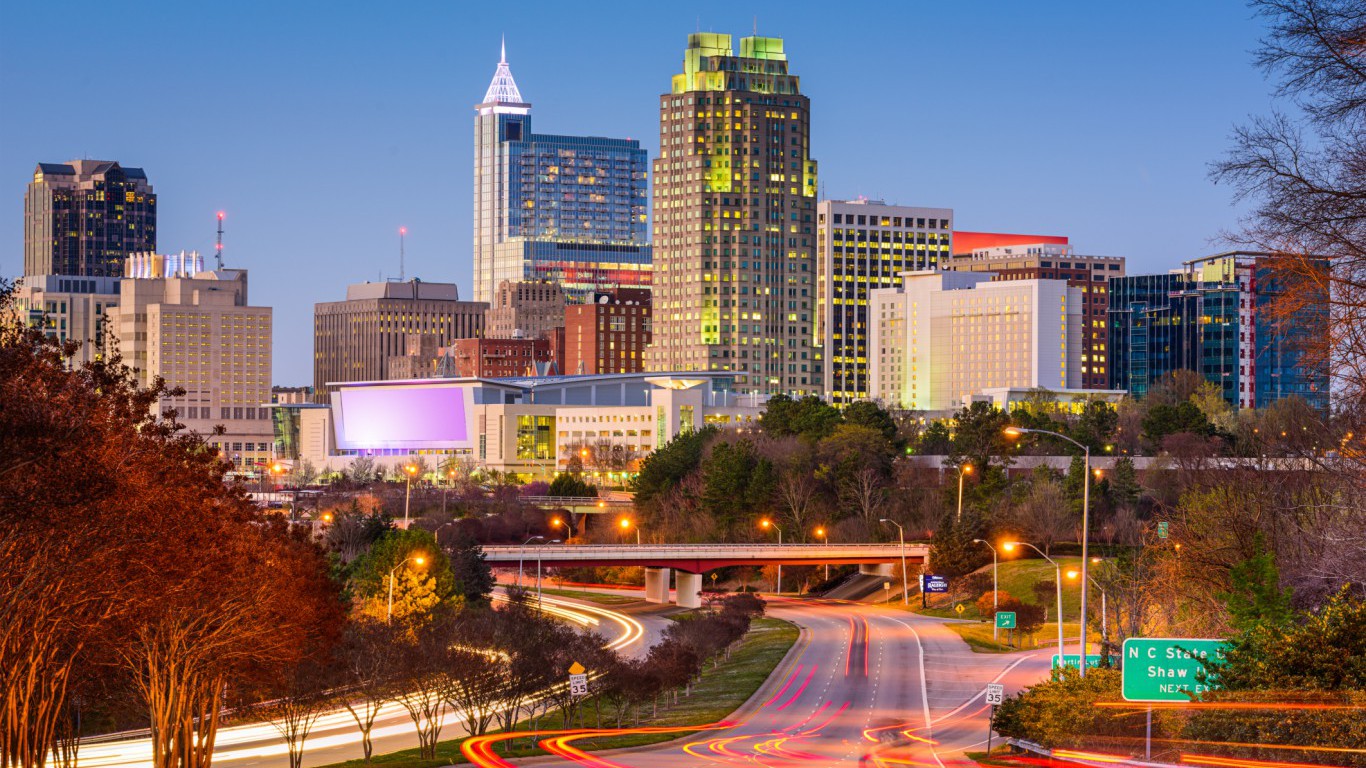
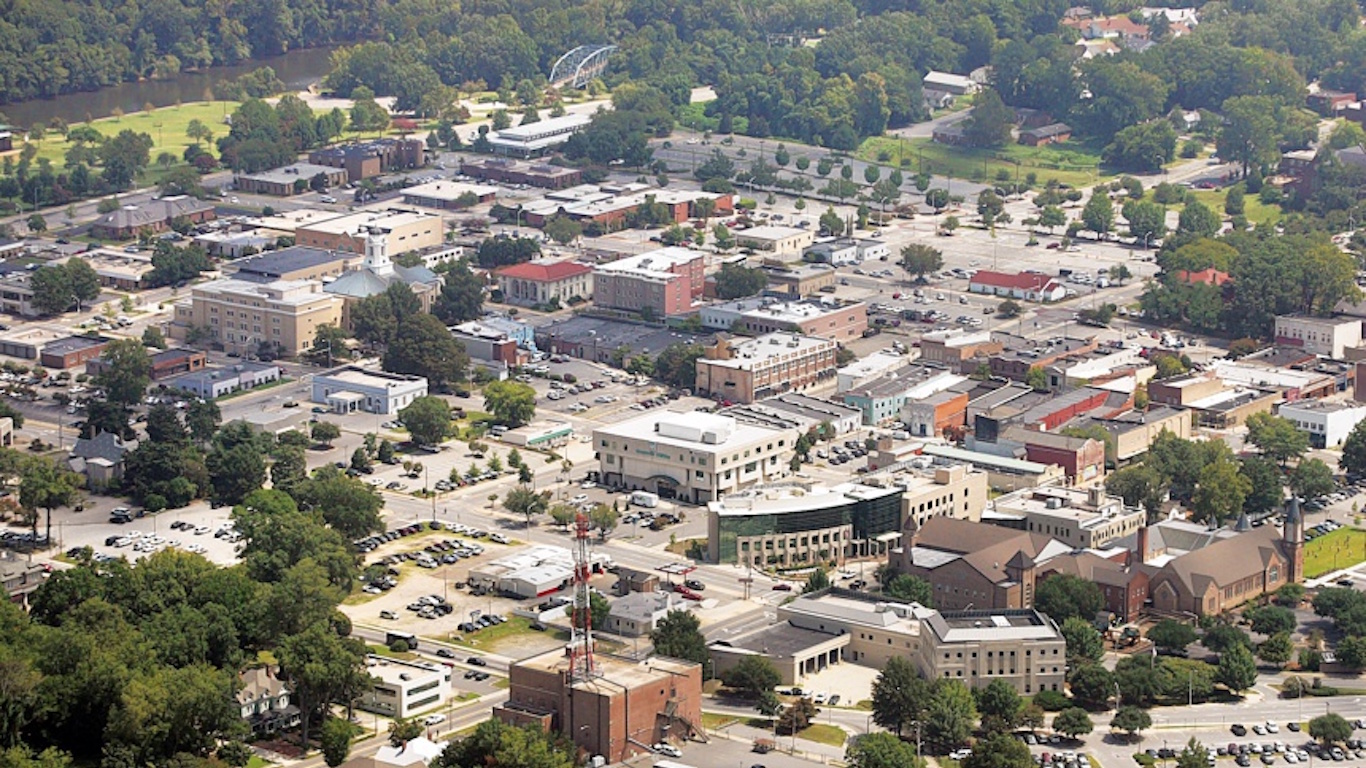
11. Raleigh, NC
> Employment increase: 14.0%
> No. of jobs June 2012: 567,716
> No. of jobs June 2016: 646,973
> Unemployment rate June 2016: 4.1%
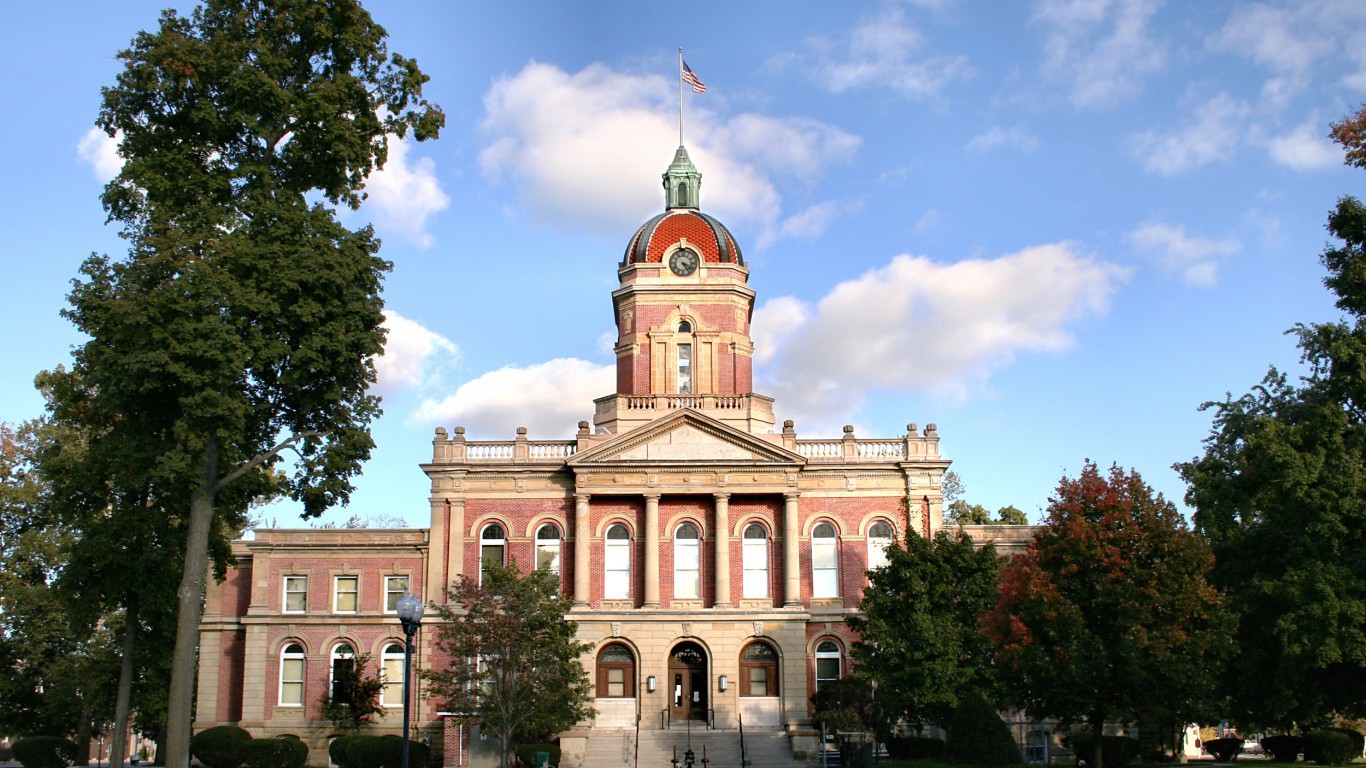
10. Elkhart-Goshen, IN
> Employment increase: 14.0%
> No. of jobs June 2012: 87,822
> No. of jobs June 2016: 100,121
> Unemployment rate June 2016: 3.9%

9. Austin-Round Rock, TX
> Employment increase: 15.3%
> No. of jobs June 2012: 927,855
> No. of jobs June 2016: 1,070,211
> Unemployment rate June 2016: 3.0%

8. Hilton Head Island-Bluffton-Beaufort, SC
> Employment increase: 15.7%
> No. of jobs June 2012: 70,568
> No. of jobs June 2016: 81,649
> Unemployment rate June 2016: 4.8%

7. Greeley, CO
> Employment increase: 15.9%
> No. of jobs June 2012: 126,155
> No. of jobs June 2016: 146,157
> Unemployment rate June 2016: 4.0%
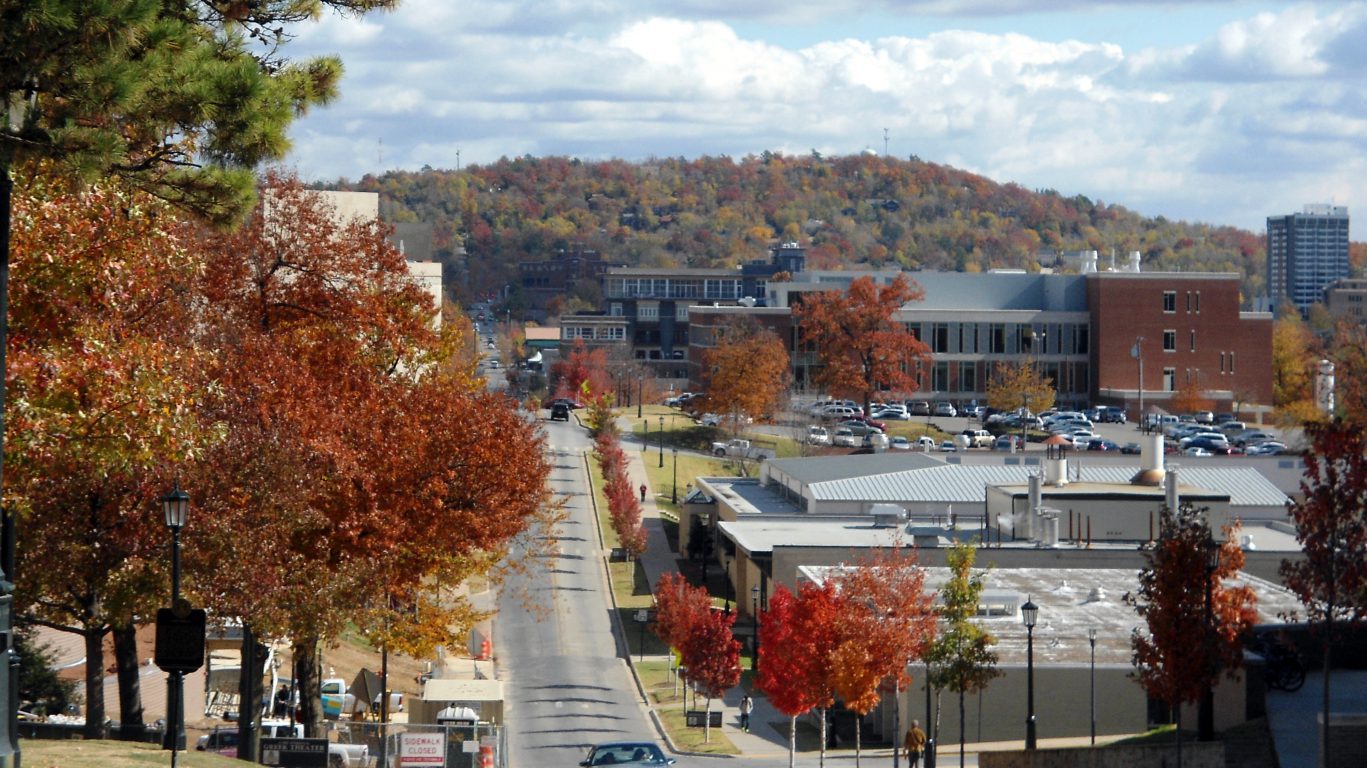
6. Fayetteville-Springdale-Rogers, AR-MO
> Employment increase: 16.4%
> No. of jobs June 2012: 219,754
> No. of jobs June 2016: 255,839
> Unemployment rate June 2016: 2.8%
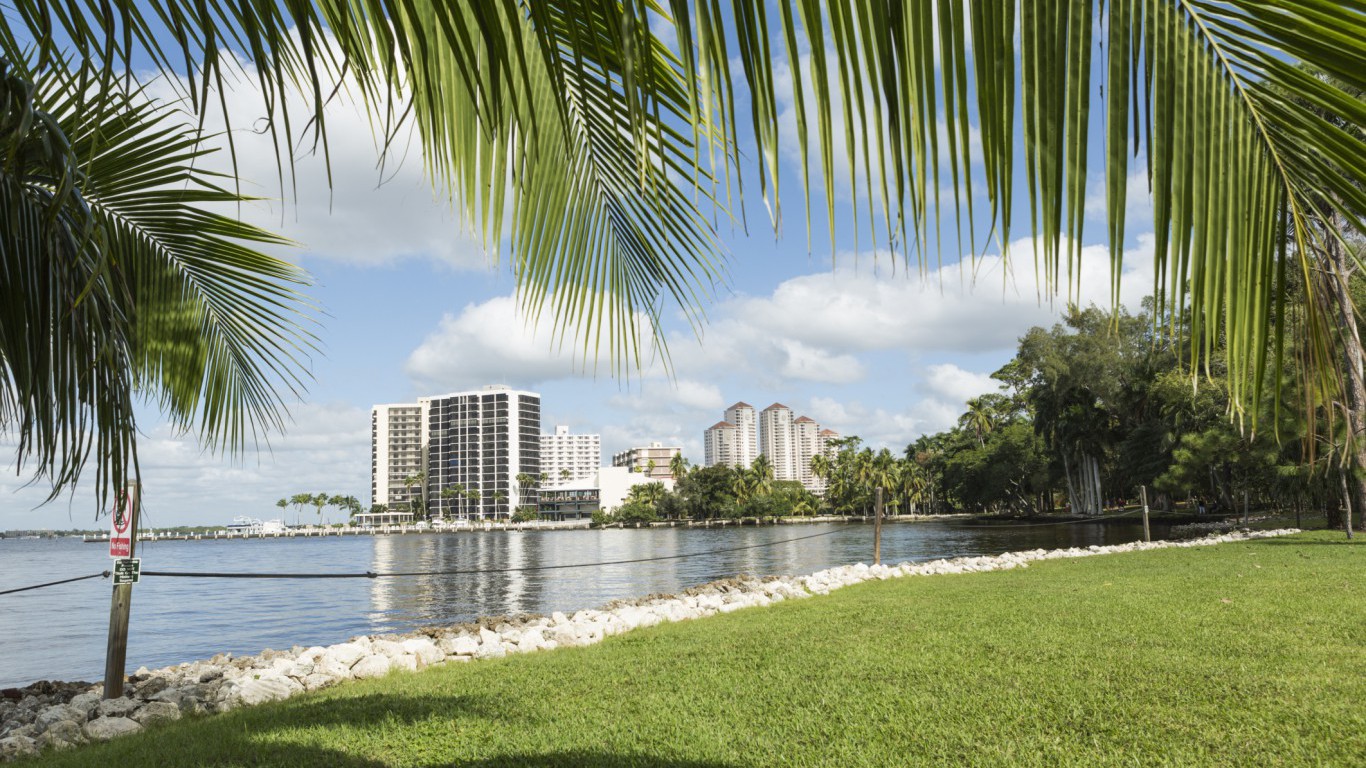
5. Cape Coral-Fort Myers, FL
> Employment increase: 16.9%
> No. of jobs June 2012: 266,443
> No. of jobs June 2016: 311,432
> Unemployment rate June 2016: 4.3%
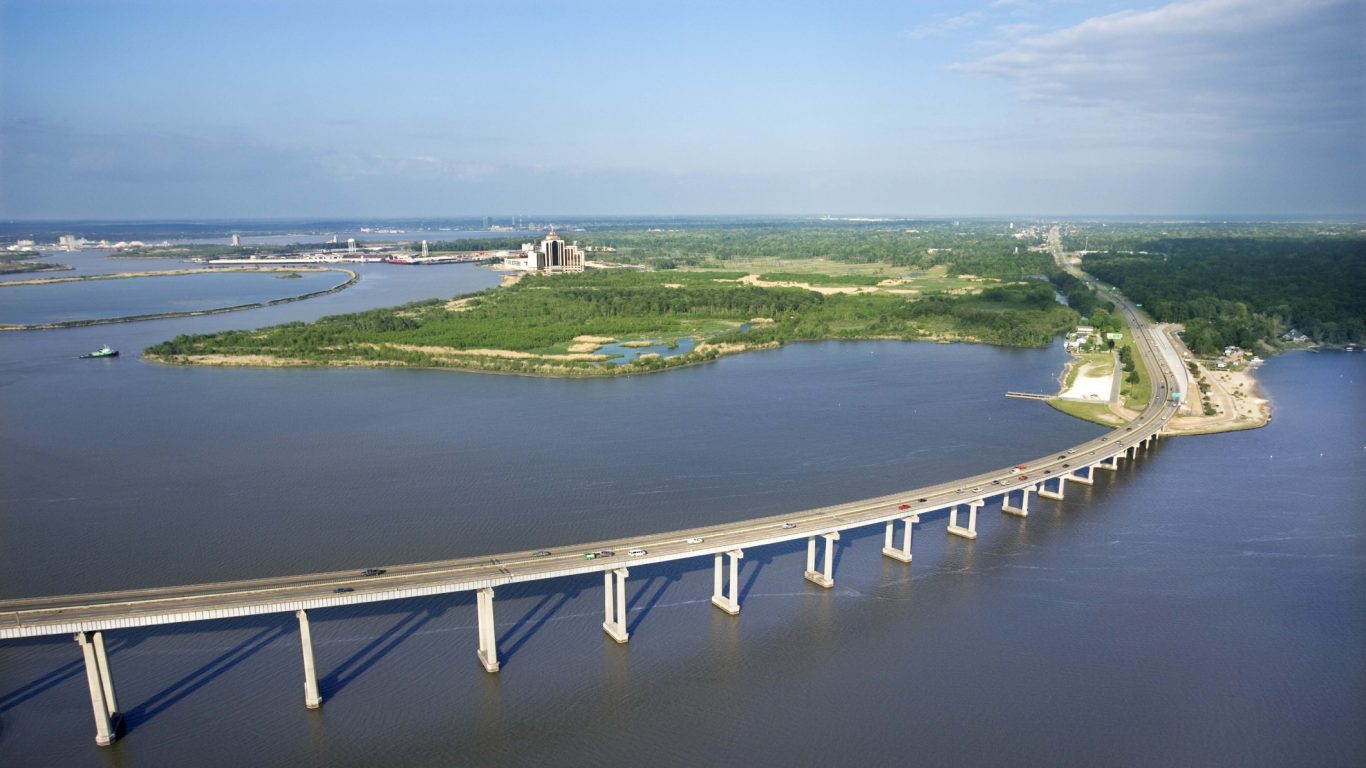
4. Lake Charles, LA
> Employment increase: 16.9%
> No. of jobs June 2012: 84,767
> No. of jobs June 2016: 99,089
> Unemployment rate June 2016: 4.9%

3. Provo-Orem, UT
> Employment increase: 17.3%
> No. of jobs June 2012: 231,089
> No. of jobs June 2016: 271,176
> Unemployment rate June 2016: 3.5%
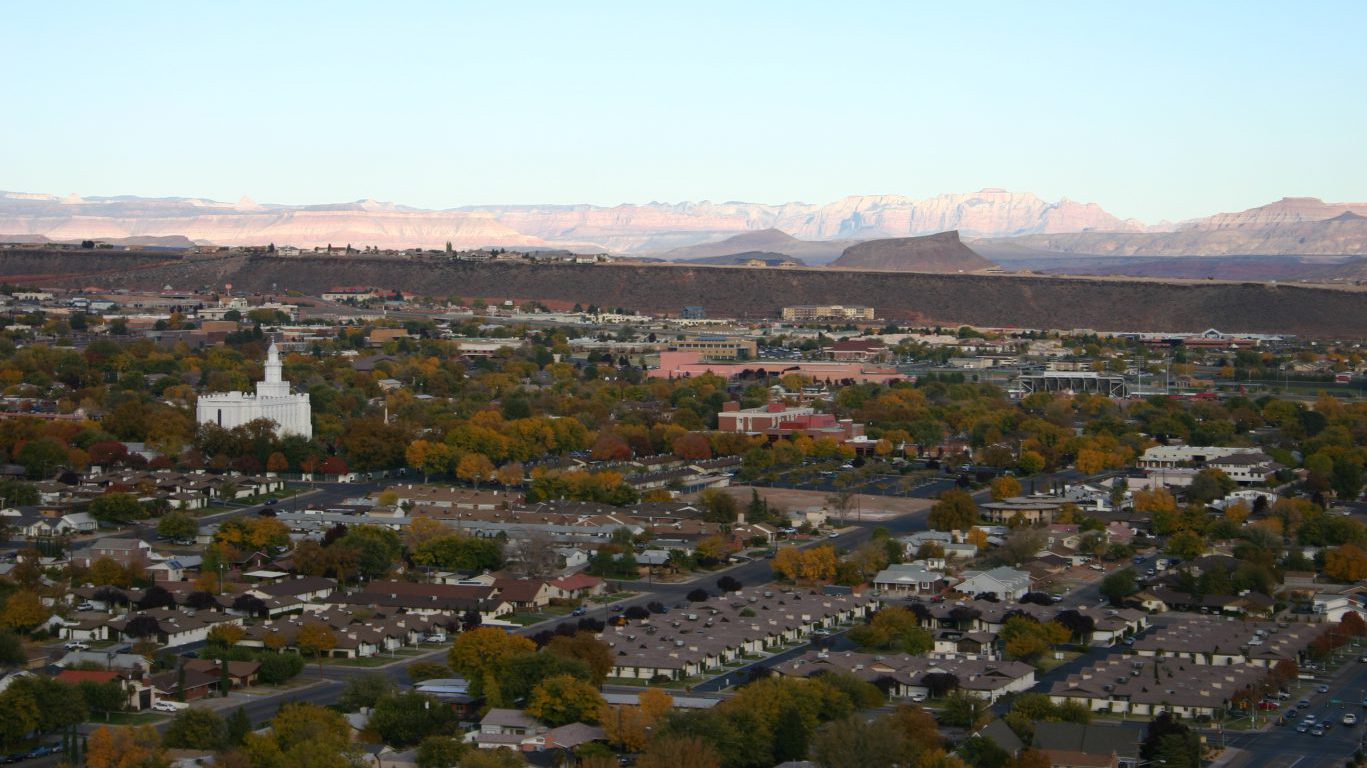
2. St. George, UT
> Employment increase: 20.4%
> No. of jobs June 2012: 53,115
> No. of jobs June 2016: 63,945
> Unemployment rate June 2016: 4.2%
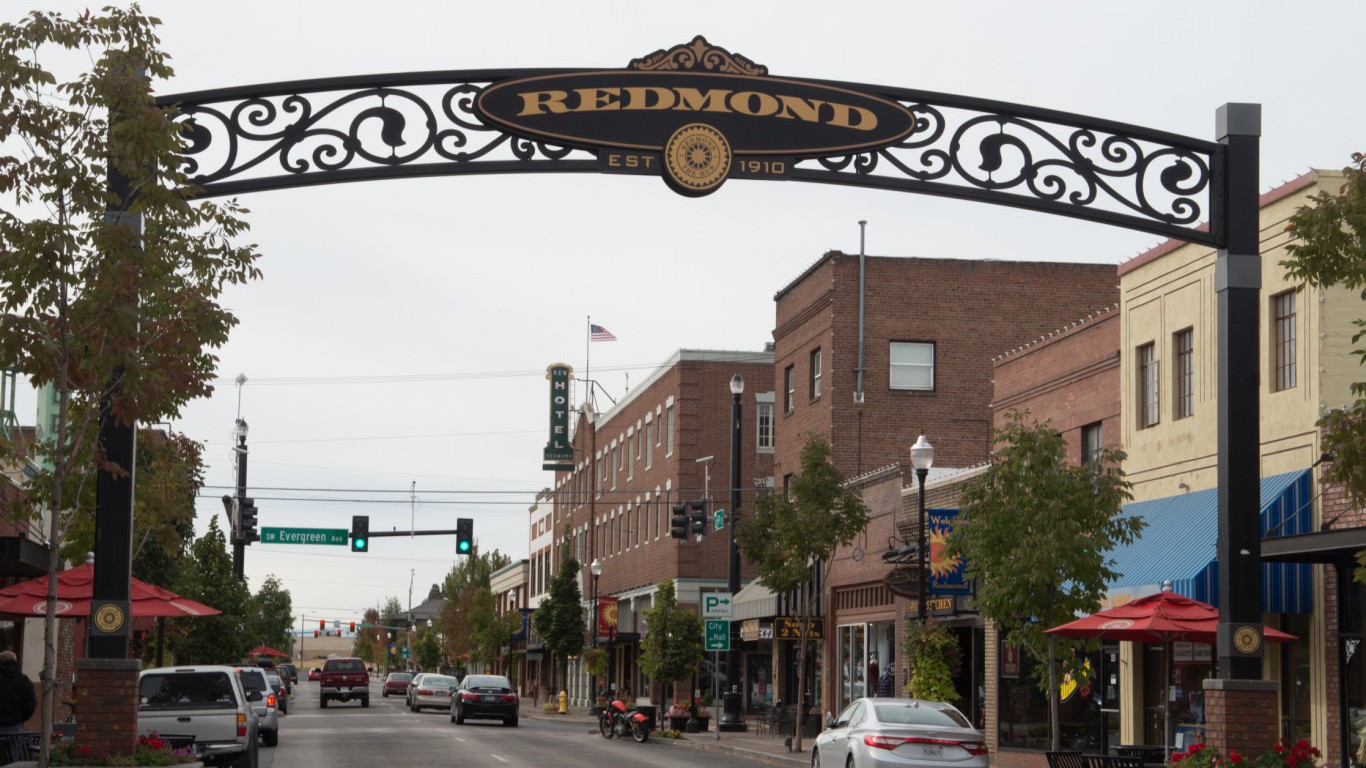
1. Bend-Redmond, OR
> Employment increase: 20.9%
> No. of jobs June 2012: 69,848
> No. of jobs June 2016: 84,478
> Unemployment rate June 2016: 5.2%
Are You Still Paying With a Debit Card?
The average American spends $17,274 on debit cards a year, and it’s a HUGE mistake. First, debit cards don’t have the same fraud protections as credit cards. Once your money is gone, it’s gone. But more importantly you can actually get something back from this spending every time you swipe.
Issuers are handing out wild bonuses right now. With some you can earn up to 5% back on every purchase. That’s like getting a 5% discount on everything you buy!
Our top pick is kind of hard to imagine. Not only does it pay up to 5% back, it also includes a $200 cash back reward in the first six months, a 0% intro APR, and…. $0 annual fee. It’s quite literally free money for any one that uses a card regularly. Click here to learn more!
Flywheel Publishing has partnered with CardRatings to provide coverage of credit card products. Flywheel Publishing and CardRatings may receive a commission from card issuers.
Thank you for reading! Have some feedback for us?
Contact the 24/7 Wall St. editorial team.
Latest from 24/7


Our expert who first called NVIDIA in 2009 is predicting 2025 will see a historic AI breakthrough.
You can follow him investing $500,000 of his own money on our top AI stocks for free.