Special Report
Black and White Inequality in All 50 States

Published:
Last Updated:

The Civil Rights and Voting Rights Acts of 1965 made great strides toward racial equality. However, this legislation — ending decades of government-sponsored racial oppression and intended to reverse the effects of hundreds of years of slavery — by no means resolved racial inequality in the United States.
Racial differences in the United States are prevalent regardless of geography. While social and economic gaps are wider in some states than in others, the gaps exist across all areas, and we were unable to identify any states where black Americans are better off than white residents. For this reason, we expanded last year’s list of the 10 worst states for black Americans to include all 50 states.
[in-text-ad]
Across virtually all social and economic measures, there are wide racial disparities. Compared to white people in the United States, African Americans are considerably less likely to own their homes, twice as likely to be unemployed, nearly three times as likely to live in poverty, and five times more likely to go to prison.
Click here to see how racial disparities exist in every state.
Click here to see our methodology.
SEGREGATION
According to Economic Policy Institute Research Associate Richard Rothstein, these disparities are entirely attributable to residential segregation, which in turn is attributable to deliberate, racially conscious, government policies implemented over the course of the 20th century. During this time, the Federal Housing Administration financed thousands of suburban development projects with the explicit requirement that no homes be sold to African Americans.
For Rothstein, the existence of racial segregation today is “a constitutional violation, and it requires a remedy.”
Housing equity is the single largest source of middle class family wealth. The tens of thousands of homes bought by white families in the 50’s and 60’s in many cases have tripled in value. Because this wealth is frequently transmitted from one generation to another, Rothstein explained, economic mobility, especially for black Americans, is extremely limited. The removal of such policies was effectively an empty promise, he added, because very few African Americans could afford to live in the neighborhoods after the equity gains.
Today, 71.0% of white individuals and families own their homes, in stark contrast with the black homeownership rate of 41.2%. In some states, the gap is considerably larger. In North Dakota, fewer than one in 10 black householders own their homes, while more than two in every three white individuals and families own the homes in which they live. The gap between the white and black homeownership rates in Maine, at 72.6% and 13.3%, is even wider.
This troubling ownership disparity speaks to the similarly wide racial wealth gap. Black families in the United States have only 5% as much wealth as white families.
INCARCERATION
In her widely cited book The New Jim Crow (2010), Ohio State University Professor Michelle Alexander found that there were more African Americans in jails, prisons, or on probation or parole, than there were enslaved in 1850. While the percentage of black Americans imprisoned today is far lower than the share who were enslaved in 1850, African Americans are disproportionately represented in prisons compared to whites.
For every 100,000 black people nationwide, 2,306 are incarcerated, versus just 450 white prisoners per 100,000 white Americans. The black incarceration rate is highest in West Virginia, where 7,360 black residents are in prison for every 100,000 black West Virginians, 11 times the state’s white incarceration rate of 662 per 100,000.
[in-text-ad]
Rothstein attributes this problem also to residential segregation. “Police might profile African Americans in integrated neighborhoods, but you wouldn’t have the occupying force that we have now.” It is this large police presence, he explained, that has led to confrontational and often violent relationships between law enforcement and African American members of these communities, especially young people.
EDUCATION
One consequence of segregation is massive funding disparities within school districts, leading to similarly wide educational attainment gaps, which in turn contribute to racial inequality more generally.
Per pupil annual primary and secondary school spending in the United States is approximately $10,700. Schools with predominantly non-white student an estimated $733 less per student per year than schools with 90 percent or more white students, according to a report from the left-leaning think tank Center for American Progress. According to recently released data from the U.S. Department of Education’s Office of Civil Rights from the 2013-2014 school year, 11% of black students — versus 5% of white students — attend schools where more than 20% of teachers are in their first year of teaching.
While more than one in every three white adults nationwide has at least a bachelor’s degree, fewer than one in five black adults has a college degree.
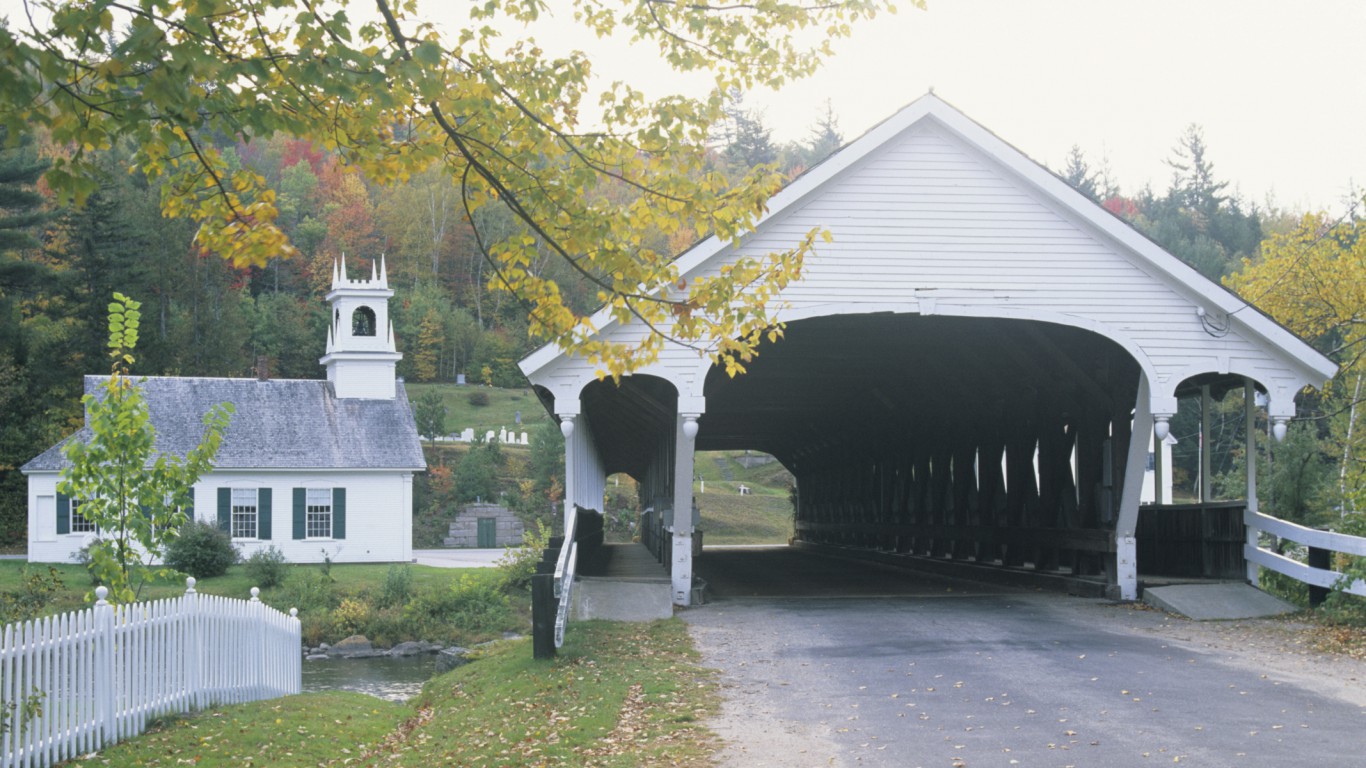
50. New Hampshire
> Pct. residents black: 1.2% (6th lowest)
> Black homeownership rate: 27.8% (13th lowest)
> Black incarceration rate: 2,241 per 100,000 (20th lowest)
> Black unemployment rate: 8.6% (22nd lowest)
While African Americans are statistically worse off than white Americans in many socioeconomic measures nationwide, the racial divide is narrower in New Hampshire. New Hampshire is one of the only states in which a larger share of black adults have high school diplomas than white adults. The high school attainment rate for black Americans is 96.8%, while the corresponding figure for whites is 92.6%. The 29.5% college attainment rate among black adults is also the second highest in the country, yet still not as high as the 35.0% of white adults with at least a bachelor’s degree across the state.
Black Americans are much more likely than their white counterparts to be disenfranchised, and 7.7% of the nation’s voting-age African American adults cannot legally vote. In New Hampshire, however, just 1.6% of the state’s black population is disenfranchised, one of the smallest percentages of any state. This is likely, at least in part, due to the fact that the state has some of the more lenient disenfranchisement laws in the country, allowing convicted felons who are on either probation or parole to vote.
[in-text-ad]
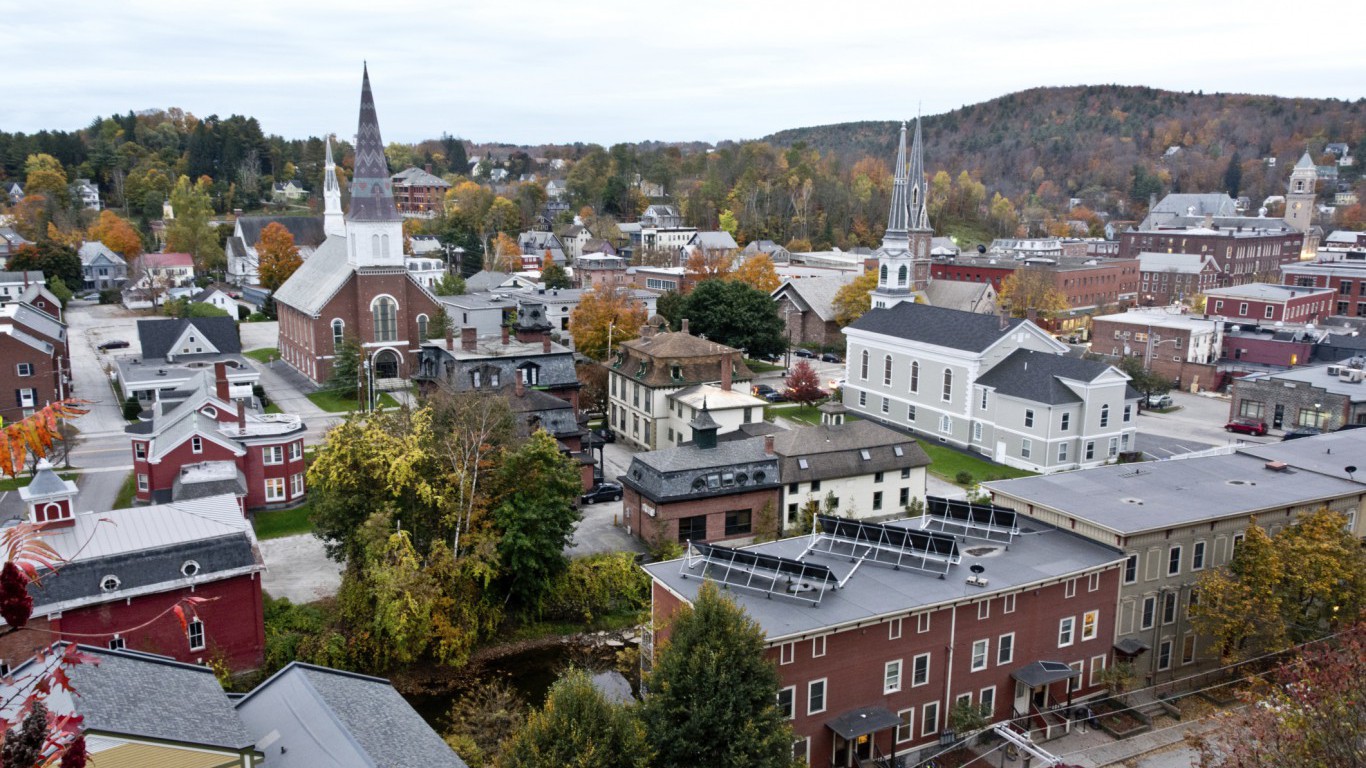
49. Vermont
> Pct. residents black: 0.9% (3rd lowest)
> Black homeownership rate: 24.6% (9th lowest)
> Black incarceration rate: 2,214 per 100,000 (19th lowest)
> Black unemployment rate: N/A
Vermont is the only state in which a larger share of African American adults have graduated from college than white adults. Across the state, 37.0% of African American adults have at least a bachelor’s degree — the highest share of any state — and higher than the 35.1% of white residents with similar educational attainment. Additionally, the difference in incomes between white and black residents is the smallest in the country. The typical African American household in Vermont earns $50,933 annually, the third most of any state and about $4,000 less than the state’s typical white household. By comparison, the national income gap between white and black Americans is roughly $24,000.
Vermont is one of just two states that allows citizens incarcerated on a felony charge to vote while in prison. As a result, Vermont effectively has no legally disenfranchised black Americans, compared to roughly one in every 13 African Americans nationwide.

48. Wyoming
> Pct. residents black: 1.0% (4th lowest)
> Black homeownership rate: 51.0% (4th highest)
> Black incarceration rate: 3,075 per 100,000 (14th highest)
> Black unemployment rate: N/A
While black Americans are statistically worse off than white Americans across the country, the divide is narrower in Wyoming. Across the state, 51.0% of black residents own the homes they live in, the fourth highest share nationwide. While lower than the 69.4% white homeownership rate, the 18 percentage point difference is the smallest homeownership gap of any state.
Wyoming’s high school attainment rate is high among both its black and white populations. Roughly 90% of black adults in the state have a high school diploma, the fourth highest percentage in the country and 5 percentage points less than the white high school attainment rate — itself the seventh highest of any state.

47. New Mexico
> Pct. residents black: 1.8% (10th lowest)
> Black homeownership rate: 43.9% (12th highest)
> Black incarceration rate: 2,609 per 100,000 (21st highest)
> Black unemployment rate: 6.5% (12th lowest)
Across the country, 10.8% of white Americans and 27.0% of black Americans live in poverty, a 16 percentage point gap. In New Mexico, 21.8% of black Americans live in poverty, 8.0 percentage points less than the 13.4% of whites who live in poverty. Not only are African Americans more likely than white Americans to live in poverty, but they are more likely to live in impoverished neighborhoods. New Mexico, however, is one of just four states in which a larger share of poor white people live in extremely poor neighborhoods than poor black people.
New Mexico’s African American population also has among the best health outcomes in the country. There are 6.0 infant deaths per 1,000 live births by African American women in New Mexico, about half the national rate and less than a percentage point higher than the state’s white infant mortality rate of 5.6 deaths per 1,000 live births, the smallest gap nationwide.

46. Hawaii
> Pct. residents black: 2.0% (11th lowest)
> Black homeownership rate: 13.7% (3rd lowest)
> Black incarceration rate: 1,032 per 100,000 (the lowest)
> Black unemployment rate: 4.1% (8th lowest)
Like every state, conditions for black residents in Hawaii are worse on the whole than conditions for white state residents. Still, the state compares favorably to most of the country. Hawaii is one of just two states in which a smaller share of the African American workforce is unemployed than that of the white workforce. The unemployment rate for black Hawaiians is 4.1%, the lowest in the country and 0.4 percentage points lower than the 4.5% unemployment rate for white Hawaiians.
Hawaii also has the lowest African American incarceration rate in the country. There are 1,032 African Americans in jail for every 100,000 black residents in the state, less than half the national incarceration rate. This may be one reason why just 1.0% of black Hawaiians are disenfranchised, the second smallest share of any state that does not allow its incarcerated felons to vote while in jail.

45. Rhode Island
> Pct. residents black: 5.5% (20th lowest)
> Black homeownership rate: 26.8% (11th lowest)
> Black incarceration rate: 1,884 per 100,000 (11th lowest)
> Black unemployment rate: 12.2% (tied – 5th highest)
While the 10.3% white poverty rate in Rhode Island is roughly in line with the national rate, the 20.6% poverty rate among black people in the state is 6.4 percentage points less than the corresponding national rate. Sadly, the 10.3 percentage point gap between white and black poverty rates in Rhode Island is actually among the smallest in the country.
Not only are African Americans more likely than white Americans to live in poverty, but they are more likely to have poor neighbors. In Rhode Island, 20.0% of poor black residents live in concentrated poverty — in neighborhoods where at least two in five residents are poor — more than twice the 8.3% concentrated poverty rate of white residents.
[in-text-ad]
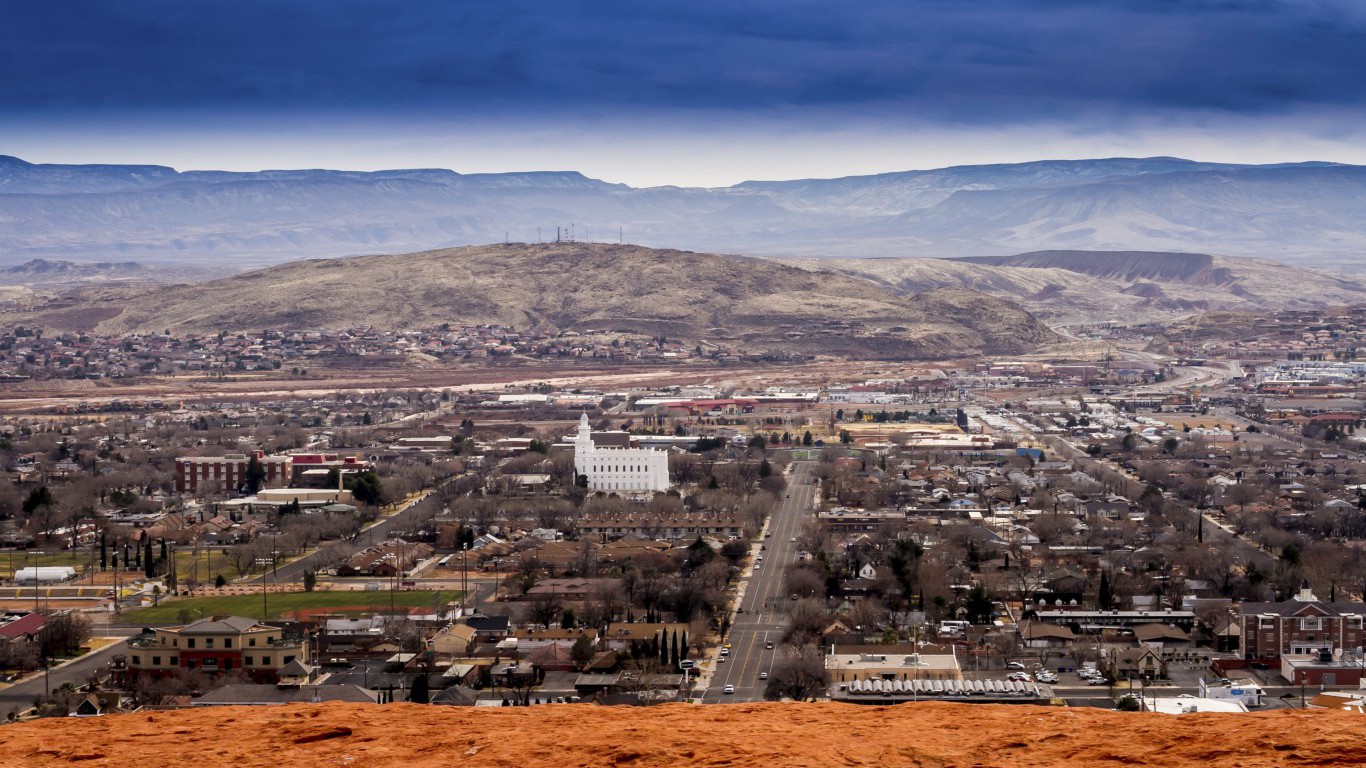
44. Utah
> Pct. residents black: 1.1% (5th lowest)
> Black homeownership rate: 36.6% (25th lowest)
> Black incarceration rate: 2,711 per 100,000 (19th highest)
> Black unemployment rate: N/A
While infant mortality — a strong indicator for overall health — is more common among black Americans than white Americans nationwide, the difference is less stark in Utah. There are roughly seven infant deaths for every 1,000 live African American births in the state, approximately two more deaths per 1,000 live births than among white women in Utah. By contrast, there are about six more deaths per 1,000 live births among black women than among white women nationwide.
Utah also has a relatively small poverty gap between white and black residents. While the 22.7% black poverty rate in the state is more than double the 9.0% white poverty rate, the 14 percentage point difference is still one of the smallest racial disparities in poverty nationwide.

43. West Virginia
> Pct. residents black: 3.6% (16th lowest)
> Black homeownership rate: 42.9% (15th highest)
> Black incarceration rate: 7,360 per 100,000 (the highest)
> Black unemployment rate: 10.6% (tied – 13th highest)
In West Virginia the annual income gap between the typical white and black household is $11,629, less than half the nationwide gap of $24,141. Similarly, the shares of white and black adults with at least a bachelor’s degree differ by less than a percentage point compared to a 14 percentage point difference nationwide. While the achievement gap between black and white residents is relatively thin, the black population in West Virginia is falls behind the average African American in many socioeconomic measures. The typical black household in the state earns just $30,044 annually, and only 18.2% of black adults have at least a bachelor’s degree, among the lower such figures in the country.
West Virginia has the highest African American incarceration rate of any state. There are 7,360 black residents in prison for every 100,000 black West Virginians, roughly three times the national rate and 11 times the incarceration rate for white West Virginians. African Americans make up just 3.6% of the total state population, yet account for roughly 28% of the prison population.
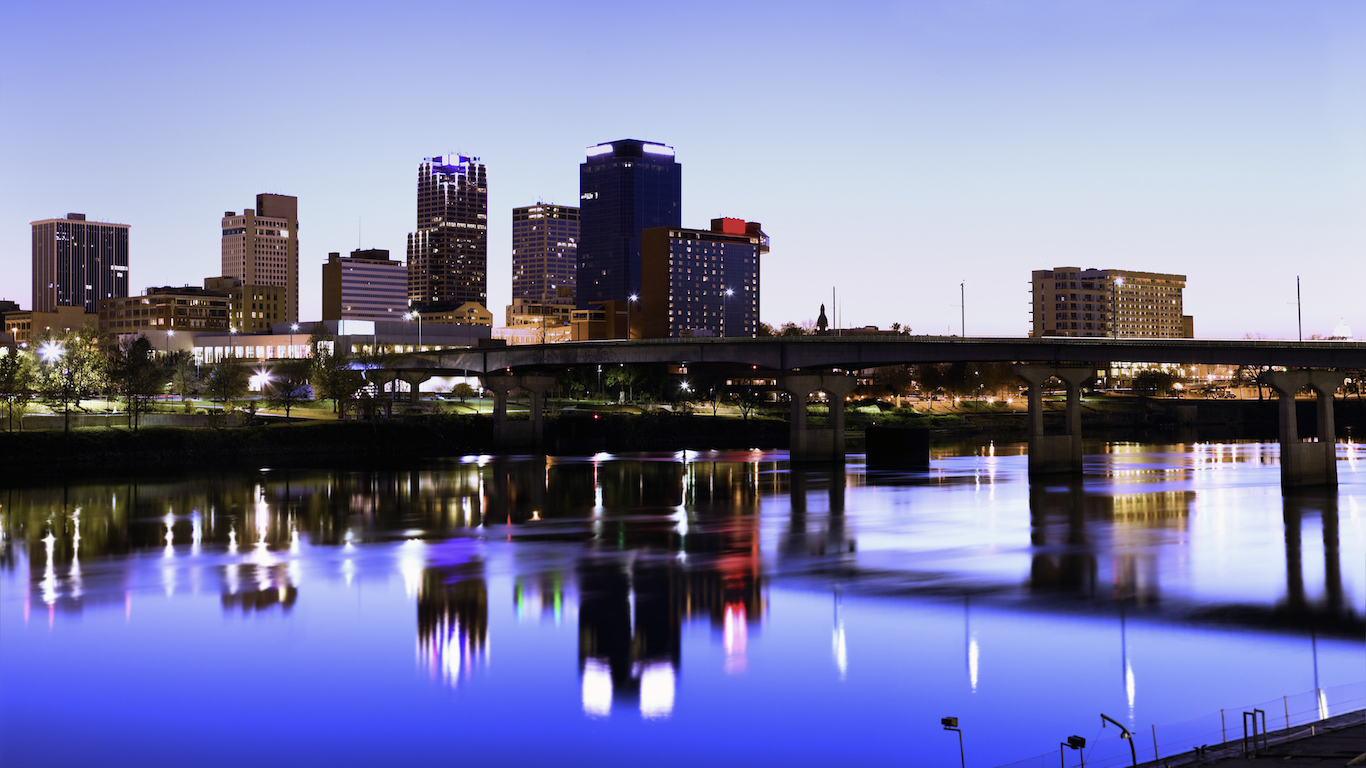
42. Arkansas
> Pct. residents black: 15.7% (11th highest)
> Black homeownership rate: 44.5% (11th highest)
> Black incarceration rate: 2,432 per 100,000 (24th highest)
> Black unemployment rate: 10.3% (tied – 17th highest)
Arkansas is a fairly poor state. While the achievement gap between white and black residents in the state is smaller than in most of the country, African Americans in Arkansas still earn less than many African Americans nationwide. The typical black household in the state earns $17,800 less than the typical white Arkansas household — one of the smaller income gaps — but still $7,800 less than the typical African American household nationwide.
Similarly, 22.9% of white and 15.1% of black adults in the state have at least a bachelor’s degree. While the 7.8 percentage point gap in educational attainment is among the smallest of any state, the share of black adults with at least a bachelor’s degree in Arkansas is still among the lowest in the country.
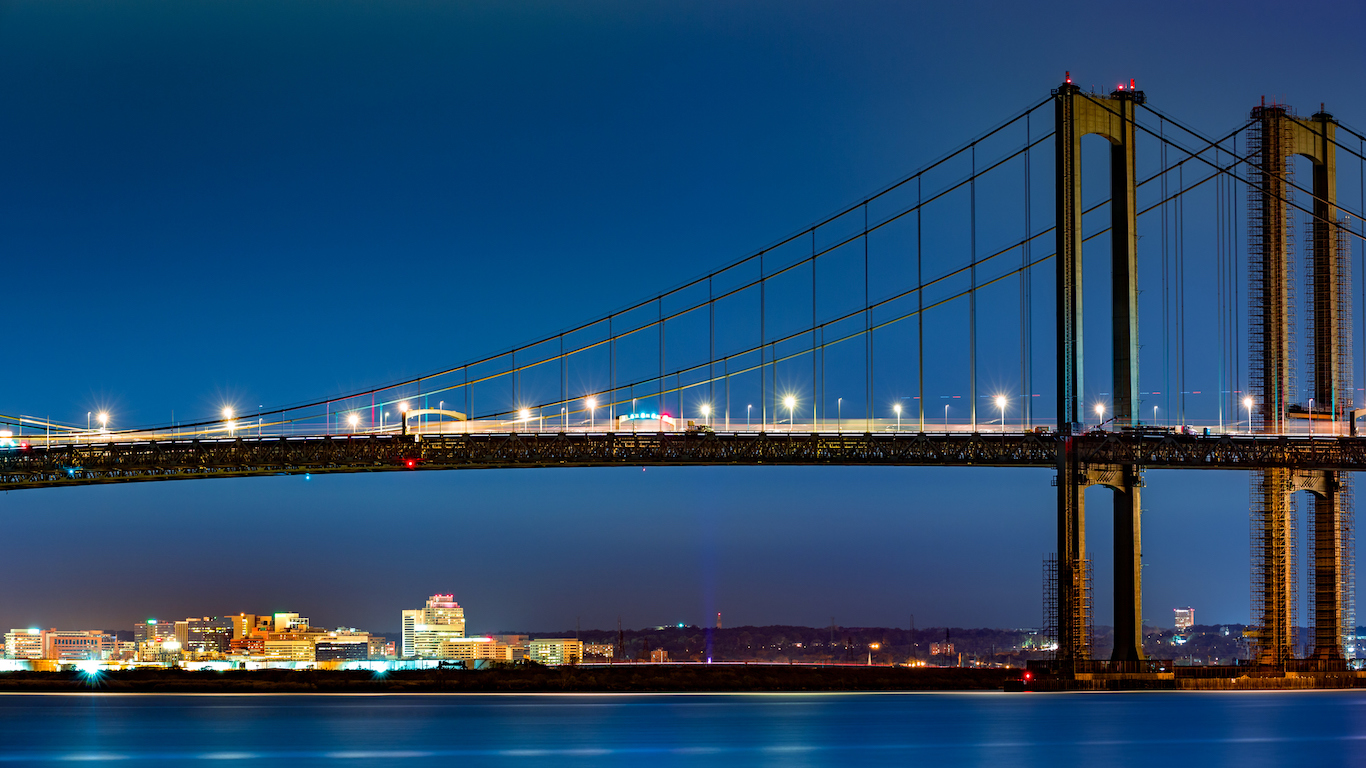
41. Delaware
> Pct. residents black: 21.1% (8th highest)
> Black homeownership rate: 52.0% (2nd highest)
> Black incarceration rate: 2,002 per 100,000 (15th lowest)
> Black unemployment rate: 8.0% (19th lowest)
While homeownership among black Americans nationwide is far lower than white American homeownership, the difference is less substantial in Delaware. Across the state, 78.5% of white and 52.0% of black householders own their homes, the largest and second largest shares of any state and one of the smallest differentials between the two rates.
A similar achievement gap exists in Delaware among white and black residents who live in poverty. Roughly 9% of white and 20% of black residents in the state live below the poverty line, a difference of 11 percentage points. By comparison, the difference between the 11% white and 27% black poverty rates nationwide is 16 percentage points.
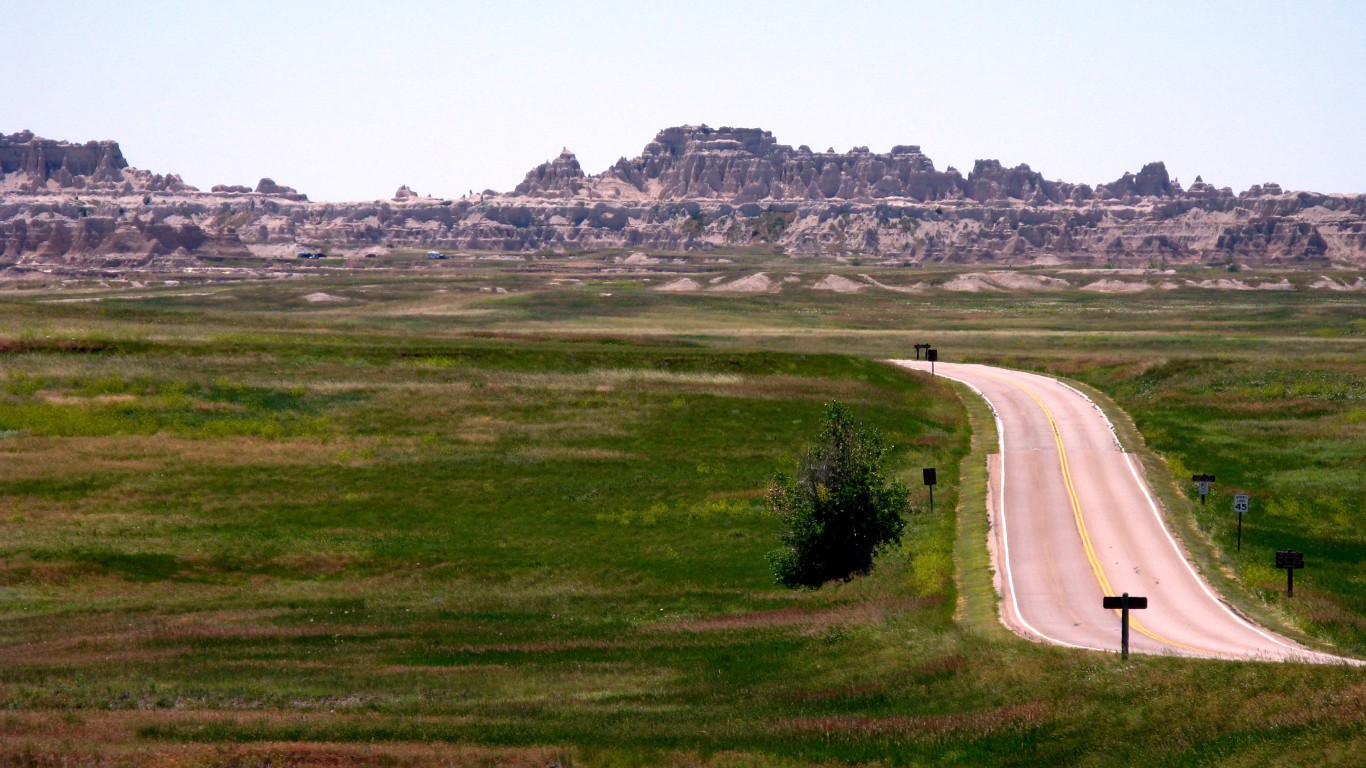
40. South Dakota
> Pct. residents black: 1.7% (8th lowest)
> Black homeownership rate: 22.3% (7th lowest)
> Black incarceration rate: 4,664 per 100,000 (2nd highest)
> Black unemployment rate: N/A
Black Americans are collectively worse off than white Americans by practically every socioeconomic measure, but in South Dakota the achievement gap is much smaller. While the typical white household income in the state is roughly $6,400 less than the corresponding national figure, the typical black household makes about $1,800 more than the national median income for black households. The income gap between white and black households in South Dakota is $15,945, less than the $24,141 national difference.
Compared to the rest of the country, South Dakota also has less divergent outcomes for higher education. The percentage of adults in the state with at least a bachelor’s degree — 29.3% for white people and 22.9% for black people — differs by 6.4 percentage points, less than half the national divide.
[in-text-ad]

39. Maryland
> Pct. residents black: 29.2% (4th highest)
> Black homeownership rate: 49.7% (6th highest)
> Black incarceration rate: 1,437 per 100,000 (3rd lowest)
> Black unemployment rate: 8.3% (21st lowest)
The typical black household in Maryland earns $59,346, the highest of any state except for Hawaii. The high income among black households is still lower than income among white households. The typical white household in the state earns $82,846, the most in the country and $23,500 more than the median income among black households.
Maryland is also characterized by significant geographic segregation. The population of Baltimore, for example, is 63.7% black. The city’s poverty rate of 24.2% is one of the higher rates in the country. Meanwhile, in nearby Columbia, a predominantly white community, has one of the lowest poverty rates in the nation, at approximately 7%.
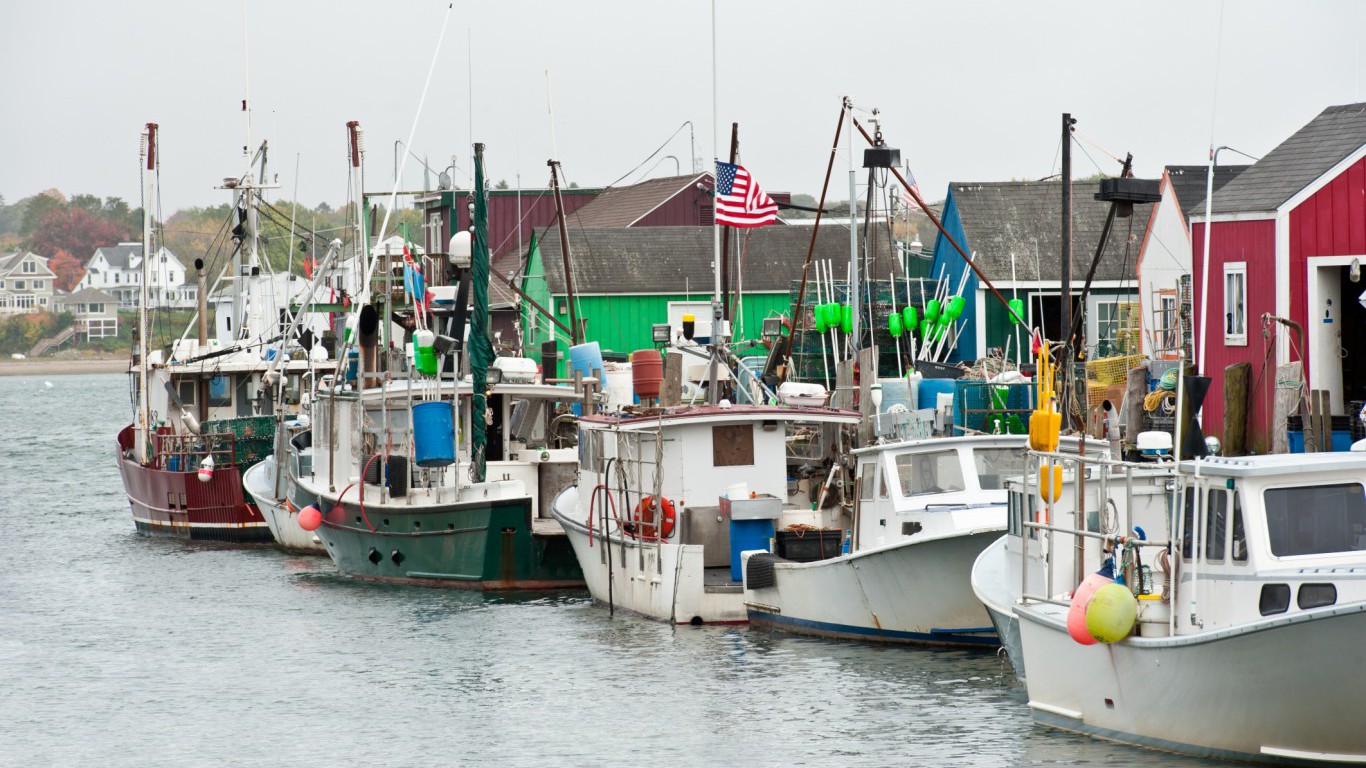
38. Maine
> Pct. residents black: 1.2% (7th lowest)
> Black homeownership rate: 13.3% (2nd lowest)
> Black incarceration rate: 1,553 per 100,000 (5th lowest)
> Black unemployment rate: 10.1% (19th highest)
Across many socioeconomic measures, there is a smaller gap between Maine’s black and white residents compared to the majority of states. However, other racial disparities in Maine are some of the largest in the country. For example, while 72.6% of Maine’s white residents and families own their home, the black homeownership rate is just 13.3%.
As is the case in every other state in the nation, black Maine residents are also far more likely to be incarcerated than their white peers. While the black incarceration rate in the state, at 1,553 per 100,000, is relatively low, it is still about six times greater than the white incarceration rate. While the state may have a long way to go closing this incarceration gap, some effort has been made to relieve the disadvantages of incarceration. Maine is one of only two states that permits convicted felons to vote while in prison.
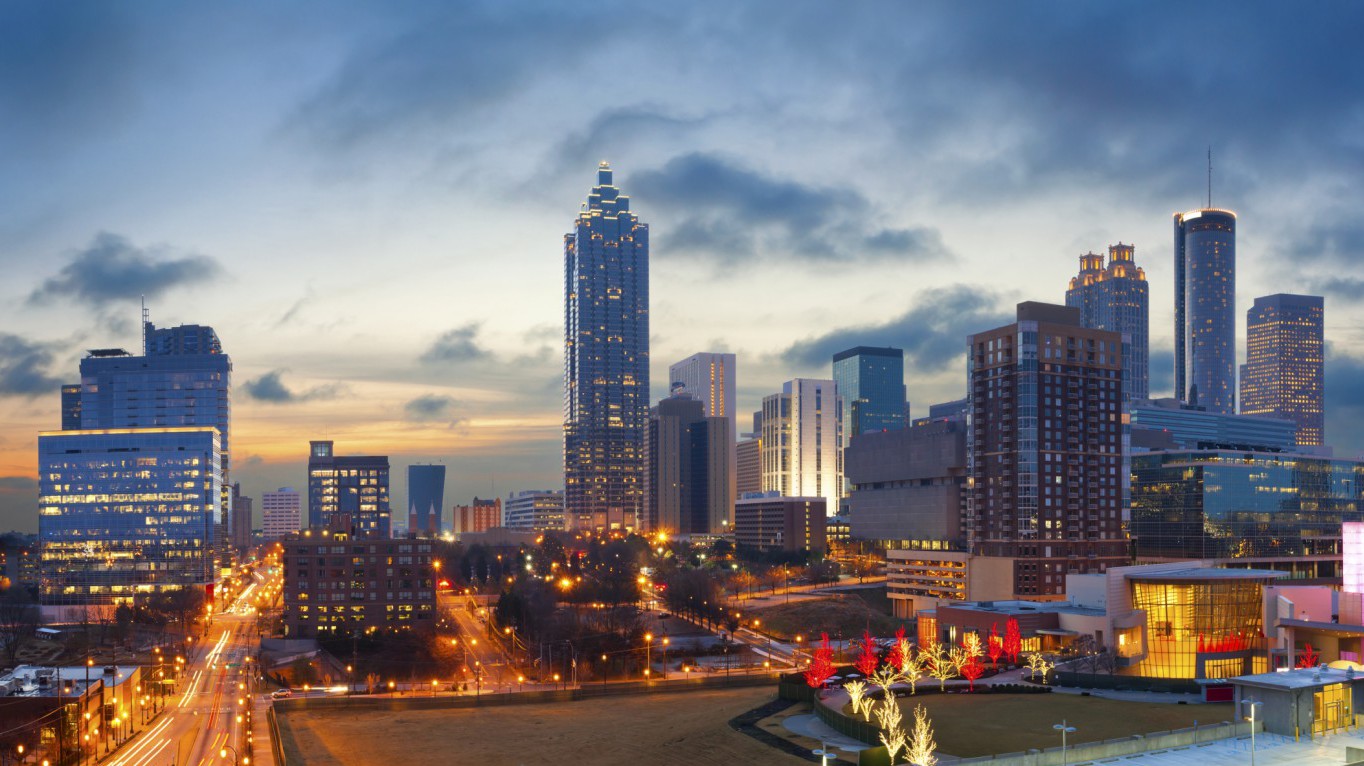
37. Georgia
> Pct. residents black: 30.9% (3rd highest)
> Black homeownership rate: 45.6% (9th highest)
> Black incarceration rate: 2,036 per 100,000 (16th lowest)
> Black unemployment rate: 9.3% (24th highest)
Compared to the majority of states, Georgia’s black residents are not as disadvantaged relative to the white residents. For example, 84.1% of the state’s adult African Americans have a high school diploma compared to 89.4% of white Georgian adults. This is one of the smaller gaps in high school attainment rate of all states.
The racial disparities in some socioeconomic measures are somewhat smaller in Georgia, but the inequality is still substantial. For example, the state incarcerates its white residents at a rate of 640 people for every 100,000, less than a third of the incarceration rate for black people in the state of 2,036 for every 100,000 people.

36. Washington
> Pct. residents black: 3.4% (15th lowest)
> Black homeownership rate: 33.4% (20th lowest)
> Black incarceration rate: 2,372 per 100,000 (25th lowest)
> Black unemployment rate: 8.9% (24th lowest)
While infant mortality is relatively low in the United States compared to many parts of the world, infant mortality varies within the country depending on demographics. These differences are often indicative of income and health inequality. In Washington, black infants are 1.7 times as likely to die before the age of one as white infants.
In few measures is the disparity between white and black Americans greater than homeownership, a key sign of economic stability. White Washingtonians are twice as likely as black individuals and families to own their home.
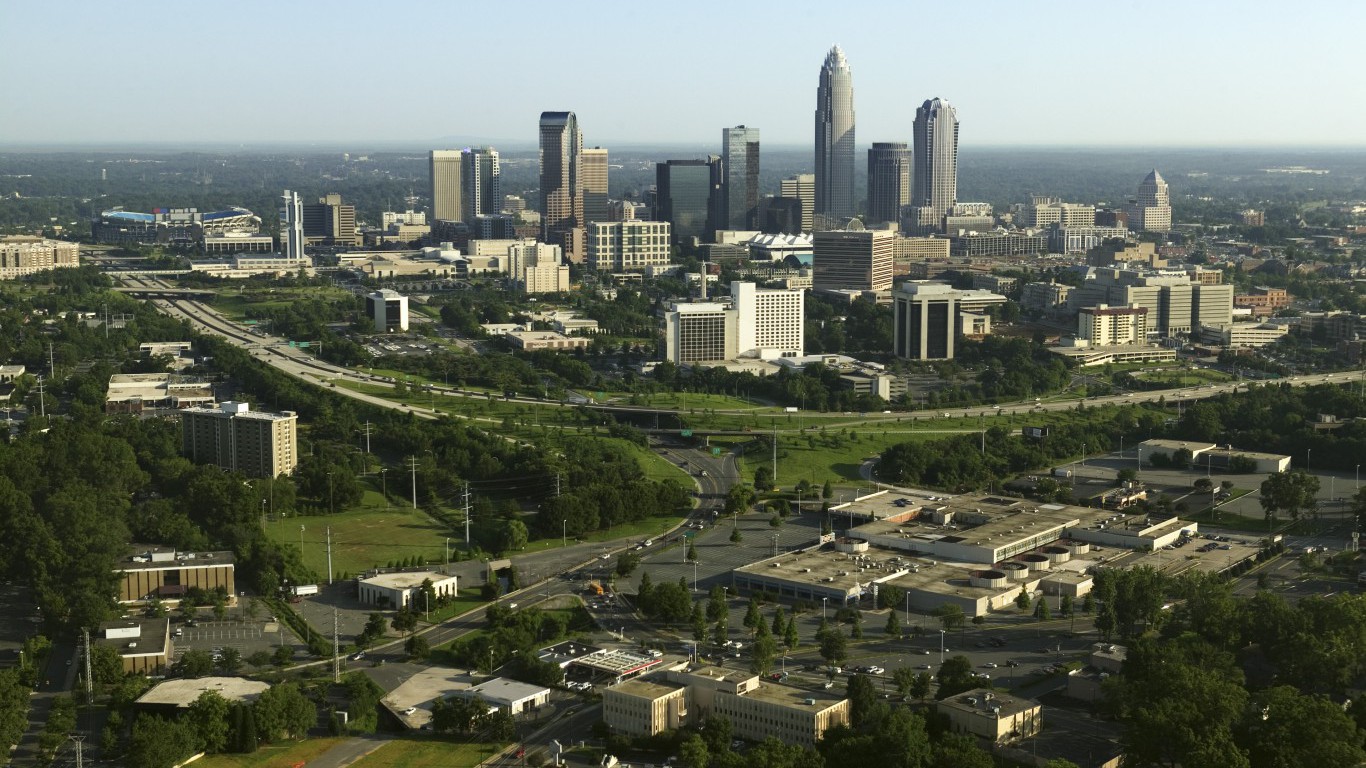
35. North Carolina
> Pct. residents black: 21.4% (7th highest)
> Black homeownership rate: 45.2% (10th highest)
> Black incarceration rate: 1,665 per 100,000 (7th lowest)
> Black unemployment rate: 10.3% (tied – 17th highest)
North Carolina has one of the largest black populations in the country. More than 20% of the state’s population is black compared to just 12.3% of the national population. Still, while disparities are not as bad as in many other states, severe inequalities exist. For example, the typical white household makes nearly $20,000 more than the typical black household.
One of the most glaring racial inequalities in the United States is the rate at which black Americans are imprisoned compared to their white peers. In North Carolina, 1,665 out of every 100,000 black people are incarcerated, while the incarceration rate among the white population is 357 per 100,000.
[in-text-ad]

34. Kentucky
> Pct. residents black: 7.8% (24th highest)
> Black homeownership rate: 36.9% (24th highest)
> Black incarceration rate: 3,545 per 100,000 (7th highest)
> Black unemployment rate: 11.2% (8th highest)
The difference between white and black household earnings in Kentucky is about $18,400. While this is less than the national income gap of $24,141, Kentucky is also one of the lowest-income states overall. Proportionally, black households make less than 60% of the white median household income in Kentucky.
Disenfranchisement is a common problem among black Americans, and a startling 22.3% of Kentucky’s African American residents of voting age cannot legally cast a ballot, the second highest proportion in the country. This is largely due to the state’s exceptionally high black incarceration rate of 3,545 out of every 100,000 black people in the state — the seventh highest rate in the country.

33. Nevada
> Pct. residents black: 8.2% (23rd highest)
> Black homeownership rate: 27.6% (12th lowest)
> Black incarceration rate: 2,624 per 100,000 (20th highest)
> Black unemployment rate: 13.5% (3rd highest)
While black mothers nationwide experience more than twice as many infant deaths per capita as white mothers, the disparity is less substantial in Nevada. There are 5.1 infant deaths for every 1,000 live white births and 9.2 infant deaths for every 1,000 black births in the state, a difference of about four deaths.
Nevada has one of the highest unemployment rates in the country, which disproportionately affects the African American community. In Nevada, the white unemployment rate of 6.1% and the black unemployment rate of 13.5% are both higher than the corresponding national rates — and more divergent.
32. North Dakota
> Pct. residents black: 2.0% (12th lowest)
> Black homeownership rate: 9.8% (the lowest)
> Black incarceration rate: 1,671 per 100,000 (8th lowest)
> Black unemployment rate: N/A
Home equity is the single largest source of wealth of middle-class American families. Largely due to government-sponsored housing segregation in the 20th century, however, the wealth of black families is dwarfed by that of white families. In North Dakota, the gap in homeownership is especially large. Fewer than one in 10 black householders own their homes, compared to nearly seven in 10 white householders.
The state also has some of the highest income inequality in the country. The typical white household earns $38,545 more annually than the typical black household in the state, the largest income gap nationwide.

31. Oklahoma
> Pct. residents black: 7.3% (25th highest)
> Black homeownership rate: 36.8% (25th highest)
> Black incarceration rate: 3,796 per 100,000 (4th highest)
> Black unemployment rate: 8.8% (23rd lowest)
In Oklahoma, 90.3% of white adults and 88.3% of black adults have at least a high school diploma. While the state’s white high school attainment rate is below the 92.0% national rate, the black high school attainment rate is above the 84.4% national rate.
Oklahoma has one of the largest racial disparities in incarceration nationwide. For every 100,000 African American Oklahomans, 3,796 are in jail or prison, the fourth highest black incarceration rate of any state. Meanwhile, there are 767 white residents in jail for every 100,000, itself the second highest white incarceration rate in the country. This means black people living in Oklahoma are around five times more likely to go to prison than their white peers.
30. Massachusetts
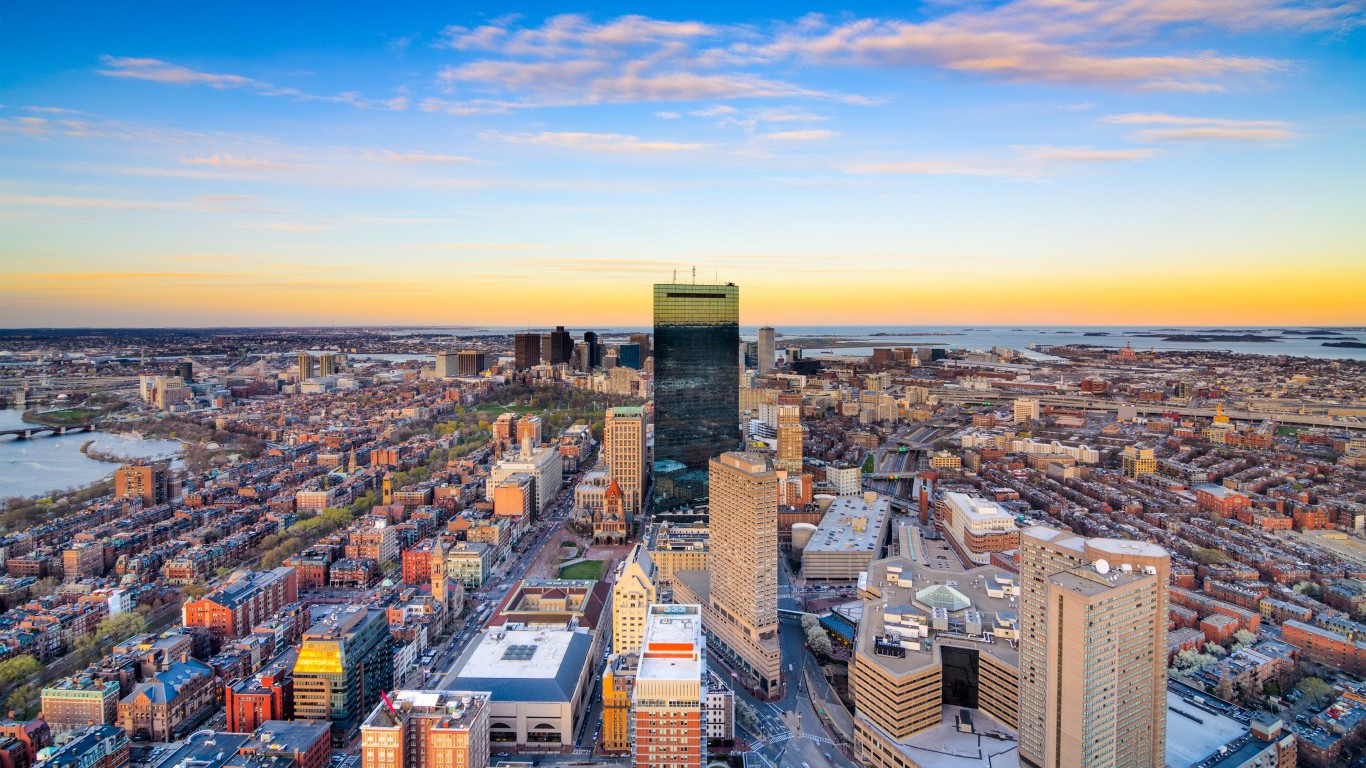
> Pct. residents black: 6.5% (25th lowest)
> Black homeownership rate: 33.3% (19th lowest)
> Black incarceration rate: 1,502 per 100,000 (4th lowest)
> Black unemployment rate: 10.6% (tied – 13th highest)
Massachusetts residents are some of the most well-off in the country. As in every state, however, this prosperity is largely distributed along racial lines. The college attainment rate, which for white adults in Massachusetts is a second in the nation 44.1%, is not nearly as high among black state residents. Just 23.3% of black adults have at least a bachelor’s degree. Racial inequality in education levels is likely tied to the similarly wide gap in black and white incomes. The typical black household in the state earns $42,114 annually. While this is well above the median income for black households nationwide, it is a far cry from the median income among white Massachusetts households of $75,598.
For every 100,000 black Massachusetts residents, 1,502 are in prison. While this is nearly the lowest incarceration rate among black Americans, it is several times higher than the white incarceration rate in Massachusetts of 241 per 100,000.
[in-text-ad]
29. Oregon
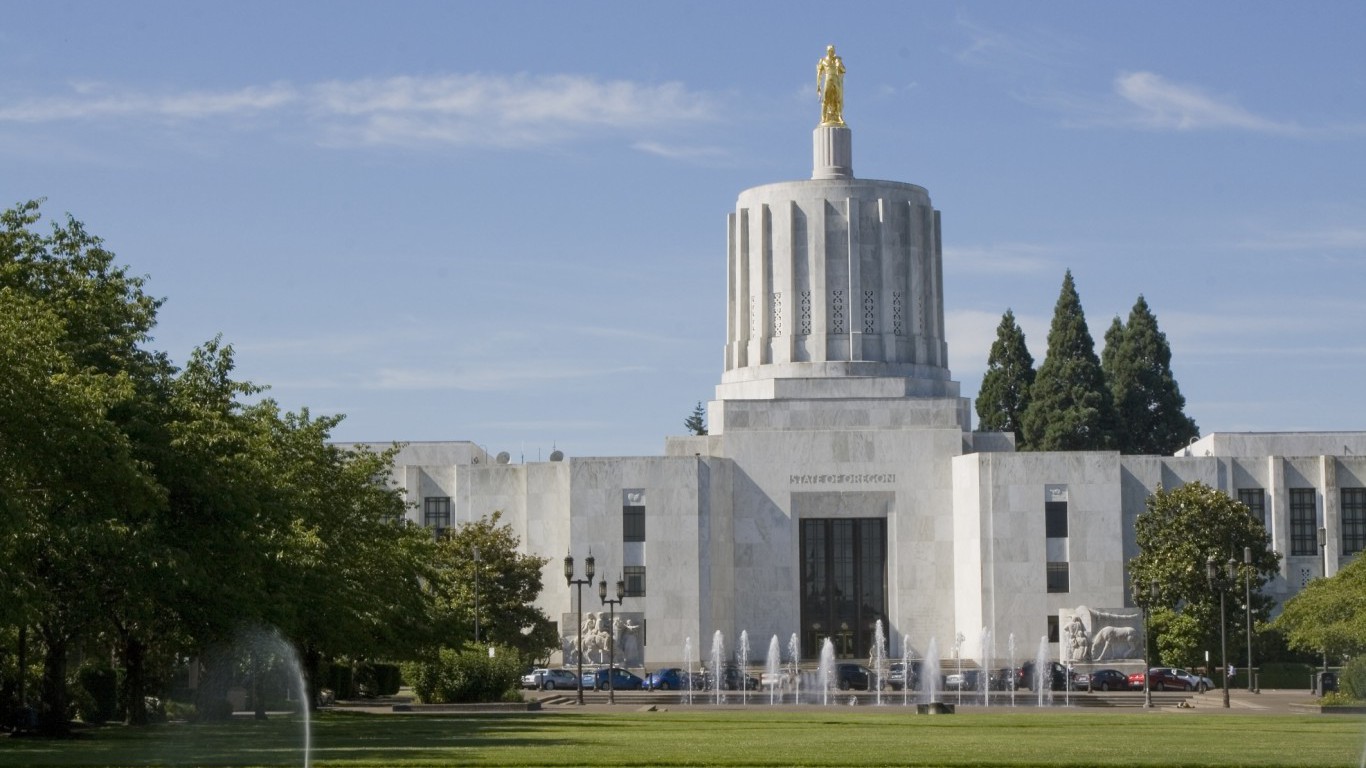
> Pct. residents black: 1.7% (9th lowest)
> Black homeownership rate: 30.3% (14th lowest)
> Black incarceration rate: 3,195 per 100,000 (12th highest)
> Black unemployment rate: 7.4% (15th lowest)
Oregon is an overwhelmingly white state. While 12.3% of Americans are black, the African American population of Oregon is just 1.7%. Those residents are far more likely to be worse off than the white majority. In Oregon, 13.9% of the state’s white residents are poor, which is one of the highest poverty rates for the demographic. As is the case across the country, even when conditions are bad for white people, they are an order of magnitude worse for black people. In Oregon, 38.3% of the state’s black population lives below the poverty line.
The incarceration rate for black Americans is roughly five times that of white Americans, and the difference is even more stark in Oregon. For every 100,000 black state residents, 3,195 are incarcerated, 6.3 times the state’s white incarceration rate of 506 per 100,000.
28. South Carolina
> Pct. residents black: 27.1% (5th highest)
> Black homeownership rate: 51.8% (3rd highest)
> Black incarceration rate: 1,996 per 100,000 (14th lowest)
> Black unemployment rate: 10.7% (12th highest)
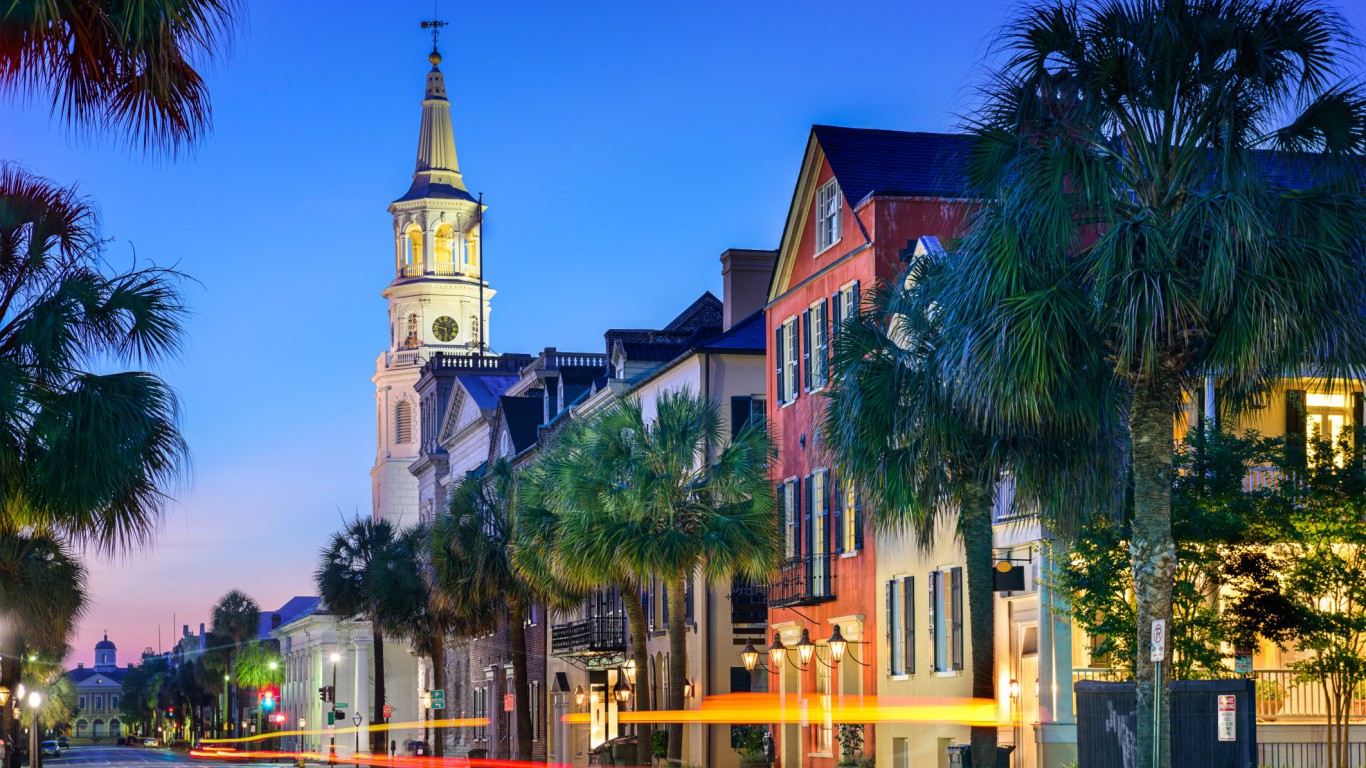
In South Carolina, black residents are about as worse off as the average African American by many socioeconomic measures. The typical black household in the state earns $30,333 annually, about $5,000 less than the national median income for black households and $22,000 less than the typical white household in the state. Nationwide, the typical black household earns $24,000 less than the typical white household.
A similar racial divide exists between the percentage of black and white residents living in poverty. The 11.9% white and 28.8% black poverty rates in South Carolina are roughly in line with the corresponding national figures, and the gap of 17 percentage points is similar to the 16 percentage point national gap.

27. New York
> Pct. residents black: 14.4% (13th highest)
> Black homeownership rate: 30.5% (16th lowest)
> Black incarceration rate: 1,655 per 100,000 (6th lowest)
> Black unemployment rate: 8.2% (20th lowest)
African Americans are statistically worse off than white Americans nationwide, a racial divide also present in New York. The typical black household in the state earns $40,912 annually, about $5,000 more than the national median income for black households. While the $68,283 median income for white households in New York is far higher, the $27,000 difference between white and black households is close to the national $24,000 racial income disparity.
More than three out of four black New Yorkers live in New York City. Despite criminal drug reform instituted in 2009, New York City still has some of the worst racial disparities in incarceration in the country. While 293 out of every 100,000 white residents are incarcerated in New York City, 2,868 of every 100,000 black residents are in jail or prison.

26. Missouri
> Pct. residents black: 11.6% (19th highest)
> Black homeownership rate: 38.6% (20th highest)
> Black incarceration rate: 2,337 per 100,000 (24th lowest)
> Black unemployment rate: 10.0% (tied – 20th highest)
Missouri is somewhat representative of the racial divide that exists across America. In the state, 12.9% of white and 28.1% of black residents live in poverty, each slightly higher than the corresponding national rates.. The 15 percentage point gap in poverty rates is similar to the national 16 percentage point gap.
Missouri is also characteristic of the nation’s racial incarceration disparity. For every 100,000 black residents in the state, 2,337 are incarcerated — far more than the white incarceration rate of 495 per 100,000. The national incarceration rates are fairly similar: 2,306 per 100,000 black Americans and 450 per 100,000 white Americans.

25. Arizona
> Pct. residents black: 3.9% (18th lowest)
> Black homeownership rate: 31.0% (17th lowest)
> Black incarceration rate: 3,184 per 100,000 (13th highest)
> Black unemployment rate: 9.1% (25th highest)
Regardless of whether a state has a strong or weak job market, black Americans are significantly more likely to struggle to find employment than white people. In Arizona, 5.7% of the white labor force is unable to find work, — one of the highest white unemployment rates of any state. The unemployment rate among black Arizonans is actually lower than in the majority of states, but at 9.1%, it’s still well above the white rate.
Homeownership is often a sign of prosperity and economic stability. In Arizona, white individuals and families are more than twice as likely to own the home in which they live as black individuals and families, at 68% and 31%, respectively.
[in-text-ad]

24. Alabama
> Pct. residents black: 26.5% (6th highest)
> Black homeownership rate: 49.8% (5th highest)
> Black incarceration rate: 1,788 per 100,000 (10th lowest)
> Black unemployment rate: 10.6% (tied – 13th highest)
While there is a very large racial disparity in incarceration rates nationwide, the divide is narrower in Alabama. Across the country, 2,306 black and 450 white residents per 100,000 are incarcerated. In the state, there are 1,788 black and 535 white residents in prison per 100,000.
In other socioeconomic measures, Alabama is somewhat representative of the racial divide that exists across the country. For every 1,000 live births by black women in the state, roughly 12 infants die — nearly double the white infant mortality rate of seven deaths. Both the black and white infant mortality rates in Alabama are among the highest in the country, but they differ by less than six deaths, roughly the same as the racial infant mortality gap nationwide.
23. Connecticut
> Pct. residents black: 9.7% (21st highest)
> Black homeownership rate: 40.0% (19th highest)
> Black incarceration rate: 2,260 per 100,000 (21st lowest)
> Black unemployment rate: 13.2% (4th highest)
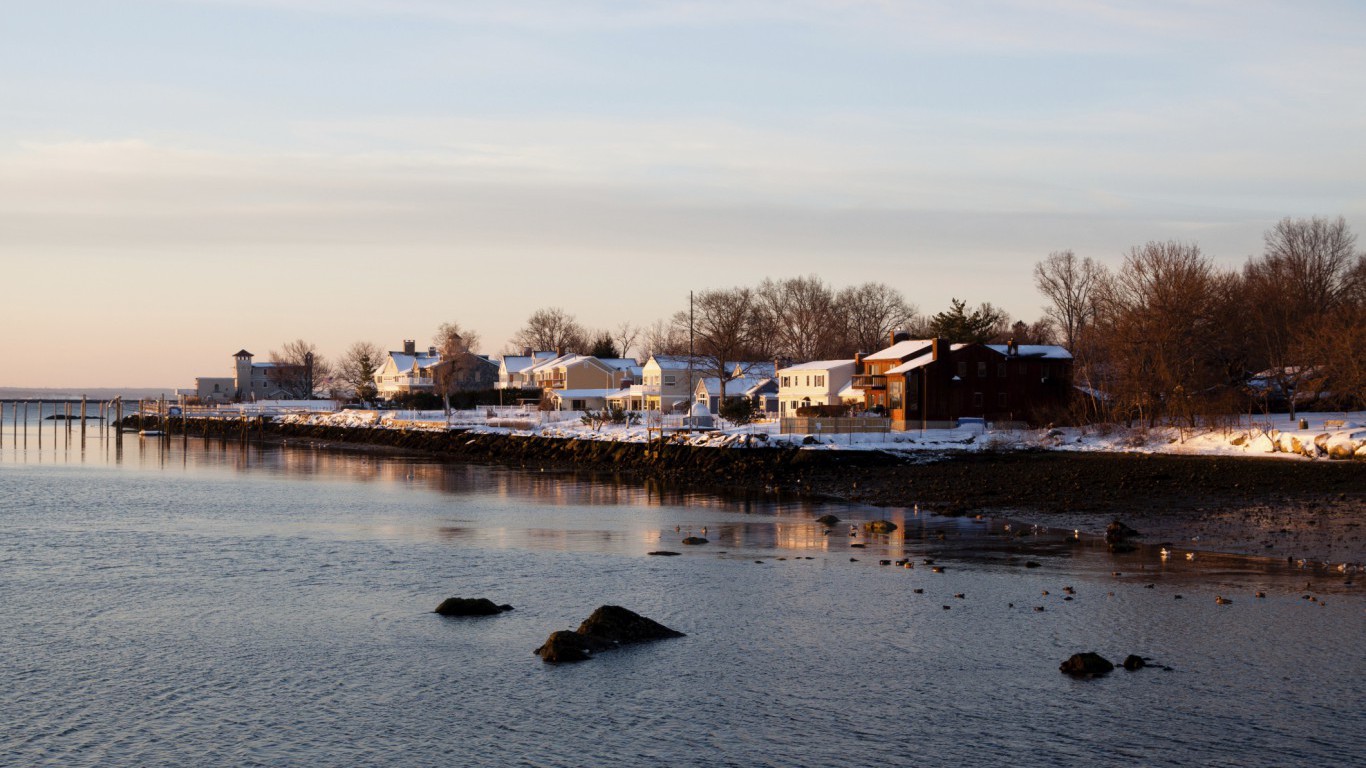
The typical black household in Connecticut earns $45,002 annually, about $10,000 more than the national median income for black households. Despite relatively high incomes, however, black residents are still far worse off than whites in Connecticut. The typical white household in the state earns $78,959 annually, roughly $34,000 more than the typical black household — and far higher than the national income gap of $24,000.
Connecticut also has some of the worst racial inequality in education nationwide. While 42.3% of adults in the state have at least a bachelor’s degree, 21.3% of black adults do. While both percentages are relatively high, the 21 percentage point difference is the second highest education gap in the country.
22. Texas
> Pct. residents black: 11.7% (18th highest)
> Black homeownership rate: 40.8% (17th highest)
> Black incarceration rate: 2,855 per 100,000 (16th highest)
> Black unemployment rate: 7.5% (tied – 17th lowest)
Texas is fairly representative of the racial disparity in income that exists across America. The typical black household in Texas makes $39,280 annually, about $4,000 more than the national median income for black households, yet roughly $27,000 less than the typical white household in the state. By comparison, the national income gap between white and black households is approximately $24,000.
Not only are African Americans more likely to live in poverty than white Americans, they are more likely to live in concentrated poverty — neighborhoods in which at least two in five residents live in poverty. Texas, however, where 16.8% of both poor black and poor white residents live in such neighborhoods, is one of just a few states in which the black concentrated poverty rate is less than or equal to the white concentrated poverty rate.
21. Montana
> Pct. residents black: 0.6% (the lowest)
> Black homeownership rate: 20.5% (4th lowest)
> Black incarceration rate: 3,601 per 100,000 (6th highest)
> Black unemployment rate: N/A
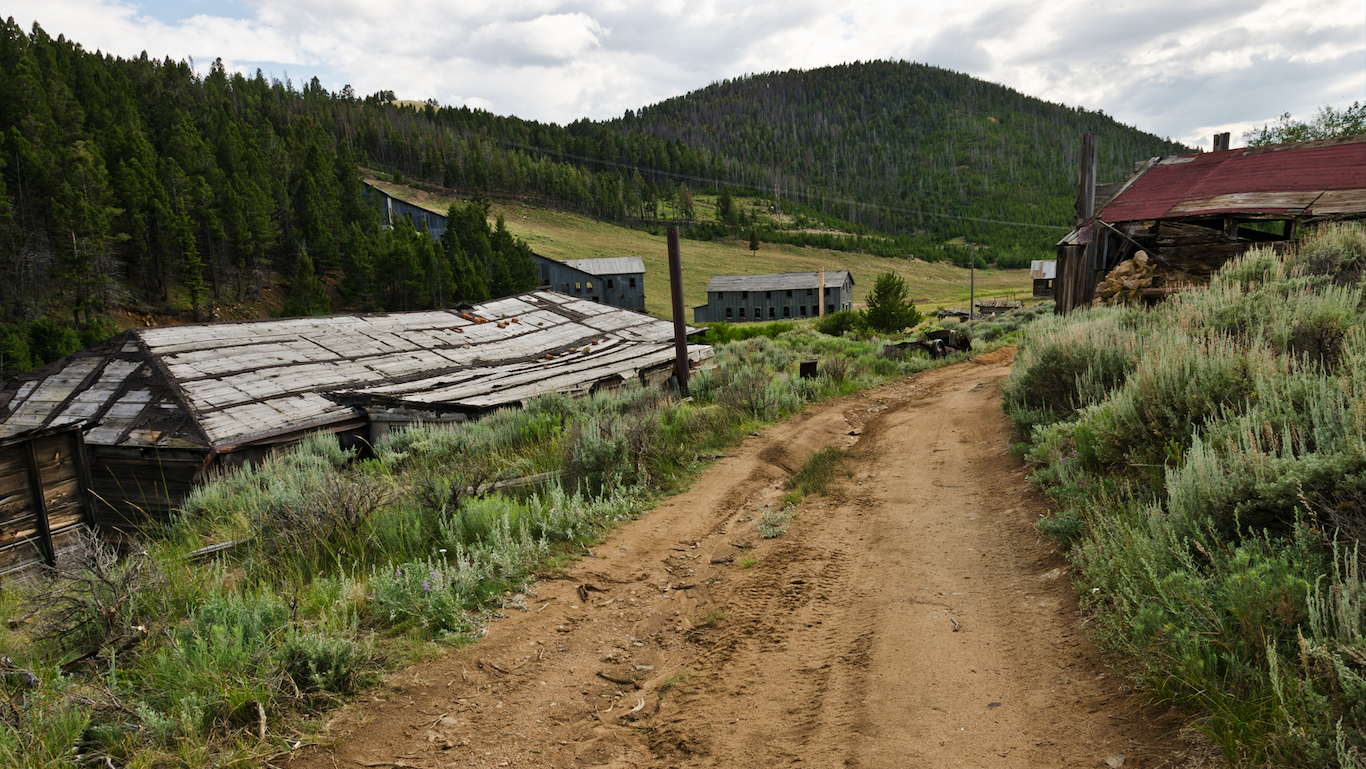
Montana has one of the worst racial disparities in incarceration rates of any state. For every 100,000 black residents in Montana, 3,601 are in prison, the sixth highest black incarceration rate in the country and about 3,200 more per 100,000 than the state’s white incarceration rate. However, Montana has somewhat lenient disenfranchisement laws, allowing felons on parole or probation to vote. Despite the high incarceration rate, just 4.1% of the state’s black residents are disenfranchised, compared to 7.7% nationwide.
Not only are African Americans more likely to be poor nationwide, but they are more likely to live in poor neighborhoods. Montana, however, is one of the only states in which a smaller share of poor black residents live in concentrated poverty — neighborhoods in which at least two in five residents earn poverty wages — than poor white residents.
20. California
> Pct. residents black: 5.6% (21st lowest)
> Black homeownership rate: 34.0% (21st lowest)
> Black incarceration rate: 3,036 per 100,000 (15th highest)
> Black unemployment rate: 11.0% (10th highest)
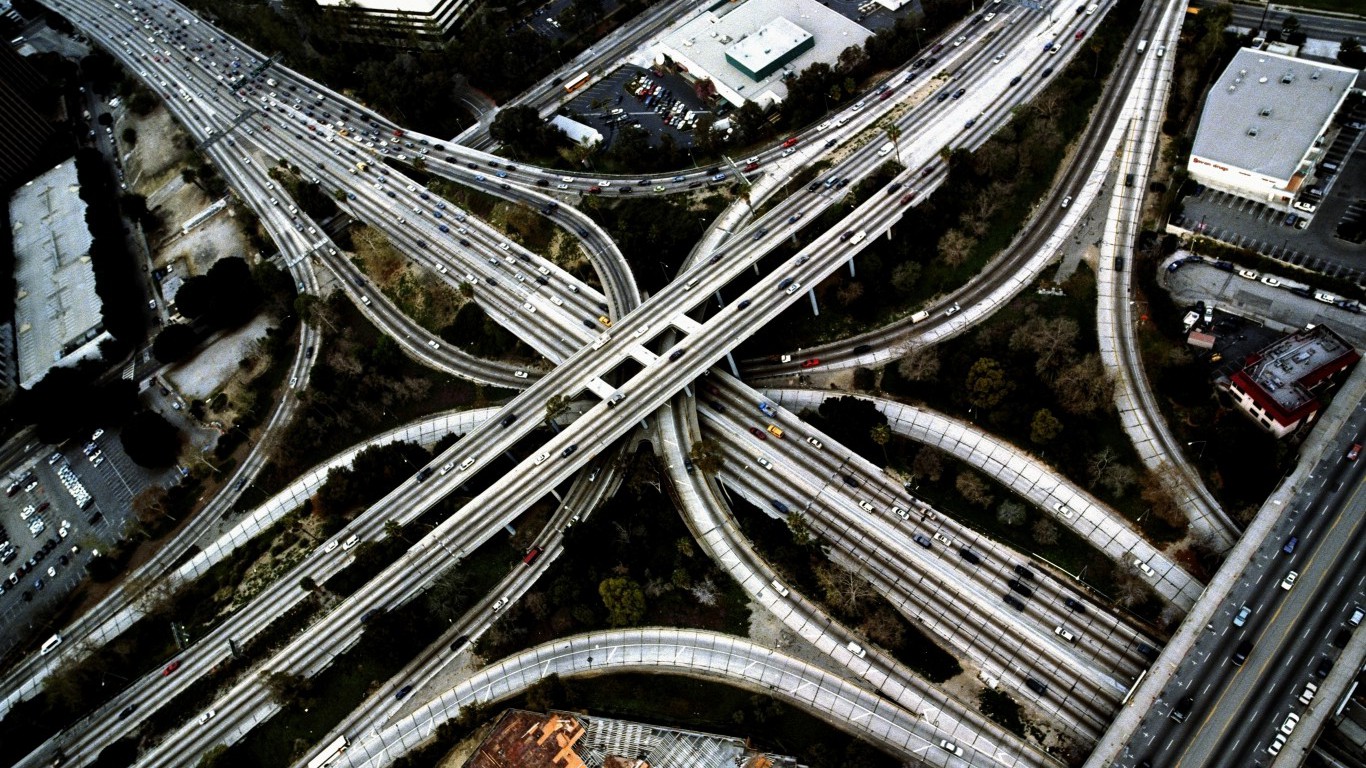
Immediately after California became the first state to ban affirmative action in 1996, the admission and enrollment rates for African Americans in California universities fell. Today, California has one of the largest racial disparities in college attainment in the country. While 41.6% of white adults in the state have at least a bachelor’s degree, only 22.7% of black adults do.
California has one of the largest income gaps nationwide. The typical black household in California makes $42,509 annually — roughly $7,000 more than the national median income for black households — yet approximately $31,000 less than the typical white household in the state. By comparison, the national income gap between white and black households is approximately $24,000.
[in-text-ad]

19. Tennessee
> Pct. residents black: 16.8% (10th highest)
> Black homeownership rate: 43.7% (13th highest)
> Black incarceration rate: 1,962 per 100,000 (12th lowest)
> Black unemployment rate: 7.5% (tied – 17th lowest)
In states with poor social and economic outcomes across the board, racial disparities tend to be smaller. Tennessee is one such example. The typical white and black households in the state make $48,218 and $31,071 annually, about a $17,000 difference. Nationwide, the median income for white households is $59,622, roughly $24,000 more than the typical black household. Similarly, the 87.2% of white adults in Tennessee with at least a high school diploma is the fourth smallest percentage of any state, and only three points higher than the 84.7% black educational attainment rate. Nationwide, the racial disparity in high school educational attainment is eight percentage points.
Tennessee does, however, have some of the stricter felony disenfranchisement laws in the country. Nearly one in five of every black Tennesseans is disenfranchised, the fourth highest share nationwide.

18. Mississippi
> Pct. residents black: 37.7% (the highest)
> Black homeownership rate: 53.8% (the highest)
> Black incarceration rate: 1,788 per 100,000 (10th lowest)
> Black unemployment rate: 9.4% (23rd highest)
In Mississippi, 34.3% of residents live in poverty, the fifth highest percentage of all states, and far higher than the 10.5% poverty rate among whites in the state. The 24 point gap between the two rates is far larger than the 16 point racial poverty gap nationwide. Similarly, the 76.6% of black adults with at least a high school diploma is the fifth smallest percentage in the nation, and is far smaller than the 87.0% of white adults with at least a high school diploma in the state.
Mississippi has relatively high homeownership among all its residents. Of black householders in the state, 54% own their homes. While this is the highest such percentage in the nation, it still trails the white homeownership rate by 23 percentage points.

17. Indiana
> Pct. residents black: 9.2% (22nd highest)
> Black homeownership rate: 37.1% (23rd highest)
> Black incarceration rate: 2,814 per 100,000 (17th highest)
> Black unemployment rate: 7.0% (14th lowest)
Not only are African Americans more likely to be poor than white Americans nationwide, but they are also more likely to be further disadvantaged by living in extremely poor neighborhoods. In Indiana, while 32.6% of poor black residents live in concentrated poverty — neighborhoods in which at least two in five residents earn poverty wages — 8.1% of poor white residents do. The black concentrated poverty rate is the fifth highest in the country, and the 24.5 percentage point difference from the white concentrated poverty rate is one of the largest of any state.
Indiana has one of the higher black incarceration rates nationwide. For every 100,000 African Americans in the state, 2,814 are in prison, about 500 more than the national figure.
16. Idaho
> Pct. residents black: 0.6% (2nd lowest)
> Black homeownership rate: 21.5% (5th lowest)
> Black incarceration rate: 3,252 per 100,000 (11th highest)
> Black unemployment rate: N/A
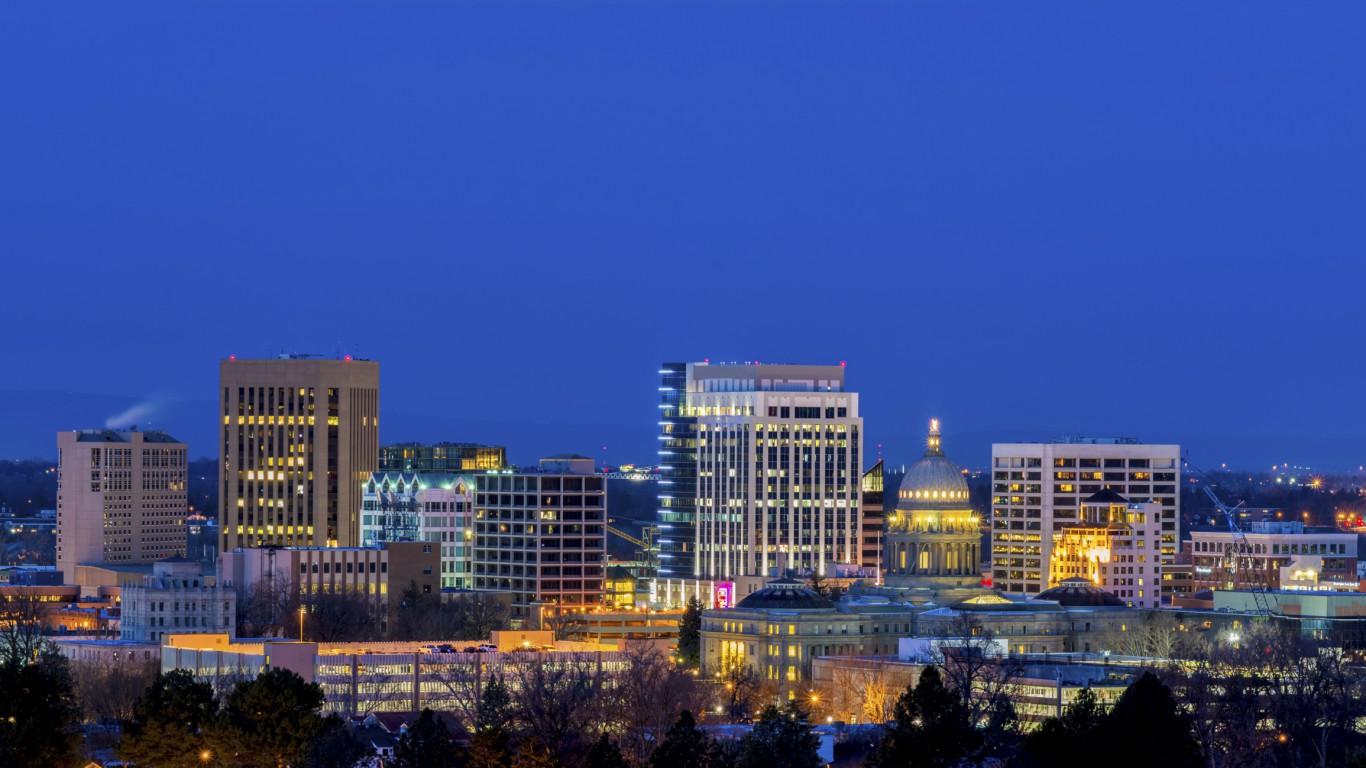
African Americans are statistically worse off than white Americans by many socioeconomic measures nationwide, and the racial divide is even wider in Idaho. While 93.6% of white adults in the state have at least a high school diploma — one of the higher high school attainment rates for white Americans — a smaller 71.9% of black adults have similar educational attainment, the third smallest percentage nationwide. In no other state is the racial disparity in high school education as wide as it is in Idaho.
Across the country, 71.0% of white householders and 41.2% of black householders own their homes. In Idaho, the racial disparity in homeownership is even larger. While 70.2% of white families and individuals own their homes, just 21.5% of black householders do.
15. Michigan
> Pct. residents black: 13.8% (15th highest)
> Black homeownership rate: 40.7% (18th highest)
> Black incarceration rate: 2,169 per 100,000 (18th lowest)
> Black unemployment rate: 11.6% (7th highest)
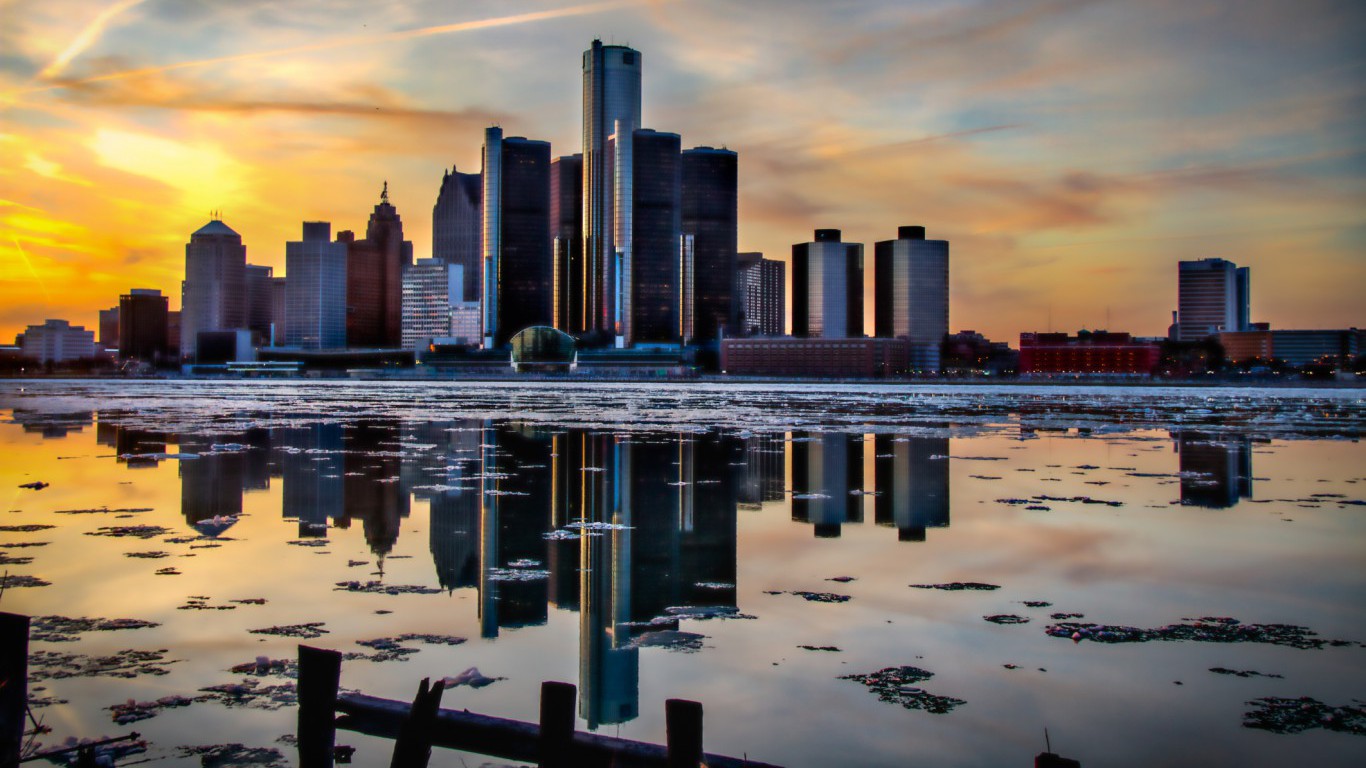
Like the rest of the country, unemployment among black Michigan workers is much higher than among white workers and is but one piece of a much larger entrenched cycle of inequality. The unemployment rate among the black workforce of 11.6% is far higher than the rate among the state’s white workforce of 4.5%.
Relatively high unemployment rates are partially the result of lower educational attainment. While educational attainment levels are lower than average for both whites and blacks in Michigan, black residents are much less likely to complete high school or earn a bachelor’s degree than their white neighbors. About 92% of white adults in the state have completed at least high school, a significantly larger share than the black high school attainment rate of about 84%. Additionally, while 28.4% of white Michigan adults have a bachelor’s degree, only 16.9% of black residents have similar educational attainment.
[in-text-ad]
14. Ohio
> Pct. residents black: 12.1% (17th highest)
> Black homeownership rate: 35.3% (22nd lowest)
> Black incarceration rate: 2,336 per 100,000 (23rd lowest)
> Black unemployment rate: 10.9% (11th highest)
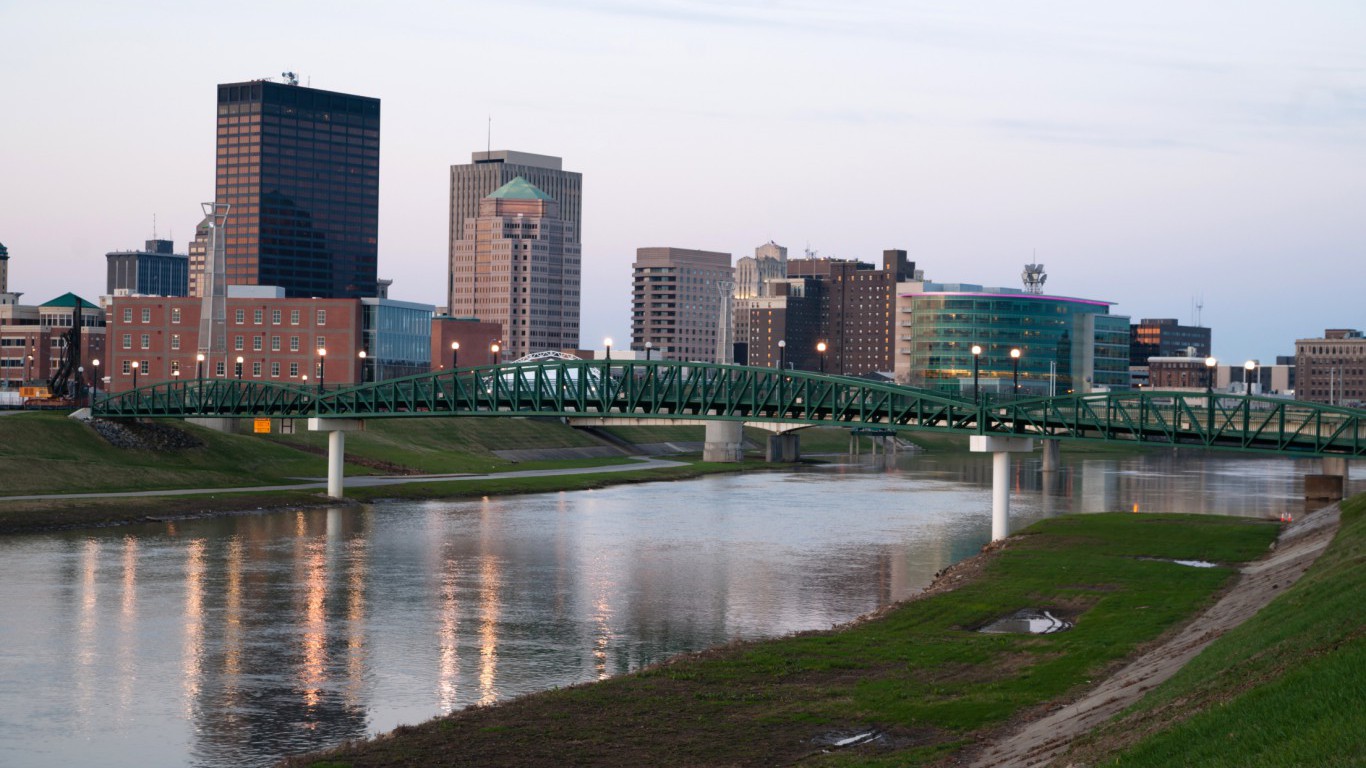
Ohio is one of the worst states for black Americans. Nearly 35% of African Americans in the state live in poverty, the third highest proportion of all states and well more than double the poverty rate of Ohio’s white residents of 12.2%. Financial constraints often contribute in poor health, education and other social outcomes. The poverty in Ohio’s black communities partially explains other poor social and health outcomes among black Ohioans. The infant mortality rate in Ohio, for example, while not especially low for residents of either race, is especially high for black women in Ohio. For every 1,000 live births among black mothers in Ohio, an estimated 14 infants die — the highest such rate nationwide. By contrast, the infant mortality rate among white women in Ohio is 6.4 per 1,000 live births.

13. Alaska
> Pct. residents black: 3.2% (14th lowest)
> Black homeownership rate: 21.6% (6th lowest)
> Black incarceration rate: 1,294 per 100,000 (2nd lowest)
> Black unemployment rate: 4.6% (9th lowest)
Alaska is one of only two states in the country where black workers are less likely than white laborers to be unemployed. Just 4.6% of African American Alaskan workers are out of work, the second lowest rate after Hawaii. Compared with black households across the nation, the median income of black Alaskan households, at $47,226, is the fifth highest. African Americans living in Alaska earn far less than their fellow white residents, however. The typical income among white households in Alaska is over $80,000. White Alaskans are less likely to own their homes than white Americans across the country. Still, the white homeownership rate of 67.8% is more than three times greater than that of black residents which, at 21.6%, is also well below the national black homeownership rate of 41.2%.
12. Kansas
> Pct. residents black: 5.7% (23rd lowest)
> Black homeownership rate: 35.6% (23rd lowest)
> Black incarceration rate: 3,306 per 100,000 (9th highest)
> Black unemployment rate: 6.6% (13th lowest)
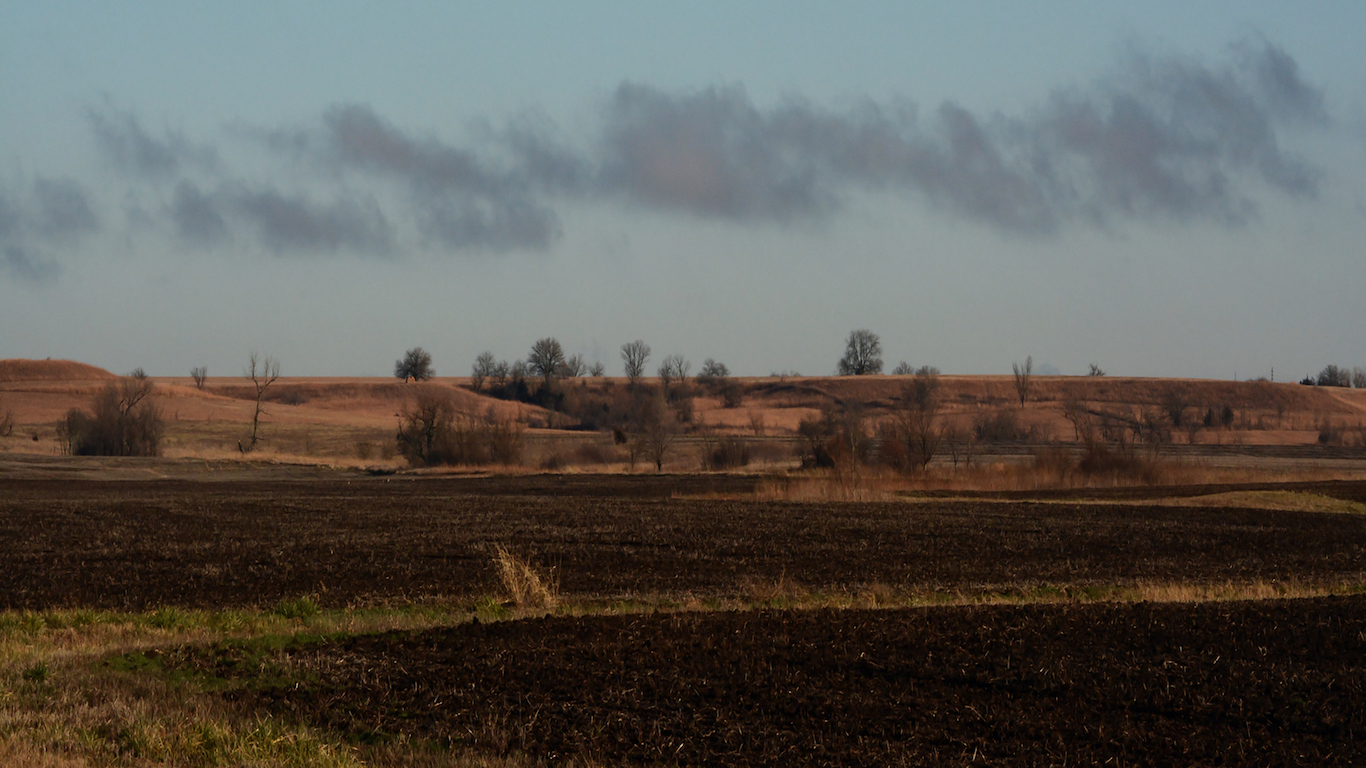
The single greatest source of wealth for a family is property. As evidence of the racial wealth gap — nationwide, the wealth of black families is just 5% that of white families — black families in Kansas are about half as likely to own their homes compared to white families in the state. Of black households, 35.6% own their homes, versus the white homeownership rate of 70.9%.
As is the case in every state in the nation, the incarceration rate among black Kansas residents dwarfs that of white residents. For every 100,000 black people living in the state, 3,306 are in prison, in contrast with the white incarceration rate of 418 per 100,000.
11. Pennsylvania
> Pct. residents black: 10.6% (20th highest)
> Black homeownership rate: 42.1% (16th highest)
> Black incarceration rate: 3,269 per 100,000 (10th highest)
> Black unemployment rate: 10.5% (16th highest)
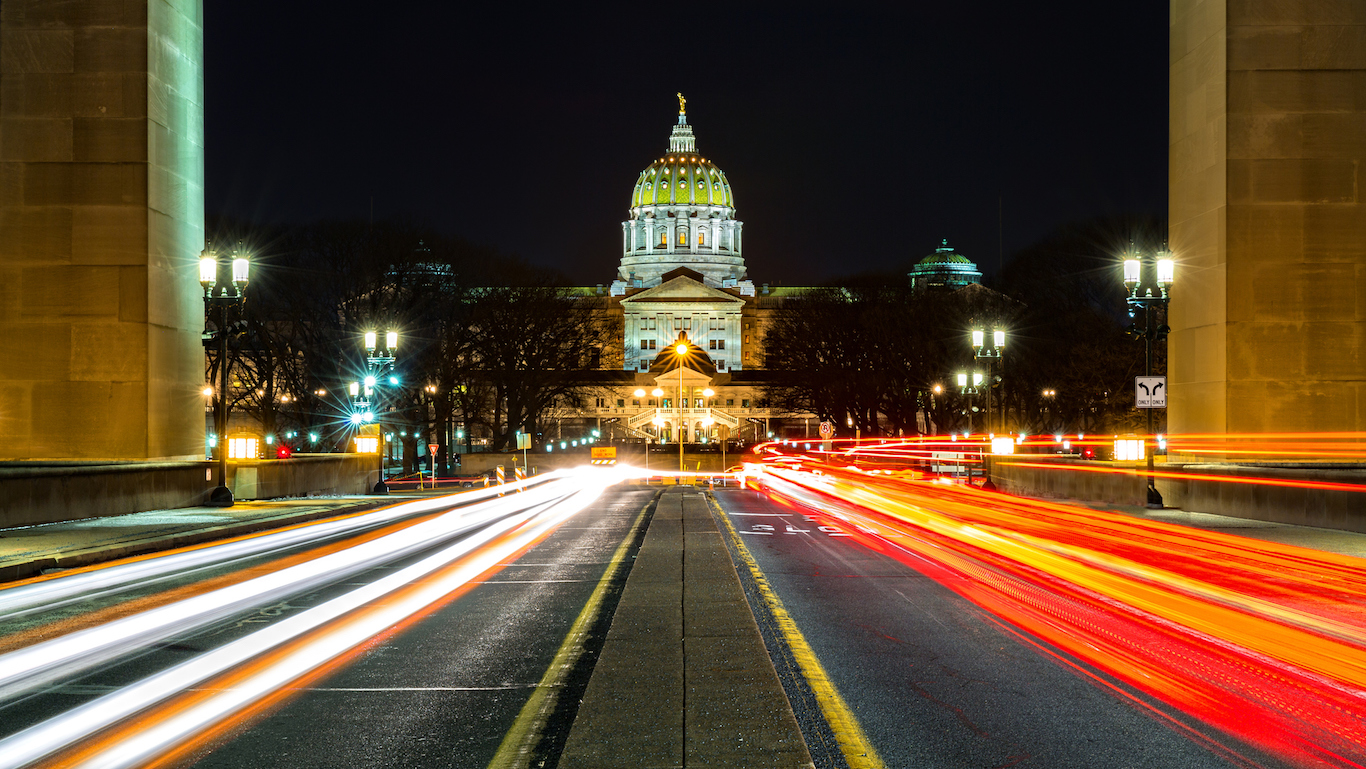
The poverty rate among whites in Pennsylvania is lower than the national white poverty rate, while the poverty rate among the black population is higher than the national black poverty rate. Only four other states in the country have such disproportionate poverty rates. The 29.5% poverty rate among blacks in the Keystone State is roughly three times the poverty rate among the state’s white population. In Pennsylvania, high poverty accompanies lower educational attainment. While 30.5% of white adults in Pennsylvania have a bachelor’s degree, only 16.4% of black adults have similar educational attainment.
High poverty and poor education in Pennsylvania’s black communities likely contributes to worst social outcomes. The incarceration rate among the state’s white population is 375 incarcerations for every 100,000 whites, below the national rate of 450 incarcerations per 100,000 white Americans. Meanwhile, the incarceration rate among the state’s black population of 3,269 for every 100,000 black residents is significantly higher than the national rate of about 2,306 incarcerations for every 100,000 black Americans.

10. Iowa
> Pct. residents black: 3.1% (13th lowest)
> Black homeownership rate: 30.4% (15th lowest)
> Black incarceration rate: 3,473 per 100,000 (8th highest)
> Black unemployment rate: 14.8% (the highest)
Compared with most states, there are relatively few black residents in Iowa. Compared to white state residents, African American Iowa residents are far more likely to live in poverty. The poverty rate among black state residents of 34.4% is higher than the national black poverty rate of 27.0%. It is also more than three times greater than the poverty rate among white residents of 10.5%, inline with the national white poverty rate of 10.8%. Similarly, the percentage of white laborers looking for work, at 3.2%, is lower than the national white unemployment rate of 4.6%. Meanwhile, 14.8% of black Iowan workers are unemployed, well above the national black unemployment rate of 9.6% — and more than 4.5 greater than the white jobless rate.
Iowa’s incarceration rate is even more divided along racial lines. For every 100,000 black Iowans, 3,473 are in prison, the eighth highest such rate of all states. For every 100,000 white residents, by contrast, only 324 are incarcerated, one of the lower such rates.
[in-text-ad]

9. Nebraska
> Pct. residents black: 4.6% (19th lowest)
> Black homeownership rate: 31.4% (18th lowest)
> Black incarceration rate: 2,452 per 100,000 (23rd highest)
> Black unemployment rate: 5.3% (10th lowest)
Compared with black residents in other states, African Americans living in Nebraska are relatively well educated and seem to have more job opportunities. The percentage of black adults with at least a bachelor’s degree and the percentage of black laborers out of a job, at 24.2% and 5.3%, respectively, are considerably better than the comparable rates across the nation.
While for many white Americans, a college degree and gainful employment all but guarantee good economic outcomes, like owning a home, for black Nebraska residents this does not appear to be the case. Just 31.4% of black householders own their homes, well below the national black homeownership rate of 41.2% and in stark contrast with the white Nebraska homeownership rate of 70.0%.
8. Colorado
> Pct. residents black: 3.8% (17th lowest)
> Black homeownership rate: 35.9% (24th lowest)
> Black incarceration rate: 3,651 per 100,000 (5th highest)
> Black unemployment rate: 5.9% (11th lowest)
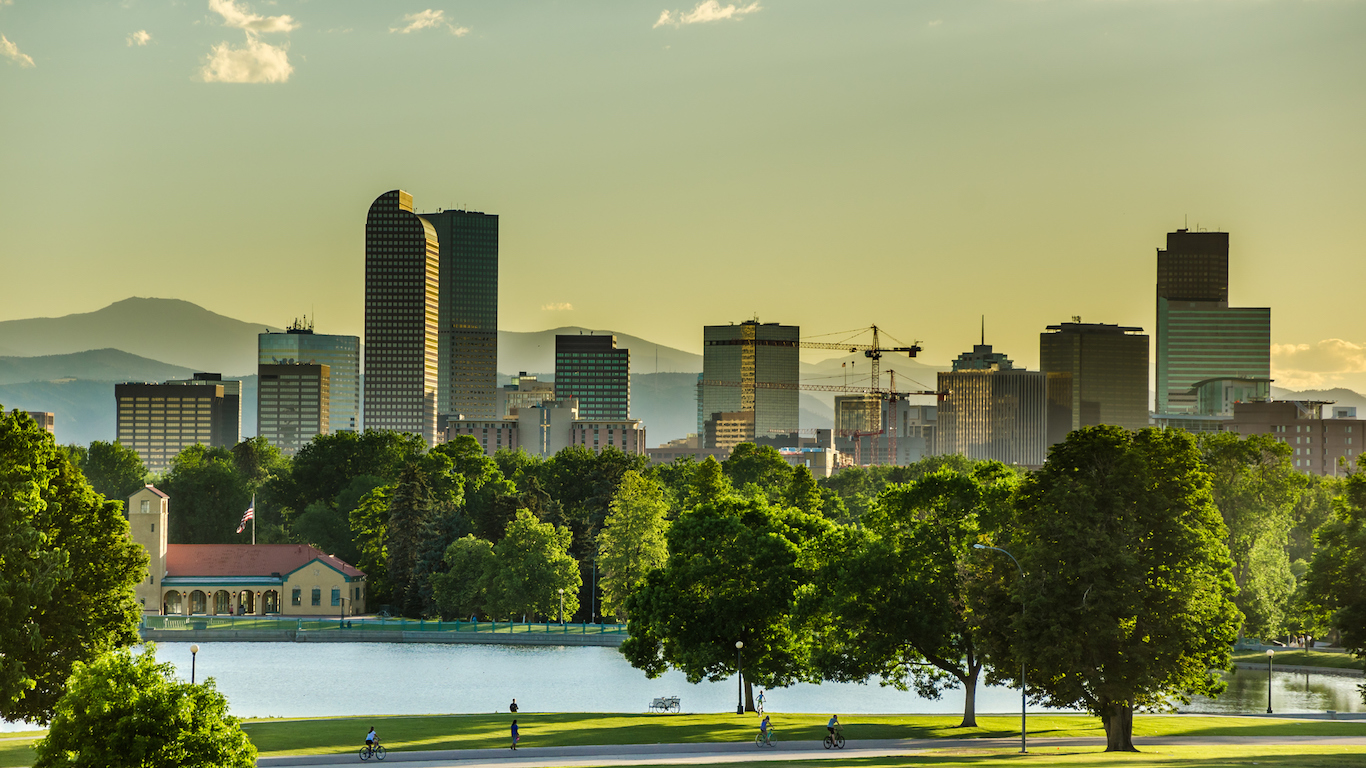
Colorado residents are among the most well-off in the country. As in every state, however, the prosperity is largely distributed along racial lines. The unemployment rate among black workers in the state, at 5.9%, is lower than the national black unemployment rate of 9.6%. However, it is still well above the jobless rates for whites both in Colorado and nationally, at 3.8% and 4.6%, respectively. Black Colorado residents are also far more likely to go to prison compared with their white peers. For every 100,000 black Colorado residents, 3,651 are in prison, the fifth highest figure compared with black populations of other states and several times greater than Colorado’s white incarceration rate of 509 per 100,000.
Economic disadvantages such as these can contribute to adverse health outcomes. For black mothers living in the state, the infant mortality rate is over 10 deaths per 1,000 live births — close to double the rate among white Colorado mothers and mirroring the national difference.

7. Louisiana
> Pct. residents black: 32.1% (2nd highest)
> Black homeownership rate: 46.9% (7th highest)
> Black incarceration rate: 2,749 per 100,000 (18th highest)
> Black unemployment rate: 9.7% (22nd highest)
Black Louisiana residents make up 32.1% of the state’s population, more than twice the national proportion and the second highest of all states after only Mississippi. Despite the relatively large black population, Louisiana is one of the worst states for African Americans.
As is the case nationwide, black Louisiana residents are far more likely to go to prison than their white peers. The incarceration rate among white state residents, at 675 per 100,000 white Louisianans, is the fourth highest among whites nationwide. It is still much lower than the incarceration rate among black residents of 2,749 per 100,000 African American residents, which is just the 18th highest compared to other states’ black populations. Black families in Louisiana are among the most likely to own their home, with 46.9% of homes with black heads of household owned by their occupants, the second highest such rate in the nation. However, the rate is still in stark contrast with the white homeownership rate of 74.4%. Similarly, a typical black household earns just over 50% of the white median household income of $52,940, itself not particularly high compared to white households nationwide.
6. New Jersey
> Pct. residents black: 12.8% (16th highest)
> Black homeownership rate: 37.8% (22nd highest)
> Black incarceration rate: 1,992 per 100,000 (13th lowest)
> Black unemployment rate: 10.0% (tied – 20th highest)
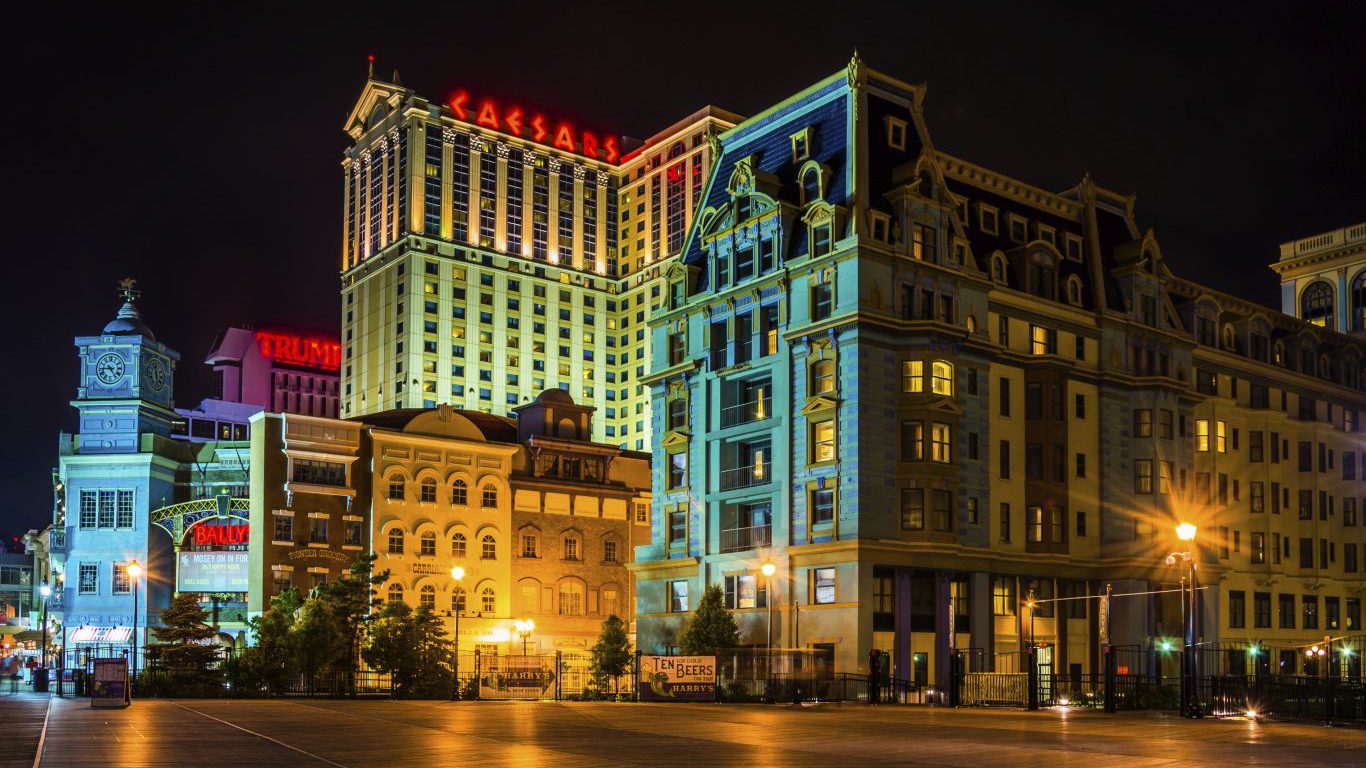
The poverty rate among white residents in New Jersey of 6.4% is well below the national poverty rate of 15.5%. Black residents, however, are more than three times as likely to live in poverty as their white counterparts, with nearly 20% of New Jersey’s African American residents living in poverty. Homeownership rates are usually divided along racial lines, and New Jersey is no exception. Three out of every four homes with white heads of households are owned by their occupants, compared to a black homeownership rate of just 37.8%.
As is the case nationwide, incarceration rates in New Jersey are substantially higher for the African American population than for white residents. Out of every 100,000 black state residents, nearly 1,000 are incarcerated, roughly five times the incarceration rate among white New Jersey residents.
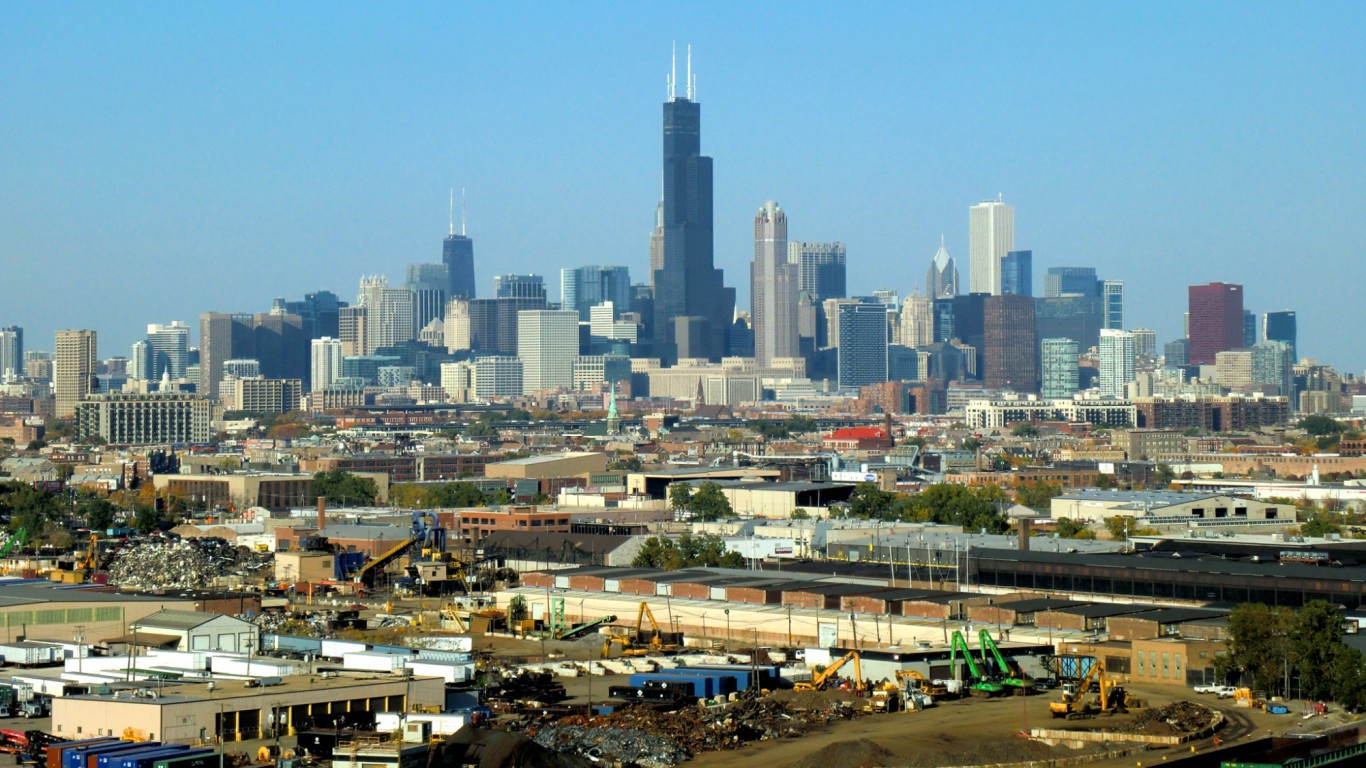
5. Illinois
> Pct. residents black: 14.1% (14th highest)
> Black homeownership rate: 38.5% (21st highest)
> Black incarceration rate: 2,128 per 100,000 (17th lowest)
> Black unemployment rate: 12.2% (tied – 5th highest)
By many measures, whites do better in Illinois than they do nationally, while the opposite is true for black state residents. The annual income of a typical white household in Illinois exceeds the corresponding national figure by about $5,000. Conversely, the typical black household in Illinois earns about $2,000 less than the typical American black household, and barely half of what the typical white household makes. Poverty rates along racial lines echo the income discrepancy in Illinois. While 10.8% of whites nationwide live in poverty, only 9.3% of whites in Illinois do. In contrast, the national black poverty rates of 27.0% is significantly lower than the corresponding state rate of 30.6%.
Lower incomes in the state accompany lower homeownership rates. While nearly three quarters of whites in Illinois own the home they live in, the homeownership rate among black residents is just under 39%. The black homeownership rate nationally is slightly higher, at 41.2%.
[in-text-ad]

4. Florida
> Pct. residents black: 15.5% (12th highest)
> Black homeownership rate: 43.7% (14th highest)
> Black incarceration rate: 2,555 per 100,000 (22nd highest)
> Black unemployment rate: 9.0% (25th lowest)
Driven in part by a relatively high incarceration rate, black Americans in Florida are the most likely to be disenfranchised. Nearly one in four black Florida residents have had their right to vote revoked in some way, the highest proportion in the country. In absolute terms, 520,521 black individuals living in Florida are disenfranchised, also the highest number in the nation.
The infant mortality rate within the black population in Florida, at 11.8 deaths per 1,000 live births, is slightly higher than the nationwide rate of 11.0 deaths per 1,000 births among black American mothers. At the same time, however, the infant mortality rate among the white population in Florida, at 5.0 deaths per 1,000 live births, is lower than the comparable national figure.

3. Virginia
> Pct. residents black: 18.9% (9th highest)
> Black homeownership rate: 46.2% (8th highest)
> Black incarceration rate: 2,418 per 100,000 (25th highest)
> Black unemployment rate: 7.9% (18th lowest)
Across the country, median annual income of black households is about $24,000 lower than the median income of white households. The income disparity in Virginian is even greater. Even though black households tend to earn more in Virginia than they do across the country, the typical black household in the state earns about $27,000 less than the typical white household.
Subject to some of the strictest disenfranchisement laws in the country, the black community in Virginia is among the most politically debilitated in the country. Nearly a quarter of a million blacks in the state — roughly a fifth of the black population — are ineligible to exercise their democratic right to vote. Only Florida and Kentucky have a higher share of disenfranchised black residents.
2. Minnesota
> Pct. residents black: 5.6% (22nd lowest)
> Black homeownership rate: 23.8% (8th lowest)
> Black incarceration rate: 2,321 per 100,000 (22nd lowest)
> Black unemployment rate: 14.1% (2nd highest)
The disproportionate incarceration of black Americans has been well-documented — and Minnesota is one of the worst cases. Just 216 out of every 100,000 of the state’s caucasian population is in prison, the second lowest incarceration rate among whites in the country. Meanwhile, 2,321 of every 100,000 black Minnesota residents are imprisoned, which is the 22nd lowest rate among blacks. Black families tend to earn less money than white families, and that disparity is pronounced in Minnesota. A typical black household in Minnesota brings in just $27,026 a year, less than half of the typical white household’s income.
1. Wisconsin
> Pct. residents black: 6.2% (24th lowest)
> Black homeownership rate: 25.8% (10th lowest)
> Black incarceration rate: 4,042 per 100,000 (3rd highest)
> Black unemployment rate: 11.1% (9th highest)
Wisconsin is the worst state in the country for black Americans. The median annual income of black households in the state is just $26,053, much lower than the median for black families nationwide and equal to just 46.5% the median income of white Wisconsin households of $56,083. Similarly, while 29.9% of white adults in Wisconsin have at least a bachelor’s degree, 12.8% of black adults in the state have completed college. This is also much lower than the bachelor degree attainment rate among black adults nationwide of 19.7%. The unemployment gap between black and white state residents is also troubling. With a white jobless rate of 4.1%, the state’s job market is relatively strong for the white population. For black Wisconsin residents, however, the unemployment rate is 11.1% — higher than the national unemployment rate for all black Americans.
METHODOLOGY
To review black and white racial inequality in every state, 24/7 Wall St. created an index of 10 measures to assess racial gaps in access to resources and opportunities in each state. Creating the index in this way highlighted disparities between racial groups, rather than what may be particularly poor socioeconomic climates for both whites and blacks. For each measure, we constructed an index from the gaps between black and white Americans. The index was standardized using min-max normalization.
To construct the index, we used 2014 data from the U.S. Census Bureau’s American Community Survey (ACS) on median household income, poverty, high school and bachelor’s educational attainment rates, and homeownership rates — each broken out by race. Unemployment rates for 2015 came from the Bureau of Labor Statistics. Incarceration rates came from the Prison Policy Initiative, a Massachusetts-based think tank, and are as of 2010, the most recent year for which data is available. Also from 2010, the percentage of the population that is disenfranchised came from the Sentencing Project. From the Centers for Disease Control and Prevention, we considered age-adjusted mortality rates and infant mortality rates.
Start by taking a quick retirement quiz from SmartAsset that will match you with up to 3 financial advisors that serve your area and beyond in 5 minutes, or less.
Each advisor has been vetted by SmartAsset and is held to a fiduciary standard to act in your best interests.
Here’s how it works:
1. Answer SmartAsset advisor match quiz
2. Review your pre-screened matches at your leisure. Check out the advisors’ profiles.
3. Speak with advisors at no cost to you. Have an introductory call on the phone or introduction in person and choose whom to work with in the future
Get started right here.
Thank you for reading! Have some feedback for us?
Contact the 24/7 Wall St. editorial team.