
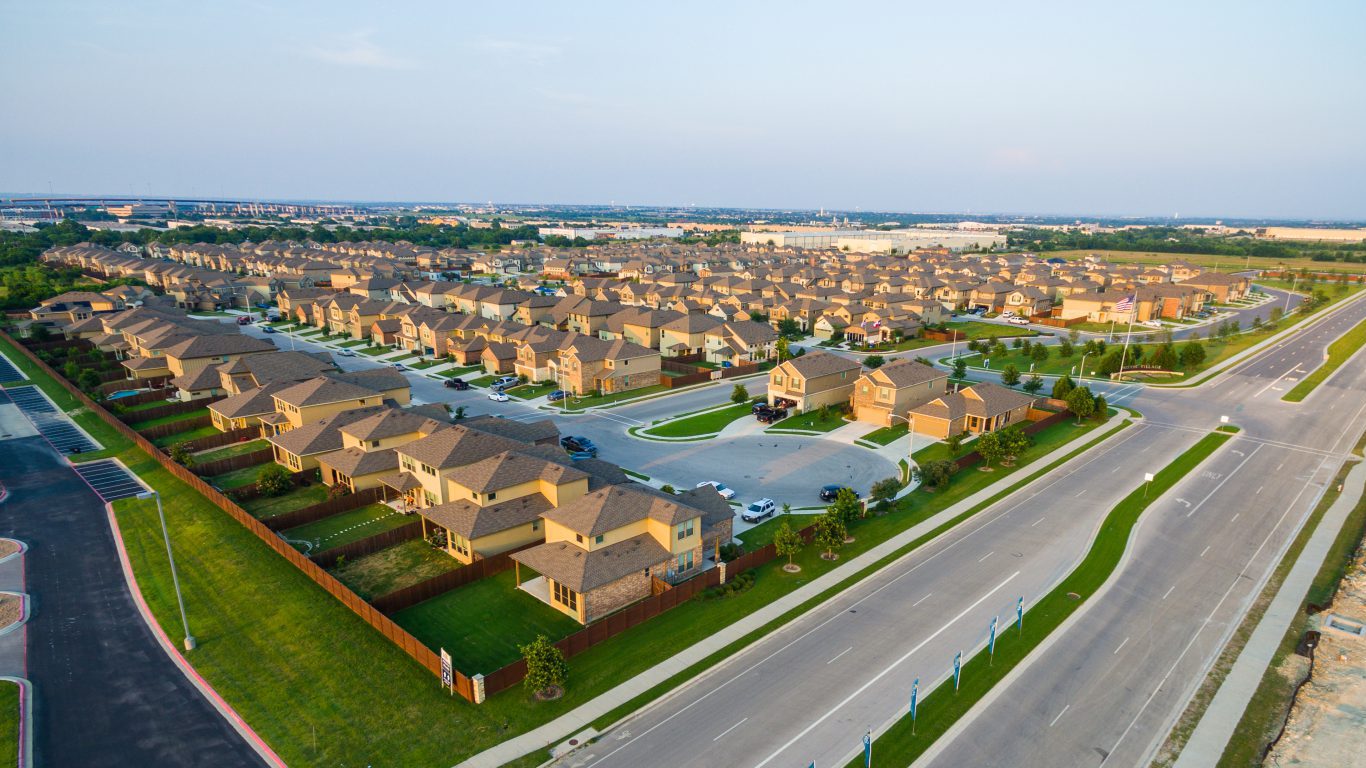
Housing prices vary considerably between metro areas. To determine the most and least expensive housing markets, 24/7 Wall St. reviewed median single-family home prices from the National Association of Realtors. In contrast to San Jose-Sunnyvale-Santa Clara, California the least expensive U.S. housing market is Youngstown-Warren-Boardman, located on the border between Ohio and Pennsylvania, with a median home price of only $85,400.
Housing prices tend to correlate with an area’s median household income. Not only is San Jose the most expensive U.S. housing market, but it also has the highest median household income, at $96,481 a year. Incomes are almost always higher in areas with relatively expensive housing, while the opposite tends to be true in the least expensive markets.
Click here to see the most expensive housing markets.
Click here to see the most expensive housing markets.
Although incomes tend to be higher in expensive housing markets, homes are considerably less affordable in these markets. Nationwide, the median household income is more than enough to qualify for a mortgage to purchase a typical home. In the San Jose region, by contrast, a household would need to earn more than double the median income in the area to qualify for a loan on a typical home. With a 20% down payment, a minimum annual income of $198,355 is needed to qualify for a mortgage on a typical San Jose area home.
By contrast, while the median household income in Youngstown is only $42,228 annually, a typical home is considerably more affordable. With a 20% down payment, an area household earning just $15,612 a year could qualify for a loan. This means that a person earning minimum wage in the area could afford to purchase a home.
Because owning a home in the cheapest markets is much easier, homeownership rates tend to be higher in these areas. Homeownership rates are higher than the national rate in 24 of the 25 cheapest markets. The opposite is true in expensive markets, with the homeownership rates lower than the national rate in the majority of areas.
To identify the most and least expensive housing markets, 24/7 Wall St. reviewed median single-family home prices in the second quarter of 2016 as released by the National Association of Realtors. Qualifying incomes assuming a 20% down payment for metro areas are also from the NAR for the same time period. Median household incomes and homeownership rates are from the U.S. Census Bureau’s 2014 American Community Survey. We calculated monthly mortgage payments using a 3.9% interest rate and assuming a 20% down payment — the same measures used by the NAR to compare housing affordability at the metro area level.
These are the 25 most (and 25 least) expensive housing markets.
America’s Most Expensive Housing Markets
25. Austin-Round Rock, TX
> 2016 Q2 median sale price: $289,100
> Qualifying income w. 20% down: $52,852
> Median household income: $63,603
> Monthly payment: $1,091

24. Reno, NV
> 2016 Q2 median sale price: $307,900
> Qualifying income w. 20% down: $56,289
> Median household income: $52,728
> Monthly payment: $1,162

23. Miami-Fort Lauderdale-West Palm Beach, FL
> 2016 Q2 median sale price: $310,000
> Qualifying income w. 20% down: $56,673
> Median household income: $48,458
> Monthly payment: $1,170

22. Burlington-South Burlington, VT
> 2016 Q2 median sale price: $313,200
> Qualifying income w. 20% down: $57,258
> Median household income: $61,947
> Monthly payment: $1,182
 24/7 Wall St.
21. Riverside-San Bernardino-Ontario, CA
> 2016 Q2 median sale price: $315,500
> Qualifying income w. 20% down: $57,678
> Median household income: $54,586
> Monthly payment: $1,190

20. Sacramento–Roseville–Arden-Arcade, CA
> 2016 Q2 median sale price: $323,700
> Qualifying income w. 20% down: $59,178
> Median household income: $60,015
> Monthly payment: $1,221
19. Portland-Vancouver-Hillsboro, OR-WA
> 2016 Q2 median sale price: $356,700
> Qualifying income w. 20% down: $65,210
> Median household income: $60,248
> Monthly payment: $1,346

18. New York-Jersey City-White Plains, NY-NJ
> 2016 Q2 median sale price: $366,600
> Qualifying income w. 20% down: $67,020
> Median household income: N/A
> Monthly payment: $1,383

17. Barnstable Town, MA
> 2016 Q2 median sale price: $367,400
> Qualifying income w. 20% down: $67,167
> Median household income: $65,384
> Monthly payment: $1,386

16. Bridgeport-Stamford-Norwalk, CT
> 2016 Q2 median sale price: $380,500
> Qualifying income w. 20% down: $69,561
> Median household income: $85,925
> Monthly payment: $1,436

15. Newark, NJ-PA
> 2016 Q2 median sale price: $389,300
> Qualifying income w. 20% down: $71,170
> Median household income: N/A
> Monthly payment: $1,469

14. Denver-Aurora-Lakewood, CO
> 2016 Q2 median sale price: $394,400
> Qualifying income w. 20% down: $72,103
> Median household income: $66,870
> Monthly payment: $1,488
13. New York-Newark-Jersey City, NY-NJ-PA
> 2016 Q2 median sale price: $395,400
> Qualifying income w. 20% down: $72,285
> Median household income: $67,066
> Monthly payment: $1,492

12. Washington-Arlington-Alexandria, DC-VA-MD-WV
> 2016 Q2 median sale price: $406,900
> Qualifying income w. 20% down: $74,388
> Median household income: $91,193
> Monthly payment: $1,535

11. Seattle-Tacoma-Bellevue, WA
> 2016 Q2 median sale price: $420,500
> Qualifying income w. 20% down: $76,874
> Median household income: $71,273
> Monthly payment: $1,587

10. Boston-Cambridge-Newton, MA-NH
> 2016 Q2 median sale price: $435,800
> Qualifying income w. 20% down: $79,671
> Median household income: $75,667
> Monthly payment: $1,644

9. Nassau County-Suffolk County, NY
> 2016 Q2 median sale price: $442,800
> Qualifying income w. 20% down: $80,951
> Median household income: N/A
> Monthly payment: $1,671

8. Naples-Immokalee-Marco Island, FL
> 2016 Q2 median sale price: $449,500
> Qualifying income w. 20% down: $82,176
> Median household income: $58,026
> Monthly payment: $1,696

7. Los Angeles-Long Beach-Glendale, CA
> 2016 Q2 median sale price: $480,000
> Qualifying income w. 20% down: $87,752
> Median household income: N/A
> Monthly payment: $1,811

6. Boulder, CO
> 2016 Q2 median sale price: $549,600
> Qualifying income w. 20% down: $100,476
> Median household income: $71,540
> Monthly payment: $2,074

5. San Diego-Carlsbad, CA
> 2016 Q2 median sale price: $589,900
> Qualifying income w. 20% down: $107,843
> Median household income: $66,192
> Monthly payment: $2,226

4. Urban Hololulu, HI
> 2016 Q2 median sale price: $725,200
> Qualifying income w. 20% down: $132,578
> Median household income: $74,634
> Monthly payment: $2,736

3. Anaheim-Santa Ana-Irvine, CA
> 2016 Q2 median sale price: $742,200
> Qualifying income w. 20% down: $135,686
> Median household income: N/A
> Monthly payment: $2,801

2. San Francisco-Oakland-Hayward, CA
> 2016 Q2 median sale price: $885,600
> Qualifying income w. 20% down: $161,902
> Median household income: $83,222
> Monthly payment: $3,342
 24/7 Wall St.
1. San Jose-Sunnyvale-Santa Clara, CA
> 2016 Q2 median sale price: $1,085,000
> Qualifying income w. 20% down: $198,355
> Median household income: $96,481
> Monthly payment: $4,094
America’s Least Expensive Housing Markets

25. Mobile, AL
> 2016 Q2 median sale price: $133,900
> Qualifying income w. 20% down: $24,479
> Median household income: $43,642
> Monthly payment: $505

24. Springfield, MO
> 2016 Q2 median sale price: $133,200
> Qualifying income w. 20% down: $24,351
> Median household income: $41,248
> Monthly payment: $503

23. Akron, OH
> 2016 Q2 median sale price: $131,100
> Qualifying income w. 20% down: $23,967
> Median household income: $50,538
> Monthly payment: $495
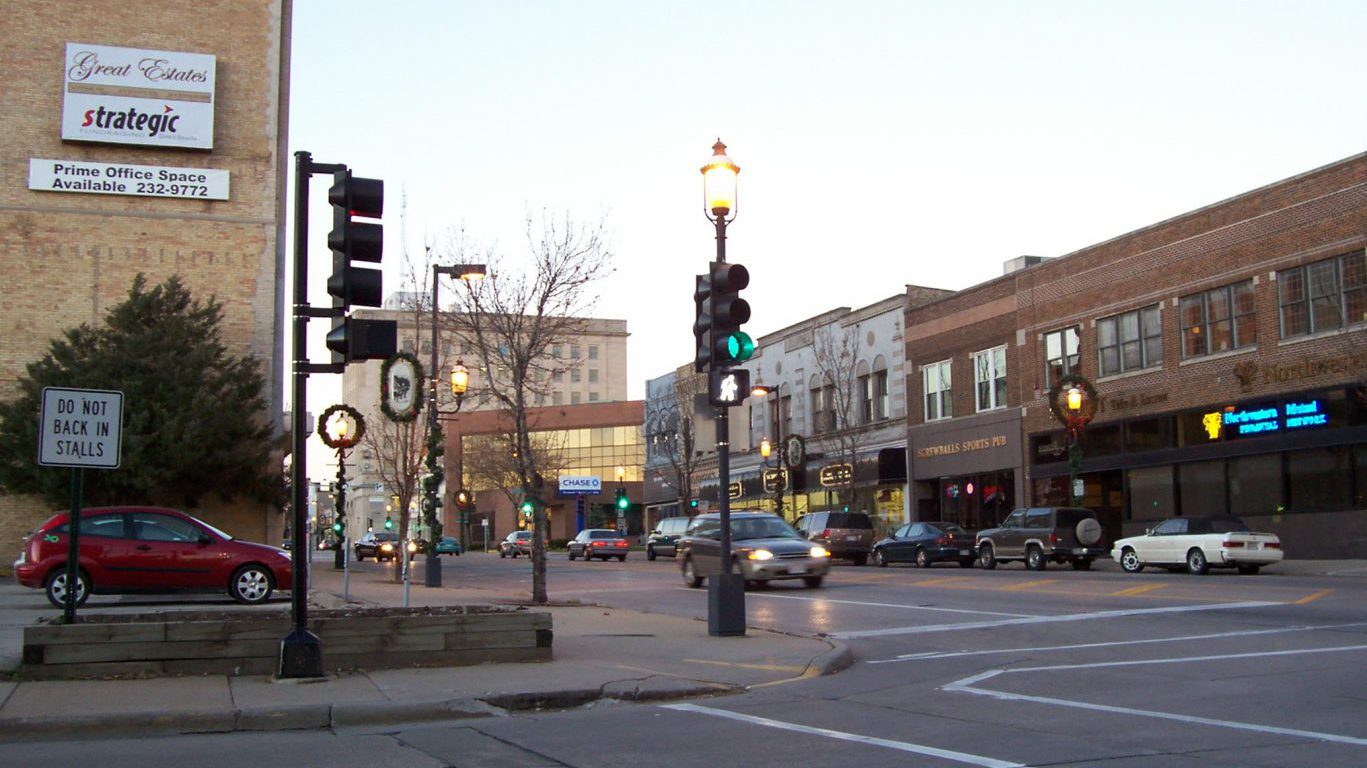
22. Oshkosh-Neenah, WI
> 2016 Q2 median sale price: $130,300
> Qualifying income w. 20% down: $23,821
> Median household income: $52,387
> Monthly payment: $492

21. Topeka, KS
> 2016 Q2 median sale price: $129,800
> Qualifying income w. 20% down: $23,730
> Median household income: $54,388
> Monthly payment: $490

20. Decatur, AL
> 2016 Q2 median sale price: $129,600
> Qualifying income w. 20% down: $23,693
> Median household income: $44,600
> Monthly payment: $489

19. Buffalo-Cheektowaga-Niagara Falls, NY
> 2016 Q2 median sale price: $129,600
> Qualifying income w. 20% down: $23,693
> Median household income: $50,074
> Monthly payment: $489
 24/7 Wall St.
18. Fort Wayne, IN
> 2016 Q2 median sale price: $128,400
> Qualifying income w. 20% down: $23,474
> Median household income: $49,405
> Monthly payment: $484

17. Syracuse, NY
> 2016 Q2 median sale price: $128,400
> Qualifying income w. 20% down: $23,474
> Median household income: $51,915
> Monthly payment: $484

16. Canton-Massillon, OH
> 2016 Q2 median sale price: $128,200
> Qualifying income w. 20% down: $23,437
> Median household income: $47,729
> Monthly payment: $484

15. Ocala, FL
> 2016 Q2 median sale price: $128,000
> Qualifying income w. 20% down: $23,400
> Median household income: $39,958
> Monthly payment: $483

14. Fond du Lac, WI
> 2016 Q2 median sale price: $126,200
> Qualifying income w. 20% down: $23,071
> Median household income: $51,717
> Monthly payment: $476

13. Davenport-Moline-Rock Island, IA-IL
> 2016 Q2 median sale price: $125,500
> Qualifying income w. 20% down: $22,943
> Median household income: $51,410
> Monthly payment: $474

12. Toledo, OH
> 2016 Q2 median sale price: $125,100
> Qualifying income w. 20% down: $22,870
> Median household income: $45,603
> Monthly payment: $472
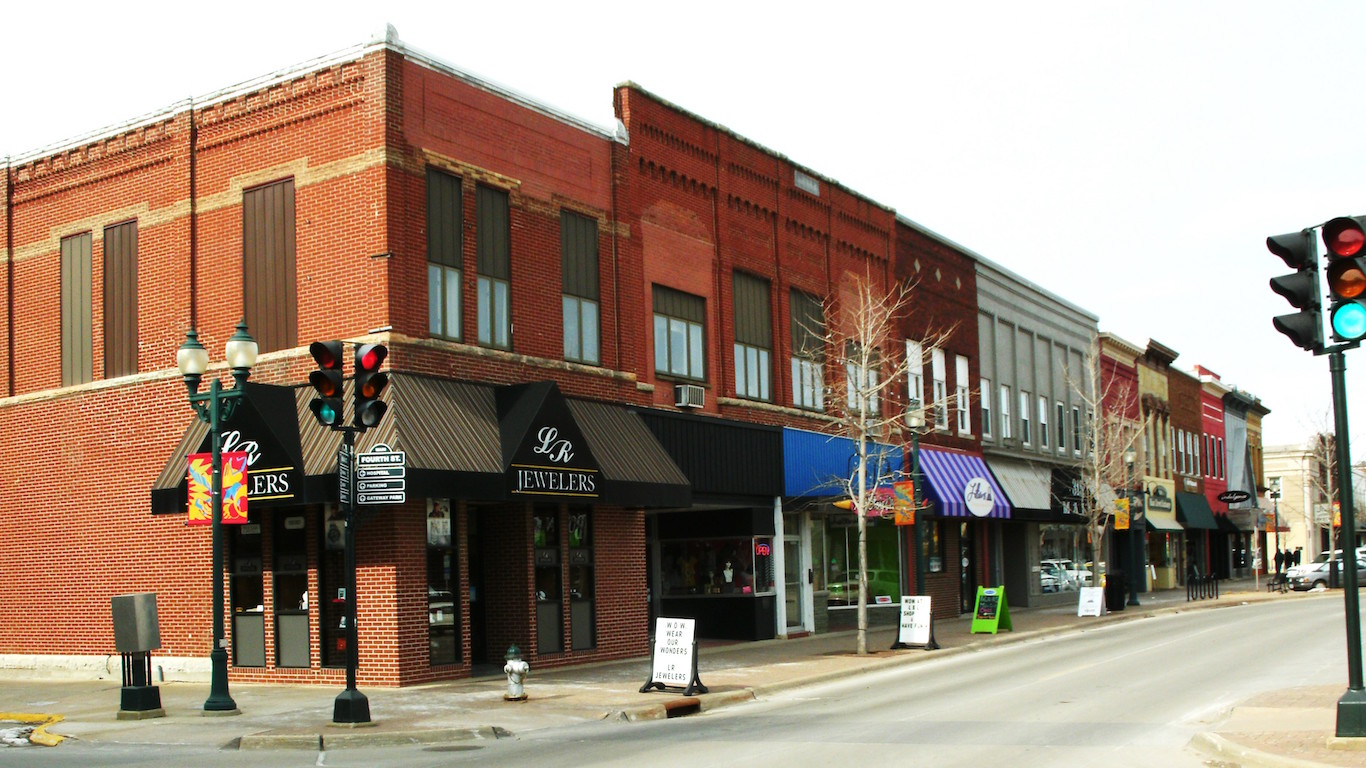
11. Waterloo-Cedar Falls, IA
> 2016 Q2 median sale price: $124,700
> Qualifying income w. 20% down: $22,797
> Median household income: $52,991
> Monthly payment: $471

10. South Bend-Mishawaka, IN-MI
> 2016 Q2 median sale price: $121,800
> Qualifying income w. 20% down: $22,267
> Median household income: $46,610
> Monthly payment: $460

9. Peoria, IL
> 2016 Q2 median sale price: $120,500
> Qualifying income w. 20% down: $22,029
> Median household income: $56,186
> Monthly payment: $455

8. Elmira, NY
> 2016 Q2 median sale price: $115,600
> Qualifying income w. 20% down: $21,134
> Median household income: $50,232
> Monthly payment: $436

7. Erie, PA
> 2016 Q2 median sale price: $115,100
> Qualifying income w. 20% down: $21,042
> Median household income: $45,560
> Monthly payment: $434
 24/7 Wall St.
6. Wichita Falls, TX
> 2016 Q2 median sale price: $109,800
> Qualifying income w. 20% down: $20,073
> Median household income: $43,804
> Monthly payment: $414

5. Rockford, IL
> 2016 Q2 median sale price: $109,000
> Qualifying income w. 20% down: $19,927
> Median household income: $48,385
> Monthly payment: $411

4. Binghamton, NY
> 2016 Q2 median sale price: $105,500
> Qualifying income w. 20% down: $19,287
> Median household income: $48,188
> Monthly payment: $398

3. Decatur, IL
> 2016 Q2 median sale price: $95,600
> Qualifying income w. 20% down: $17,477
> Median household income: $47,574
> Monthly payment: $361

2. Cumberland, MD-WV
> 2016 Q2 median sale price: $94,900
> Qualifying income w. 20% down: $17,349
> Median household income: $38,580
> Monthly payment: $358

1. Youngstown-Warren-Boardman, OH-PA
> 2016 Q2 median sale price: $85,400
> Qualifying income w. 20% down: $15,612
> Median household income: $42,228
> Monthly payment: $322
In 20 Years, I Haven’t Seen A Cash Back Card This Good
After two decades of reviewing financial products I haven’t seen anything like this. Credit card companies are at war, handing out free rewards and benefits to win the best customers.
A good cash back card can be worth thousands of dollars a year in free money, not to mention other perks like travel, insurance, and access to fancy lounges.
Our top pick today pays up to 5% cash back, a $200 bonus on top, and $0 annual fee. Click here to apply before they stop offering rewards this generous.
Flywheel Publishing has partnered with CardRatings for our coverage of credit card products. Flywheel Publishing and CardRatings may receive a commission from card issuers.
Thank you for reading! Have some feedback for us?
Contact the 24/7 Wall St. editorial team.
Latest from 24/7


Our expert who first called NVIDIA in 2009 is predicting 2025 will see a historic AI breakthrough.
You can follow him investing $500,000 of his own money on our top AI stocks for free.