Special Report
Cities With the Fastest Growing (and Shrinking) Economies

Published:
Last Updated:

The economies of the vast majority of U.S. metropolitan areas expanded last year. In aggregate, GDP across the nation’s 382 metro areas grew by 2.5%, up from a 2.3% growth rate the previous year.
Last year’s growth was far from even across metropolitan areas. GDP grew by more than 6% in 10 of the metropolitan areas. The economy of Midland, Texas expanded by 9.4%, more than any metropolitan area in the country. Meanwhile, the GDP of 10 metro area economies shrank by more than 3%. The largest economic contraction was in Bloomington, Illinois, where GDP declined by 8%. Based on data released by the Bureau of Economic Analysis for 2015, 24/7 Wall St. reviewed the cities with the fastest growing and shrinking economies.
[in-text-ad]
Three sectors contributed most to national GDP growth: the professional and business services sector, followed by the trade industry and the finance, insurance, real estate, rental, and leasing sector. These sectors were often the largest contributors to economic growth in the fastest growing cities. For example, the professional and business services sector alone accounted for 2.75 percentage points of the San Jose metro area’s 8.9% expansion.
Click here to see the cities with the fastest growing economies.
Click here to see the cities with the fastest shrinking economies.
However, metropolitan economies are very diverse, and the largest contributors to growth were in many cases industries that grew relatively slowly on a national scale. For example, the natural resources and mining sector contributed just 0.2 percentage points to national GDP growth, but it contributed 5.9 and 12.9 percentage points to the Visalia-Porterville, California and Midland, Texas metro areas’ growth rates, respectively.
Since GDP is the value of goods and services in an economy, GDP growth is the increase in that value. Industries contribute to this growth by increasing the profits they generate and the total income of their employees. For this reason, an area’s GDP rises when incomes in an industry rise or the industry employs more people. GDP falls if the opposite is true.
Consequently, the metropolitan areas with the largest GDP growth rates also tend to have significant increases in employment. Visalia and Bend, Oregon, two of the fastest growing economies in 2015, had among the top five employment growth rates, at 4.4% and 5.7%, respectively.
On the other hand, employment in the fastest shrinking economies either increased by less than 1% or contracted. Employment in Houma-Thibodaux, Louisiana and Odessa, Texas, two of the fastest shrinking economies in 2015, fell by 6.5% and 8.2%, respectively, in 2015.
To identify the metropolitan areas with the fastest growing (and shrinking) economies, 24/7 Wall St. reviewed the highest and lowest real gross domestic product growth rates in 2015 among the nation’s 382 metropolitan statistical areas from the Bureau of Economic Analysis. The BEA also estimated the contribution of each major industry to GDP growth or decline. Annual average unemployment rates and total annual employment figures are from the Bureau of Labor Statistics. Industry employment composition and earnings are based on data collected by the U.S. Census Bureau’s American Community Survey. Additional demographic measures, including household income, population, and median home values are from the Census Bureau’s American Community Survey as well.
The Fastest Growing Metro Area Economies
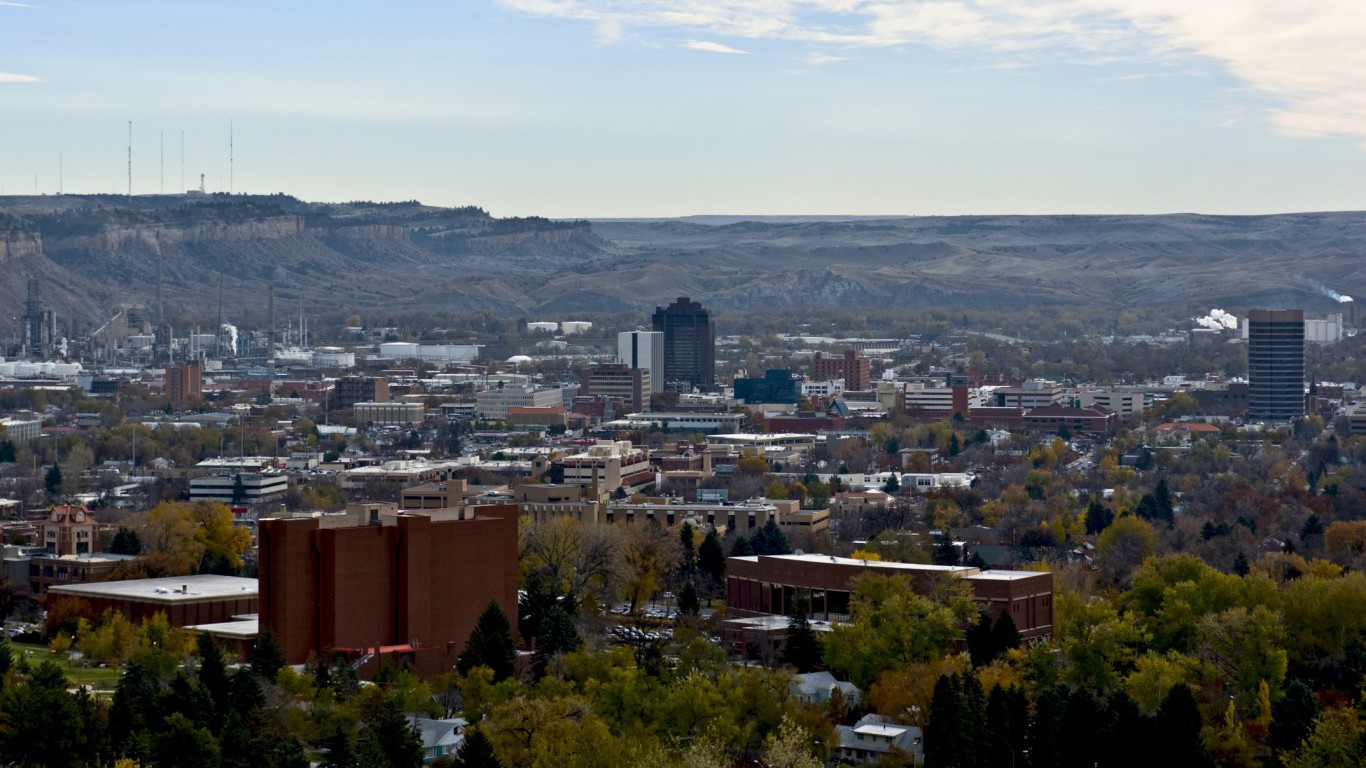
10. Billings, MT
> 2015 GDP growth: 6.0%
> 2015 GDP: $8.78 billion
> Largest contributor to growth: Manufacturing
Billings’s economy grew by 6% in 2015, well more than double the national economic growth. Montana’s economy relies heavily on its coal mining industry — the state has the most coal reserves and is the seventh largest coal producer in the country, despite being the seventh least populous state.
In Billings, the state’s largest city, the mining sector was one of the biggest contributors to the area’s substantial economic growth — but not the biggest. The relatively small manufacturing sector added the most to Billings’ GDP growth.
[in-text-ad]

9. Beaumont-Port Arthur, TX
> 2015 GDP growth: 6.1%
> 2015 GDP: $20.41 billion
> Largest contributor to growth: Manufacturing
The Beaumont-Port Arthur, Texas economy would have remained relatively stagnant if not for the area’s significant growth in its manufacturing sector. Of the area’s 6.1% GDP growth last year, manufacturing contributed 4.8 percentage points. The metropolitan area is home to a large petrochemical refining industry. Low oil prices, which remain relatively low compared to historic highs, do not appear to have meaningfully hindered the industry.
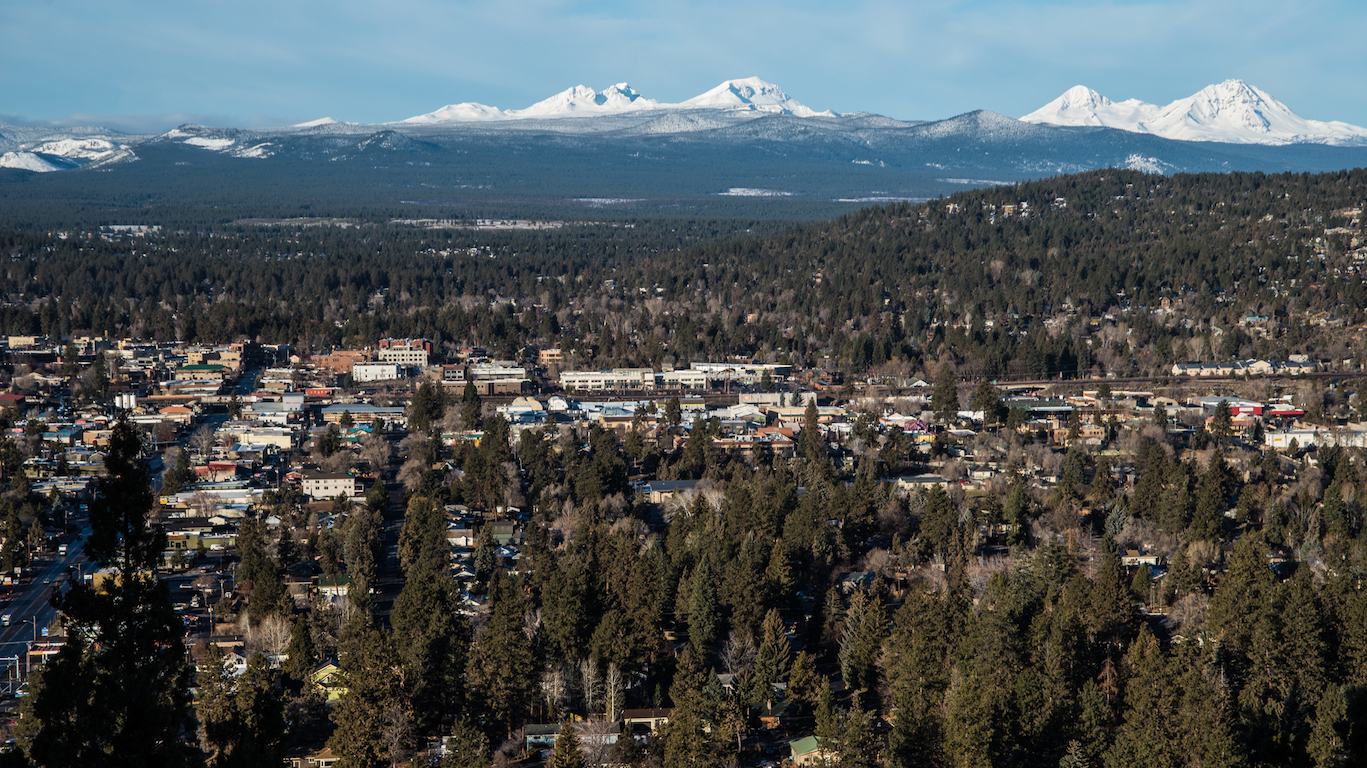
8. Bend-Redmond, OR
> 2015 GDP growth: 6.9%
> 2015 GDP: $6.62 billion
> Largest contributor to growth: Construction
Bend, Oregon has one of the largest construction sectors of any metro area in the country, with 9.1% of the area’s workers employed in the industry. Economic output from the sector also grew meaningfully last year, contributing 1.28 percentage points to the area’s 6.9% GDP growth. The GDP growth often reflects strong employment growth. Unemployment in the central Oregon metropolitan area fell from 7.3% in 2014 to 5.8% in 2015.

7. Raleigh, NC
> 2015 GDP growth: 7.0%
> 2015 GDP: $68.09 billion
> Largest contributor to growth: Finance, insurance, real estate, rental, and leasing
The Raleigh metro area economy grew by 7.0% in 2015, the seventh fastest of any city in the country. Growth was led primarily by the finance, insurance, and real estate industry, which accounted for by far the largest proportion of the area’s economic expansion.
Workforce growth accompanied the increased economic output in Raleigh. Employment in the metro grew by 3.2% in the last year, among the fastest of any city. Also, the price of a typical area home rose from $212,900 in 2014 to $225,000 in 2015, or roughly $30,000 more than the 2015 national median home value. As Raleigh becomes a more attractive place to live and work, home values are likely to rise further.
[in-text-ad]

6. Santa Rosa, CA
> 2015 GDP growth: 7.2%
> 2015 GDP: $23.46 billion
> Largest contributor to growth: Finance, insurance, real estate, rental, and leasing
The Santa Rosa economy is one of three in California to rank among the fastest growing in the country. Economic output from the metro increased by 7.2% in 2015. Growth was led primarily by the metro area’s finance, insurance, and real estate industry, which accounted for 2.1 percentage points of the expansion.
Unlike most cities with increased economic output, the typical household in Santa Rosa did not earn more in 2015 than it did in 2014. Employment in the metro area was also somewhat stagnant, increasing by just 1.5%. The GDP growth in the metro area reflects instead the increased interest, income from rents, and profit — rather than wages — in the Santa Rosa economy.

5. Visalia-Porterville, CA
> 2015 GDP growth: 7.6%
> 2015 GDP: $14.23 billion
> Largest contributor to growth: Natural resources and mining
GDP growth is tied to employment. Most of the metro areas with the largest GDP growths have healthy economies. Visalia, however, is the notable exception. The central California metro area has the third highest unemployment rate in the country, at 11.5%.
The region’s economy relies heavily on natural resources, which includes agricultural operations. Nearly 20% of workers are employed in the industry, which overwhelmingly contributed to GDP growth in 2015. While employment dropped in the sector, wages for the typical worker rose by 38% in 2015, one of the largest such growths of U.S. metros. This is the third straight year of substantial GDP growth for Visalia. Output increased by 8.1% in 2013, and 8.2% in 2014.
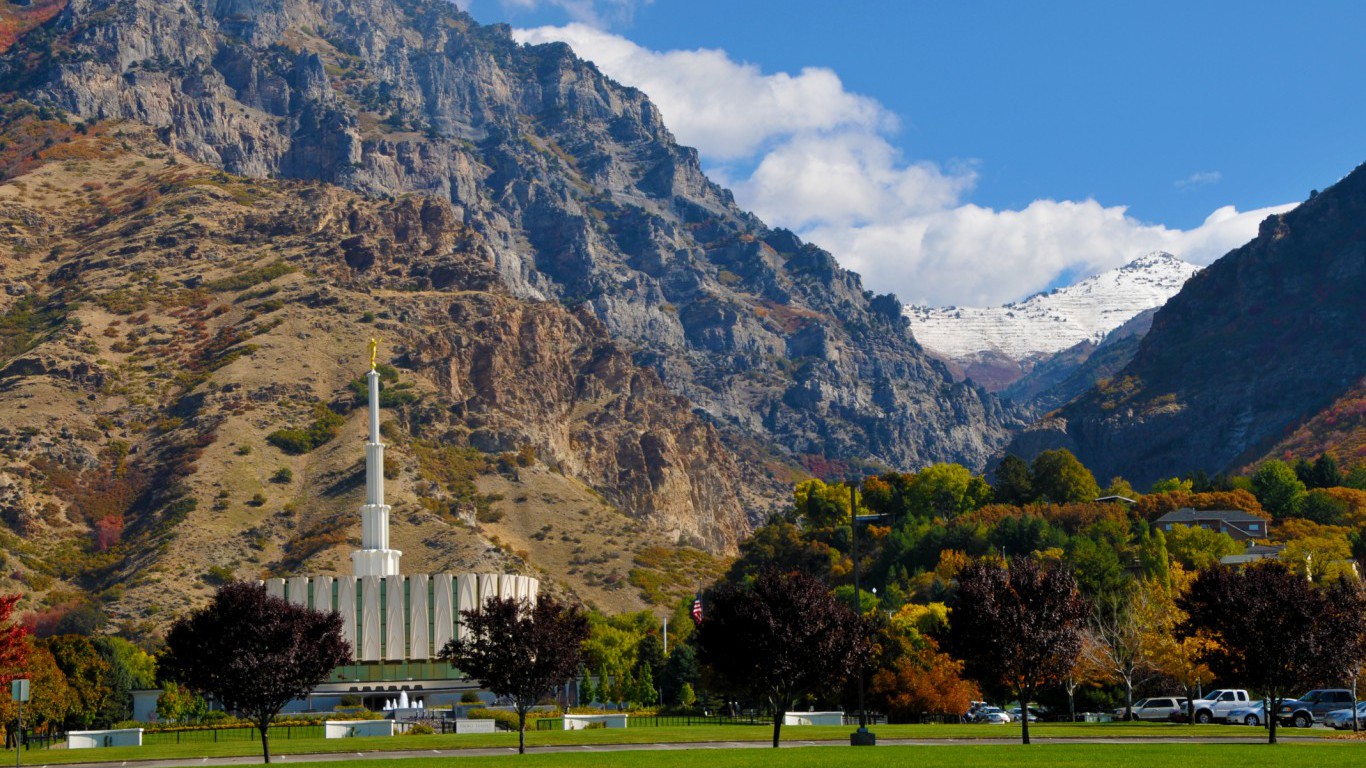
4. Provo-Orem, UT
> 2015 GDP growth: 7.6%
> 2015 GDP: $18.63 billion
> Largest contributor to growth: Information
The Provo-Orem, Utah metropolitan area’s economy has grown in each of the last five years. In 2012, the area’s 4.7% GDP growth was in the top 40 nationwide. Last year, the area’s economy grew by an even greater 7.6%. Employment growth — more workers earning wages — is closely tied to expanding GDP. In Provo, employment increased by 4.4% in 2015, the fifth largest growth among U.S. metro areas.
The area’s construction, trade, and information industries all contributed meaningfully to the area’s economic expansion, each adding well over a percentage point to Provo-Orem’s GDP growth.

3. Lake Charles, LA
> 2015 GDP growth: 8.3%
> 2015 GDP: $12.37 billion
> Largest contributor to growth: Arts, entertainment, recreation, accommodation, and food services
The Lake Charles economy grew by 8.3% in 2015, the third fastest expansion of any U.S. metro area. While the arts, entertainment, and tourism industry was one of the most sluggish industries nationwide, in Lake Charles it accounted for more of the increased economic output than any other industry.
Job growth accompanied economic expansion in Lake Charles. Employment in the metro area rose by 3.1% last year, one of the faster increases in the country. Also, the median home value in Lake Charles rose from $114,800 to $139,700, nearly the fastest appreciation of any metro area in the country. As Lake Charles becomes a more attractive place to work and live, home values will likely increase further.
[in-text-ad]
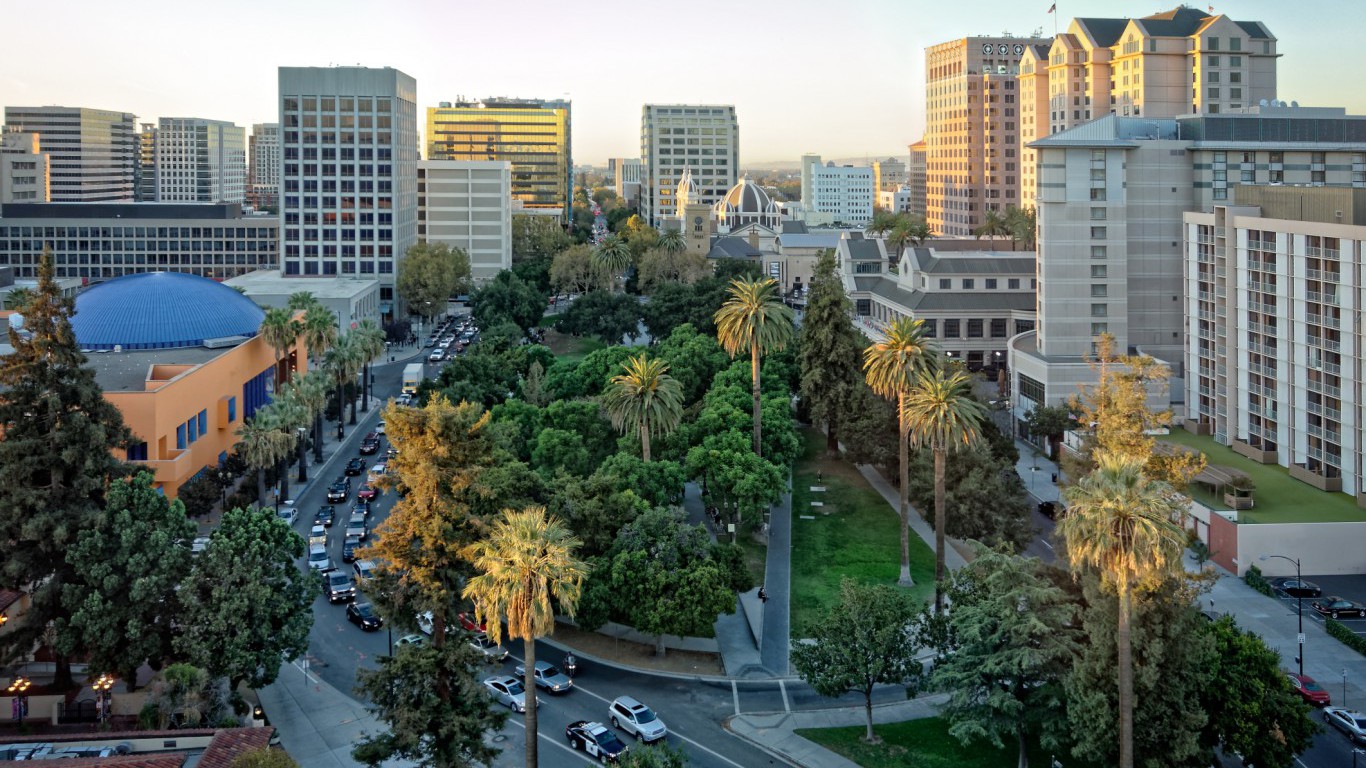
2. San Jose-Sunnyvale-Santa Clara, CA
> 2015 GDP growth: 8.9%
> 2015 GDP: $223.09 billion
> Largest contributor to growth: Professional and business services
The San Jose-Sunnyvale-Santa Clara economy grew by 8.9% in 2015, the second fastest of any U.S. metro area. The growth was led by the professional and business services sector, which is also the city’s largest employer.
The increased economic output is reflected in the rising incomes of San Jose residents. Already the wealthiest metro area nationwide, the San Jose median household income rose substantially from $96,590 in 2014 to $101,980 in 2015. The largest pay raise went to those employed in the finance, insurance, and real estate industry. Median earnings in the field rose by 11.4%, greater than the pay increase in the sector nationwide.

1. Midland, TX
> 2015 GDP growth: 9.4%
> 2015 GDP: $25.58 billion
> Largest contributor to growth: Natural resources and mining
No major metropolitan economy has grown more than Midland, Texas in the past few years. The western Texas metropolitan area’s 9.4% GDP growth was actually its second smallest since 2011. The region’s economy has grown by at least 7.5% every year since, including a 23.7% leap in 2012. It has been among the top 10 growing U.S. metros each year.
Midland’s meteoric growth is the result of its burgeoning oil extraction industry. Nationwide, less than 2% of American workers are employed in the natural resources and mining sector. In Midland, about 21% are employed in the sector, more than in any metropolitan area. Since oil prices began plummeting in 2014, the petroleum industry as a whole has struggled. While this does not appear to have severely hindered Midland’s growth so far, growth figures may not be nearly as high next year.
The Fastest Shrinking Metro Area Economies

10. Decatur, IL
> 2015 GDP growth: -3.1%
> 2015 GDP: $5.44 billion
> Largest GDP detraction: Manufacturing
Decatur is among several industrial cities in the Midwest whose economies are declining. The metro area’s GDP fell by 3.1% in 2015, one of the largest contractions of any metro area. While nationwide the manufacturing industry grew by $25.8 billion, in Decatur it shrank by $118 million, the most of any industry in the metro area. Employment in the industry fell by roughly 180 workers.
The industry also shed many jobs in 2013, when heavy equipment manufacturer Caterpillar Inc. laid off hundreds of workers at its Decatur location and food processing company Archer Daniels Midland Co. moved its headquarters from the city. The Decatur population fell by 1.0% in 2015, one of the largest declines nationwide.
[in-text-ad]
9. Johnstown, PA
> 2015 GDP growth: -3.1%
> 2015 GDP: $3.75 billion
> Largest GDP detraction: Natural resources and mining
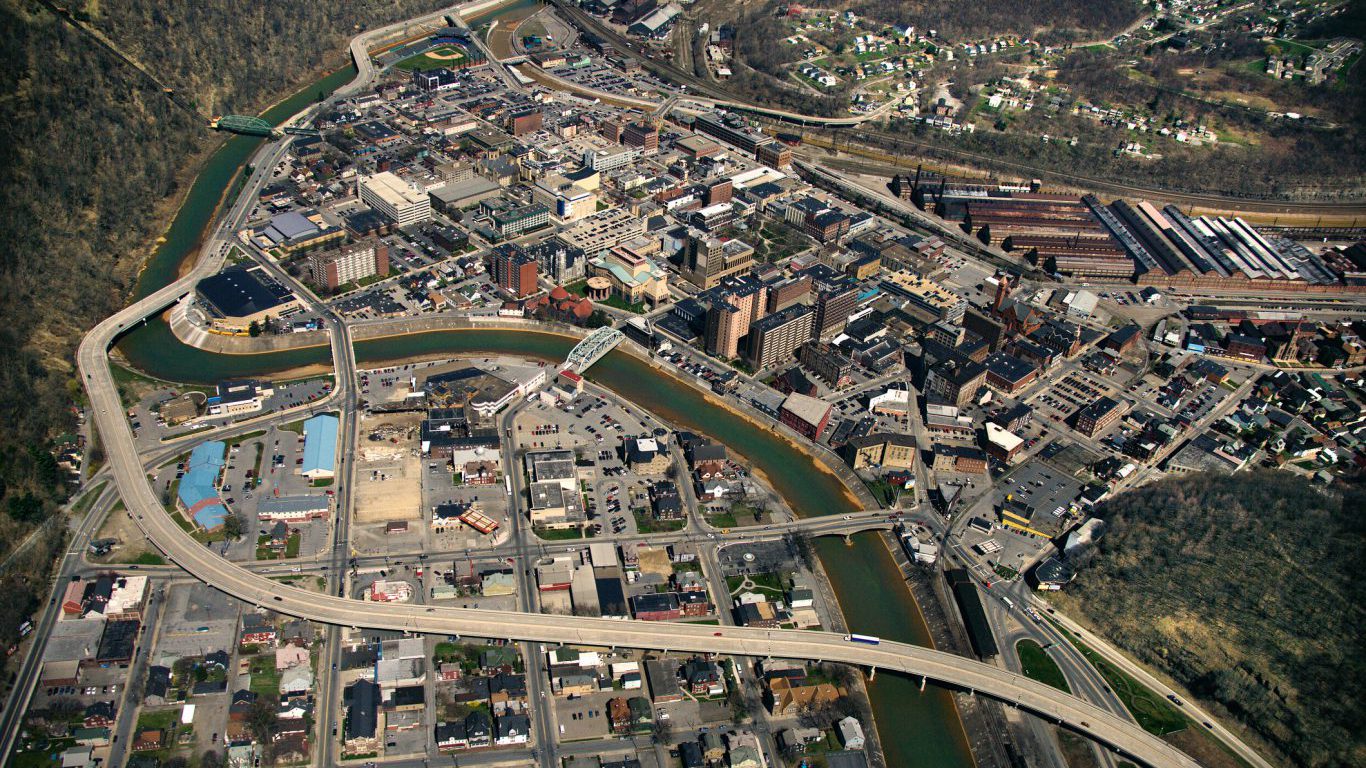
While the national economy expanded by 2.5% last year, Johnstown’s contracted by 3.1%. This was the fourth straight year the southwest Pennsylvania metropolitan area’s output declined as that of the nation grew. Economic output from nearly every major industry in the metropolitan area declined. The largest contributor to the area’s contraction was the natural resources and mining industry, which shrank by $43 million.
Because compensation represents the largest component of GDP, it is not surprising that the area’s employment fell in 2015. Meanwhile, the area’s unemployment rate of 6.2% remained above the national unemployment rate.
8. Danville, IL
> 2015 GDP growth: -3.3%
> 2015 GDP: $2.43 billion
> Largest GDP detraction: Natural resources and mining
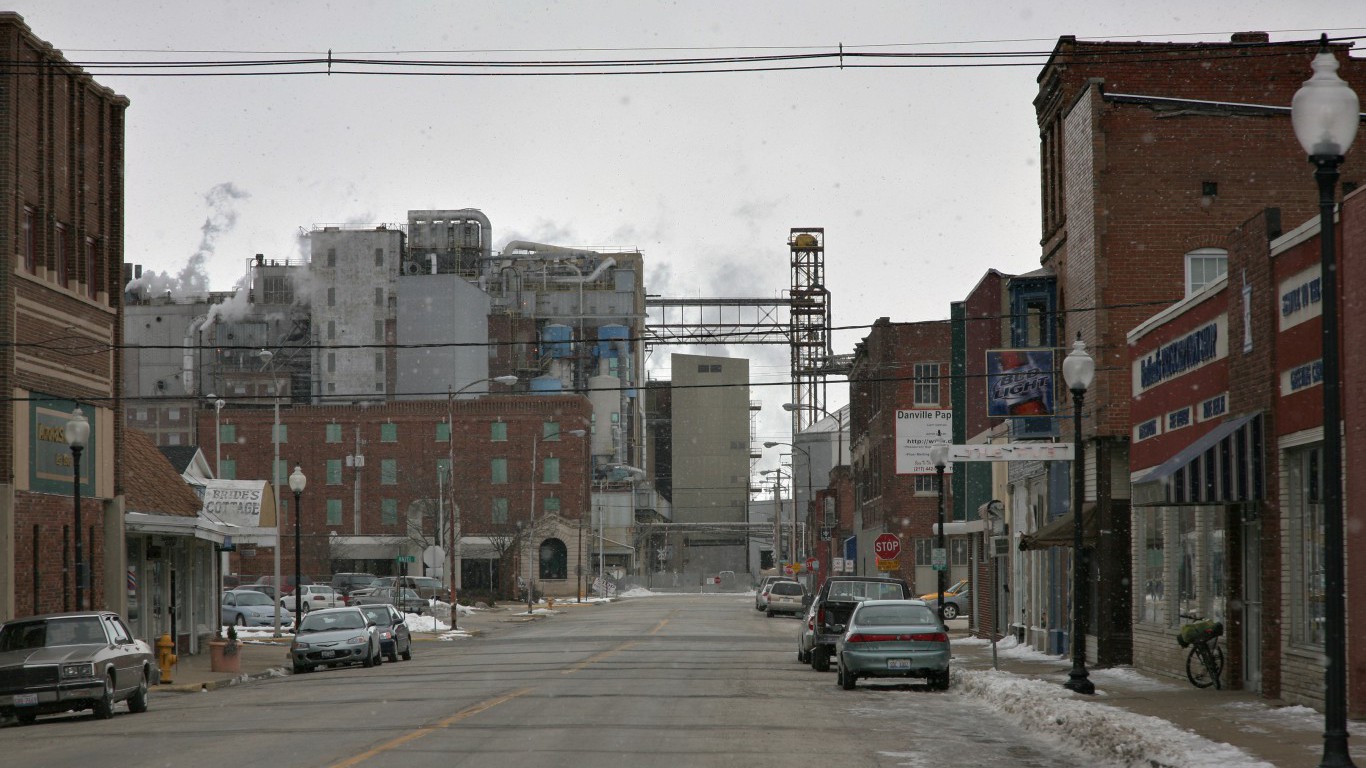
Danville is one of a handful of Rust Belt cities on this list — these once powerful industrial economies are now in decline. Danville’s GDP fell by 3.3% in 2015, one of the largest contractions of any metro area. The decline was led by the natural resources and mining industry, followed by the transportation and utilities industry.
The median home value fell from $76,400 in 2014 to $73,800 in 2015, the lowest of any metro area. The 3.4% depreciation was one of the fastest declines of any real estate market in the country. As the Danville economy continues to decline, homes in the area may further lose value.
7. Decatur, AL
> 2015 GDP growth: -3.3%
> 2015 GDP: $4.77 billion
> Largest GDP detraction: Manufacturing
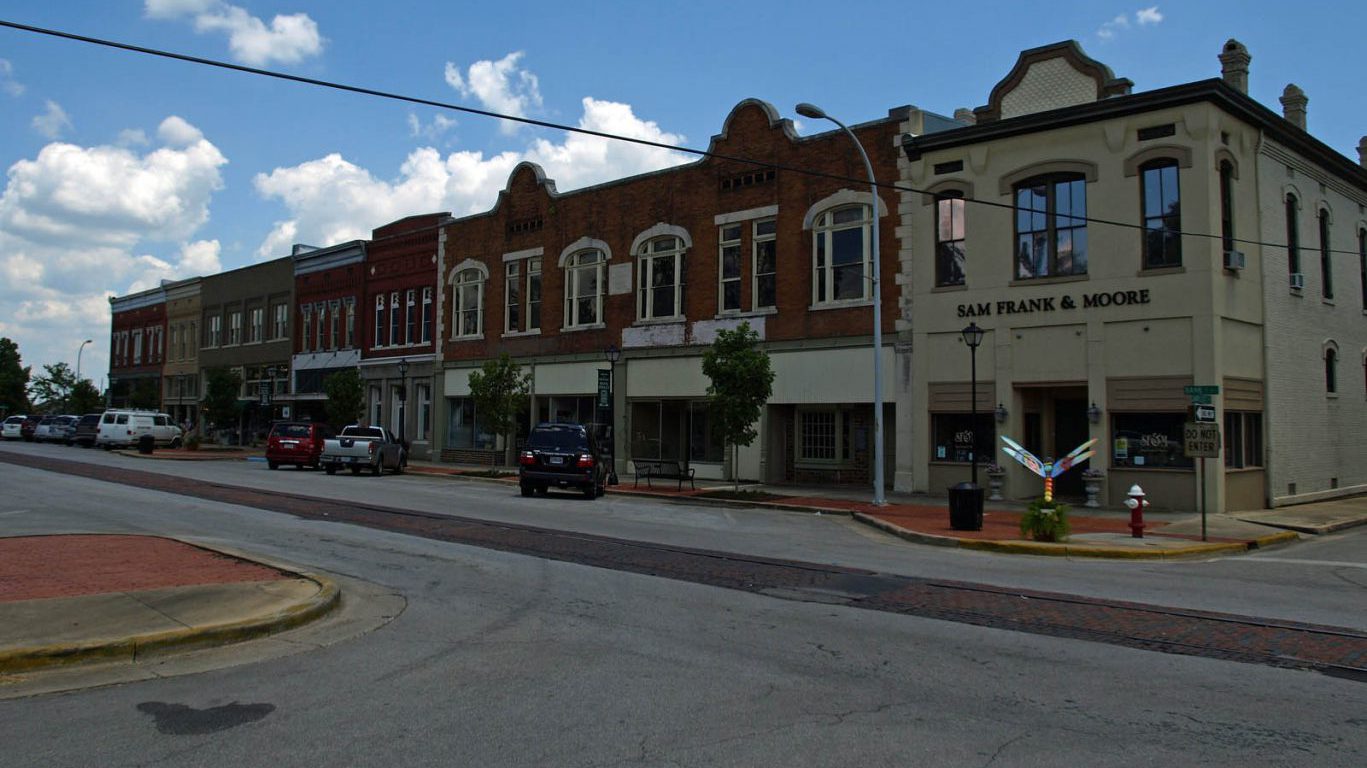
Manufacturing accounted for almost all of Decatur’s economic contraction. The metro’s GDP shrank from $4.94 billion to $4.77 billion, a decline of 3.3% — the seventh largest of all U.S. metros.
Approximately 19.8% of workers are employed in the area’s manufacturing industry. While this is among the highest proportions of any metro area, it is also down from the previous year. Although several signs point to economic decay in the area, other economic trends are far more encouraging. The value of area homes rose 11.4% in 2015, for example, one of the largest home value growth rates of all U.S. metros.
[in-text-ad]

6. Topeka, KS
> 2015 GDP growth: -3.5%
> 2015 GDP: $8.73 billion
> Largest GDP detraction: Government
Home of the Kansas State Capital, many workers in Topeka work in government jobs. Under Governor Sam Brownback, however, massive tax cuts have reduced state revenue and led to job cuts throughout the government sector across the state.
In Topeka, employment in the government sector fell by roughly 1,500 jobs, and median earnings for workers in the sector fell slightly. Topeka has one of the larger government sectors of any metro area, which ultimately detracted the most from the city’s GDP growth. the metro area’s GDP contracted by 3.5%, the sixth largest decline nationwide. Economic output was also hindered by sluggish activity in Topeka’s manufacturing and arts, entertainment, and tourism industries.
5. Lafayette, LA
> 2015 GDP growth: -3.8%
> 2015 GDP: $22.85 billion
> Largest GDP detraction: Manufacturing
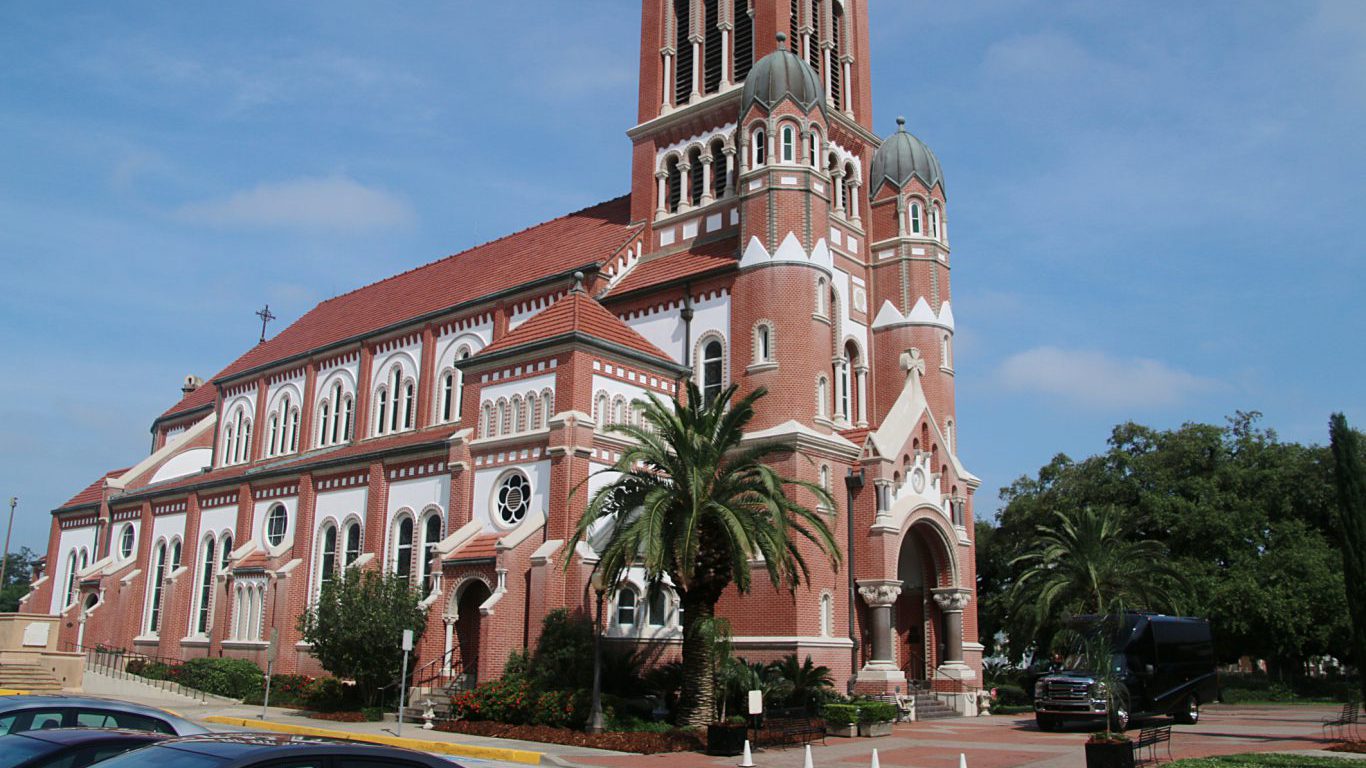
The Lafayette metro area GDP fell by 3.8% in 2015, the fifth largest contraction of U.S. metro areas. This was the third consecutive year of decline for the Lafayette economy. The area’s unemployment rate also increased — one of just 18 metro areas where unemployment rose. The economic decline was led by the manufacturing industry, which — in addition to shedding roughly 1,500 jobs — contributed nearly 1.5 percentage points to the area’s GDP contraction.
As the workforce shrinks, the productive capacity of the economy often weakens. Employment in the metro area fell by nearly 11,000 workers between in 2015. The 4.9% decline was among the largest of any metro area.
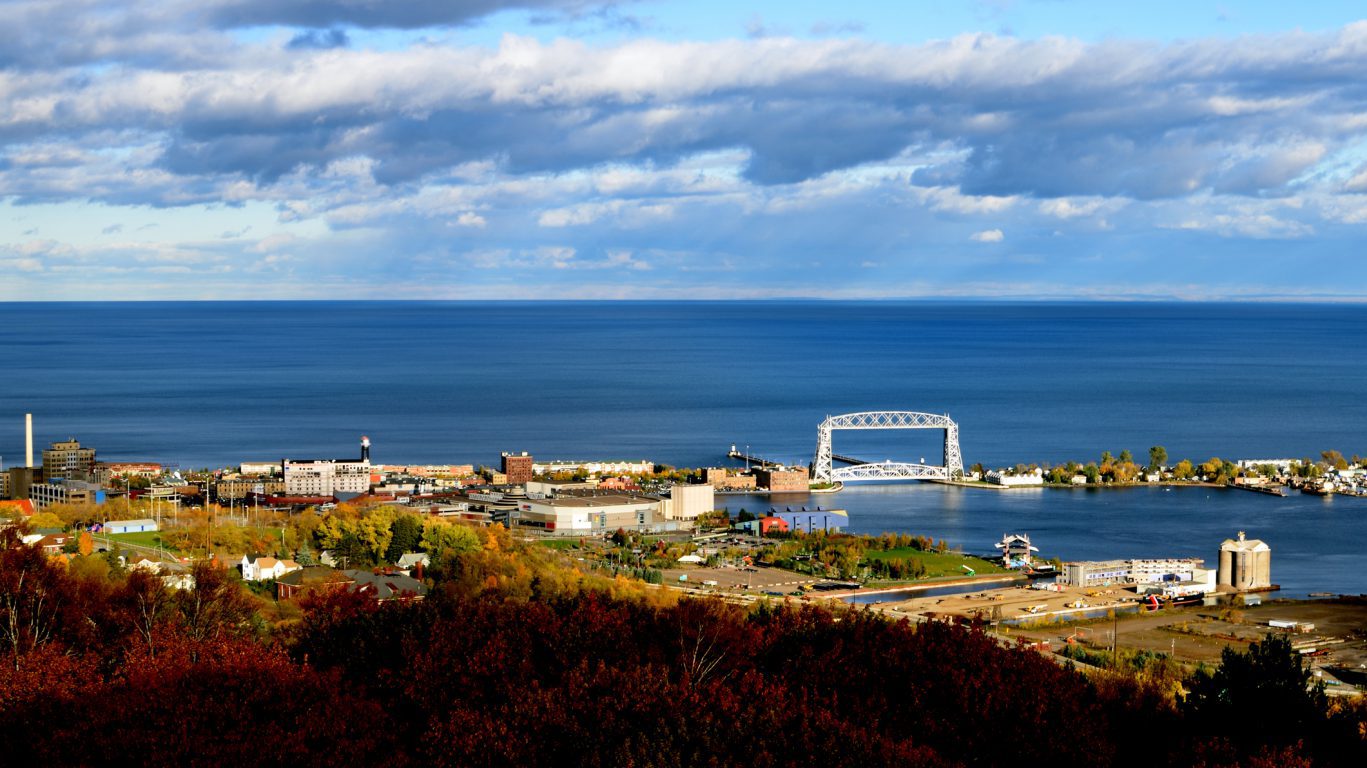
4. Duluth, MN-WI
> 2015 GDP growth: -4.1%
> 2015 GDP: $11.10 billion
> Largest GDP detraction: Natural resources and mining
The Duluth economy once benefitted heavily from shipping iron ore arriving by the Duluth, Missabe, and Iron Range railway via its Great Lakes port. With the collapse of the U.S. mining industry, however, Duluth is now among several Rust Belt cities in economic decline. The natural resources and mining industry in Duluth shed roughly 700 employees in 2015 and was the largest detractor from Duluth’s GDP growth. The metro area’s GDP fell by 4.1%, the fourth largest contraction of U.S. metros.

3. Odessa, TX
> 2015 GDP growth: -7.3%
> 2015 GDP: $8.71 billion
> Largest GDP detraction: Trade
After near nation-leading GDP growth rates in each of the four years through 2014, Odessa’s economy tanked last year. The 7.3% contraction trails just two other metro areas as the fastest shrinking economies in the nation.
Odessa’s troubles reflects the woes afflicting mining operations across the United States. With close to 15% of area workers employed in mining and related industries, Odessa’s economy rises and falls with the price of oil. While crude oil prices have recovered somewhat so far this year, they fell consistently in 2015 and are still well below the high prices that contributed to the rapid energy sector growth in previous years. In the first quarter of this year, economic output from the U.S. mining sector declined 11.1%.
[in-text-ad]

2. Houma-Thibodaux, LA
> 2015 GDP growth: -7.8%
> 2015 GDP: $10.52 billion
> Largest GDP detraction: Transportation and utilities
Houma-Thibodaux metro area’s GDP declined by 7.8% in 2015, the second largest contraction of any metro area in the country. Like the country as a whole, a sluggish transportation and utilities industry was the largest detractor from Houma-Thibodaux’s GDP growth. Relative to its size, Houma-Thibodaux has one of the largest transportation and utilities industries in the country, which has likely been negatively affected by the decline in oil prices nationwide.
Lower employment is also a likely closely tied to Houma-Thibodaux’s economic decline. As the workforce shrinks, the productive capacity of the metro area economy decreases. Employment in the metro area fell by roughly 6,000 workers in 2015. The 6.5% drop was among the largest of any metro area.

1. Bloomington, IL
> 2015 GDP growth: -8.0%
> 2015 GDP: $9.37 billion
> Largest GDP detraction: Professional and business services
The Bloomington economy declined by 8.0% in 2015, a larger contraction than any other U.S. metro area. The professional and business services sector accounted for nearly all of the economic contraction in the metro area, shrinking by $945 million. According to credit ratings services firm Moody’s, the professional and business services industry in Illinois is heavily tied to manufacturing and may be losing ground as a result of a sluggish manufacturing industry nationwide. In Bloomington, the manufacturing industry shrank by approximately $20 million in 2015.
Despite reduced economic output, Bloomington residents are still relatively wealthy. The median household income increased from $57,594 in 2014 to $63,842 in 2015, one of the largest increases of any metro area.
The average American spends $17,274 on debit cards a year, and it’s a HUGE mistake. First, debit cards don’t have the same fraud protections as credit cards. Once your money is gone, it’s gone. But more importantly you can actually get something back from this spending every time you swipe.
Issuers are handing out wild bonuses right now. With some you can earn up to 5% back on every purchase. That’s like getting a 5% discount on everything you buy!
Our top pick is kind of hard to imagine. Not only does it pay up to 5% back, it also includes a $200 cash back reward in the first six months, a 0% intro APR, and…. $0 annual fee. It’s quite literally free money for any one that uses a card regularly. Click here to learn more!
Flywheel Publishing has partnered with CardRatings to provide coverage of credit card products. Flywheel Publishing and CardRatings may receive a commission from card issuers.
Thank you for reading! Have some feedback for us?
Contact the 24/7 Wall St. editorial team.