
More than 43 million Americans still live in poverty. And while financial hardship exists in every city, some areas have much higher poverty rates than others.
24/7 Wall St. reviewed data from the U.S. Census Bureau to determine the cities with the highest poverty rates. The 56-city list consists of every U.S. metro area where more than one in five residents lives in poverty. The metro area with the highest poverty rate is Brownsville-Harlingen, Texas, with 32.4% of residents living below the poverty line.
Click here to see the cities with the highest poverty rates.
The income threshold that determines the poverty line for a family is determined by family size and composition. For example, the threshold for a family of four consisting of two adults and two children is $24,036 a year — if the household’s total income is below that threshold, it is considered to be living in poverty. For an individual younger than 65 years of age living alone, the poverty threshold drops to $12,331.
Due to many factors, including the pay gap between men and women, single mother households tend to have higher rates of poverty than other types of households. Nationwide, single mother families make up 6.8% of all families. In the most impoverished cities, single mother families are more common. In nine of the 10 cities with the highest poverty rates, the share of single mother households exceeds the national rate.
The poverty threshold does not account for factors like cost of living and is based on income levels before subsidies are received from government assistance programs like SNAP. Because it is cheaper to live in 54 of the 56 cities on this list than it is on average across the nation, the low incomes may be slightly more manageable. Programs like SNAP can provide further assistance by securing basic needs for low income individuals and families.
Yet, in many of these areas, there are a larger share of residents not only living in poverty, but living in extreme poverty. Nationwide, 4.3% of families earn less than $10,000 per year. In all but five of the 56 metros this percentage is higher, and in four cities, one in 10 families earns less than $10,000 annually.
To determine the cities with the highest poverty rates, 24/7 Wall St. reviewed data from the U.S. Census Bureau. The national poverty rate is from the Current Population Survey, and data for metropolitan statistical areas is from the American Community Survey. Household and family composition figures are also from the ACS. Single mother family refers to a single, female householder raising her own children. All data from the Census Bureau is from 2015. Unemployment rates are from July 2016 and are from the Bureau of Labor Statistics. Regional price parities (cost of living) in each metro area came from the Bureau of Economic Analysis and are as of 2014. All data is as of the most recently available period.
These are the cities with the highest poverty rates.

56. El Paso, TX
> Poverty rate: 20.1%
> July 2016 unemployment rate: 4.9%
> Households receiving SNAP benefits: 22.0%
> Households with income under $10,000: 5.4%
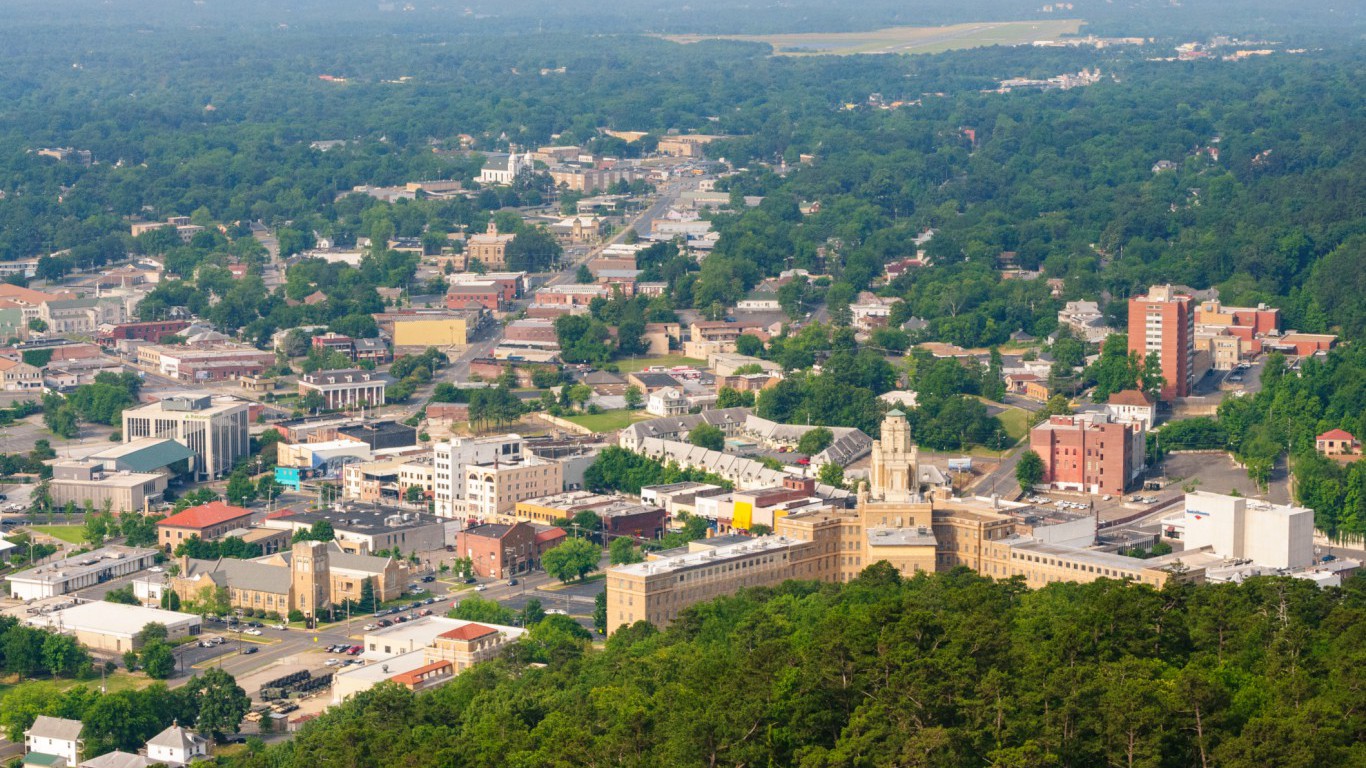
55. Hot Springs, AR
> Poverty rate: 20.1%
> July 2016 unemployment rate: 4.2%
> Households receiving SNAP benefits: 10.4%
> Households with income under $10,000: 4.9%
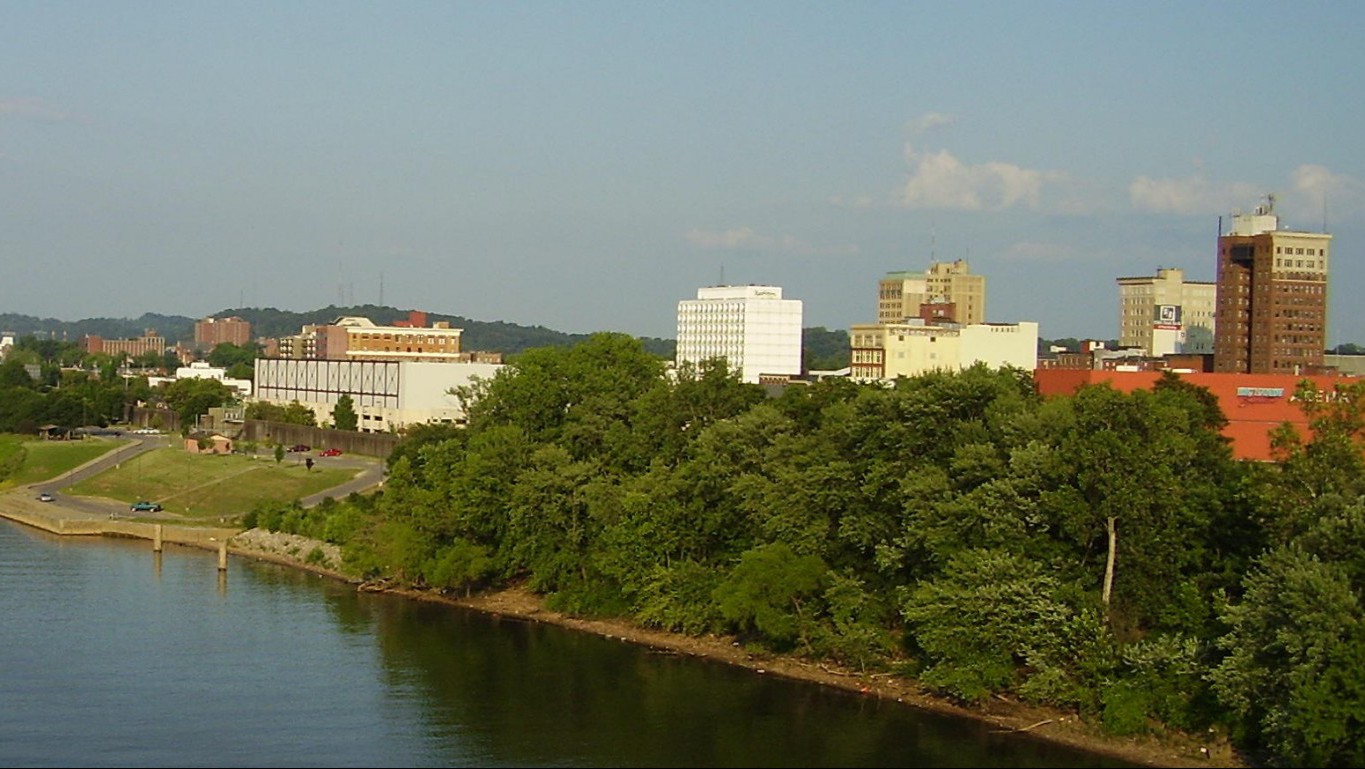
54. Huntington-Ashland, WV-KY-OH
> Poverty rate: 20.1%
> July 2016 unemployment rate: 5.8%
> Households receiving SNAP benefits: 18.0%
> Households with income under $10,000: 6.9%

53. Corvallis, OR
> Poverty rate: 20.1%
> July 2016 unemployment rate: 4.6%
> Households receiving SNAP benefits: 11.5%
> Households with income under $10,000: 3.7%

52. Pueblo, CO
> Poverty rate: 20.1%
> July 2016 unemployment rate: 5.4%
> Households receiving SNAP benefits: 20.3%
> Households with income under $10,000: 7.6%

51. Burlington, NC
> Poverty rate: 20.1%
> July 2016 unemployment rate: 4.3%
> Households receiving SNAP benefits: 17.0%
> Households with income under $10,000: 6.5%

50. Waco, TX
> Poverty rate: 20.3%
> July 2016 unemployment rate: 3.9%
> Households receiving SNAP benefits: 11.6%
> Households with income under $10,000: 5.5%
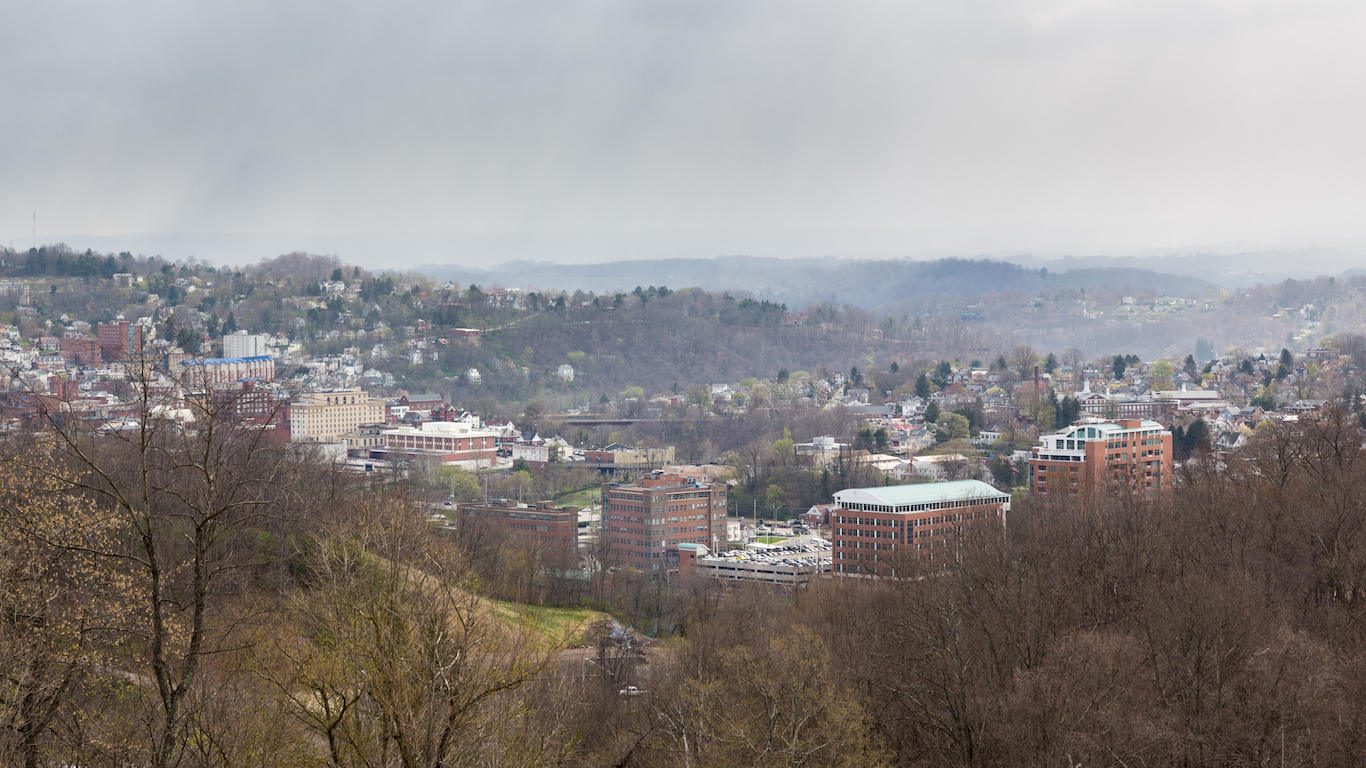
49. Morgantown, WV
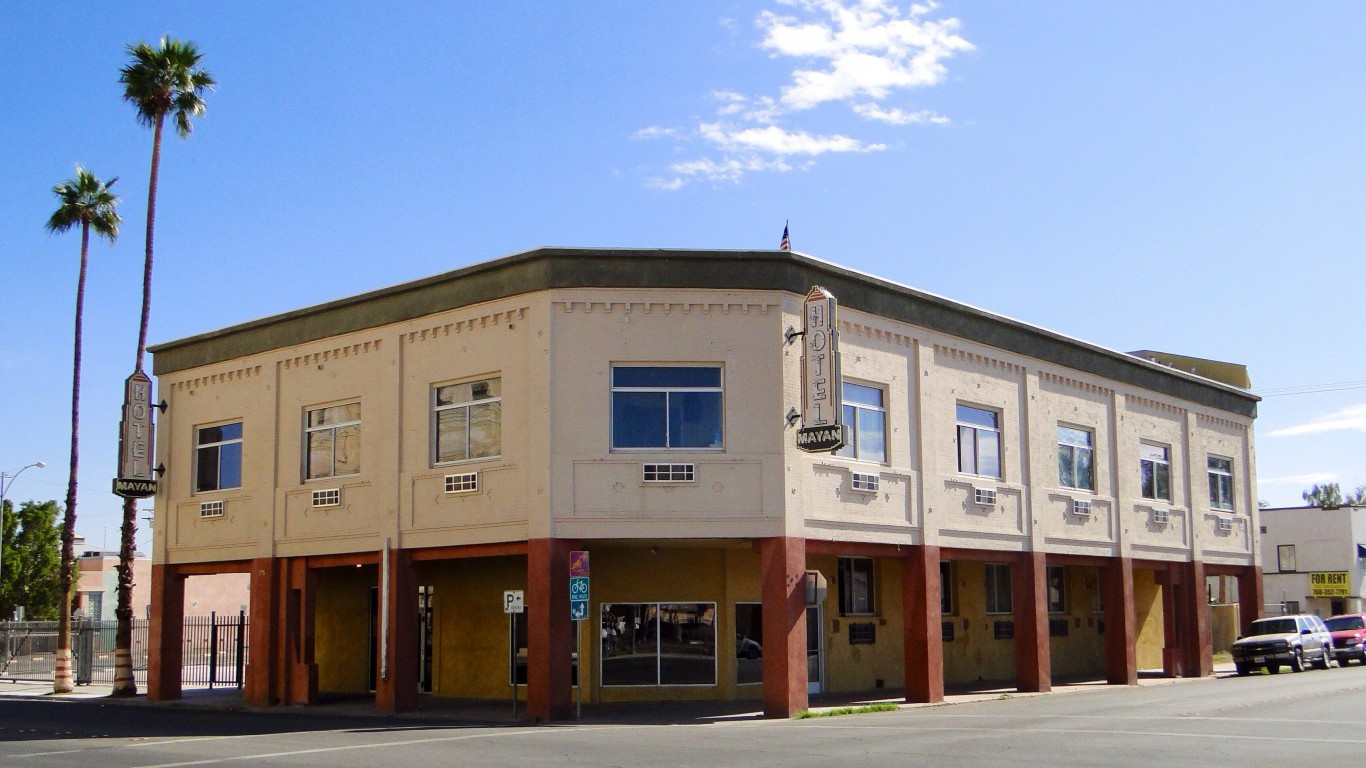
> Poverty rate: 20.3%
> July 2016 unemployment rate: 4.3%
> Households receiving SNAP benefits: 10.0%
> Households with income under $10,000: 5.0%

48. Harrisonburg, VA
> Poverty rate: 20.3%
> July 2016 unemployment rate: 3.9%
> Households receiving SNAP benefits: 9.2%
> Households with income under $10,000: 5.4%

47. Medford, OR
> Poverty rate: 20.3%
> July 2016 unemployment rate: 6.6%
> Households receiving SNAP benefits: 23.0%
> Households with income under $10,000: 7.8%
 24/7 Wall St.
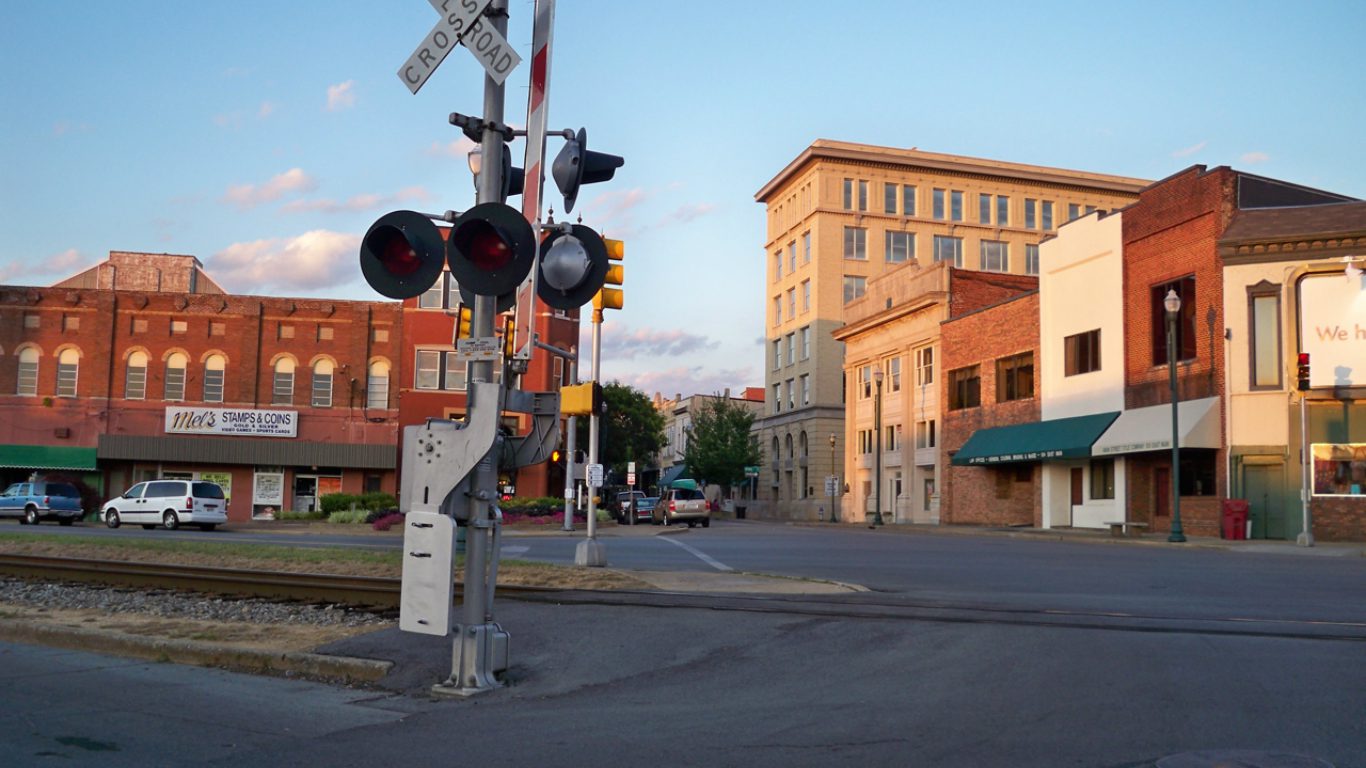
46. Johnson City, TN
> Poverty rate: 20.4%
> July 2016 unemployment rate: 5.0%
> Households receiving SNAP benefits: 14.7%
> Households with income under $10,000: 7.4%

45. Yuma, AZ
> Poverty rate: 20.5%
> July 2016 unemployment rate: 20.1%
> Households receiving SNAP benefits: 20.6%
> Households with income under $10,000: 6.7%
44. Fort Smith, AR-OK
> Poverty rate: 20.5%
> July 2016 unemployment rate: 4.8%
> Households receiving SNAP benefits: 17.4%
> Households with income under $10,000: 7.0%
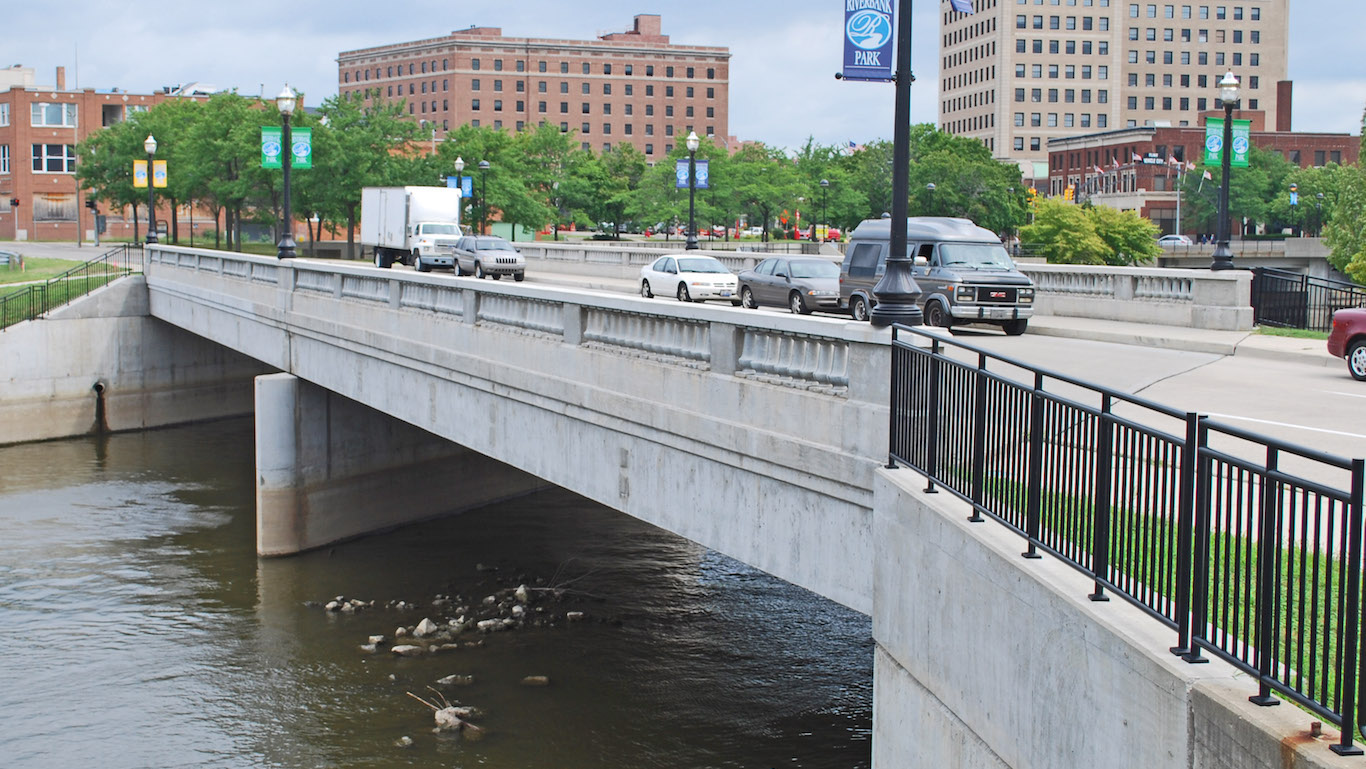
43. Flint, MI
> Poverty rate: 20.6%
> July 2016 unemployment rate: 4.4%
> Households receiving SNAP benefits: 20.7%
> Households with income under $10,000: 6.3%

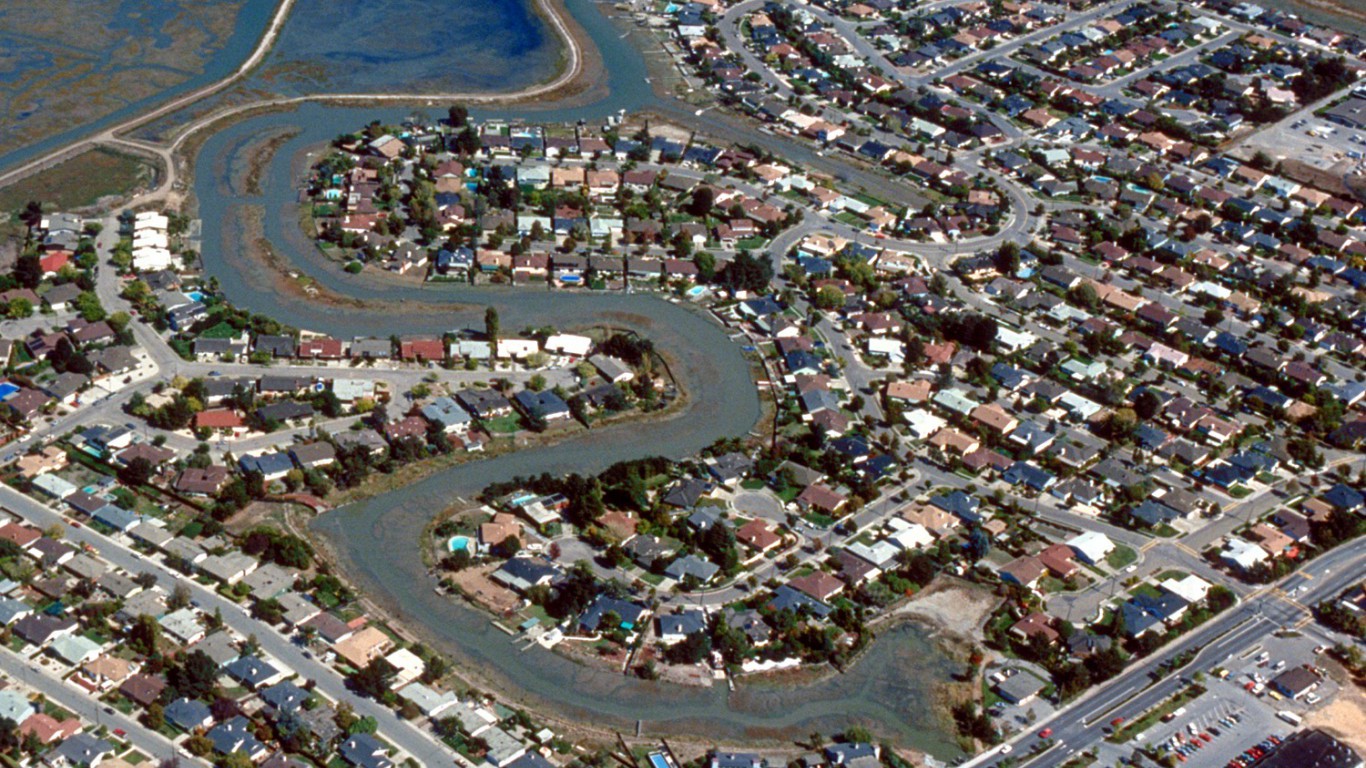
42. Yuba City, CA
> Poverty rate: 20.6%
> July 2016 unemployment rate: 9.4%
> Households receiving SNAP benefits: 15.0%
> Households with income under $10,000: 4.7%
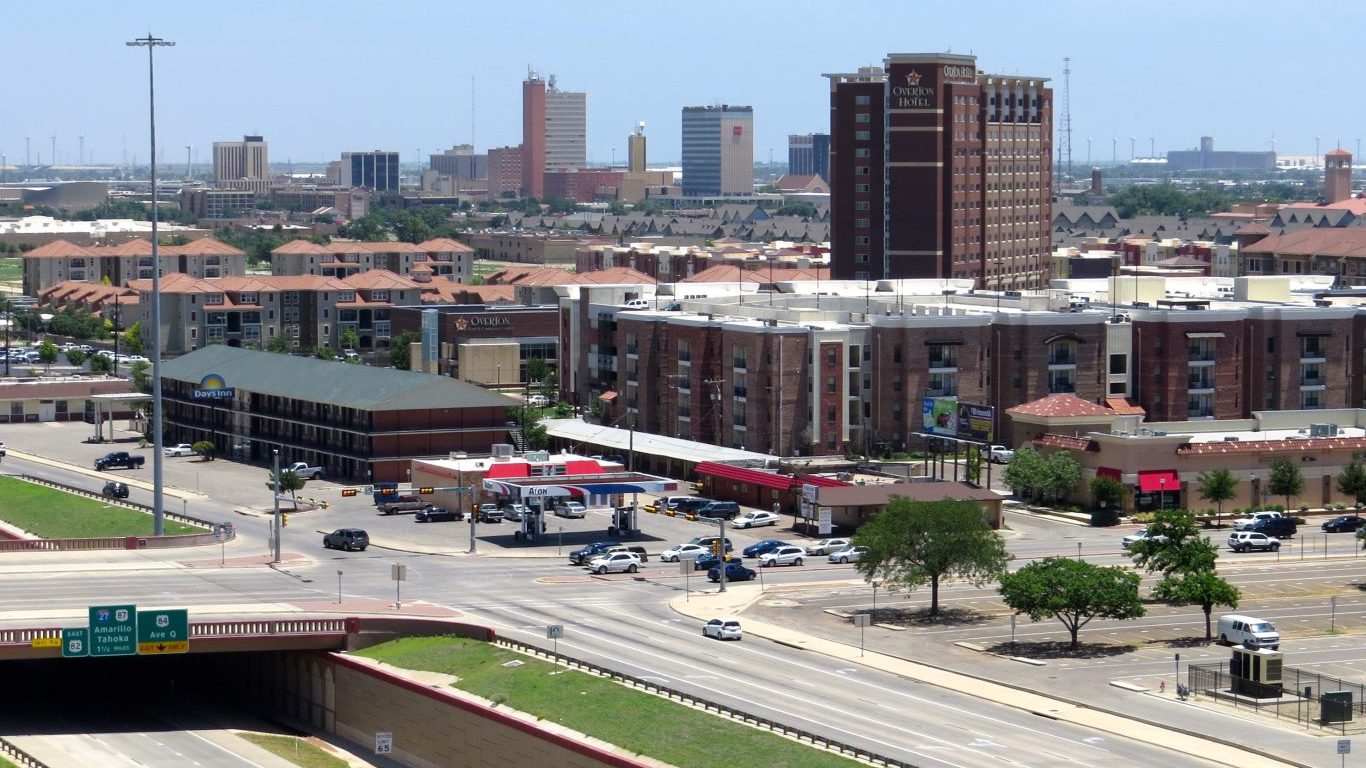
41. Lubbock, TX
> Poverty rate: 20.7%
> July 2016 unemployment rate: 3.4%
> Households receiving SNAP benefits: 12.5%
> Households with income under $10,000: 5.8%
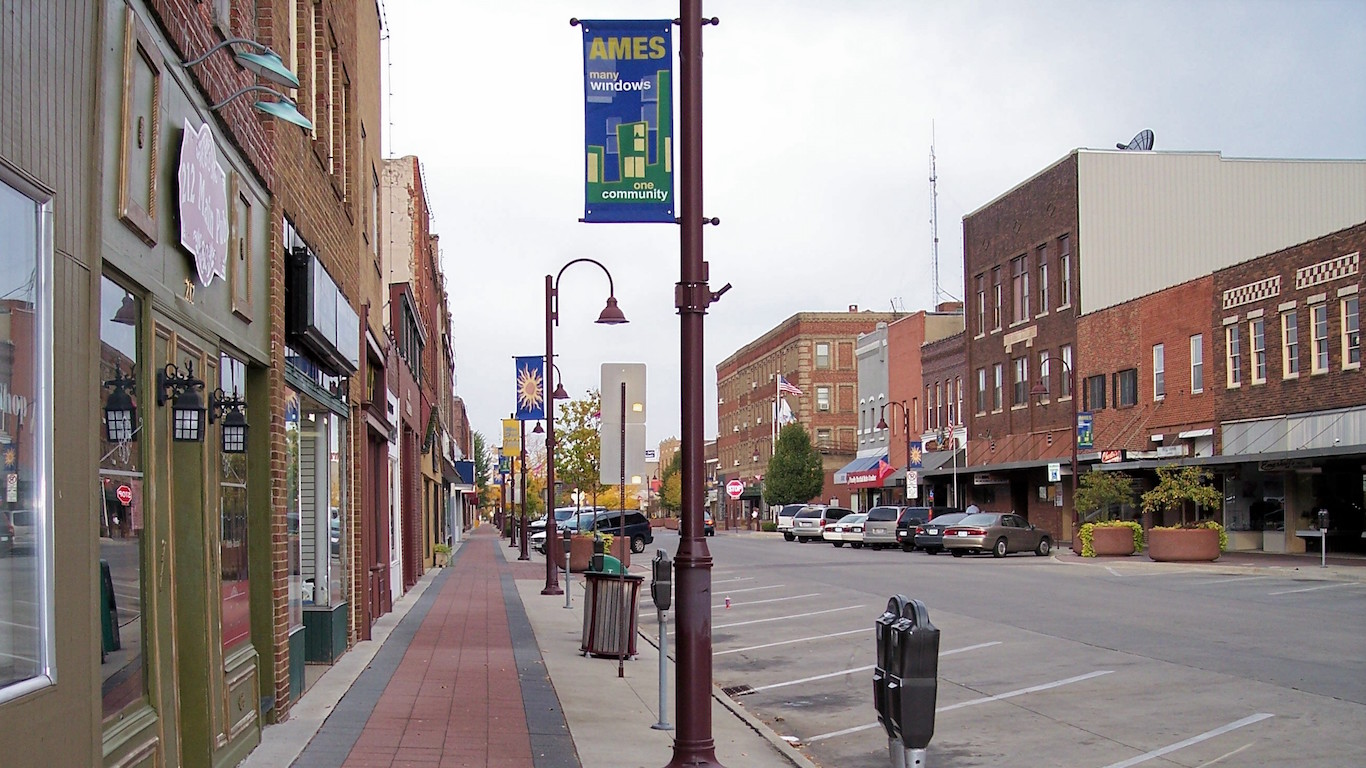
40. Ames, IA
> Poverty rate: 20.7%
> July 2016 unemployment rate: 2.5%
> Households receiving SNAP benefits: 7.9%
> Households with income under $10,000: 1.4%
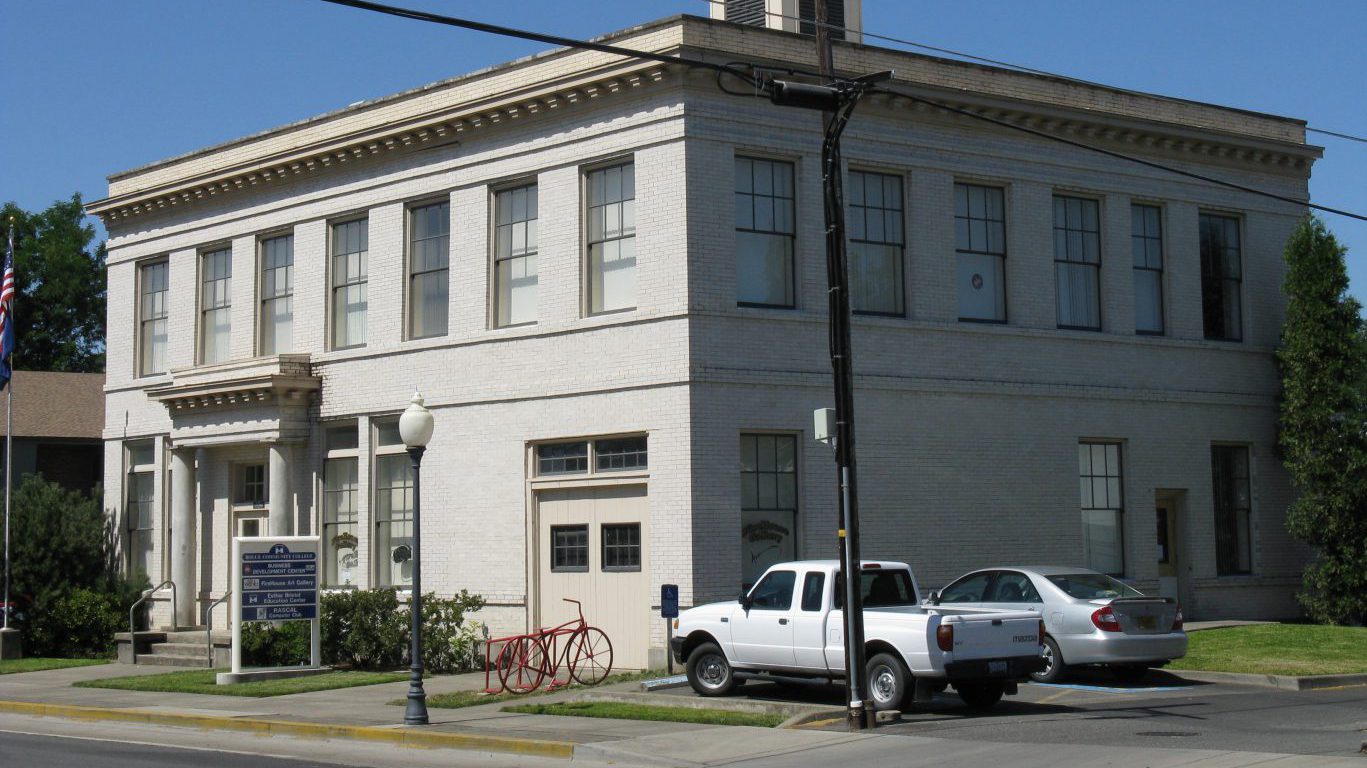
39. Manhattan, KS
> Poverty rate: 20.8%
> July 2016 unemployment rate: 3.3%
> Households receiving SNAP benefits: 6.3%
> Households with income under $10,000: 5.8%
 24/7 Wall St.
38. Tuscaloosa, AL
> Poverty rate: 21.0%
> July 2016 unemployment rate: 5.5%
> Households receiving SNAP benefits: 11.3%
> Households with income under $10,000: 6.3%

37. Shreveport-Bossier City, LA
> Poverty rate: 21.0%
> July 2016 unemployment rate: 6.7%
> Households receiving SNAP benefits: 16.1%
> Households with income under $10,000: 6.7%

36. Columbus, GA-AL
> Poverty rate: 21.1%
> July 2016 unemployment rate: 6.0%
> Households receiving SNAP benefits: 19.0%
> Households with income under $10,000: 5.9%
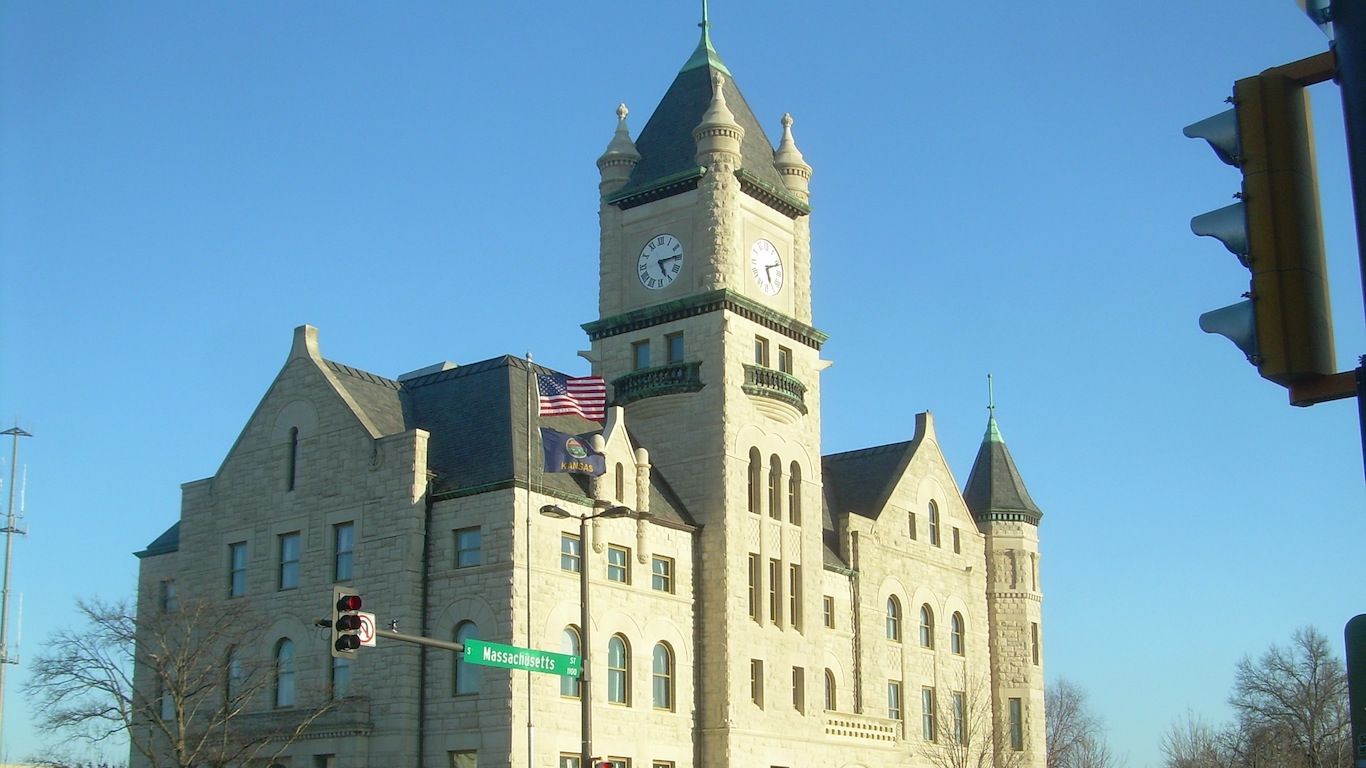
35. Lawrence, KS
> Poverty rate: 21.3%
> July 2016 unemployment rate: 3.6%
> Households receiving SNAP benefits: 6.9%
> Households with income under $10,000: 3.4%

34. Chico, CA
> Poverty rate: 21.8%
> July 2016 unemployment rate: 6.9%
> Households receiving SNAP benefits: 11.9%
> Households with income under $10,000: 4.1%

33. Gainesville, FL
> Poverty rate: 21.9%
> July 2016 unemployment rate: 4.1%
> Households receiving SNAP benefits: 11.3%
> Households with income under $10,000: 5.1%
32. Auburn-Opelika, AL
> Poverty rate: 21.9%
> July 2016 unemployment rate: 4.9%
> Households receiving SNAP benefits: 15.0%
> Households with income under $10,000: 6.7%

31. Bakersfield, CA
> Poverty rate: 21.9%
> July 2016 unemployment rate: 10.6%
> Households receiving SNAP benefits: 16.4%
> Households with income under $10,000: 6.3%

30. Hinesville, GA
> Poverty rate: 22.0%
> July 2016 unemployment rate: 5.3%
> Households receiving SNAP benefits: 21.3%
> Households with income under $10,000: 6.1%
29. Alexandria, LA
> Poverty rate: 22.0%
> July 2016 unemployment rate: 6.5%
> Households receiving SNAP benefits: 19.0%
> Households with income under $10,000: 6.5%

28. Rocky Mount, NC
> Poverty rate: 22.0%
> July 2016 unemployment rate: 6.8%
> Households receiving SNAP benefits: 23.3%
> Households with income under $10,000: 5.4%

27. Ithaca, NY
> Poverty rate: 22.3%
> July 2016 unemployment rate: 3.5%
> Households receiving SNAP benefits: 6.8%
> Households with income under $10,000: 3.1%

26. Tallahassee, FL
> Poverty rate: 22.4%
> July 2016 unemployment rate: 4.5%
> Households receiving SNAP benefits: 16.0%
> Households with income under $10,000: 5.3%
25. Grants Pass, OR
> Poverty rate: 22.6%
> July 2016 unemployment rate: 7.4%
> Households receiving SNAP benefits: 24.5%
> Households with income under $10,000: 4.5%

24. College Station-Bryan, TX
> Poverty rate: 23.0%
> July 2016 unemployment rate: 3.5%
> Households receiving SNAP benefits: 8.1%
> Households with income under $10,000: 5.0%
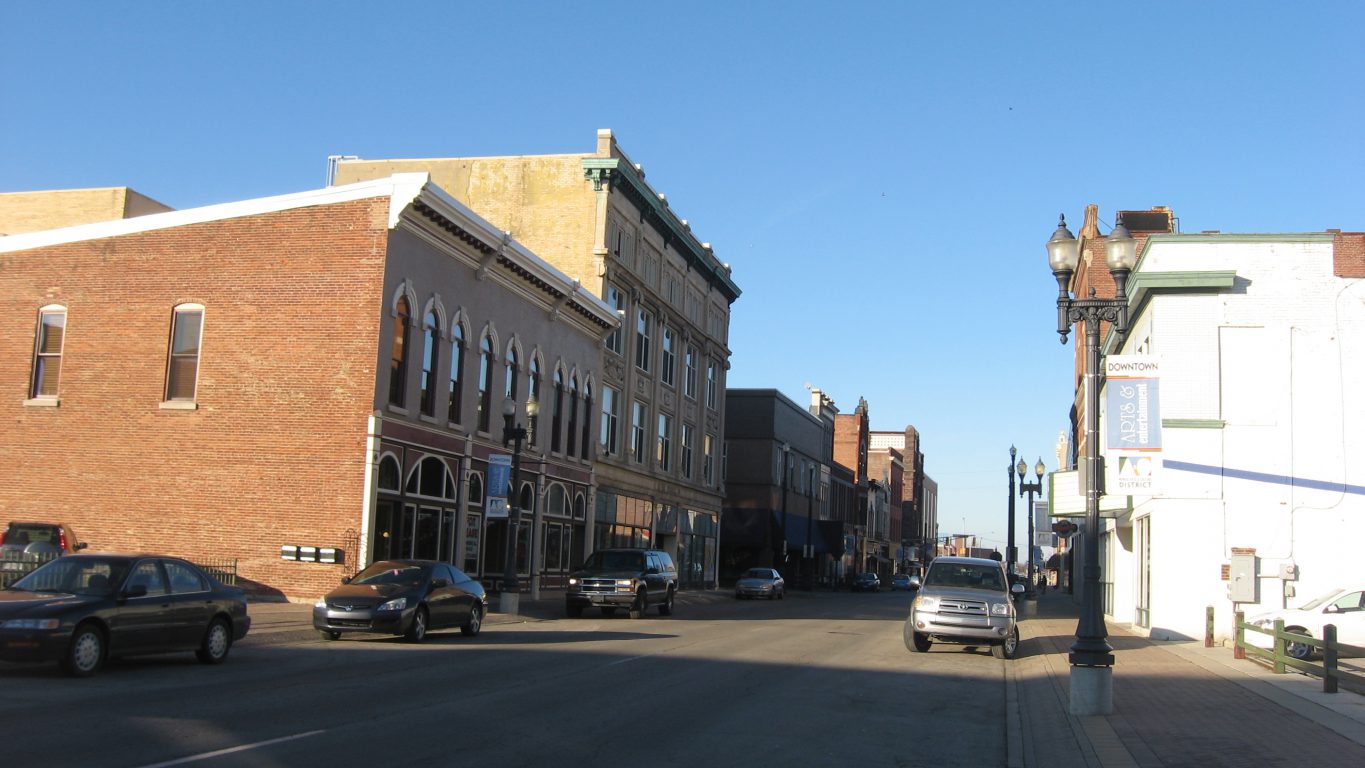
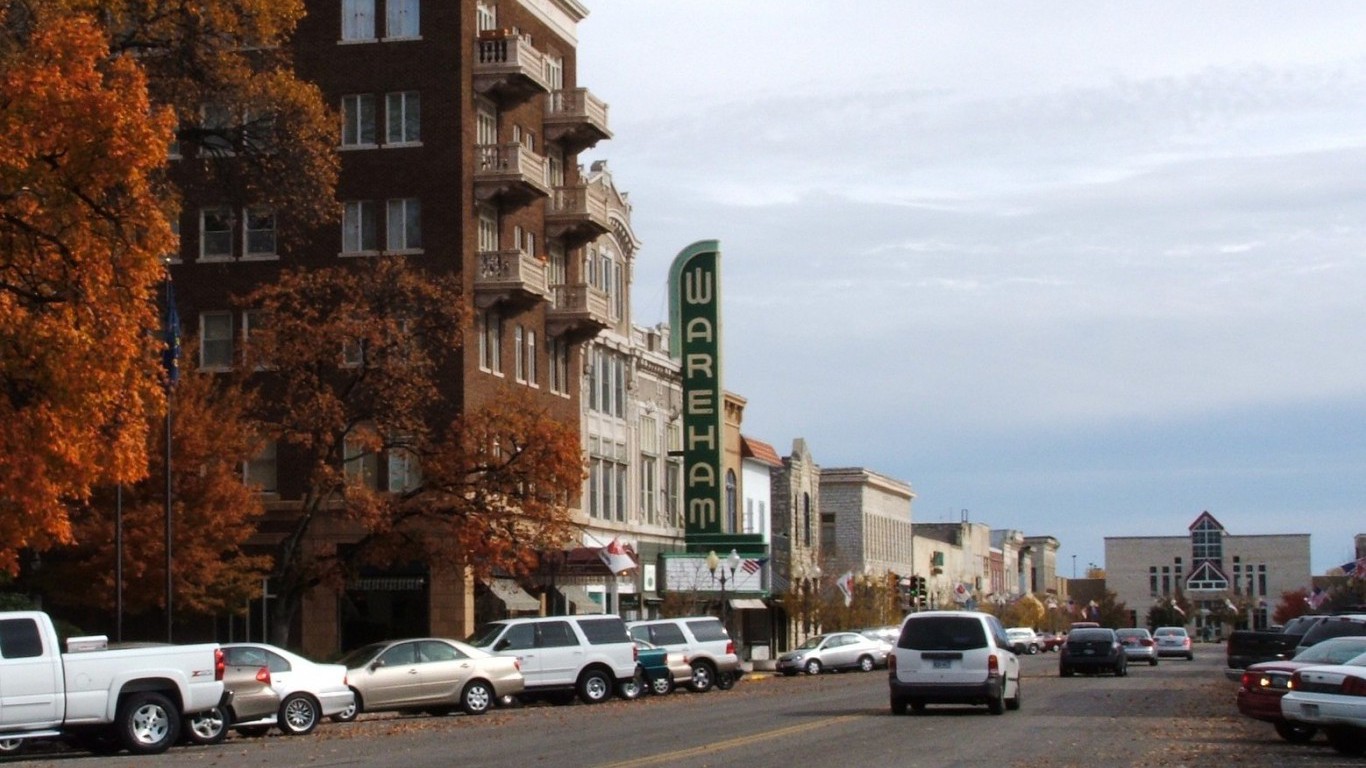
23. Muncie, IN
> Poverty rate: 23.4%
> July 2016 unemployment rate: 4.9%
> Households receiving SNAP benefits: 16.1%
> Households with income under $10,000: 8.6%
22. Madera, CA
> Poverty rate: 23.4%
> July 2016 unemployment rate: 9.5%
> Households receiving SNAP benefits: 16.9%
> Households with income under $10,000: 6.6%

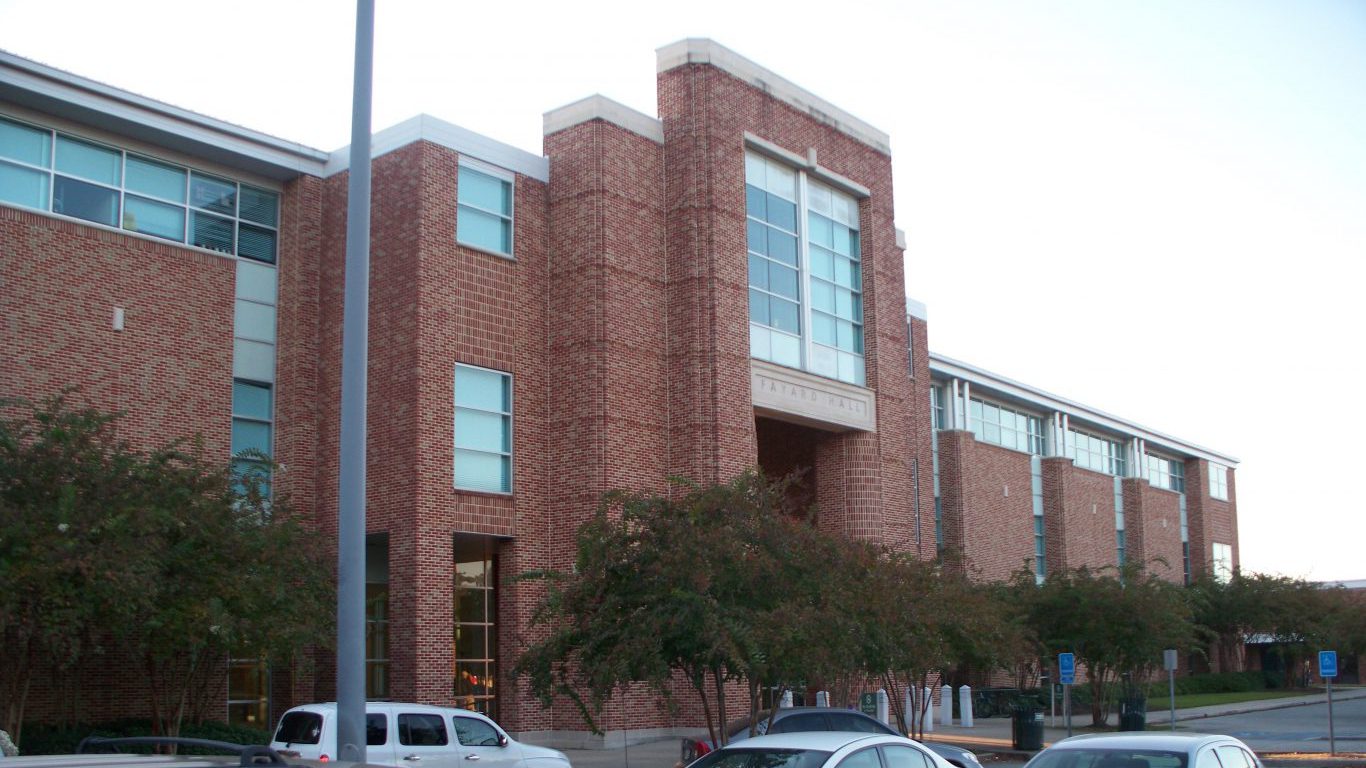
21. Hattiesburg, MS
> Poverty rate: 23.5%
> July 2016 unemployment rate: 5.4%
> Households receiving SNAP benefits: 18.1%
> Households with income under $10,000: 8.1%

20. Hanford-Corcoran, CA
> Poverty rate: 23.6%
> July 2016 unemployment rate: 10.1%
> Households receiving SNAP benefits: 18.0%
> Households with income under $10,000: 5.8%

19. Macon, GA
> Poverty rate: 23.7%
> July 2016 unemployment rate: 5.3%
> Households receiving SNAP benefits: 18.2%
> Households with income under $10,000: 8.8%
 24/7 Wall St.
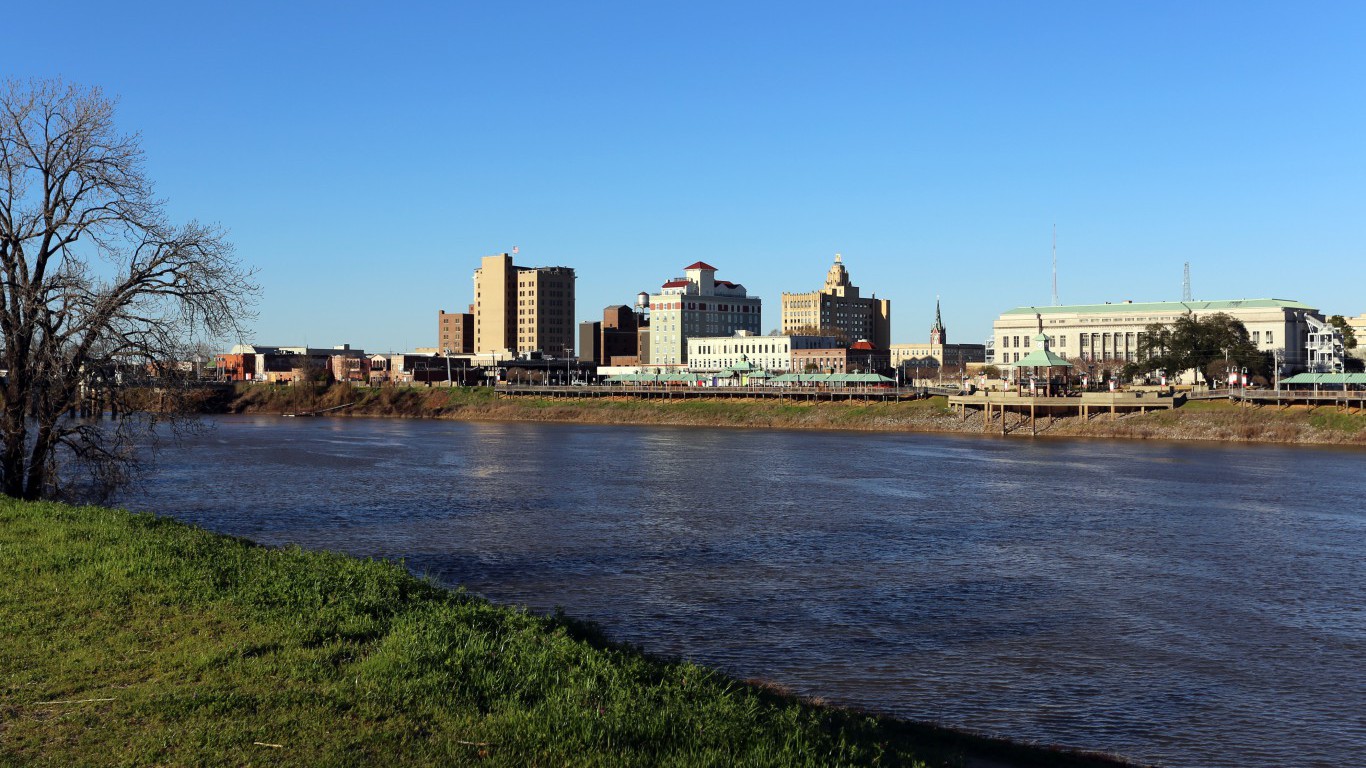
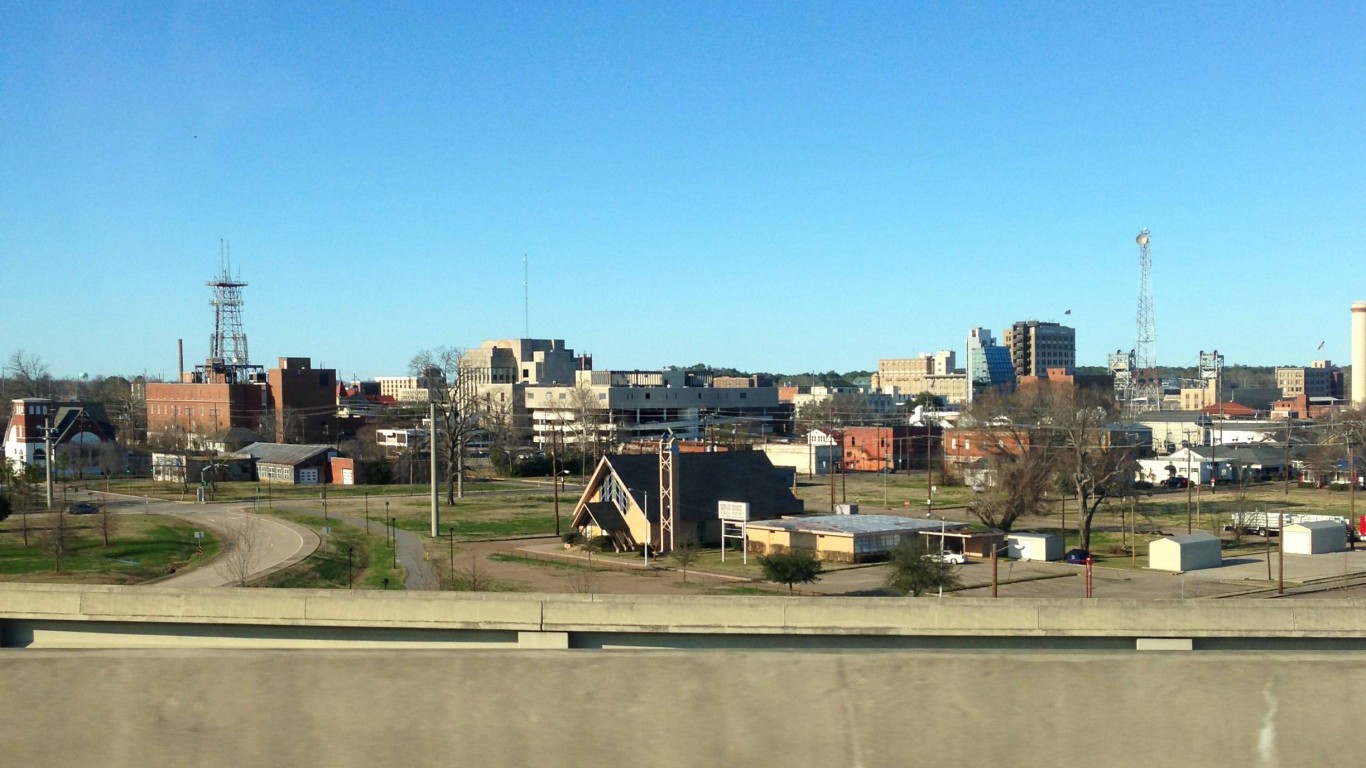
18. Monroe, LA
> Poverty rate: 23.9%
> July 2016 unemployment rate: 6.2%
> Households receiving SNAP benefits: 16.5%
> Households with income under $10,000: 10.5%

17. Bloomington, IN
> Poverty rate: 24.2%
> July 2016 unemployment rate: 4.8%
> Households receiving SNAP benefits: 8.7%
> Households with income under $10,000: 5.2%

16. Albany, GA
> Poverty rate: 24.6%
> July 2016 unemployment rate: 5.8%
> Households receiving SNAP benefits: 23.2%
> Households with income under $10,000: 12.9%
15. Sebring, FL
> Poverty rate: 24.6%
> July 2016 unemployment rate: 6.2%
> Households receiving SNAP benefits: 14.8%
> Households with income under $10,000: 5.3%
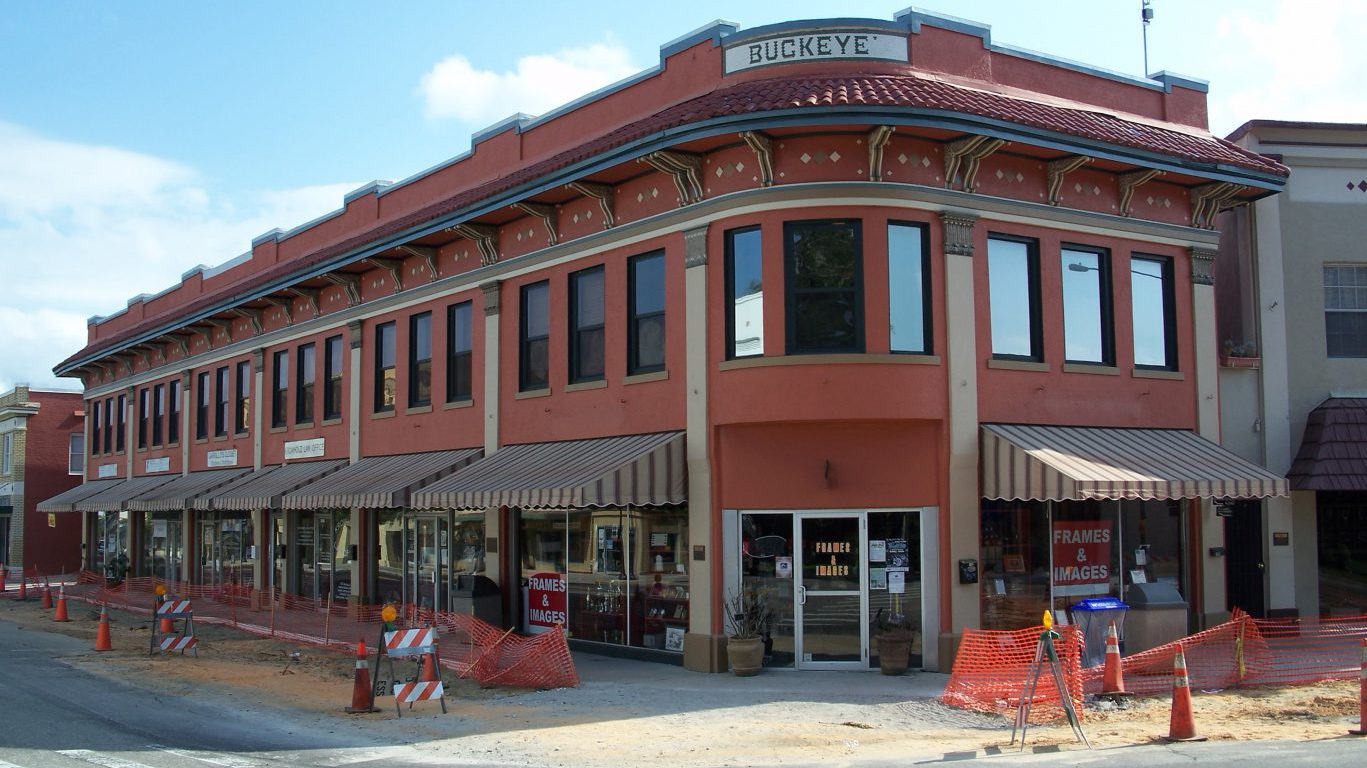
14. Hammond, LA
> Poverty rate: 24.6%
> July 2016 unemployment rate: 7.0%
> Households receiving SNAP benefits: 20.5%
> Households with income under $10,000: 6.7%
13. El Centro, CA
> Poverty rate: 25.1%
> July 2016 unemployment rate: 21.9%
> Households receiving SNAP benefits: 22.5%
> Households with income under $10,000: 8.1%

12. Fresno, CA
> Poverty rate: 25.3%
> July 2016 unemployment rate: 9.6%
> Households receiving SNAP benefits: 21.0%
> Households with income under $10,000: 8.3%
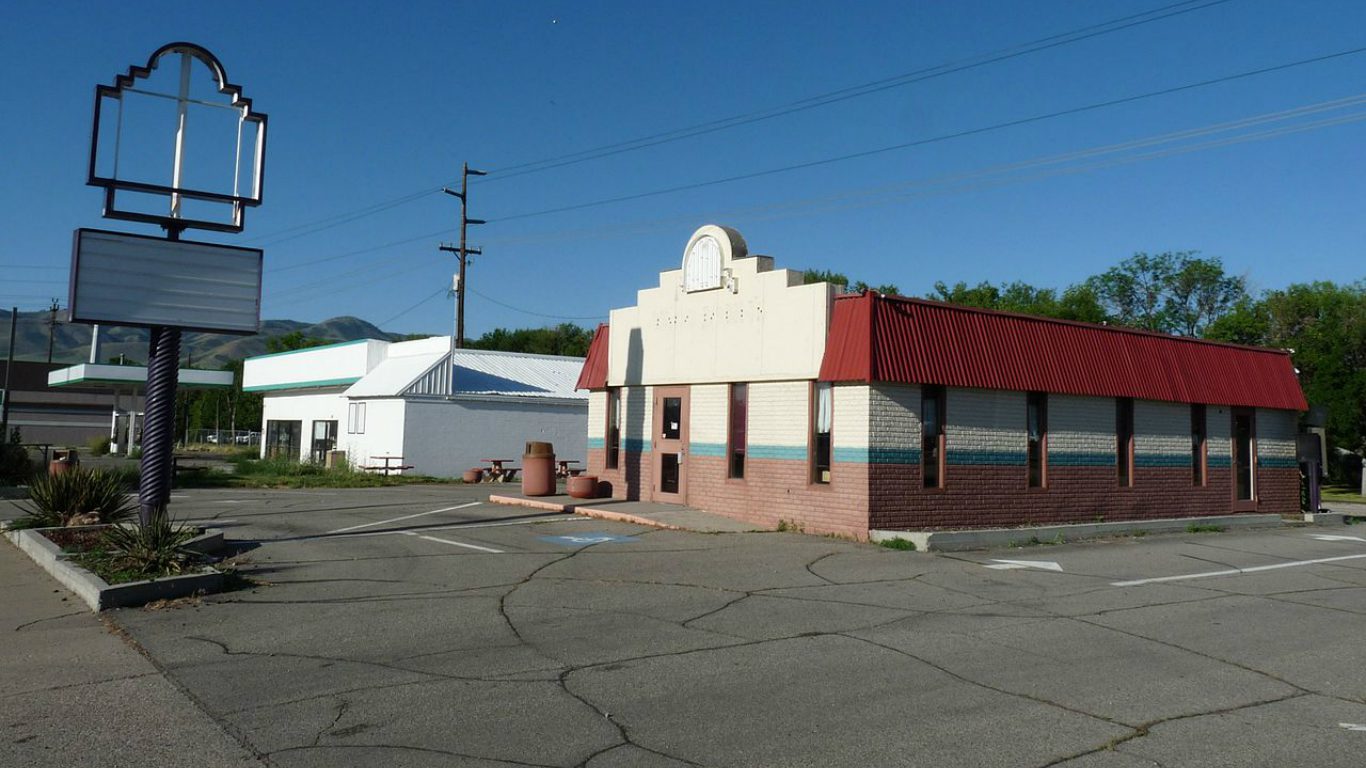
11. Pocatello, ID
> Poverty rate: 25.3%
> July 2016 unemployment rate: 3.6%
> Households receiving SNAP benefits: 15.6%
> Households with income under $10,000: 4.7%
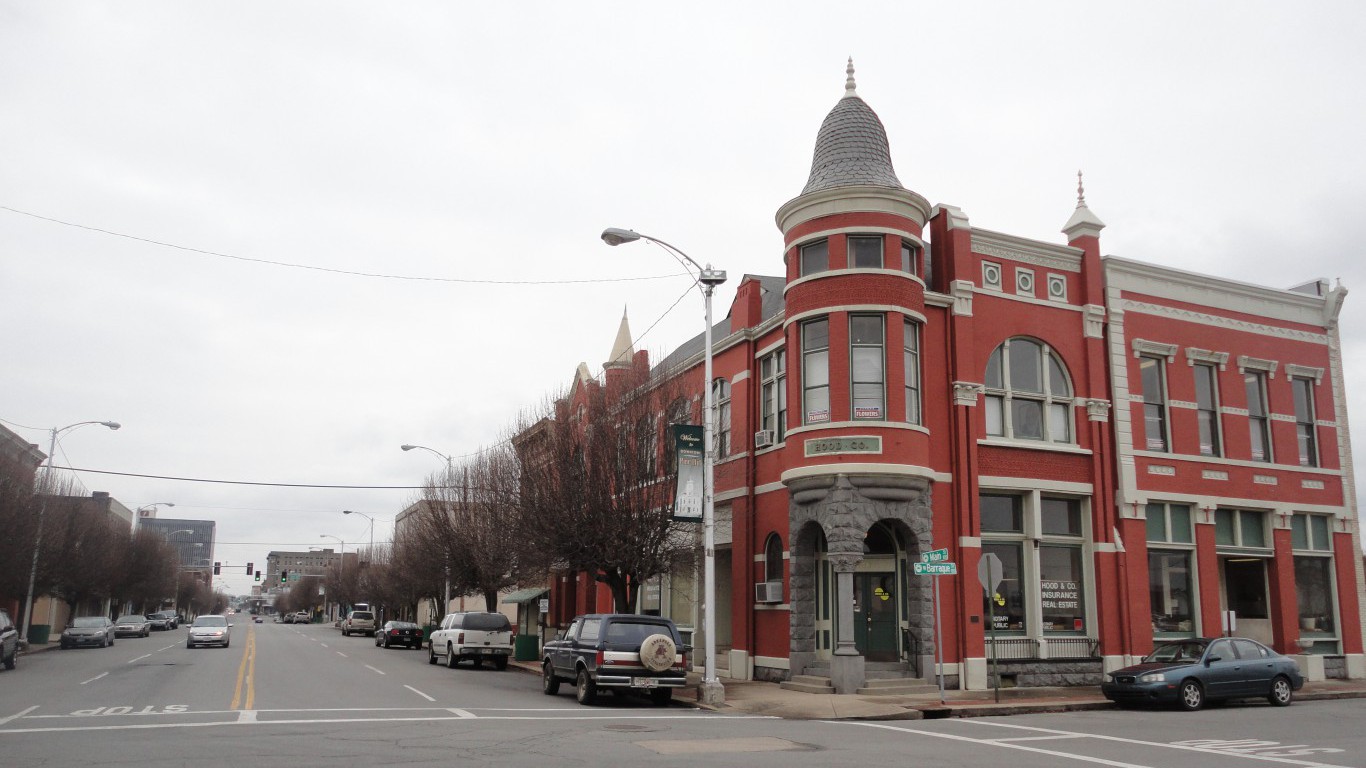
10. Pine Bluff, AR
> Poverty rate: 25.7%
> July 2016 unemployment rate: 5.2%
> Households receiving SNAP benefits: 21.0%
> Households with income under $10,000: 10.0%

9. Valdosta, GA
> Poverty rate: 26.6%
> July 2016 unemployment rate: 4.9%
> Households receiving SNAP benefits: 18.1%
> Households with income under $10,000: 7.9%

8. Merced, CA
> Poverty rate: 26.7%
> July 2016 unemployment rate: 10.7%
> Households receiving SNAP benefits: 21.5%
> Households with income under $10,000: 7.8%
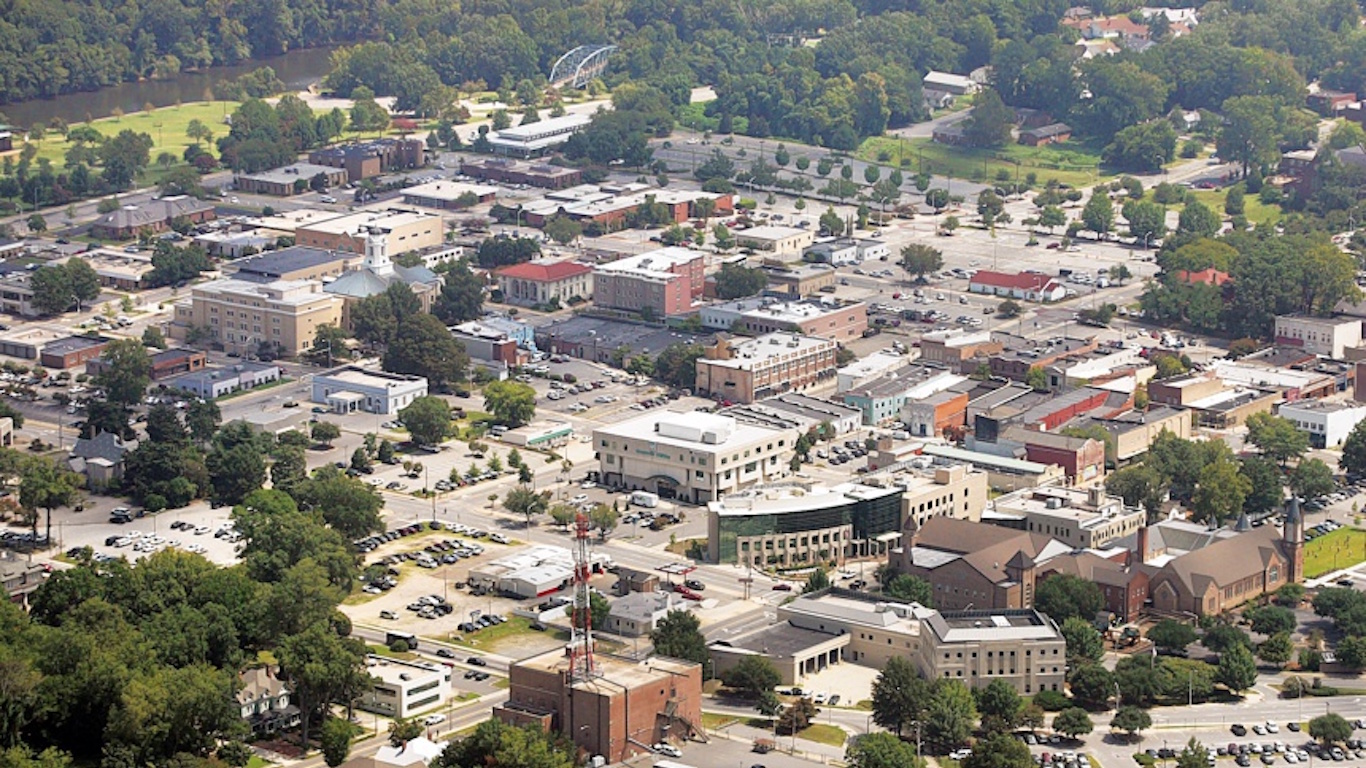
7. Greenville, NC
> Poverty rate: 26.8%
> July 2016 unemployment rate: 5.0%
> Households receiving SNAP benefits: 17.2%
> Households with income under $10,000: 6.6%

6. Athens-Clarke County, GA
> Poverty rate: 27.1%
> July 2016 unemployment rate: 4.6%
> Households receiving SNAP benefits: 12.8%
> Households with income under $10,000: 7.0%
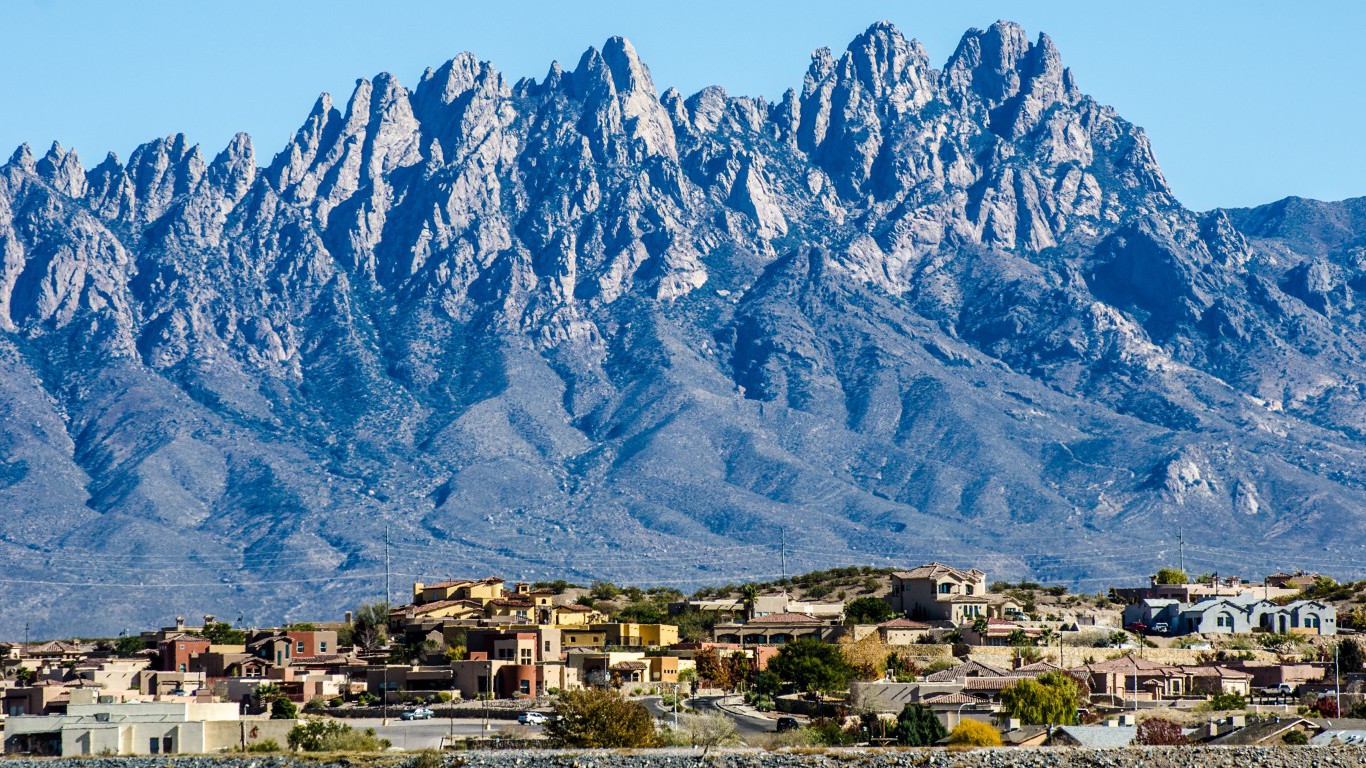
5. Las Cruces, NM
> Poverty rate: 27.1%
> July 2016 unemployment rate: 7.0%
> Households receiving SNAP benefits: 22.9%
> Households with income under $10,000: 7.7%
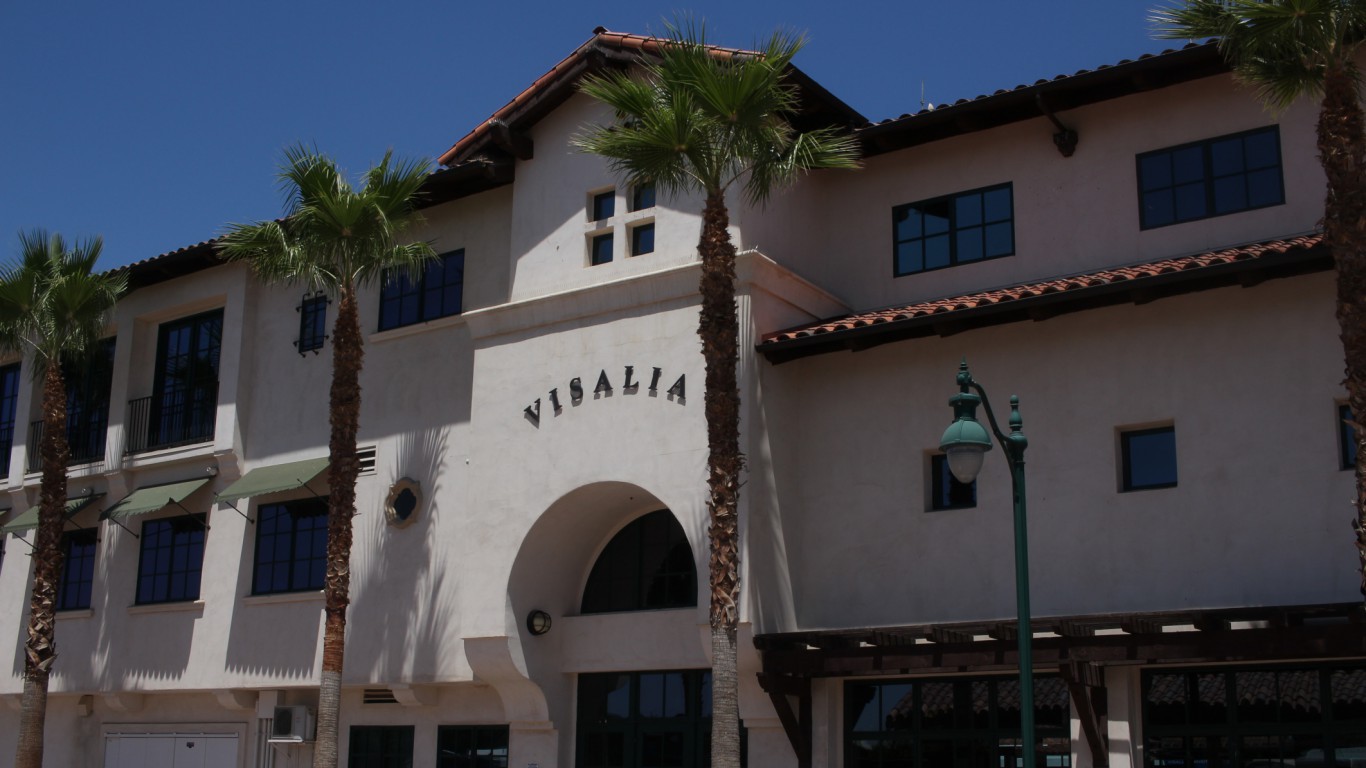
4. Visalia-Porterville, CA
> Poverty rate: 27.6%
> July 2016 unemployment rate: 11.2%
> Households receiving SNAP benefits: 24.4%
> Households with income under $10,000: 6.3%
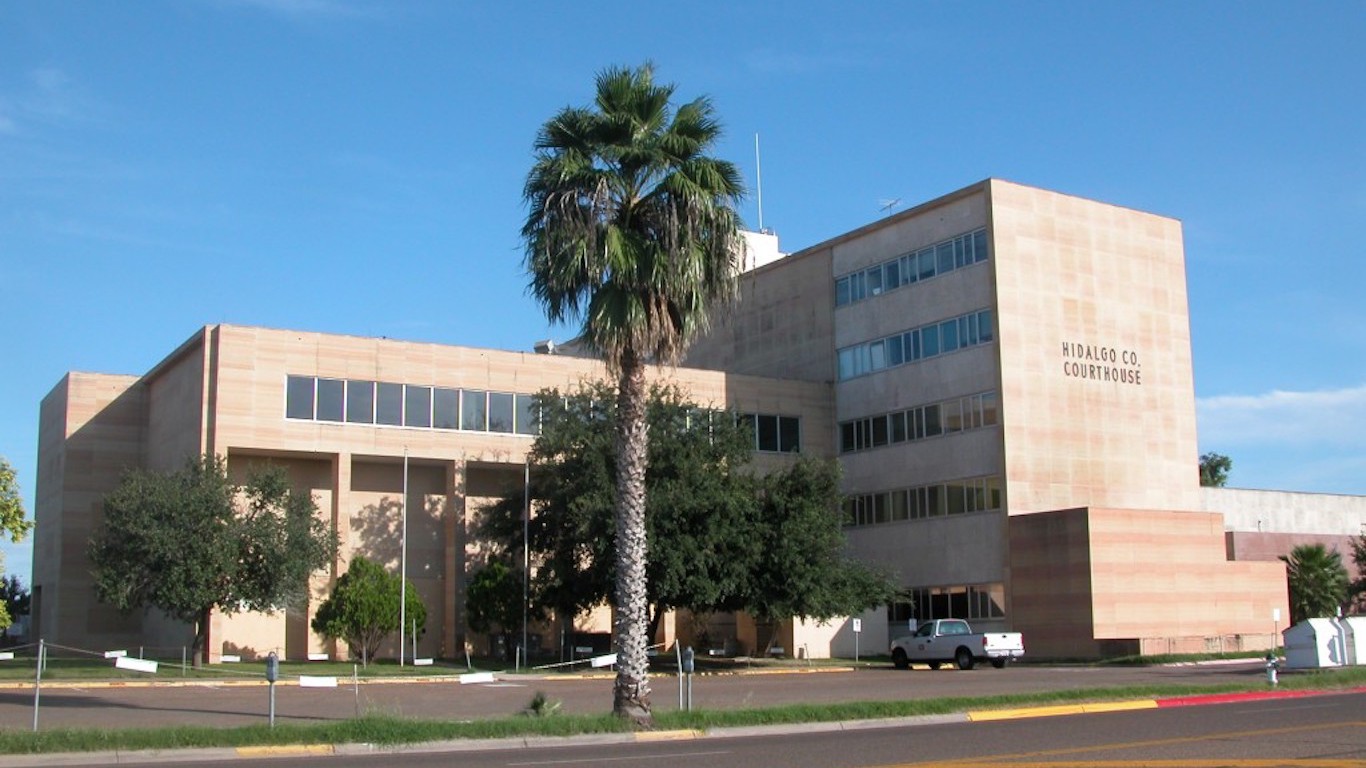
3. McAllen-Edinburg-Mission, TX
> Poverty rate: 31.5%
> July 2016 unemployment rate: 7.7%
> Households receiving SNAP benefits: 30.2%
> Households with income under $10,000: 8.8%
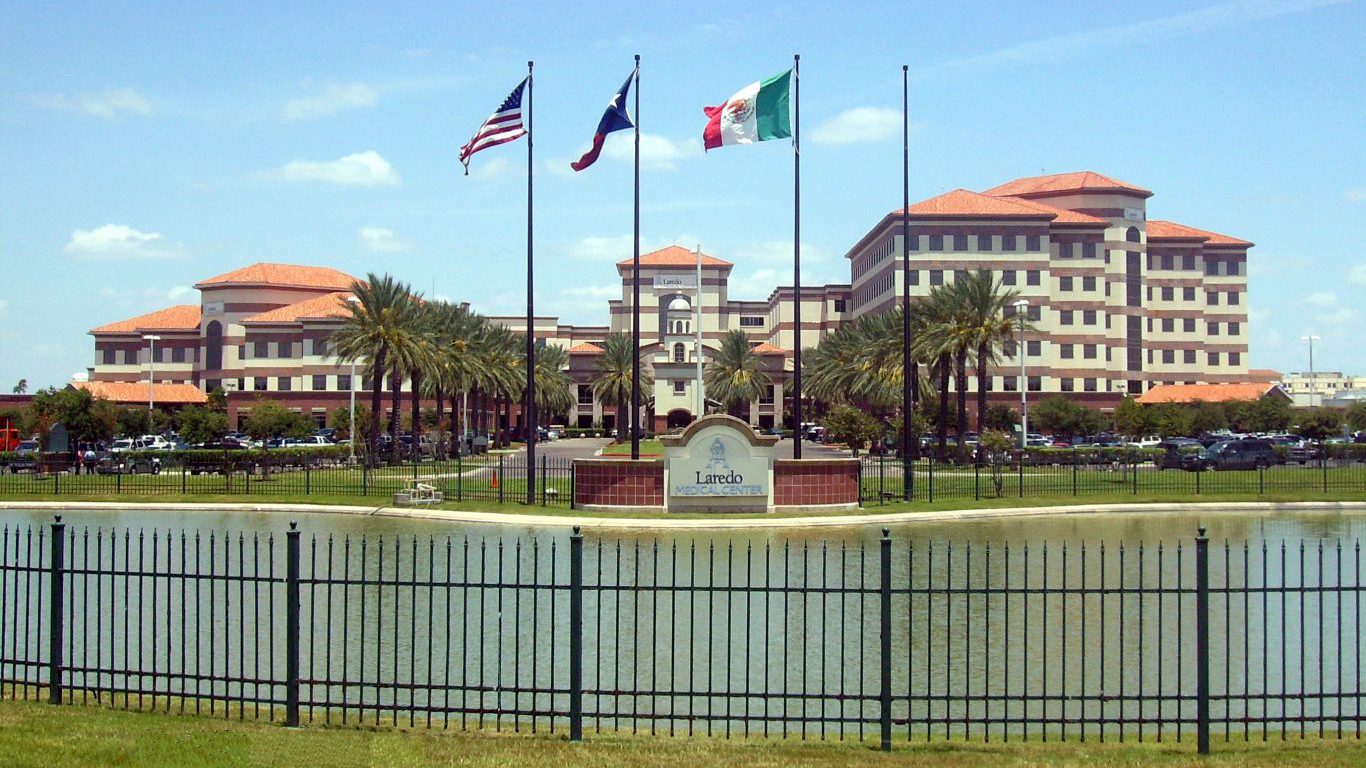
2. Laredo, TX
> Poverty rate: 31.8%
> July 2016 unemployment rate: 4.9%
> Households receiving SNAP benefits: 32.3%
> Households with income under $10,000: 9.3%

1. Brownsville-Harlingen, TX
> Poverty rate: 32.4%
> July 2016 unemployment rate: 7.2%
> Households receiving SNAP benefits: 26.5%
> Households with income under $10,000: 10.6%
The Average American Has No Idea How Much Money You Can Make Today (Sponsor)
The last few years made people forget how much banks and CD’s can pay. Meanwhile, interest rates have spiked and many can afford to pay you much more, but most are keeping yields low and hoping you won’t notice.
But there is good news. To win qualified customers, some accounts are paying almost 10x the national average! That’s an incredible way to keep your money safe and earn more at the same time. Our top pick for high yield savings accounts includes other benefits as well. You can earn up to 3.80% with a Checking & Savings Account today Sign up and get up to $300 with direct deposit. No account fees. FDIC Insured.
Click here to see how much more you could be earning on your savings today. It takes just a few minutes to open an account to make your money work for you.
Our top pick for high yield savings accounts includes other benefits as well. You can earn up to 4.00% with a Checking & Savings Account from Sofi. Sign up and get up to $300 with direct deposit. No account fees. FDIC Insured.
Thank you for reading! Have some feedback for us?
Contact the 24/7 Wall St. editorial team.
Latest from 24/7


Our expert who first called NVIDIA in 2009 is predicting 2025 will see a historic AI breakthrough.
You can follow him investing $500,000 of his own money on our top AI stocks for free.