Special Report
The Most Dangerous Cities in America

Published:
Last Updated:

The FBI reported Monday that 1,197,704 violent crimes were committed in 2015, up 3.9% from 2014. Violent crime rates are by no means uniform across the country. Some of the nation’s cities are far more dangerous than others.
24/7 Wall St. reviewed violent crime rates in major U.S. cities from the FBI’s 2015 Uniform Crime Report. Violent crime includes all offenses involving force or threat of force and are broken into four categories: murder and nonnegligent manslaughter, rape, robbery, and aggravated assault. For every 100,000 U.S. residents, 372 of these crimes were committed in 2015.
[in-text-ad]
St. Louis, Missouri led the nation with 1,817 violent crimes per 100,000 residents last year. Cary, North Carolina, by contrast, is the safest city in the nation with just 51 reported violent crimes per 100,000 city residents.
Click here to see America’s 25 most dangerous cities
Click here to see America’s 25 safest cities
Relatively crime-free cities can be found in states just a few hundred miles from some of the most violent places in the country. California is home to cities such as Irvine, Murrieta, and Sunnyvale, which have among the 10 lowest violent crime rates of all U.S. major cities. However, California is also home to some of the most violent cities in the country, including Oakland, which is just 40 miles from Sunnyvale.
In an interview with 24/7 Wall St., Nancy La Vigne, director of the Justice Policy Center at nonprofit economic and social policy research organization the Urban Institute, noted the highly localized nature of violence in the United States. “We see no connection between state policies and where these [crime] trends are up or down,” La Vigne said.
Because many diverse and complex factors can affect violence in a community, it is very difficult to predict and address violent crime. For example, some cities attempt to curb gang violence by increasing enforcement. These efforts, however, are usually not successful, “if you don’t look at issues around structural inequality and reasons why kids may be compelled to join gangs to begin with,” La Vigne explained.
In many cases, the reason for the heightened violence is the lack of law-abiding activities, including — La Vigne noted — employment opportunities. The unemployment rate exceeds the national rate of 5.3% in 19 of the 25 cities with the highest violent crime rates.
Several other social and economic factors have been tied to high violent crime. The vast majority of the cities with the highest violent crime rates tend to also report very low incomes, high poverty, and low educational attainment.
The cause and effect relationship between violent crime and measures of social well-being such as poverty, educational attainment, and employment can go in both directions. For example, people living in high-crime neighborhoods can suffer from stress and other negative social and health outcomes that can limit their chances to obtain an education and gainful employment. Or, businesses may be less likely to locate in high-crime neighborhoods, effectively limiting employment opportunities for local residents.
A relatively small percentage of the population — even within the most disadvantaged communities — is actually engaged in violence, according to La Vigne. Still, every resident of relatively unsafe communities is affected in some way by the violence that occurs there. “The difference between victim and perpetrator is often indistinguishable,” she said.
To identify the 25 most dangerous U.S. cities, 24/7 Wall St. reviewed violent crime rates in cities with at least 100,000 people from the FBI’s 2015 Uniform Crime Report released Monday. The total number and rates of murder, non negligent manslaughter, rape, robbery, and aggravated assault, which are included in the violent crime rate, as well as burglaries, larceny, motor vehicle theft, and arson — all classified as property crime — also came from the FBI’s report. We also considered these data for each year from 2011 through 2015. Annual unemployment rates for 2015 came from the Bureau of Labor Statistics (BLS). Median household income, poverty rates, the percentage of adults with at least a bachelor’s degree, population, and the percentage of adults with at least a high school diploma came from the U.S. Census Bureau’s American Community Survey (ACS).
These are America’s 25 most dangerous cities.
Editor’s Note: an earlier version of this article incorrectly referred to Anchorage as the state capital of Alaska.

25. Minneapolis, Minnesota
> Violent crimes per 100,000: 1,062.9
> 2015 murders: 47
> Poverty rate: 22.6%
> Unemployment rate: 3.3%
With a violent crime rate of 1,063 reported incidents for every 100,000 residents, nearly three times the corresponding national rate, Minneapolis is one of the most dangerous cities in the country. Robbery is especially common in the Midwestern city, with 459 reported incidents per 100,000 residents, the 10th highest rate of any American city.
[in-text-ad]
Poor economic conditions can often lead to large populations of disengaged young men — the group most likely to commit violent crimes. However, Minneapolis’s economy is fairing better than the country as a whole. The city’s 3.3% unemployment rate in 2015 was well below the national 5.3% rate that year.
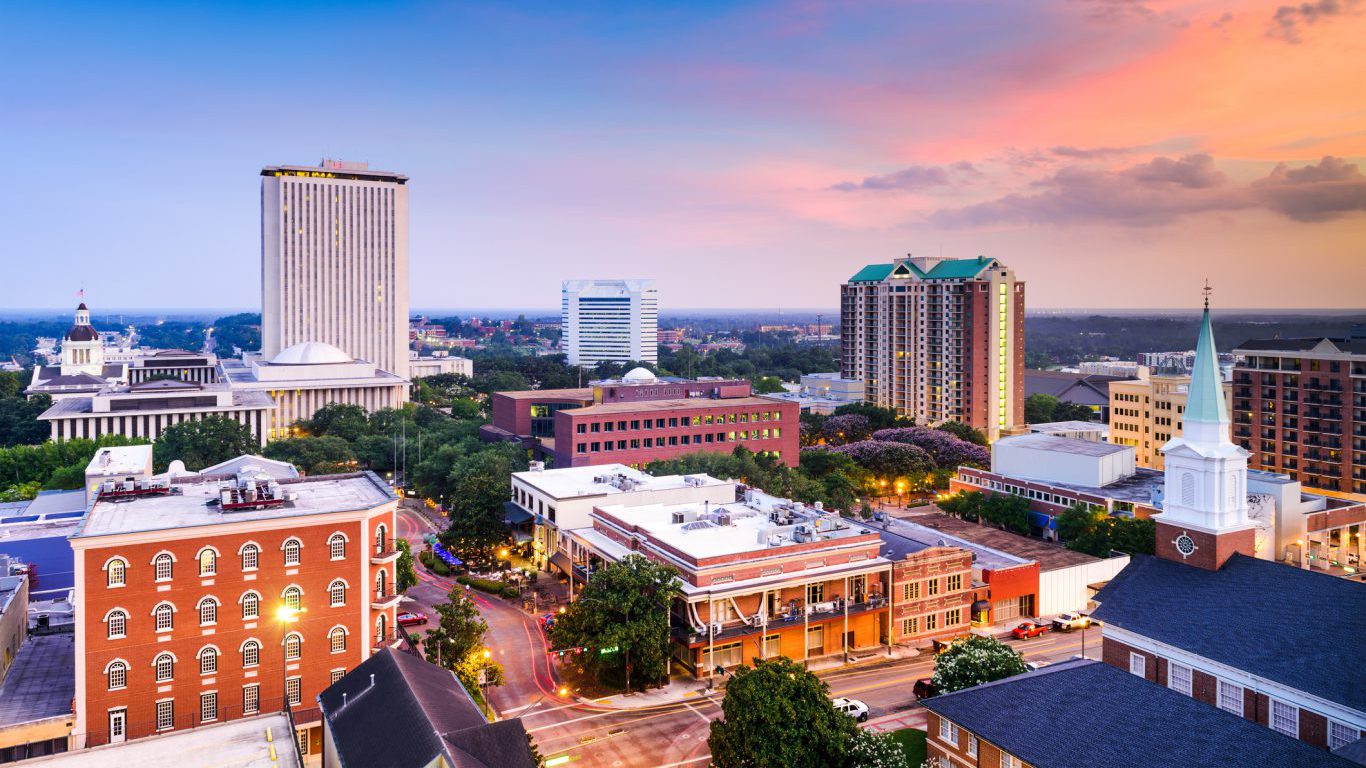
24. Tallahassee, Florida
> Violent crimes per 100,000: 1,064.3
> 2015 murders: 16
> Poverty rate: 31.1%
> Unemployment rate: 5.2%
Tallahassee’s violent crime rate of 1,064 incidents per 100,000 residents in 2015 was nearly triple the national violent crime rate. Particularly, the state capital reported the seventh highest rate of rape in the country and the 18th highest rate of aggravated assault. Violent crime in the city spiked considerably in recent years. The 2015 violent crime rate was 21.6% higher than it was half a decade prior.

23. Springfield, Illinois
> Violent crimes per 100,000: 1,070.4
> 2015 murders: 11
> Poverty rate: 18.6%
> Unemployment rate: 5.6%
With less than 120,000 residents, Springfield, Illinois is smaller than the majority of America’s most dangerous cities. Across the country, aggravated assault is the most common type of violent crime. In keeping with that trend, the 880 reported incidents of aggravated assault in 2015 were the primary driver to the city’s high violent crime rate.
[in-text-ad-2]

22. Anchorage, Alaska
> Violent crimes per 100,000: 1,070.9
> 2015 murders: 26
> Poverty rate: 8.3%
> Unemployment rate: 5.0%
Alaska consistently struggles with high incidence of rape, as is evident from the high rate of rape Anchorage reported last year — the third highest of any major U.S. city. The 517 reported rapes in the city last year amounted to 172 incidents per 100,000 residents, significantly more than four times the corresponding national rate of 39 incidents per 100,000 people.

21. Springfield, Massachusetts
> Violent crimes per 100,000: 1,073.4
> 2015 murders: 18
> Poverty rate: 30.1%
> Unemployment rate: 9.3%
A depressed economy often drives up crime rates, as young men — the most likely perpetrators of violent crime — are less likely to be socially engaged. With a near nation leading 9.3% unemployment rate in 2015, economic opportunities in Springfield, Massachusetts are scarce. The same year, there were 1,073 violent crimes, including murder, rape, and robbery in Springfield per 100,000 residents.

20. Buffalo, New York
> Violent crimes per 100,000: 1,118.6
> 2015 murders: 41
> Poverty rate: 30.9%
> Unemployment rate: 7.1%
Buffalo’s violent crime rate of 1,119 per 100,000 in 2015 was slightly more than three times the national violent crime rate. With few exceptions, nonviolent crime — which includes burglary, larceny, arson, and motor vehicle theft — tends to be higher in areas with more violent crime, and Buffalo is no different. The city’s nonviolent crime rate of 4,330 per 100,000 residents in 2015 was also much higher than the national rate of 2,487 that year. Buffalo had the sixth highest arson rate of any major U.S. city.
[in-text-ad]
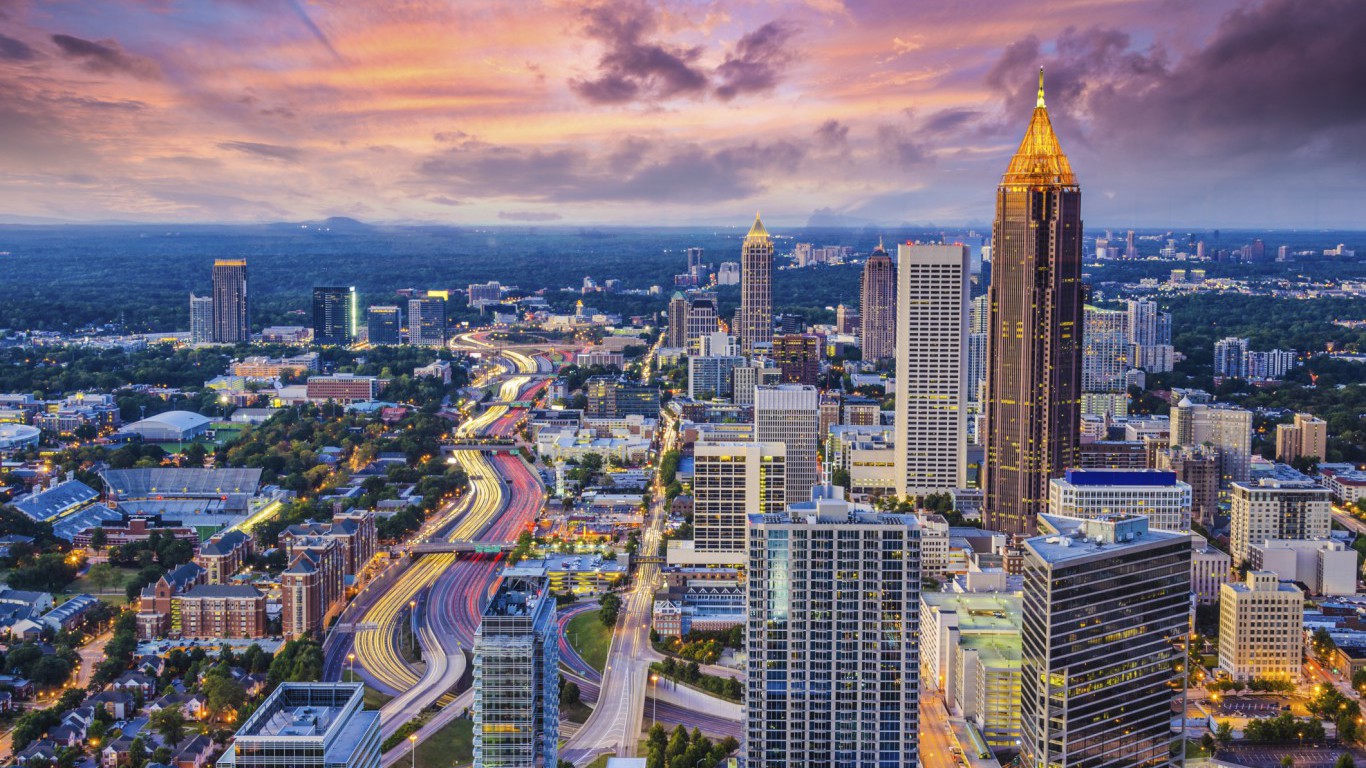
19. Atlanta, Georgia
> Violent crimes per 100,000: 1,119.6
> 2015 murders: 94
> Poverty rate: 25.2%
> Unemployment rate: 6.3%
High crime rates often accompany poor economic conditions. In Atlanta, a city with one of the highest violent crime rates in the country, more than a quarter of the population lives in poverty, far more than is typical in most American cities.
Despite being one of the most dangerous U.S. cities, Atlanta’s violent crime rate is actually an improvement from five years ago. The city’s 2015 violent crime rate was 14.7% is lower than it was in 2011.
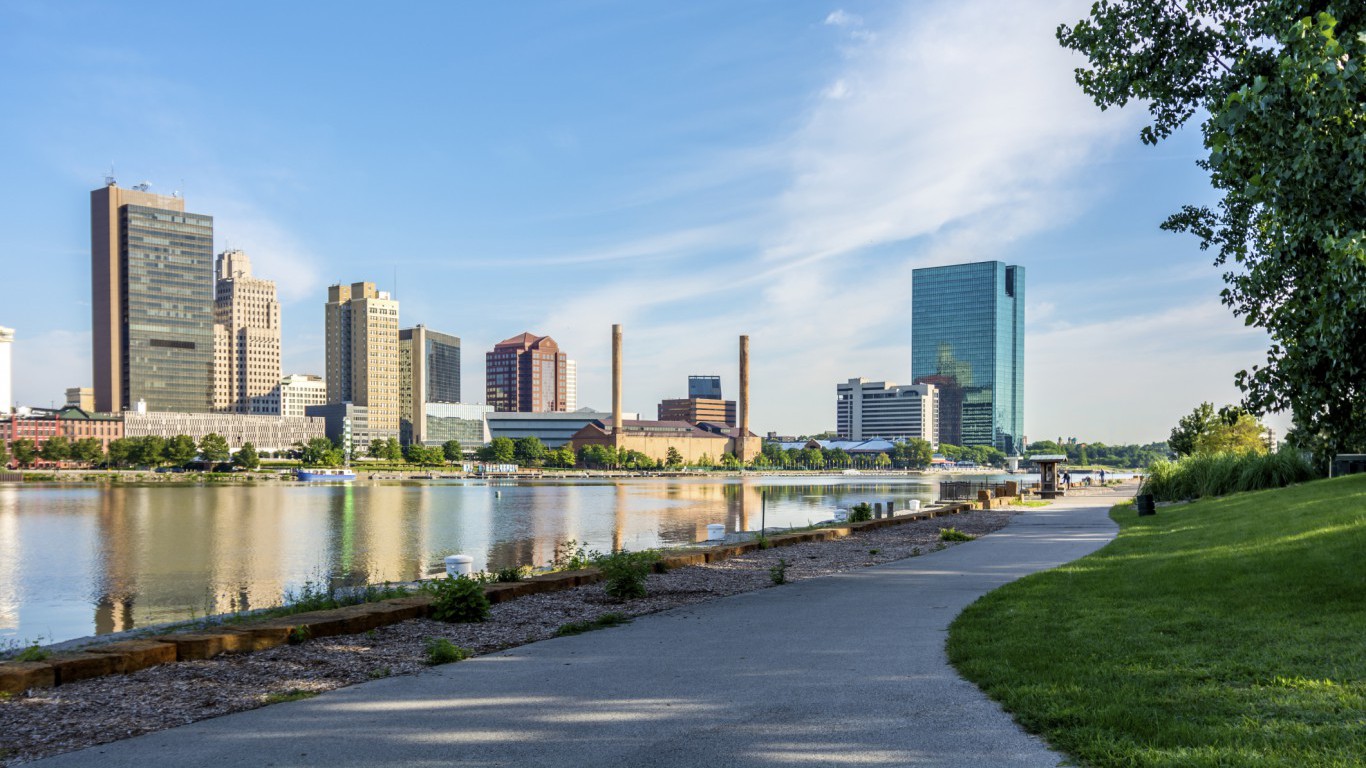
18. Toledo, Ohio
> Violent crimes per 100,000: 1,128.9
> 2015 murders: 24
> Poverty rate: 27.7%
> Unemployment rate: 5.8%
Though it was not an especially safe place to begin with, Toledo, Ohio has gotten considerably more dangerous in the last five years. The city’s violent crime rate in 2011 was 998 incidents per 100,000 people, 10% lower than the 2015 violent crime rate.
In keeping with the national trend, the incidence of aggravated assaults contributed most to the Ohio city’s total violent crime rate.

17. Hartford, Connecticut
> Violent crimes per 100,000: 1,140.9
> 2015 murders: 32
> Poverty rate: 34.4%
> Unemployment rate: 10.4%
While the relationship between crime and education is complicated, furthering one’s education can lead to better employment and earnings opportunities, which in return may help reduce the likelihood of crime. In Hartford, just 15% of adults have a college degree, roughly half the corresponding national rate. The city ranks among the worst 10 U.S. cities in both poverty and unemployment. A lack of a strong labor market has likely contributed to the Connecticut capital’s extremely high violent crime rate.

16. Lansing, Michigan
> Violent crimes per 100,000: 1,157.0
> 2015 murders: 09
> Poverty rate: 29.4%
> Unemployment rate: 6.3%
Lansing is 16th most dangerous city in the country and the second most dangerous in Michigan. High crime rates often accompany poor economic conditions, and many in Lansing are struggling. Nearly 30% of the city’s population lives below the poverty line, almost double the national poverty rate.
Murders typically comprise the smallest share of violent crime and they are especially uncommon in Lansing. The city had only 9 murders in 2015, after adjusting for population, this was the second lowest murder rate of all of America’s most dangerous cities.
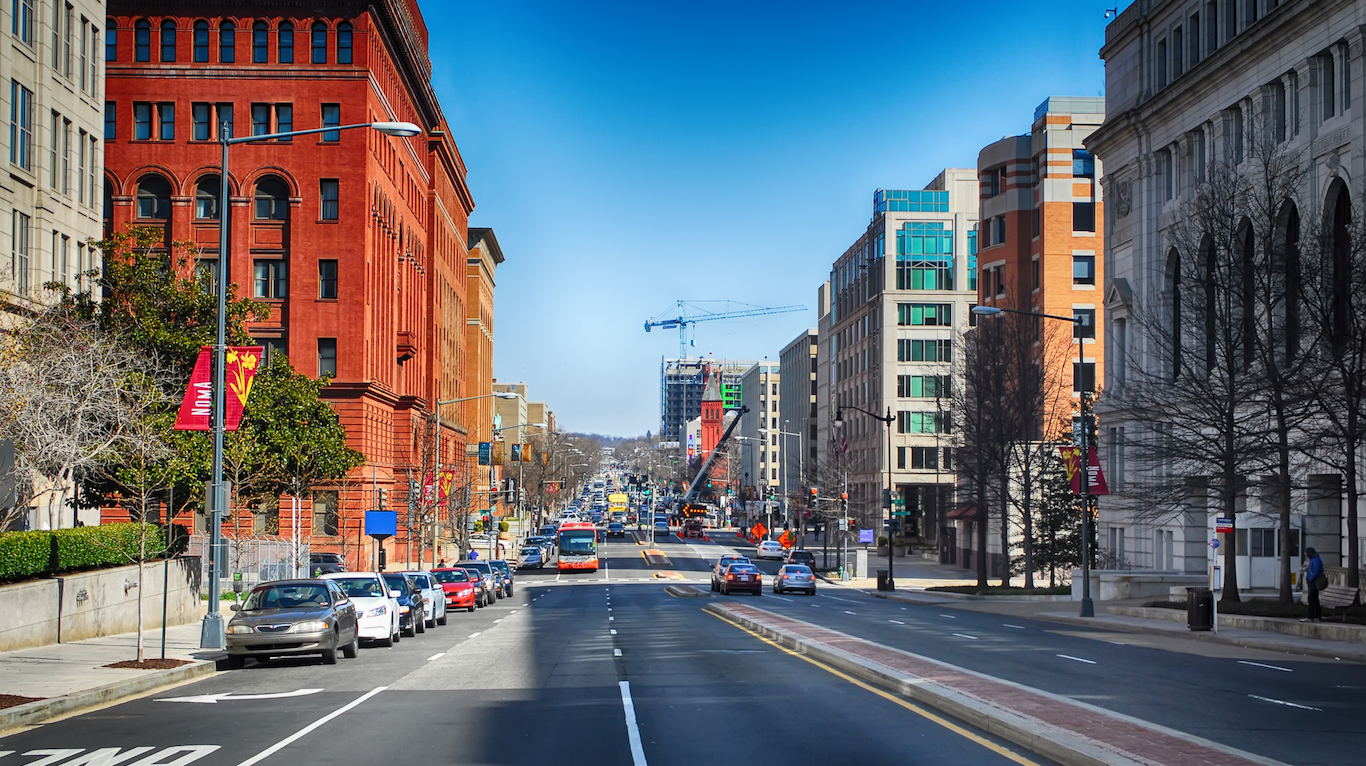
15. Washington, District of Columbia
> Violent crimes per 100,000: 1,202.6
> 2015 murders: 162
> Poverty rate: 18.2%
> Unemployment rate: 6.9%
With over 8,000 violent crimes in 2015, Washington D.C. is one of the most dangerous cities in the country. Robberies are especially common in the nation’s capital, with 506 incidents per 100,000 residents, roughly five times the corresponding national rate. There were also 162 murders in the city in 2015, more than in all but nine other cities.
[in-text-ad]

14. San Bernardino, California
> Violent crimes per 100,000: 1,245.9
> 2015 murders: 44
> Poverty rate: 33.0%
> Unemployment rate: 8.2%
While the relationship between violent crime and socioeconomic measures — such as education, poverty, and unemployment — is complicated, cities with high rates of violent crime tend to also share certain characteristics. For example, as is the case with most violent cities, San Bernardino adults tend to have belowaverage educational attainment. In fact, just 67.7% of the area’s adults have a high school diploma and 11.7% a college degree. These are nearly the lowest rates of any major U.S. city.
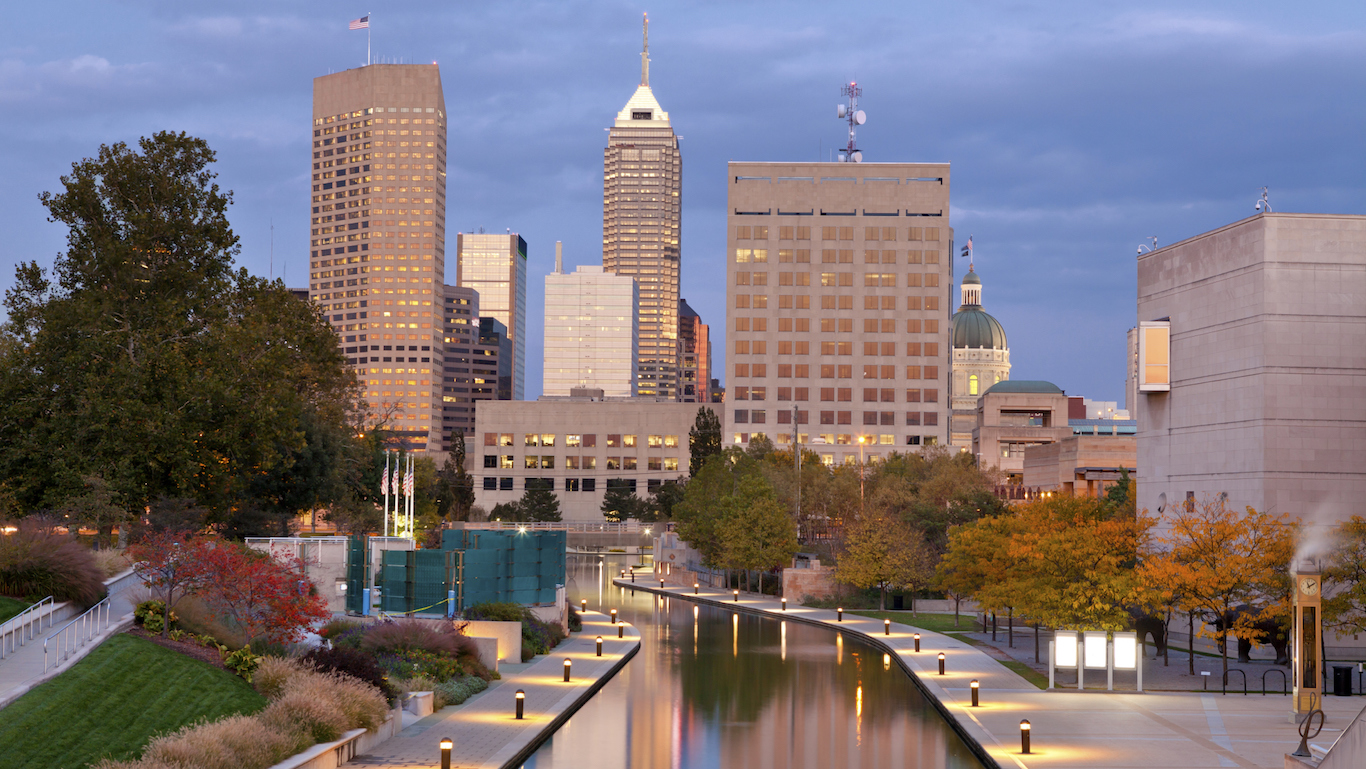
13. Indianapolis, Indiana
> Violent crimes per 100,000: 1,288.0
> 2015 murders: 148
> Poverty rate: 21.4%
> Unemployment rate: 5.0%
Aggravated assault and robbery contribute the most to violent crime nationwide — and Indianapolis is no different. The city reported 440 robberies and 752 aggravated assaults per 100,000 people in 2015, much more than the national rates of 102 and 238 per 100,000 people, respectively. The murder and rape rates in Indianapolis were also well above the national figures.
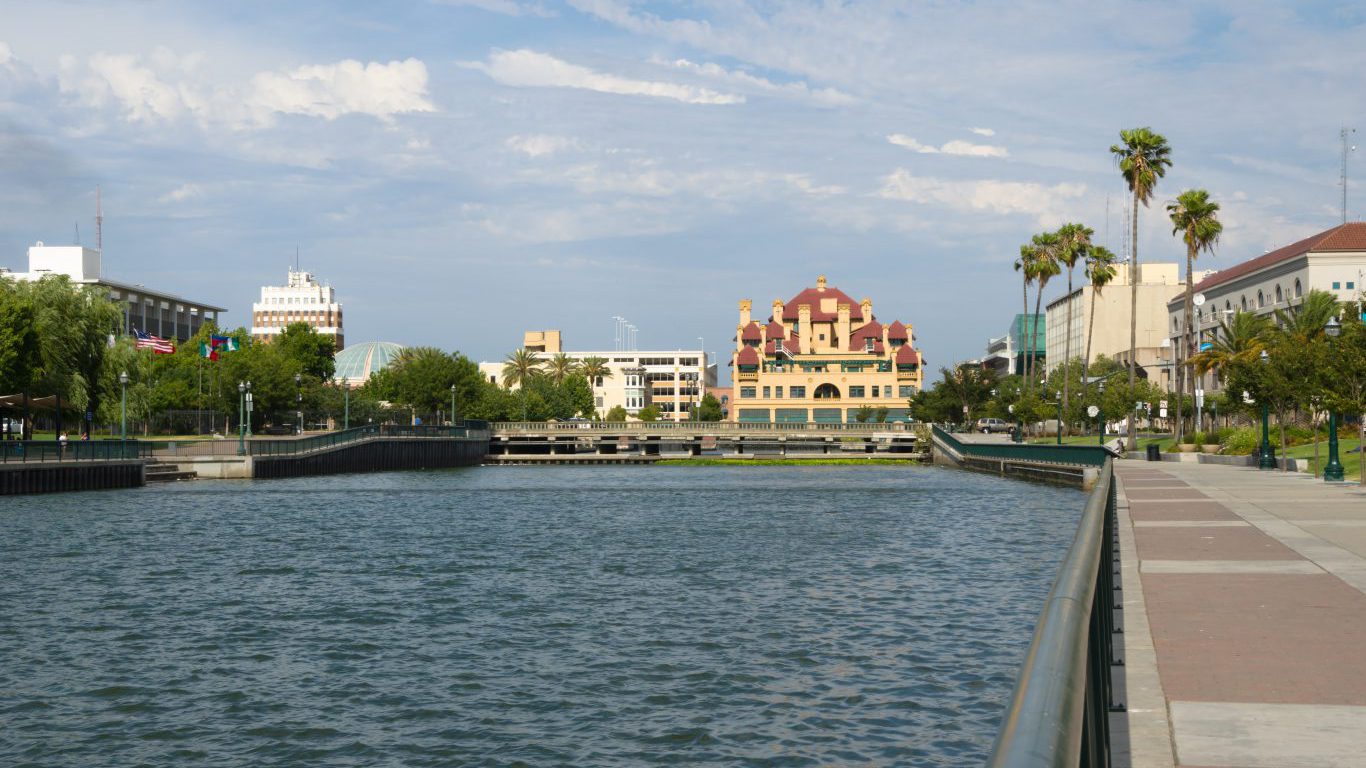
12. Stockton, California
> Violent crimes per 100,000: 1,352.0
> 2015 murders: 49
> Poverty rate: 25.8%
> Unemployment rate: 9.6%
While the relationship is not always clear cut, those who have access to a decent-paying job appear to be less likely to engage in either violent or nonviolent crime. It may also be the case that violent crime can, for a number of reasons, stunt a regional economy and the earning potential of the area’s residents. At the very least, both unemployment and poverty are very high in the majority of high crime cities. Stockton, California exhibits similar trends. The city, which has the 12th-highest violent crime rate of major U.S. cities, also had the fifth highest annual unemployment rate and, and more than one in every four residents live in poverty.

11. Springfield, Missouri
> Violent crimes per 100,000: 1,355.6
> 2015 murders: 10
> Poverty rate: 26.4%
> Unemployment rate: 4.3%
Crime rates tend to be higher in economically depressed areas where opportunities are scarce. In Springfield, Missouri, more than one-quarter of area residents live in poverty, one of the highest poverty rates in the country. After spiking by 73.2% over the five years through 2015 — the second highest increase of any major U.S. city — Springfield’s violent crime rate is the 11th highest in the country. In 2015, there were 179 rapes for every 100,000 residents, the highest incidence of rape in the country.
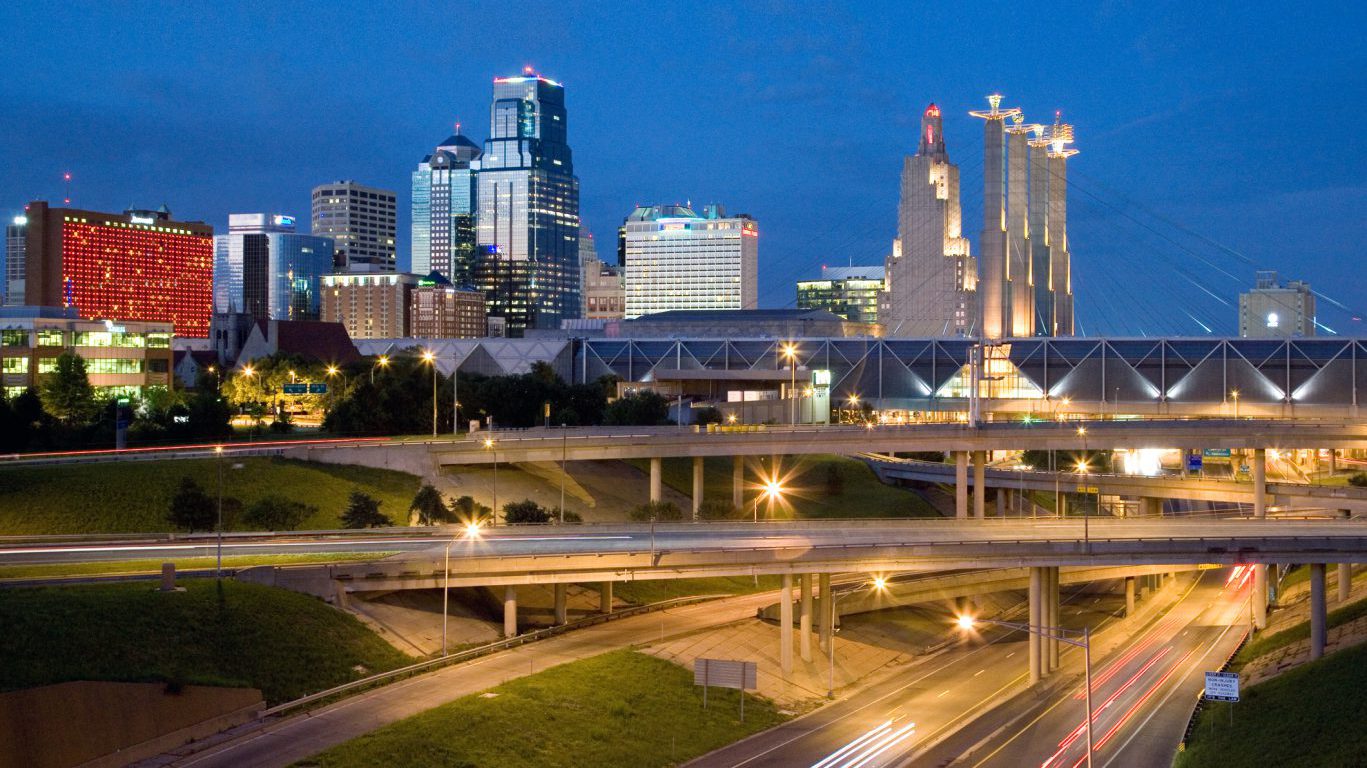
10. Kansas City, Missouri
> Violent crimes per 100,000: 1,417.3
> 2015 murders: 109
> Poverty rate: 19.4%
> Unemployment rate: 5.5%
While the nationwide violent crime rate rose by 3.9% in 2015, the increase in Kansas City was far more dramatic. With homicide and aggravated assault rates surging, the city reported a 14.4% spike in violent crime last year. Crime in the city is up even more from five years ago. The city’s violent crime rate increased by 21.2% from 2011 through 2015, even as the nationwide rate declined by 0.7% over that period.
[in-text-ad]

9. Oakland, California
> Violent crimes per 100,000: 1,442.5
> 2015 murders: 85
> Poverty rate: 21.0%
> Unemployment rate: 5.9%
Nationwide aggravated assaults are more than twice as common as robberies. In a handful of cities, however, including Oakland, the robbery rate is higher than the aggravated assault rate. With 3,290 robberies, or 784 for every 100,000 residents, Oakland has the highest robbery rate in the country. There were 570 aggravated assaults reported for every 100,000 city residents, still more than double the national rate.

8. Little Rock, Arkansas
> Violent crimes per 100,000: 1,485.0
> 2015 murders: 32
> Poverty rate: 18.0%
> Unemployment rate: 4.7%
Property crime rates declined across the country in 2015, while violent crime rates increased. In keeping with the broader trend, Little Rock’s property crimes declined by 9.8%, while the violent crime rate increased by 6.9%. Both changes outpaced the respective 3.9% and 7.8% national changes, however.
With the sixth highest aggravated assault rate in the country, Little Rock is the only city in Arkansas to rank among the nation’s most dangerous.

7. Baltimore, Maryland
> Violent crimes per 100,000: 1,535.9
> 2015 murders: 344
> Poverty rate: 24.2%
> Unemployment rate: 7.7%
While murders are far less common than the other offenses that comprise violent crime, Baltimore has recently earned a national spotlight for its near-nation-leading murder rate. Baltimore has the second highest murder rate of major U.S. cities — at 55 murders for every 100,000 residents, it is more than 11 times the national murder rate. The number of murders in Baltimore have risen considerably over the last five years. There were 196 reported incidents of murder and nonnegligent manslaughter in Baltimore in 2011. Last year, there were 344.

6. Rockford, Illinois
> Violent crimes per 100,000: 1,585.3
> 2015 murders: 19
> Poverty rate: 25.4%
> Unemployment rate: 8.3%
After Memphis, Tennessee, Rockford, Illinois has the highest rate of aggravated assault in the country. High crime areas often lack economic opportunity, and Rockford is no exception. More than a quarter of area residents live in poverty, and the city’s 8.3% unemployment rate in 2015 was nearly the highest in the country.
Rockford’s violent crime rate surged by 27.2% in 2015, one of the most dramatic increases in the country.
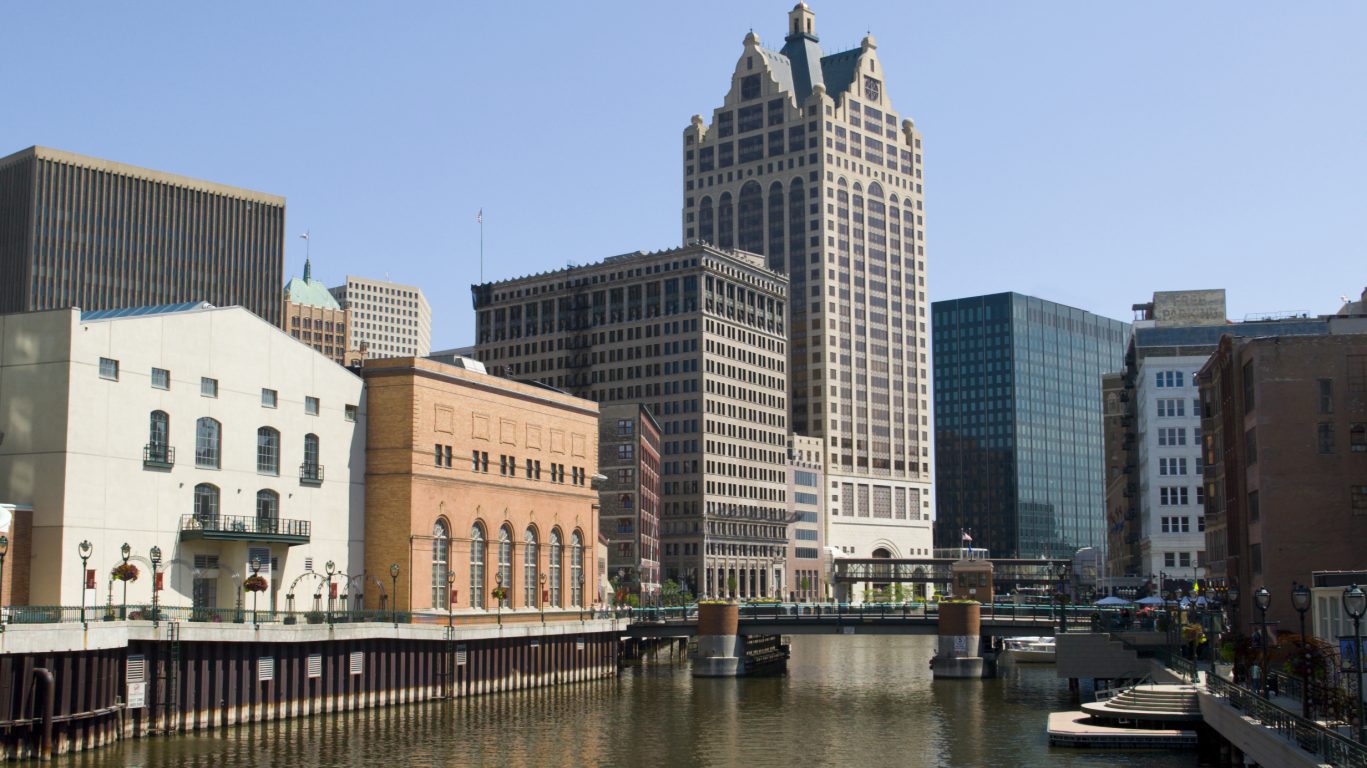
5. Milwaukee, Wisconsin
> Violent crimes per 100,000: 1,596.1
> 2015 murders: 145
> Poverty rate: 29.4%
> Unemployment rate: 6.7%
Even as the nation’s population increased by 3.2% over the five years ending in 2015, violent crime fell by 0.7% over that period. In Milwaukee, however, although the population rose by just 0.5%, the number of violent crimes rose by 60.5% — from less than 6,000 incidents to more than 9,500. In just five years, the city moved from the 29th most dangerous city to the fifth most dangerous among major U.S. cities. A major driver of that increase was aggravated assault incidents — the number of aggravated assaults nearly doubled during that time.
[in-text-ad]
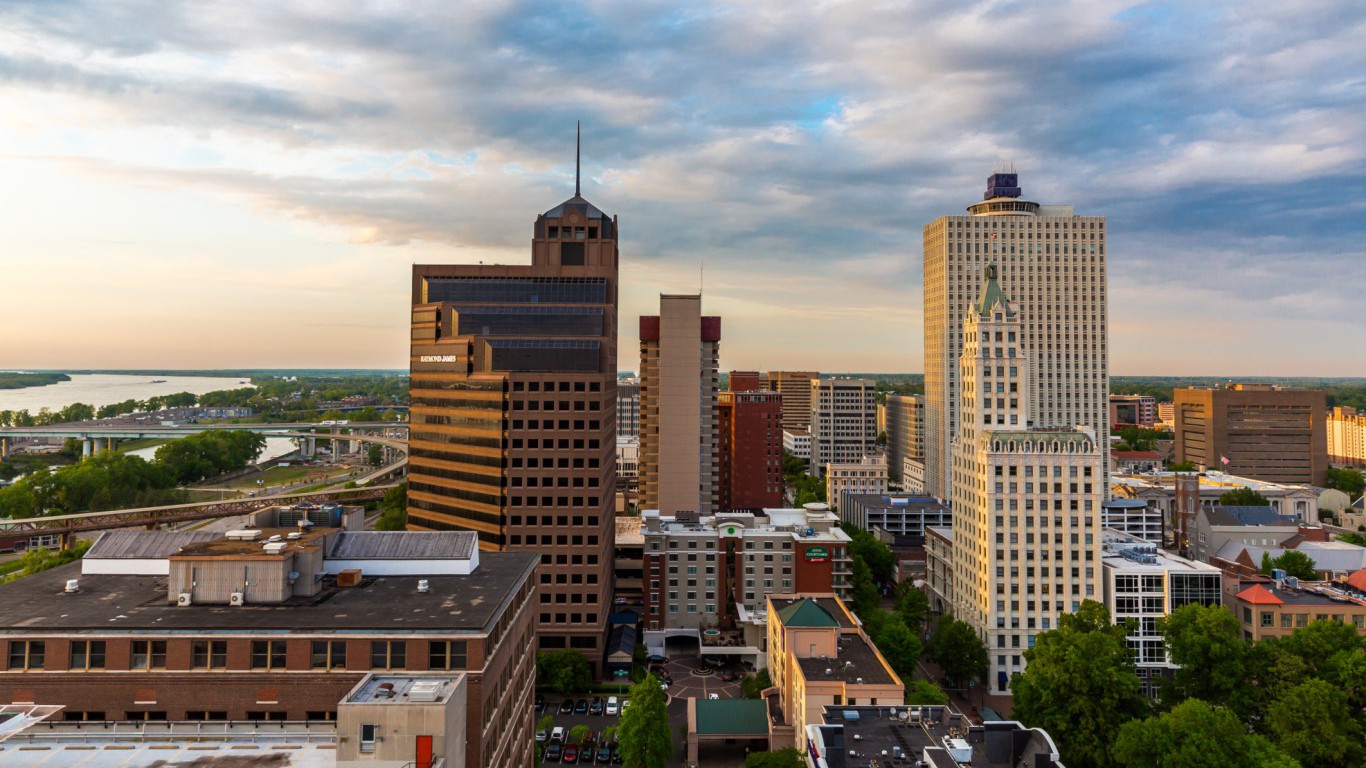
4. Memphis, Tennessee
> Violent crimes per 100,000: 1,740.1
> 2015 murders: 135
> Poverty rate: 27.4%
> Unemployment rate: 7.3%
Memphis’s violent crime rate of 1,740 incidents per 100,000 residents trails only three other U.S. cities. Nationwide, aggravated assault is the most common of all violent crimes. In Memphis, there were 7,653 reported aggravated assaults in 2015, or 1,163 per 100,000 people, the highest such rate of any other city.
Like many violent cities, Memphis’s economy is in poor shape. More than a quarter of city residents live below the poverty line, and the 7.3% unemployment rate in 2015 was 2 percentage points higher than national unemployment rate.
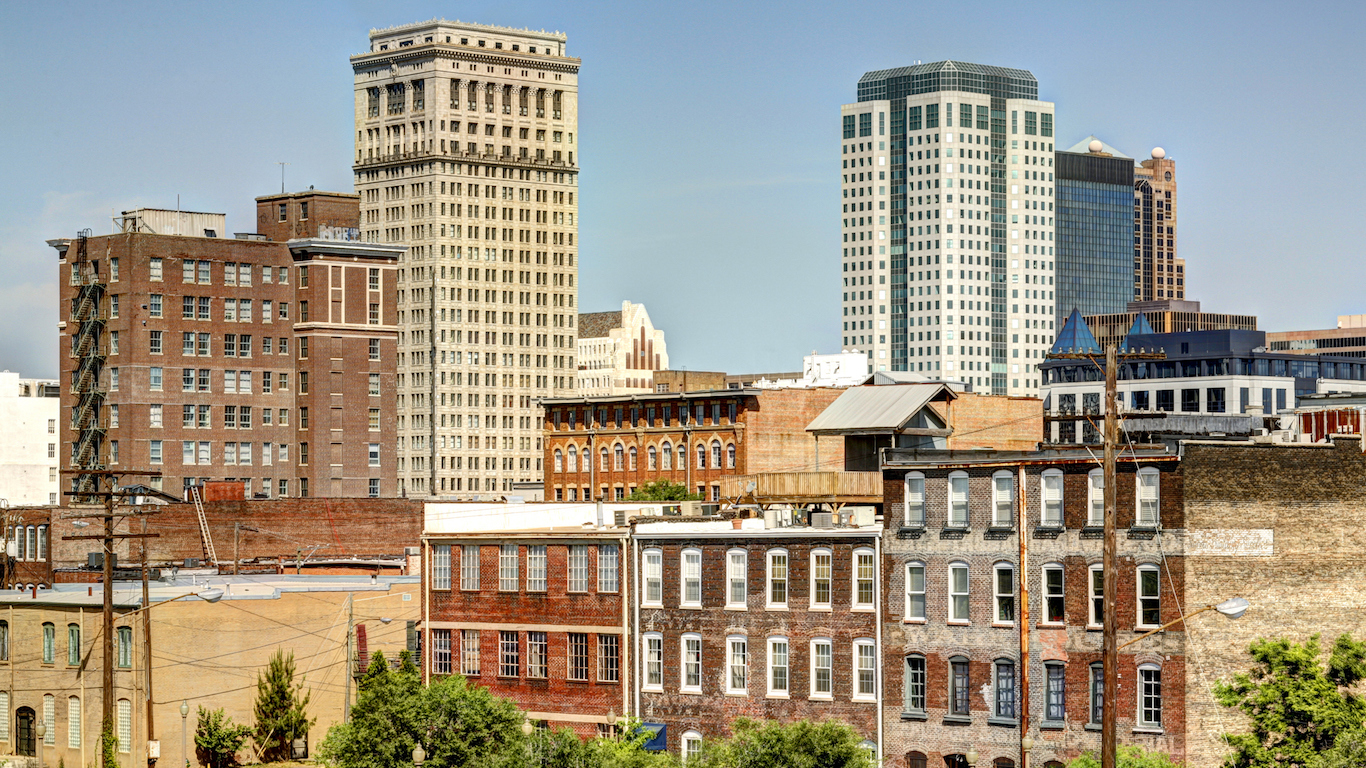
3. Birmingham, Alabama
> Violent crimes per 100,000: 1,746.2
> 2015 murders: 79
> Poverty rate: 31.0%
> Unemployment rate: 7.2%
Violent crime in Birmingham, Alabama’s increased by 10% from 2014 and by 17.2% from 2011. As the third most violent city in the country, Birmingham’s murder, robbery, and aggravated assault rates are each among the top five of all major U.S. cities. As in many high crime areas, poverty is relatively common in Birmingham. Citywide, 31% of residents live in poverty, a higher poverty rate than that of all but a dozen other large U.S. cities.
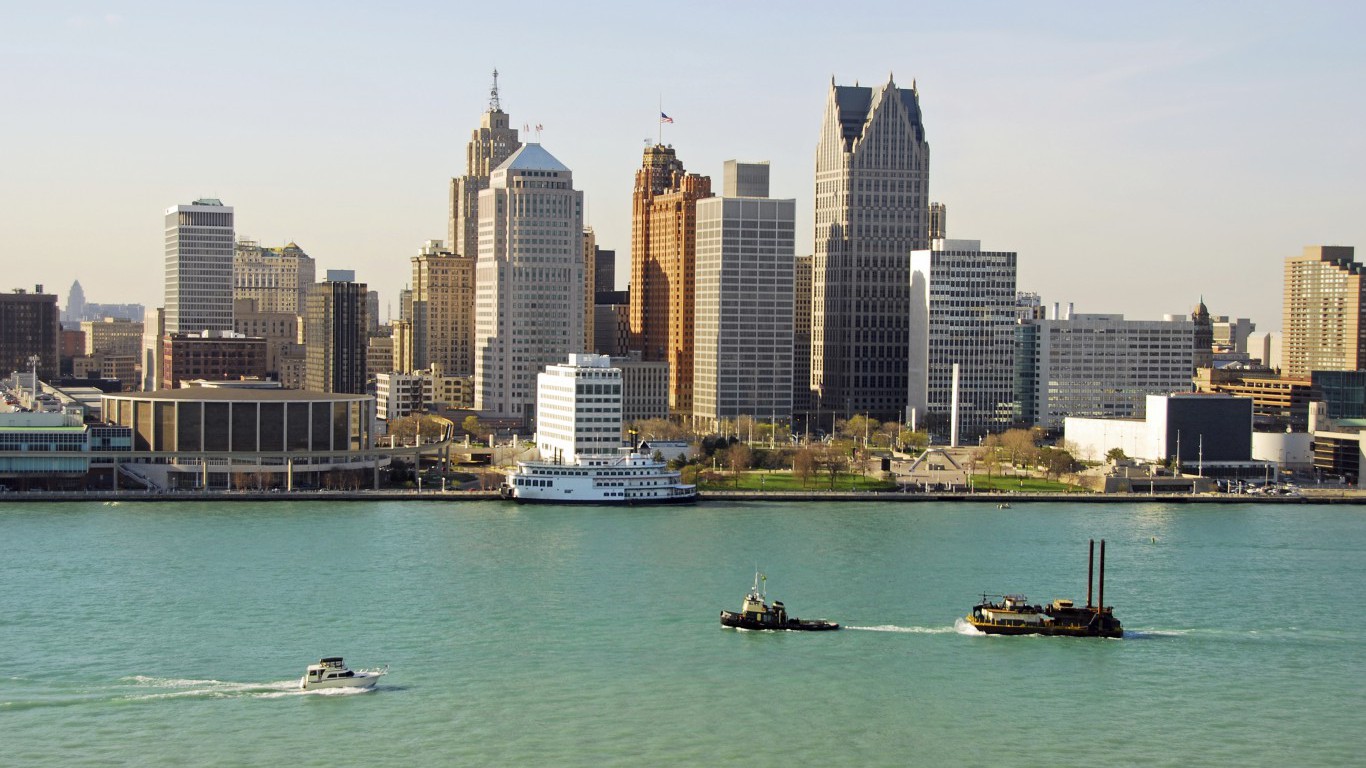
2. Detroit, Michigan
> Violent crimes per 100,000: 1,759.6
> 2015 murders: 295
> Poverty rate: 39.8%
> Unemployment rate: 12.4%
There were 1,760 violent crimes in Detroit for every 100,000 city residents in 2015. Though the city’s violent crime rate is down 22.3% from 2011, it is the second highest in the country.
Detroit’s high violent crime rate is likely tied to the few opportunities the dismal economic climate provides. Nearly 40% of city residents live in poverty, and 12.4% of the workforce was unemployed as of 2015, each the highest share of any major U.S. city.

1. St. Louis, Missouri
> Violent crimes per 100,000: 1,817.1
> 2015 murders: 188
> Poverty rate: 27.8%
> Unemployment rate: 6.1%
Including 188 homicides, there were 5,762 violent crimes in St. Louis in 2015. Adjusting for population, the city’s murder and violent crime rates, at 59 murders and 1,817 per 100,000 city residents, are each the highest in the country. The number of violent crimes reported in St. Louis increased by 7.7% last year, faster than the national uptick of 3.9%. Over the last five years, however, the incidence of violent crime is down by 3.2%.
Click here to see the safest cities in America.
Retirement planning doesn’t have to feel overwhelming. The key is finding professional guidance—and we’ve made it easier than ever for you to connect with the right financial advisor for your unique needs.
Here’s how it works:
1️ Answer a Few Simple Questions
Tell us a bit about your goals and preferences—it only takes a few minutes!
2️ Get Your Top Advisor Matches
This tool matches you with qualified advisors who specialize in helping people like you achieve financial success.
3️ Choose Your Best Fit
Review their profiles, schedule an introductory meeting, and select the advisor who feels right for you.
Why wait? Start building the retirement you’ve always dreamed of. Click here to get started today!
Thank you for reading! Have some feedback for us?
Contact the 24/7 Wall St. editorial team.