
U.S. median household income rose to $56,516 in 2015, an increase of $2,800, or 5.2% over 2014 levels. Despite it being the largest percentage increase since 1998, median household income remains lower than it was in 2007 when adjusted for inflation.
Whether an American is likely to make more or less than the national median is tied to where he or she lives. High-income areas tend to be in or near dense urban centers, with economies based in industries that require highly skilled workers. Not all cities, however, provide equally high incomes. Across the 381 U.S. metropolitan areas, median incomes vary by as much as $67,906.
24/7 Wall St. reviewed median household income of metropolitan areas from the U.S. Census Bureau to determine the 25 richest cities in America. In each of these cities, the typical household earns at least $10,000 more than the typical American household. The metro with the highest median income is the San Jose-Sunnyvale-Santa Clara, California area, where a typical household earns $101,980 a year.
Click here to see America’s richest cities.
The nationwide unemployment rate decreased from 6.2% in 2014 to the August 2016 rate of 4.9%. Over this time, incomes across the nation went up. Since a low jobless rate in a city is frequently indicative of a competitive job market, cities with exceptionally high incomes also tend to have low unemployment rates. The unemployment rate in 18 of the 25 richest cities is lower than the nation’s.
One factor that differentiates the richest cities from other areas is the level of education among area residents. The economies of wealthy cities are often based in industries such as finance and technology, which tend to require highly educated workers. While 30.6% of adults nationwide have at least a bachelor’s degree, in all but four of the richest cities, the share of adults with this level of education is higher.
With such high incomes in a population, the likelihood of living in poverty tends to be lower. The poverty threshold is determined by family size and composition. For example, for a single individual younger than 65 years of age, the poverty threshold is $12,082 a year. Across the United States, 14.7% of Americans live in poverty. The poverty rate in all of the richest cities is lower than the national rate.
To determine the richest cities in America, 24/7 Wall St. reviewed data from the U.S. Census Bureau’s 2015 American Community Survey. We identified the 25 U.S. metropolitan statistical areas with the highest median household incomes. Poverty rates, median home values, and educational attainment also came from the ACS. National income figures are from the Census Bureau’s Current Population Survey. Unemployment rates are from the Bureau of Labor Statistics and are as of August 2016, the most recent period for which data is available.
These are America’s richest cities.
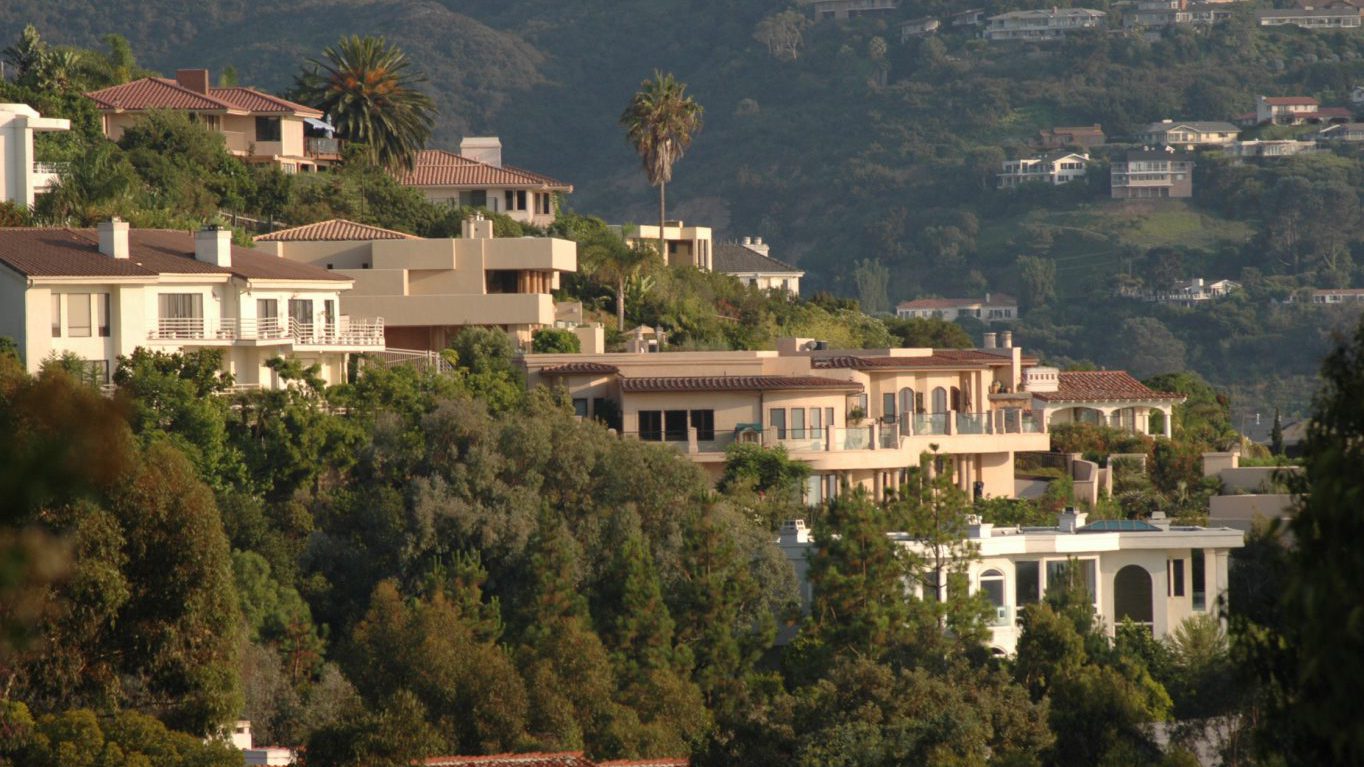
25. San Diego-Carlsbad, CA
> Median household income: $67,320
> Median home value: $485,900
> Unemployment rate: 4.8%
> Poverty rate: 13.8%

24. Vallejo-Fairfield, CA
> Median household income: $67,443
> Median home value: $344,900
> Unemployment rate: 5.6%
> Poverty rate: 12.1%
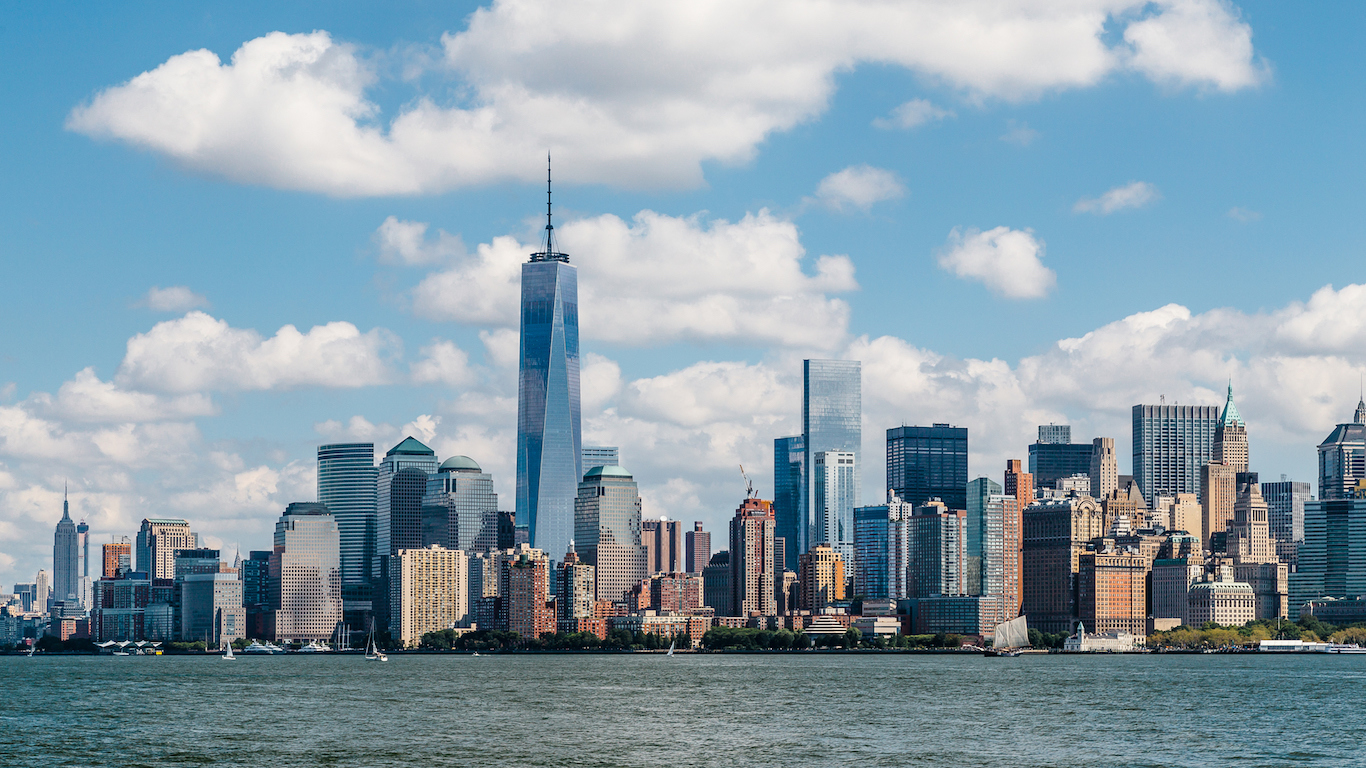
23. New York-Newark-Jersey City, NY-NJ-PA
> Median household income: $68,743
> Median home value: $414,000
> Unemployment rate: 5.0%
> Poverty rate: 14.1%

22. Greeley, CO
> Median household income: $70,256
> Median home value: $242,700
> Unemployment rate: 3.6%
> Poverty rate: 11.3%
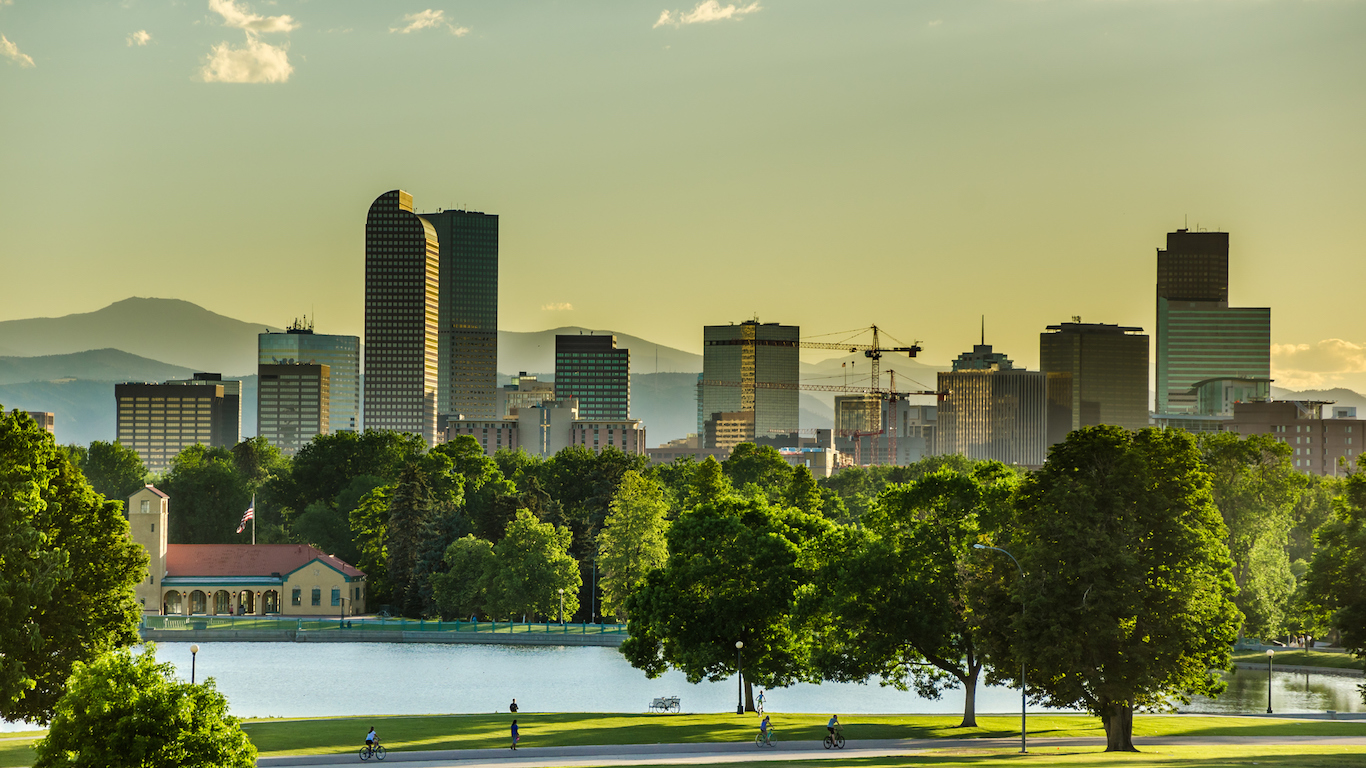
21. Denver-Aurora-Lakewood, CO
> Median household income: $70,283
> Median home value: $314,400
> Unemployment rate: 3.3%
> Poverty rate: 10.3%
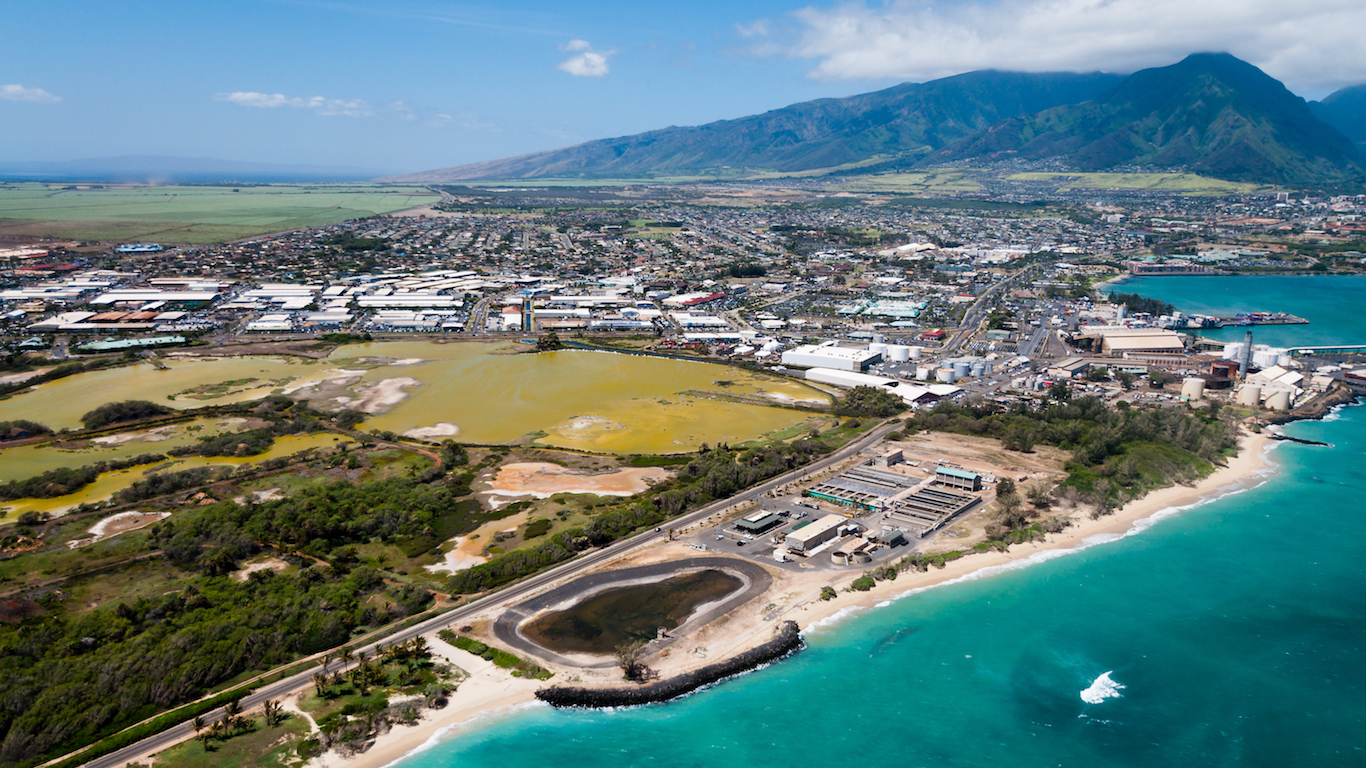
20. Kahului-Wailuku-Lahaina, HI
> Median household income: $70,468
> Median home value: $569,300
> Unemployment rate: 3.5%
> Poverty rate: 9.7%

19. Minneapolis-St. Paul-Bloomington, MN-WI
> Median household income: $71,008
> Median home value: $231,800
> Unemployment rate: 3.6%
> Poverty rate: 9.3%
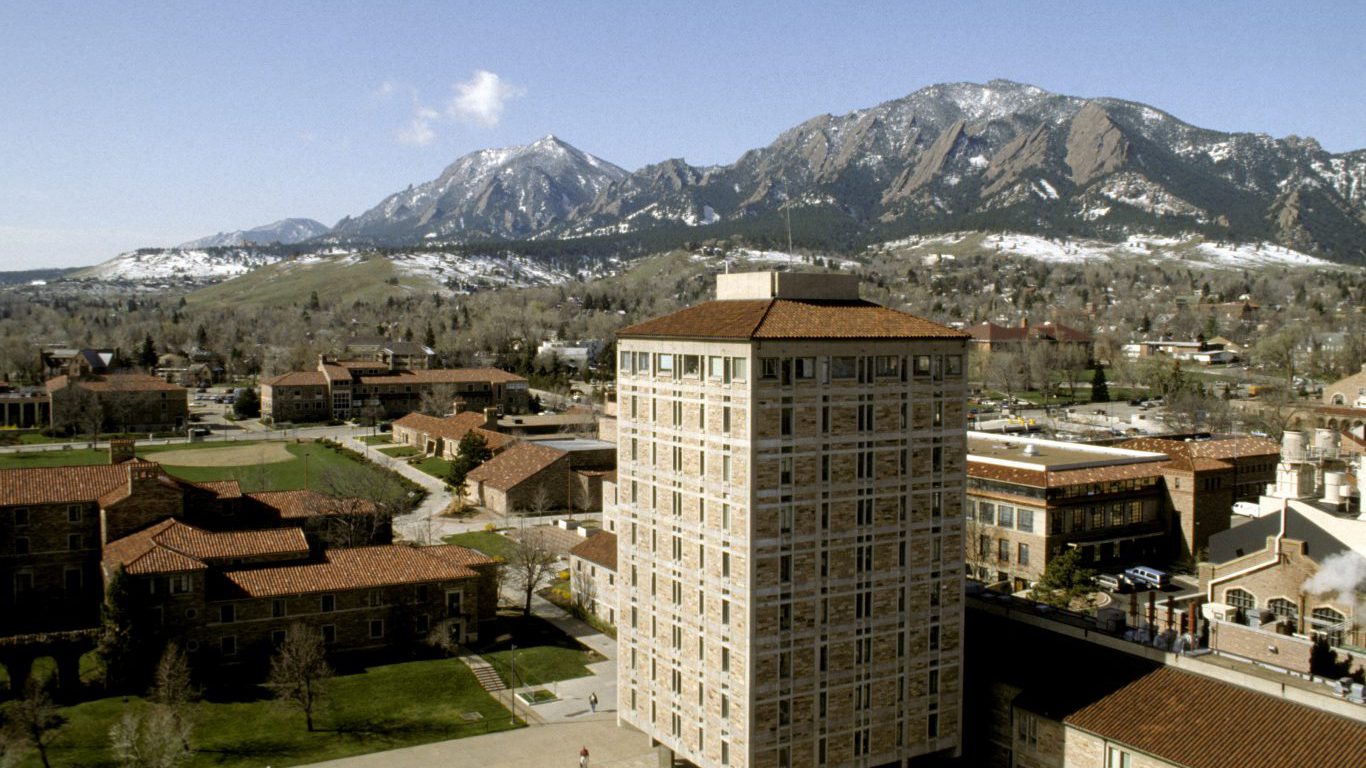
18. Boulder, CO
> Median household income: $72,009
> Median home value: $416,500
> Unemployment rate: 2.9%
> Poverty rate: 12.9%

17. Hartford-West Hartford-East Hartford, CT
> Median household income: $72,275
> Median home value: $247,000
> Unemployment rate: 5.4%
> Poverty rate: 9.9%
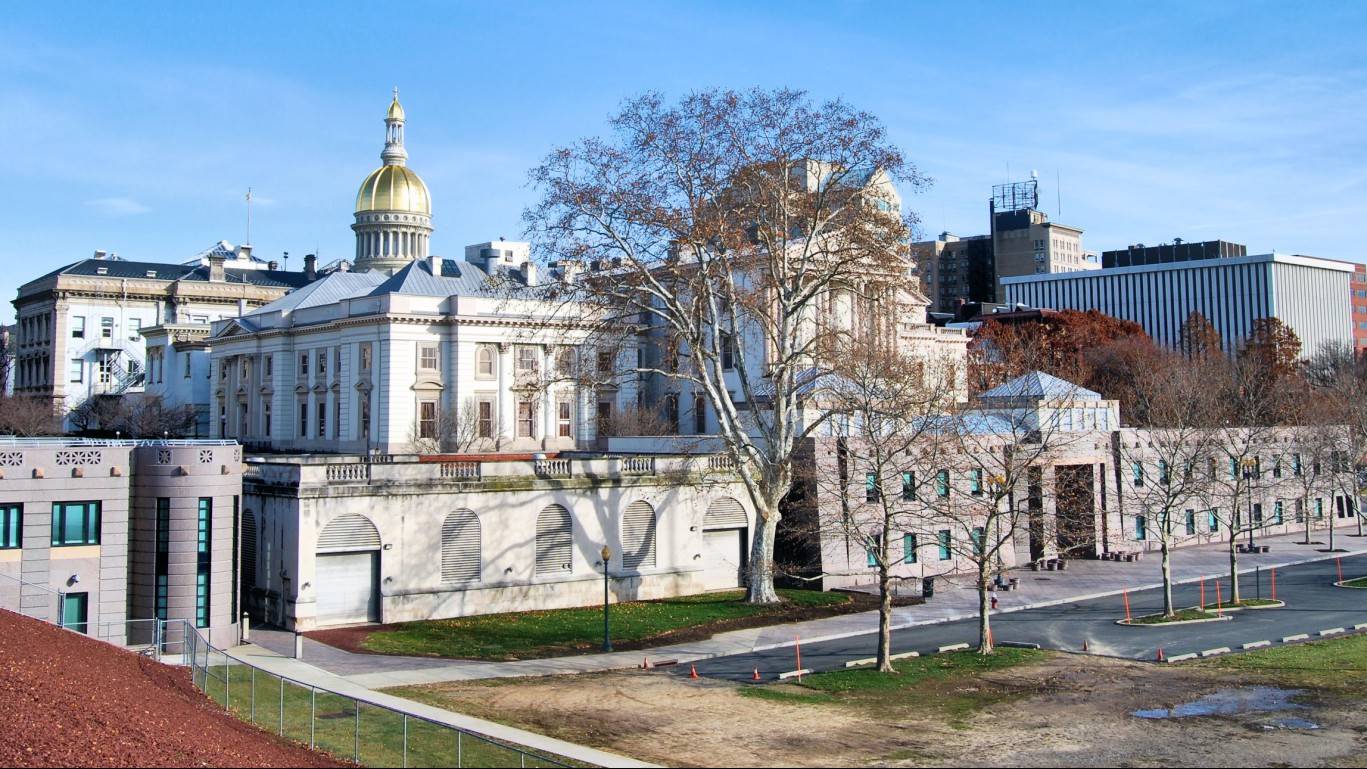
16. Trenton, NJ
> Median household income: $72,417
> Median home value: $283,600
> Unemployment rate: 4.8%
> Poverty rate: 11.2%
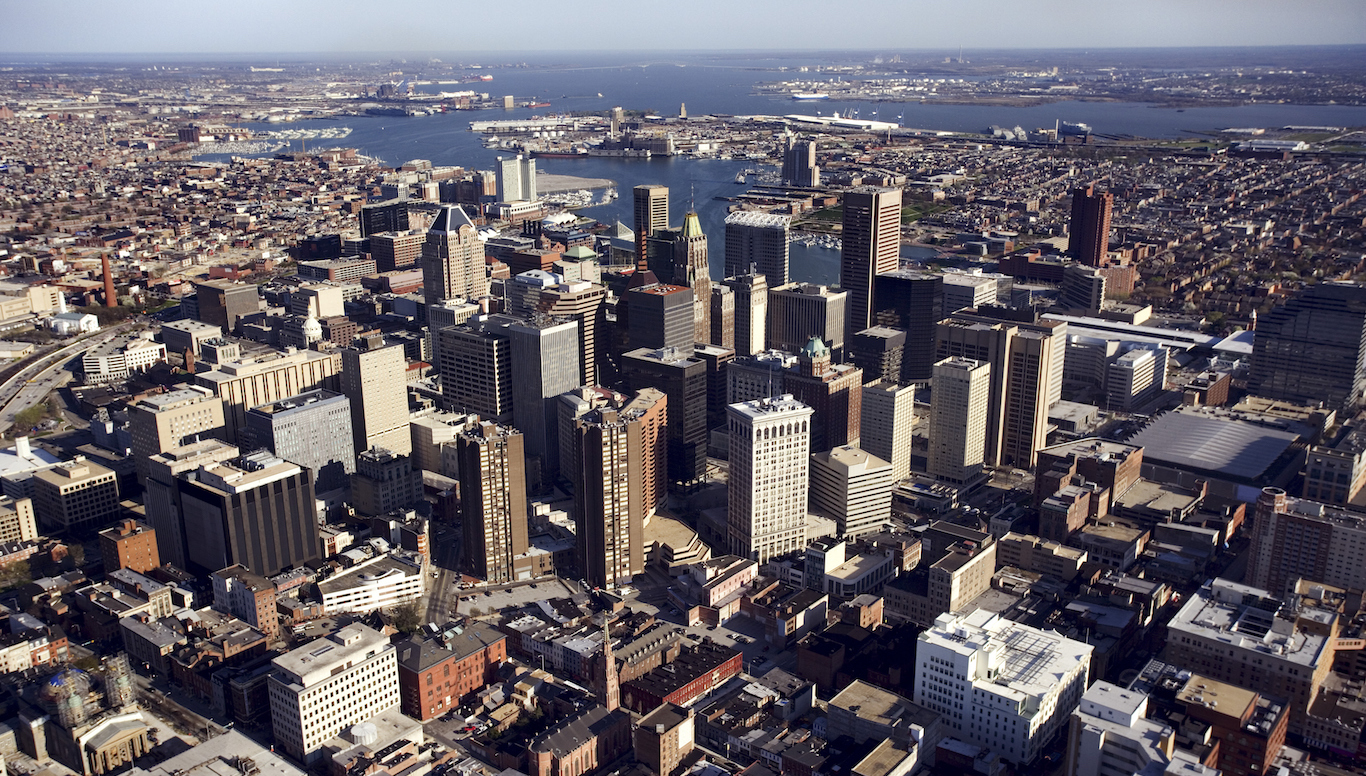
15. Baltimore-Columbia-Towson, MD
> Median household income: $72,520
> Median home value: $290,300
> Unemployment rate: 4.5%
> Poverty rate: 10.6%

14. Fairbanks, AK
> Median household income: $72,975
> Median home value: $229,300
> Unemployment rate: 5.8%
> Poverty rate: 7.4%
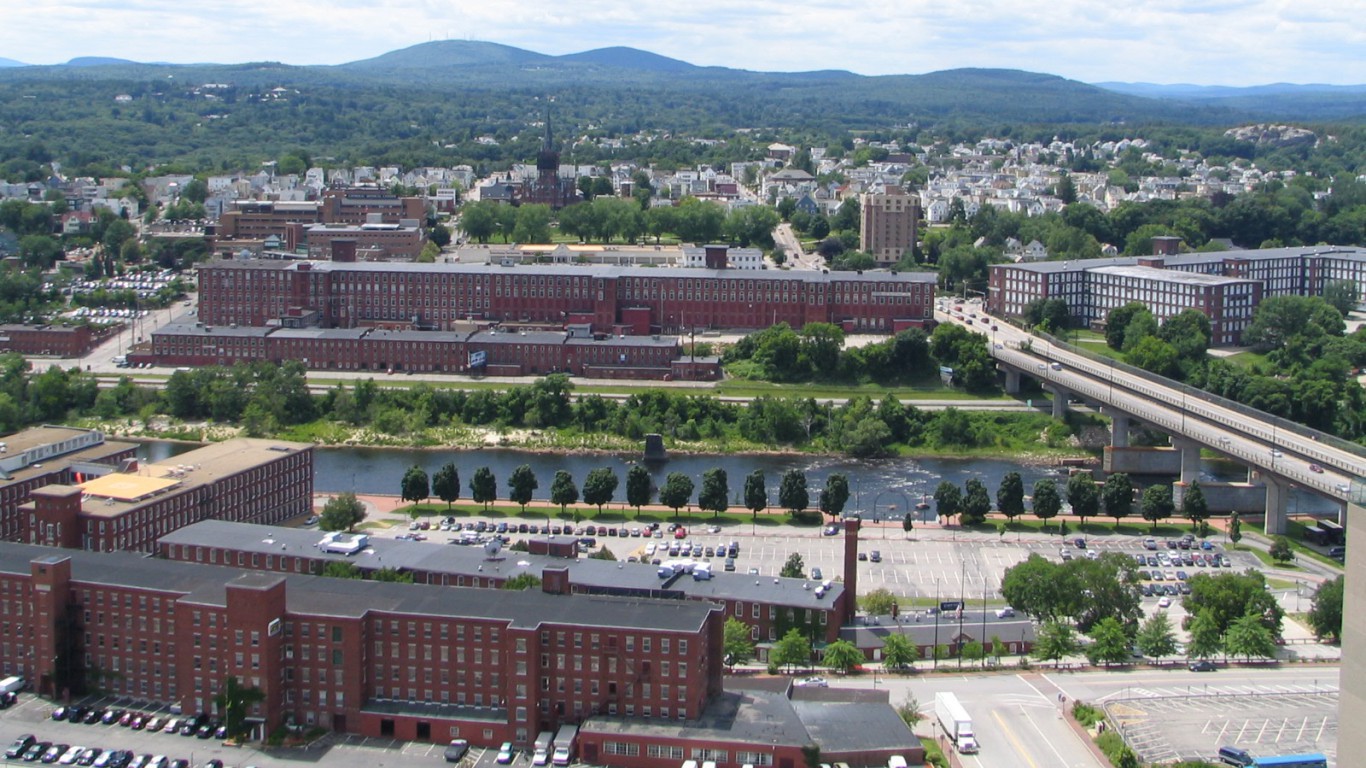
13. Manchester-Nashua, NH
> Median household income: $74,323
> Median home value: $256,200
> Unemployment rate: 3.0%
> Poverty rate: 8.0%
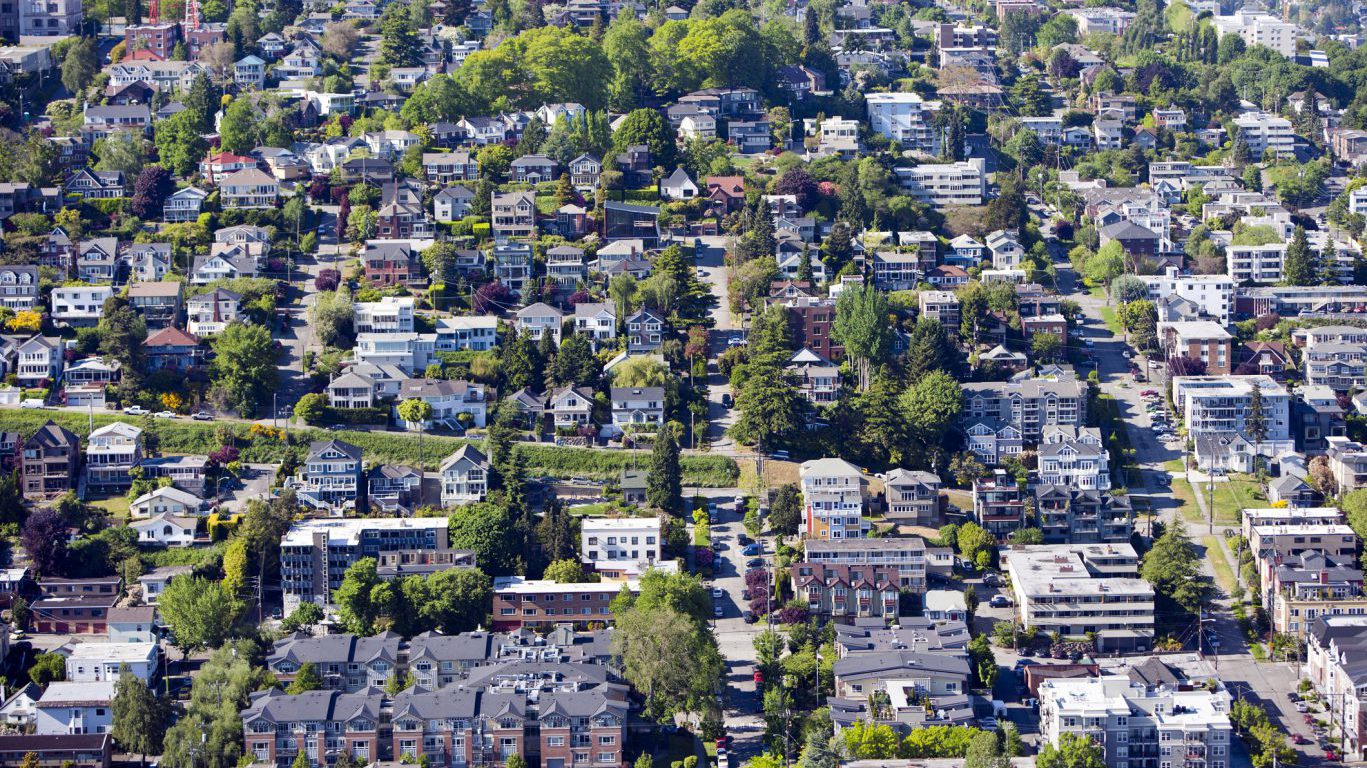
12. Seattle-Tacoma-Bellevue, WA
> Median household income: $75,331
> Median home value: $361,500
> Unemployment rate: 4.6%
> Poverty rate: 10.2%

11. Napa, CA
> Median household income: $75,513
> Median home value: $555,900
> Unemployment rate: 4.2%
> Poverty rate: 10.8%

10. Urban Honolulu, HI
> Median household income: $77,273
> Median home value: $629,900
> Unemployment rate: 3.0%
> Poverty rate: 9.2%

9. Anchorage, AK
> Median household income: $78,238
> Median home value: $283,000
> Unemployment rate: 6.0%
> Poverty rate: 8.7%

8. Boston-Cambridge-Newton, MA-NH
> Median household income: $78,800
> Median home value: $393,000
> Unemployment rate: 3.5%
> Poverty rate: 10.2%
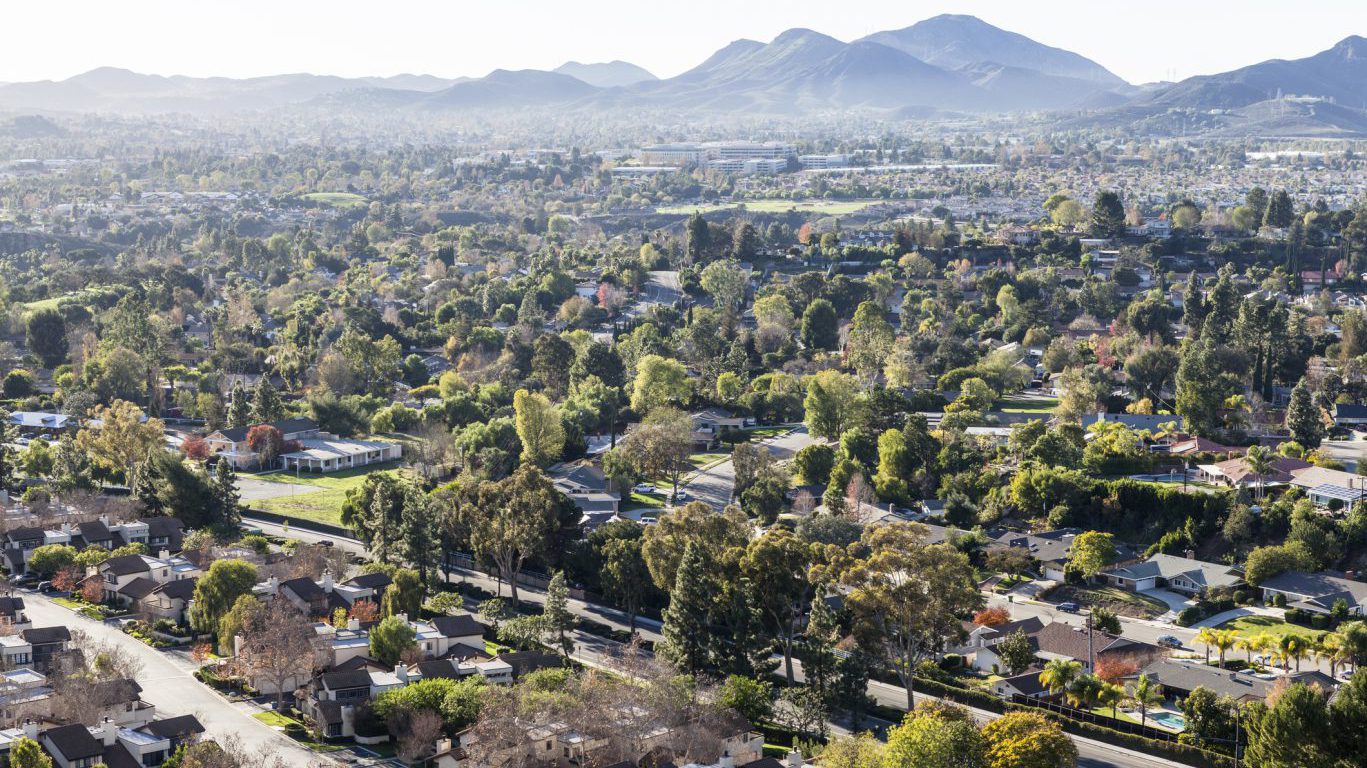
7. Oxnard-Thousand Oaks-Ventura, CA
> Median household income: $80,032
> Median home value: $528,700
> Unemployment rate: 5.4%
> Poverty rate: 9.6%

6. Midland, TX
> Median household income: $80,761
> Median home value: $195,800
> Unemployment rate: 4.4%
> Poverty rate: 6.6%

5. California-Lexington Park, MD
> Median household income: $85,163
> Median home value: $293,700
> Unemployment rate: 4.2%
> Poverty rate: 8.0%
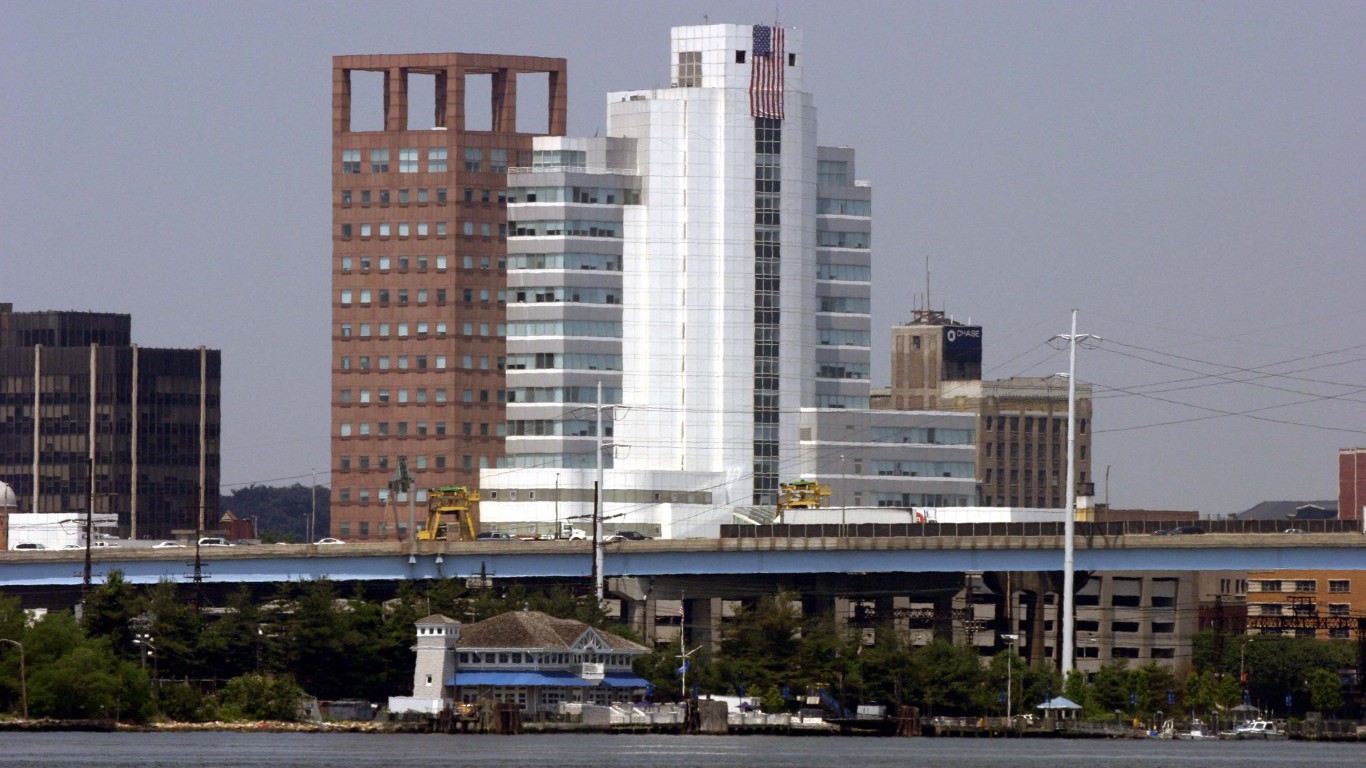
4. Bridgeport-Stamford-Norwalk, CT
> Median household income: $86,414
> Median home value: $420,900
> Unemployment rate: 5.2%
> Poverty rate: 8.9%
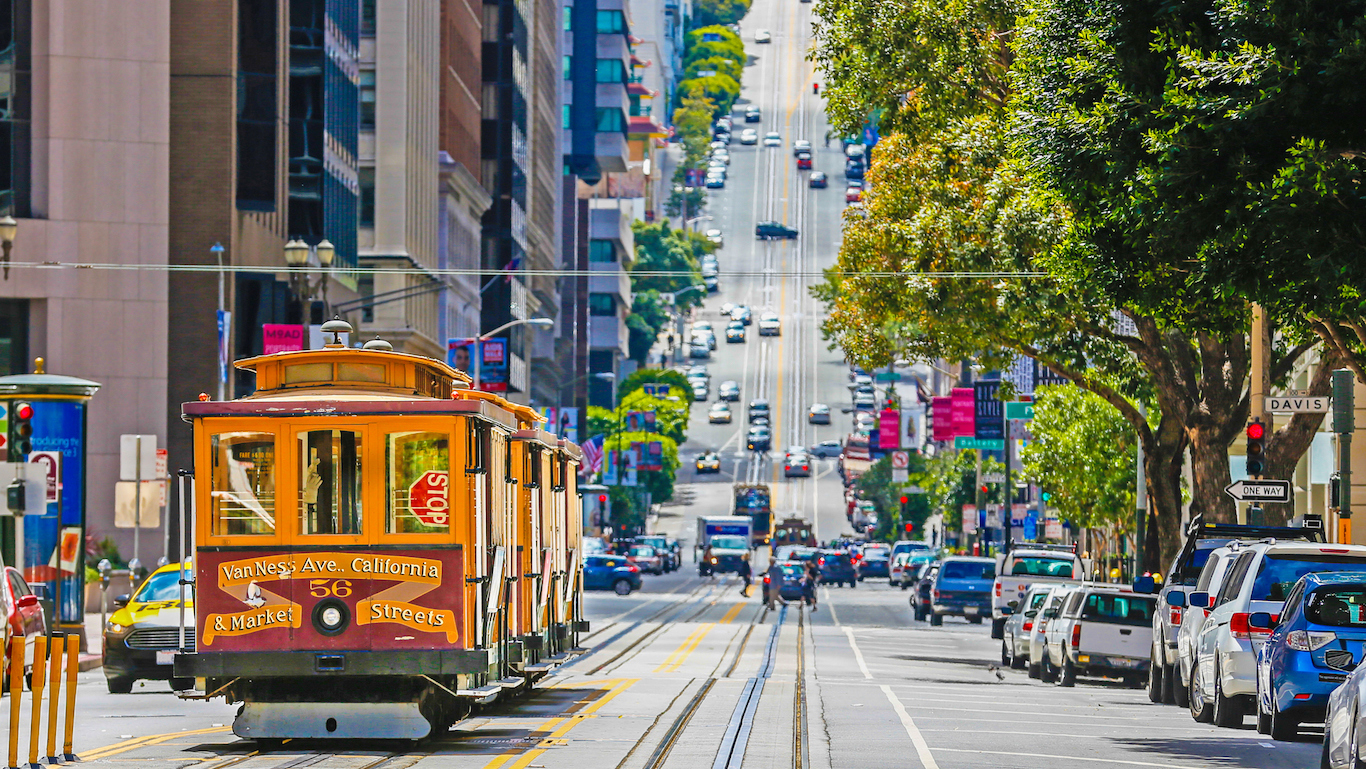
3. San Francisco-Oakland-Hayward, CA
> Median household income: $88,518
> Median home value: $718,400
> Unemployment rate: 3.9%
> Poverty rate: 10.6%
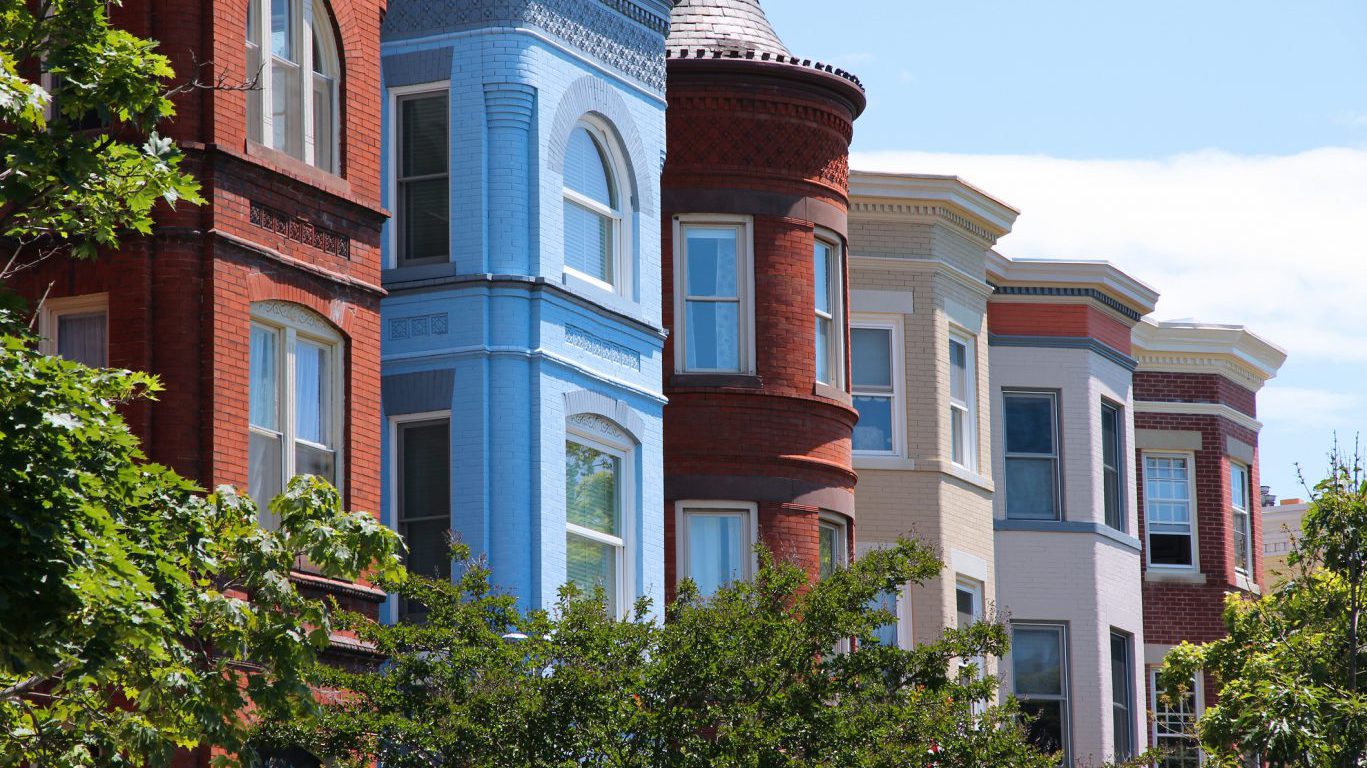
2. Washington-Arlington-Alexandria, DC-VA-MD-WV
> Median household income: $93,294
> Median home value: $401,500
> Unemployment rate: 3.9%
> Poverty rate: 8.3%
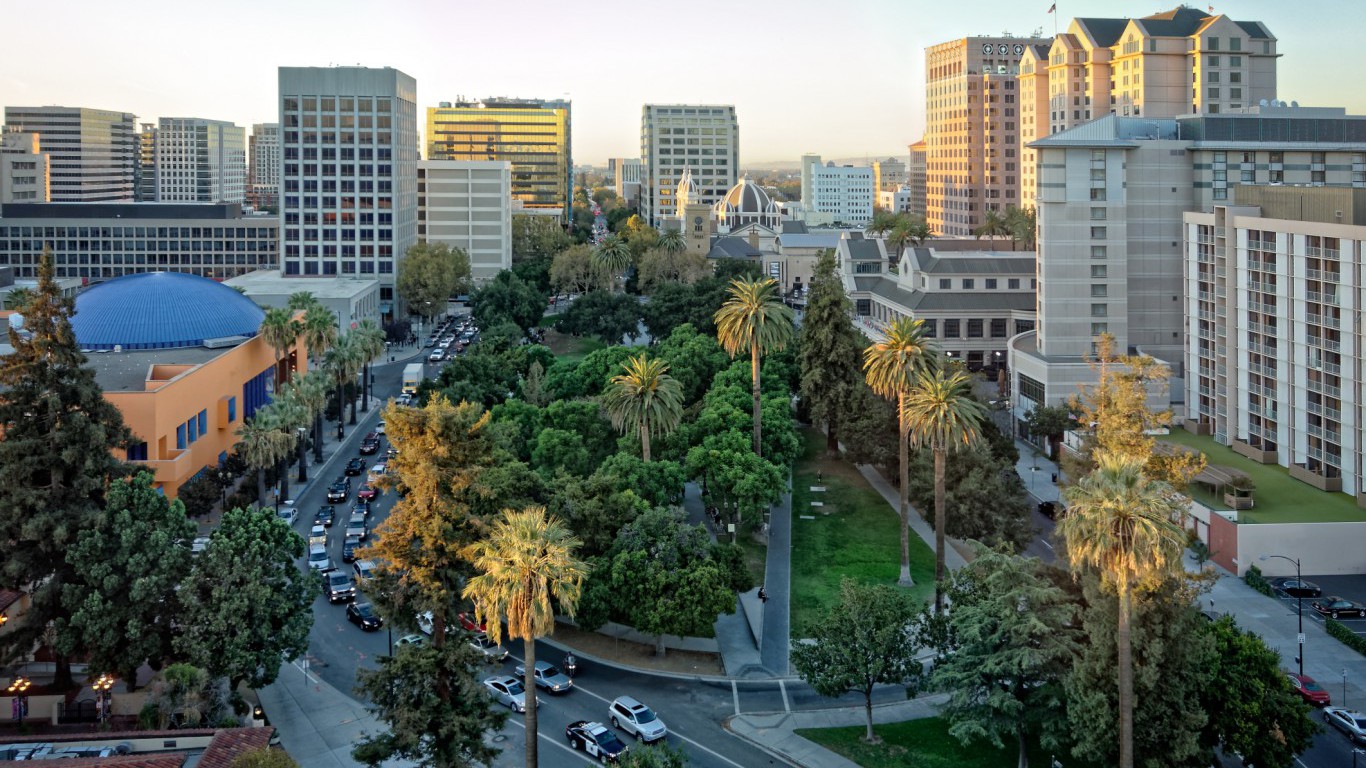
1. San Jose-Sunnyvale-Santa Clara, CA
> Median household income: $101,980
> Median home value: $823,700
> Unemployment rate: 3.9%
> Poverty rate: 8.1%
Thank you for reading! Have some feedback for us?
Contact the 24/7 Wall St. editorial team.
 24/7 Wall St.


