
Violence in the United States has steadily declined for several decades. While the violent crime rate has fallen considerably — from 685 incidents reported per 100,000 Americans in 1995 to the current rate of 383 incidents per 100,000 — the national violent crime rate rose 3.0% last year.
24/7 Wall St. reviewed violent crime rates in each state from data collected through the FBI’s 2015 Uniform Crime Report Program. Violent crime includes all offenses involving force or threat of force and are broken into four categories: murder and nonnegligent manslaughter, rape, robbery, and aggravated assault. These crimes are more common in some states than in others.
[in-text-ad]
Alaska is the most dangerous state in the country with a violent crime rate of 730 incidents per 100,000 state residents.
Click here to see the 10 most dangerous states.
Click here to see the 10 safest states.
In an interview with 24/7 Wall St., Nancy G. La Vigne, director of the Justice Policy Center at public policy research organization Urban Institute, said, “crime clusters not just within major metropolitan areas but even within cities.” For this reason, La Vigne noted, it is very difficult to draw conclusions from statewide trends alone.
Violent crime is considerably more common in urban centers than in rural regions. While it is not always the case, violent crime rates across the 10 states on this list can be largely attributed to high crime levels in the states’ cities. Of the dozens of cities tracked by the FBI in the nation’s most dangerous states, only a handful report crime rates lower than the national rate. Notably, three cities in Missouri — St. Louis, Kansas City, and Springfield — as well as Memphis, Tennessee; Little Rock, Arkansas; and Anchorage, Alaska all reported violent crime rates greater than 1,000 incidents per 100,000 people.
Poverty and lack of job opportunity in communities can lead to crime at the local level, and the states with the highest violent crime rates tend to also have worse social and economic conditions than safer states. The poverty rate meets or exceeds the national rate of 14.7% in eight of the 10 states with the highest violent crime rates. Similarly, the annual unemployment rate is greater than the national 2015 rate of 5.3% in seven of the 10 states.
While the relationship is somewhat tenuous and complicated, there appears to be a connection between socioeconomic factors and crime levels. As La Vigne said, “People who engage in criminal behavior often may do so because of an absence of opportunity.”
Local factors are perhaps better drivers and predictors of violence. By seeking to address some of the roots of crime, state policies can help reduce a state’s crime levels. La Vigne noted sets of reforms that focus on reducing recidivism as one example of policies that can improve public safety. According to a federally funded 2014 study by the Council of State Governments Justice Center, “Reducing Recidivism: States Deliver Results,” some states have had success lowering recidivism with state-level policies.
The violent crime rate increased in all of the nation’s most dangerous states. In seven of the 10 states, the violent crime rate increased faster than the nationwide uptick of 3.0% between 2014 and 2015. In Alaska, Missouri, and Alabama, the increase exceeded 10%.
To identify the 10 most dangerous states, 24/7 Wall St. reviewed the number of violent crimes reported per 100,000 people (the violent crime rate) in each state from the FBI’s 2015 Uniform Crime Report. The total number and rates of murder, nonnegligent manslaughter, rape, robbery, and aggravated assault, which are included in the violent crime rate, as well as burglaries, larceny, motor vehicle theft, and arson — all classified as property crime — also came from the FBI’s report. We considered these data for each year from 2011 through 2015. Annual unemployment rates for 2015 came from the Bureau of Labor Statistics (BLS). Median household income, poverty rates, the percentage of adults with at least a bachelor’s degree, population, and the percentage of adults with at least a high school diploma came from the U.S. Census Bureau’s 2015 American Community Survey.
These are the most dangerous states in America.

10. Alabama
> Violent crimes per 100,000: 472.4
> Total population: 4,858,979
> Total 2015 murders: 348.0 (19th highest)
> Poverty rate: 18.5% (5th highest)
For every 100,000 people in Alabama, 472 violent crimes were reported last year, the 10th highest rate in the nation. By contrast, 383 violent crimes were reported per 100,000 people nationwide. The incidence of violent crime is often closely tied to economic conditions. While unemployed individuals are not necessarily more prone to violence than employed individuals, economically depressed communities frequently report higher crime rates. Alabama’s annual unemployment rate of 6.1% is eighth highest of all states.
[in-text-ad]
As is generally the case in the nation’s most dangerous states, high levels of violence in one or two urban centers account for much of Alabama’s crime problem. In Birmingham, 1,746 violent incidents were reported per 100,000 residents last year, third highest of U.S. cities tracked by the FBI.

9. Missouri
> Violent crimes per 100,000: 497.4
> Total population: 6,083,672
> Total 2015 murders: 502.0 (11th highest)
> Poverty rate: 14.8% (21st highest)
After years of improvement, the violent crime rate rose by 3% nationwide last year, partly due to spikes in the country’s most dangerous states. In Missouri, nearly 500 incidents per 100,000 Missourians were reported last year, a 12.2% increase from the year before — the sixth largest of all states.
Violence is relatively common in densely populated cities. Of five major Missouri cities, only the Independence region reported a lower violent crime rate than the state as a whole. And one city, St. Louis, leads the nation in violent crime. A staggering 1,817 violent crimes were reported for every 100,000 people in the city last year.

8. Delaware
> Violent crimes per 100,000: 499.0
> Total population: 945,934
> Total 2015 murders: 63.0 (14th lowest)
> Poverty rate: 12.4% (18th lowest)
A range of infractions are classified as violent crimes, and some are more common in some states than in others. Slightly more than 130 incidents of robbery were reported per 100,000 people in Delaware in 2015 — the fourth highest robbery rate of all states, despite declining by 3.9% from 2014. Meanwhile, the robbery rate increased by less than 1% nationwide.
Violent crimes are of course not the only types of crime reported in the United States. Property crimes, which are by far the most common type of crime, tend to be reported more often in violent areas. In the state with the eighth highest violent crime rate, however, this is not the case. The number of vehicle thefts in Delaware, for example, at 125 per 100,000 people, is lower than the corresponding national rate.

7. South Carolina
> Violent crimes per 100,000: 504.5
> Total population: 4,896,146
> Total 2015 murders: 399.0 (15th highest)
> Poverty rate: 16.6% (11th highest)
The prevalence of violence in South Carolina increased last year, but by about half as much as the national increase of 3%. Still, with a violent crime rate of over 500 incidents per 100,000 people, the state is one of the nation’s most dangerous.
[in-text-ad]
Financial distress is associated with domestic abuse, and because of this and other factors poor, economically distressed communities often report higher violent crime rates. Like most of the nation’s most dangerous states, South Carolina’s median household income of $47,238 a year is well below the national median income. Also, 16.6% of South Carolinians live in poverty, one of the highest poverty rates of all states.

6. Arkansas
> Violent crimes per 100,000: 521.3
> Total population: 2,978,204
> Total 2015 murders: 181.0 (25th lowest)
> Poverty rate: 19.1% (4th highest)
One of Arkansas’ only major cities — Little Rock — is one of the most dangerous cities in the country. Nearly 1,500 violent crimes were reported per 100,000 people in 2015, trailing just seven other cities. The region’s high level of violence accounts for much of the state’s high crime rate.
Property crime declined by 3.0% in Arkansas last year, in line with the national decrease. The state’s violent crime rate, however, increased by 8.6%, 12th largest increase of all states and more than double the national violent crime increase of 3.0%. The incidence of aggravated assault across Arkansas rose by 10.3%, much higher than the corresponding national increase of 3.7%.

5. Louisiana
> Violent crimes per 100,000: 539.7
> Total population: 4,670,724
> Total 2015 murders: 481.0 (13th highest)
> Poverty rate: 19.6% (3rd highest)
Like in 2014, Louisiana led the nation last year with the highest murder rate at 10.3 homicides per 100,000 people. But while the murder rate rose by 10% across the nation, the increase in Louisiana was smaller than 1 percentage point. The deadly altercations in Louisiana do not have a simple explanation, but like many other states and areas with high levels of violence, Louisiana has some of the nation’s more relaxed gun laws. A 2013 report from the left-leaning think tank Center for American Progress ranked Louisiana dead last for gun violence and in the worst five in the strength of its firearm legislation.
Extreme poverty has also been associated with higher levels of crime, and poverty is a major problem in Louisiana. Nearly one in every five people in the state live below the poverty line, the third highest poverty rate of all states.

4. Tennessee
> Violent crimes per 100,000: 612.1
> Total population: 6,600,299
> Total 2015 murders: 406.0 (14th highest)
> Poverty rate: 16.7% (10th highest)
Crime in Tennessee’s major urban centers accounts for much of the state’s high violent crime rate, which at 612 incidents per 100,000 people is the fourth highest of all states. The Chattanooga and Knoxville cities each reported nearly 1,000 violent crimes per 100,000 area residents, several times greater than the national violent crime rate of 383 incidents per 100,000 Americans. Even these rates are dwarfed by Memphis, where 1,740 violent crimes were documented for every 100,000 area residents, the fourth highest violent crime rate of all U.S. cities tracked by the FBI.
3. New Mexico
> Violent crimes per 100,000: 656.1
> Total population: 2,085,109
> Total 2015 murders: 117.0 (19th lowest)
> Poverty rate: 20.4% (2nd highest)
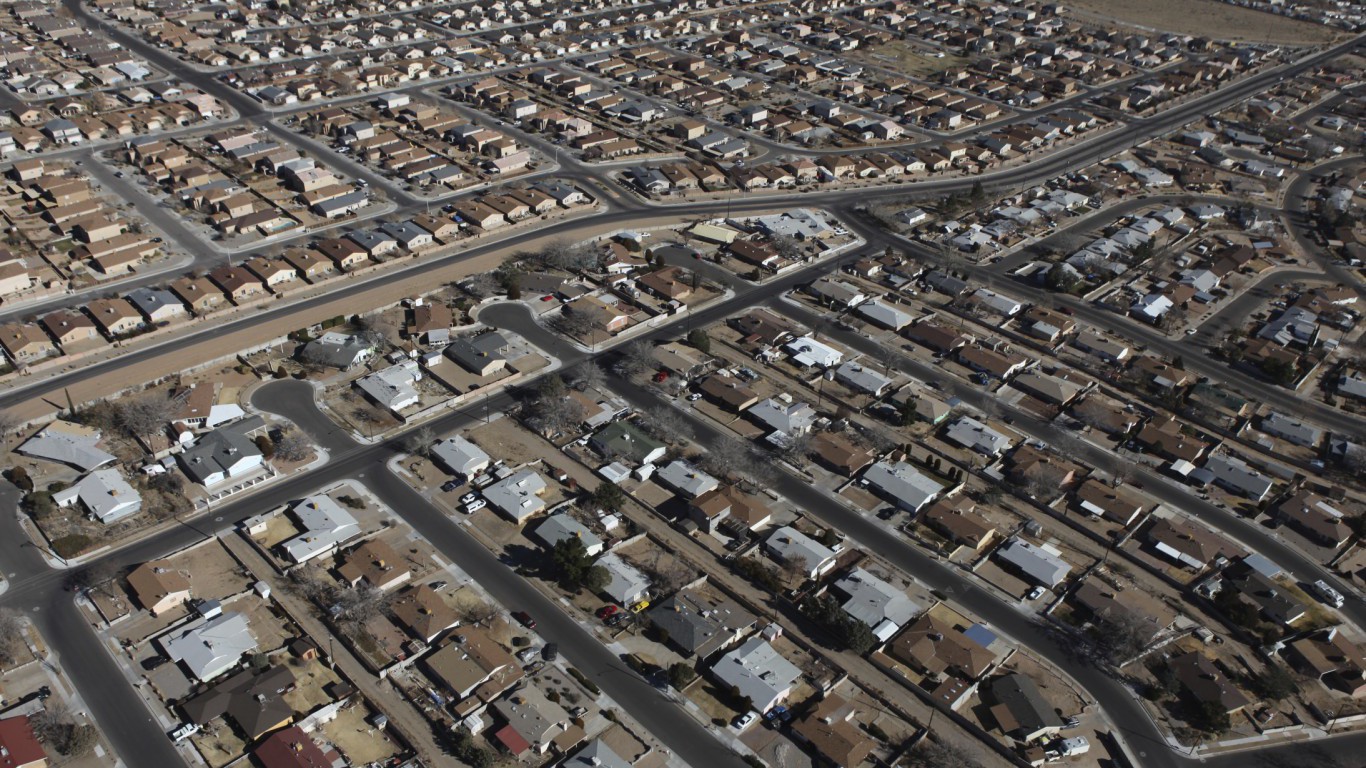
New Mexico’s violent crime rate of 656 incidents per 100,000 people is the third highest of all states, well above the national rate of 383 incidents per 100,000 Americans, and five to six times higher than low crime states such as Vermont and Maine. The violent crime rate, including murder and aggravated assault, rose by nearly 10% in New Mexico last year versus the national increase of 3%. As is generally the case in states with high violent crime rates, nonviolent crimes are also relatively common in New Mexico. The incidence of burglary, larceny, and motor vehicle theft — which together comprise property crime — are each second highest of all states. And while the prevalence of these property crimes decreased by 3.4% across the nation, it rose by 4.4% in New Mexico last year, more than all but three other states.
[in-text-ad]

2. Nevada
> Violent crimes per 100,000: 695.9
> Total population: 2,890,845
> Total 2015 murders: 178.0 (24th lowest)
> Poverty rate: 14.7% (23rd highest)
Criminal activity in Nevada’s more densely clustered areas largely accounts for the state’s overall near nation-leading violent crime rate of close to 700 incidents per 100,000 residents. Crime levels in the Reno area, at 592 violent incidents per 100,000 people, while higher than the national average rate is not especially high compared with other cities. In the Henderson area, the violent crime rate last year was just 169 incidents per 100,000, one of the lowest. North Las Vegas, on the other hand, reported over 900 violent crimes per 100,000 people.
Economic distress is closely tied to the prevalence of violence in a community. Based on the official unemployment rate, job markets have improved considerably across the nation. While Nevada’s jobless rate of 6.7% is certainly much better than it was following the financial crisis, it is still the highest of any state.

1. Alaska
> Violent crimes per 100,000: 730.2
> Total population: 738,432
> Total 2015 murders: 59.0 (12th lowest)
> Poverty rate: 10.3% (5th lowest)
No state is more dangerous than Alaska — by far the nation’s largest and one of the least populated states. Slightly more than 730 violent crimes were reported per 100,000 people last year in the state, up nearly 15% from the year before. Nationwide, the violent crime rate rose by 3%. Alaska is exceptional as one of only two states on this list with a median household income that exceeds the national median income. At $73,355 a year, it is nearly the highest of any state.
High violent crime levels across Alaska are driven by the prevalence of criminal activity in Anchorage, one of the state’s major cities. More than 1,000 crimes were reported per 100,000 people in the city last year, dwarfing the national violent crime rate of 383 incidents per 100,000 Americans and higher than the vast majority of U.S. cities.
Cash Back Credit Cards Have Never Been This Good
Credit card companies are at war, handing out free rewards and benefits to win the best customers. A good cash back card can be worth thousands of dollars a year in free money, not to mention other perks like travel, insurance, and access to fancy lounges. See our top picks for the best credit cards today. You won’t want to miss some of these offers.
Flywheel Publishing has partnered with CardRatings for our coverage of credit card products. Flywheel Publishing and CardRatings may receive a commission from card issuers.
Thank you for reading! Have some feedback for us?
Contact the 24/7 Wall St. editorial team.


