Special Report
Violence in America: A Survey of All 50 States

Published:
Last Updated:

Violence in the United States has steadily declined for several decades. While the violent crime rate has fallen considerably — from 685 incidents reported per 100,000 Americans in 1995 to the current rate of 383 incidents per 100,000 — the national violent crime rate rose 3.0% last year.
24/7 Wall St. reviewed violent crime rates in each state from data collected through the FBI’s 2015 Uniform Crime Report Program. Violent crime includes all offenses involving force or threat of force and are broken into four categories: murder and nonnegligent manslaughter, rape, robbery, and aggravated assault. These crimes are more common in some states than in others.
[in-text-ad]
Across the nation, violent crime levels range from 118 incidents per 100,000 people in Vermont, to 730 incidents reported for every 100,000 people in Alaska.
Click here to see every state, from safest to most dangerous.
In an interview with 24/7 Wall St., Nancy G. La Vigne, director of the Justice Policy Center at public policy research organization Urban Institute, said, “crime clusters not just within major metropolitan areas but even within cities.” For this reason, La Vigne noted, it is very difficult to draw conclusions from statewide trends alone.
Violent crime is considerably more common in urban centers than elsewhere. While it is not always the case, violent crime rates in states can be largely attributed to high crime levels in the states’ cities. States with relatively low violent crime rates tend to be home to fewer, less dangerous, cities.
There appears to be a relationship between socioeconomic factors and crime levels. As La Vigne said, “People who engage in criminal behavior often may do so because of an absence of opportunity.” While the relationship is somewhat tenuous and controversial, unemployment rates tend to be relatively high in states with high violent crime rates while the opposite is true in states with low levels of violence.
Local factors are perhaps better drivers and predictors of violence. By seeking to address some of the roots of crime, state policies can help reduce a state’s crime levels. La Vigne noted sets of reforms that focus on reducing recidivism as one example of policies that can improve public safety. According to a federally funded 2014 study by the Council of State Governments Justice Center, “Reducing Recidivism: States Deliver Results,” some states have had success lowering recidivism with state-level policies.
The violent crime rate increased in all of the nation’s most dangerous states. In seven of the 10 states, the violent crime rate increased faster than the nationwide uptick of 3.0% between 2014 and 2015. In Alaska, Missouri, and Alabama, the increase exceeded 10%.
To identify the 10 most dangerous states, 24/7 Wall St. reviewed the number of violent crimes reported per 100,000 people (the violent crime rate) in each state from the FBI’s 2015 Uniform Crime Report. The total number and rates of murder, nonnegligent manslaughter, rape, robbery, and aggravated assault, which are included in the violent crime rate, as well as burglaries, larceny, motor vehicle theft, and arson — all classified as property crime — also came from the FBI’s report. We considered these data for each year from 2011 through 2015. Annual unemployment rates for 2015 came from the Bureau of Labor Statistics (BLS). Median household income, poverty rates, the percentage of adults with at least a bachelor’s degree, population, and the percentage of adults with at least a high school diploma came from the U.S. Census Bureau’s 2015 American Community Survey.
Here is every state, from safest to most dangerous.

50. Vermont
> Violent crimes per 100,000: 118.0
> Total population: 626,042 (2nd lowest)
> Total 2015 murders: 10.0 (the fewest)
> Poverty rate: 10.2% (4th lowest)

49. Maine
> Violent crimes per 100,000: 130.1
> Total population: 1,329,328 (9th lowest)
> Total 2015 murders: 23.0 (6th fewest)
> Poverty rate: 13.4% (22nd lowest)

48. Virginia
> Violent crimes per 100,000: 195.6
> Total population: 8,382,993 (12th highest)
> Total 2015 murders: 383.0 (16th most)
> Poverty rate: 11.2% (11th lowest)

47. New Hampshire
> Violent crimes per 100,000: 199.3
> Total population: 1,330,608 (10th lowest)
> Total 2015 murders: 14.0 (2nd fewest)
> Poverty rate: 8.2% (the lowest)

46. Idaho
> Violent crimes per 100,000: 215.6
> Total population: 1,654,930 (12th lowest)
> Total 2015 murders: 32.0 (9th fewest)
> Poverty rate: 15.1% (20th highest)

45. Connecticut
> Violent crimes per 100,000: 218.5
> Total population: 3,590,886 (22nd lowest)
> Total 2015 murders: 117.0 (19th fewest)
> Poverty rate: 10.5% (6th lowest)

44. Kentucky
> Violent crimes per 100,000: 218.7
> Total population: 4,425,092 (25th lowest)
> Total 2015 murders: 209.0 (25th most)
> Poverty rate: 18.5% (5th highest)

43. Wyoming
> Violent crimes per 100,000: 222.1
> Total population: 586,107 (the lowest)
> Total 2015 murders: 16.0 (3rd fewest)
> Poverty rate: 11.1% (10th lowest)

42. Utah
> Violent crimes per 100,000: 236.0
> Total population: 2,995,919 (20th lowest)
> Total 2015 murders: 54.0 (11th fewest)
> Poverty rate: 11.3% (12th lowest)

41. North Dakota
> Violent crimes per 100,000: 239.4
> Total population: 756,928 (4th lowest)
> Total 2015 murders: 21.0 (5th fewest)
> Poverty rate: 11.0% (9th lowest)

40. Rhode Island
> Violent crimes per 100,000: 242.5
> Total population: 1,056,298 (8th lowest)
> Total 2015 murders: 29.0 (7th fewest)
> Poverty rate: 13.9% (25th lowest)

39. Minnesota
> Violent crimes per 100,000: 242.6
> Total population: 5,489,594 (21st highest)
> Total 2015 murders: 133.0 (22nd fewest)
> Poverty rate: 10.2% (4th lowest)

38. New Jersey
> Violent crimes per 100,000: 255.4
> Total population: 8,958,013 (11th highest)
> Total 2015 murders: 363.0 (18th most)
> Poverty rate: 10.8% (8th lowest)

37. Oregon
> Violent crimes per 100,000: 259.8
> Total population: 4,028,977 (24th lowest)
> Total 2015 murders: 99.0 (17th fewest)
> Poverty rate: 15.4% (17th highest)

36. Nebraska
> Violent crimes per 100,000: 274.9
> Total population: 1,896,190 (14th lowest)
> Total 2015 murders: 62.0 (13th fewest)
> Poverty rate: 12.6% (19th lowest)

35. Mississippi
> Violent crimes per 100,000: 275.8
> Total population: 2,992,333 (19th lowest)
> Total 2015 murders: 259.0 (21st most)
> Poverty rate: 22.0% (the highest)

34. Washington
> Violent crimes per 100,000: 284.4
> Total population: 7,170,351 (13th highest)
> Total 2015 murders: 211.0 (24th most)
> Poverty rate: 12.2% (17th lowest)

33. Iowa
> Violent crimes per 100,000: 286.1
> Total population: 3,123,899 (21st lowest)
> Total 2015 murders: 72.0 (16th fewest)
> Poverty rate: 12.2% (17th lowest)

32. Ohio
> Violent crimes per 100,000: 291.9
> Total population: 11,613,423 (7th highest)
> Total 2015 murders: 500.0 (12th most)
> Poverty rate: 14.8% (21st highest)

31. Hawaii
> Violent crimes per 100,000: 293.4
> Total population: 1,431,603 (11th lowest)
> Total 2015 murders: 19.0 (4th fewest)
> Poverty rate: 10.6% (7th lowest)

30. Wisconsin
> Violent crimes per 100,000: 305.8
> Total population: 5,771,337 (20th highest)
> Total 2015 murders: 240.0 (22nd most)
> Poverty rate: 12.1% (15th lowest)

29. Pennsylvania
> Violent crimes per 100,000: 315.1
> Total population: 12,802,503 (6th highest)
> Total 2015 murders: 658.0 (5th most)
> Poverty rate: 13.2% (21st lowest)

28. Colorado
> Violent crimes per 100,000: 321.0
> Total population: 5,456,574 (22nd highest)
> Total 2015 murders: 176.0 (23rd fewest)
> Poverty rate: 11.5% (14th lowest)

27. West Virginia
> Violent crimes per 100,000: 337.9
> Total population: 1,844,128 (13th lowest)
> Total 2015 murders: 70.0 (15th fewest)
> Poverty rate: 17.9% (7th highest)

26. North Carolina
> Violent crimes per 100,000: 347.0
> Total population: 10,042,802 (9th highest)
> Total 2015 murders: 517.0 (9th most)
> Poverty rate: 16.4% (12th highest)

25. Montana
> Violent crimes per 100,000: 349.6
> Total population: 1,032,949 (7th lowest)
> Total 2015 murders: 36.0 (10th fewest)
> Poverty rate: 14.6% (24th highest)

24. Georgia
> Violent crimes per 100,000: 378.3
> Total population: 10,214,860 (8th highest)
> Total 2015 murders: 615.0 (6th most)
> Poverty rate: 17.0% (9th highest)

23. New York
> Violent crimes per 100,000: 379.7
> Total population: 19,795,791 (4th highest)
> Total 2015 murders: 609.0 (7th most)
> Poverty rate: 15.4% (17th highest)

22. South Dakota
> Violent crimes per 100,000: 383.1
> Total population: 858,469 (5th lowest)
> Total 2015 murders: 32.0 (9th fewest)
> Poverty rate: 13.7% (24th lowest)

21. Illinois
> Violent crimes per 100,000: 383.8
> Total population: 12,859,995 (5th highest)
> Total 2015 murders: 744.0 (4th most)
> Poverty rate: 13.6% (23rd lowest)

20. Indiana
> Violent crimes per 100,000: 387.5
> Total population: 6,619,680 (16th highest)
> Total 2015 murders: 373.0 (17th most)
> Poverty rate: 14.5% (25th highest)

19. Kansas
> Violent crimes per 100,000: 389.9
> Total population: 2,911,641 (17th lowest)
> Total 2015 murders: 128.0 (21st fewest)
> Poverty rate: 13.0% (20th lowest)

18. Massachusetts
> Violent crimes per 100,000: 390.9
> Total population: 6,794,422 (15th highest)
> Total 2015 murders: 128.0 (21st fewest)
> Poverty rate: 11.5% (14th lowest)

17. Arizona
> Violent crimes per 100,000: 410.2
> Total population: 6,828,065 (14th highest)
> Total 2015 murders: 309.0 (20th most)
> Poverty rate: 17.4% (8th highest)

16. Texas
> Violent crimes per 100,000: 412.2
> Total population: 27,469,114 (2nd highest)
> Total 2015 murders: 1316.0 (2nd most)
> Poverty rate: 15.9% (14th highest)

15. Michigan
> Violent crimes per 100,000: 415.5
> Total population: 9,922,576 (10th highest)
> Total 2015 murders: 571.0 (8th most)
> Poverty rate: 15.8% (15th highest)

14. Oklahoma
> Violent crimes per 100,000: 422.0
> Total population: 3,911,338 (23rd lowest)
> Total 2015 murders: 234.0 (23rd most)
> Poverty rate: 16.1% (13th highest)

13. California
> Violent crimes per 100,000: 426.3
> Total population: 39,144,818 (the highest)
> Total 2015 murders: 1861.0 (the most)
> Poverty rate: 15.3% (19th highest)

12. Maryland
> Violent crimes per 100,000: 457.2
> Total population: 6,006,401 (19th highest)
> Total 2015 murders: 516.0 (10th most)
> Poverty rate: 9.7% (2nd lowest)

11. Florida
> Violent crimes per 100,000: 461.9
> Total population: 20,271,272 (3rd highest)
> Total 2015 murders: 1041.0 (3rd most)
> Poverty rate: 15.7% (16th highest)

10. Alabama
> Violent crimes per 100,000: 472.4
> Total population: 4,858,979 (24th highest)
> Total 2015 murders: 348.0 (19th most)
> Poverty rate: 18.5% (5th highest)

9. Missouri
> Violent crimes per 100,000: 497.4
> Total population: 6,083,672 (18th highest)
> Total 2015 murders: 502.0 (11th most)
> Poverty rate: 14.8% (21st highest)

8. Delaware
> Violent crimes per 100,000: 499.0
> Total population: 945,934 (6th lowest)
> Total 2015 murders: 63.0 (14th fewest)
> Poverty rate: 12.4% (18th lowest)

7. South Carolina
> Violent crimes per 100,000: 504.5
> Total population: 4,896,146 (23rd highest)
> Total 2015 murders: 399.0 (15th most)
> Poverty rate: 16.6% (11th highest)

6. Arkansas
> Violent crimes per 100,000: 521.3
> Total population: 2,978,204 (18th lowest)
> Total 2015 murders: 181.0 (25th fewest)
> Poverty rate: 19.1% (4th highest)

5. Louisiana
> Violent crimes per 100,000: 539.7
> Total population: 4,670,724 (25th highest)
> Total 2015 murders: 481.0 (13th most)
> Poverty rate: 19.6% (3rd highest)

4. Tennessee
> Violent crimes per 100,000: 612.1
> Total population: 6,600,299 (17th highest)
> Total 2015 murders: 406.0 (14th most)
> Poverty rate: 16.7% (10th highest)

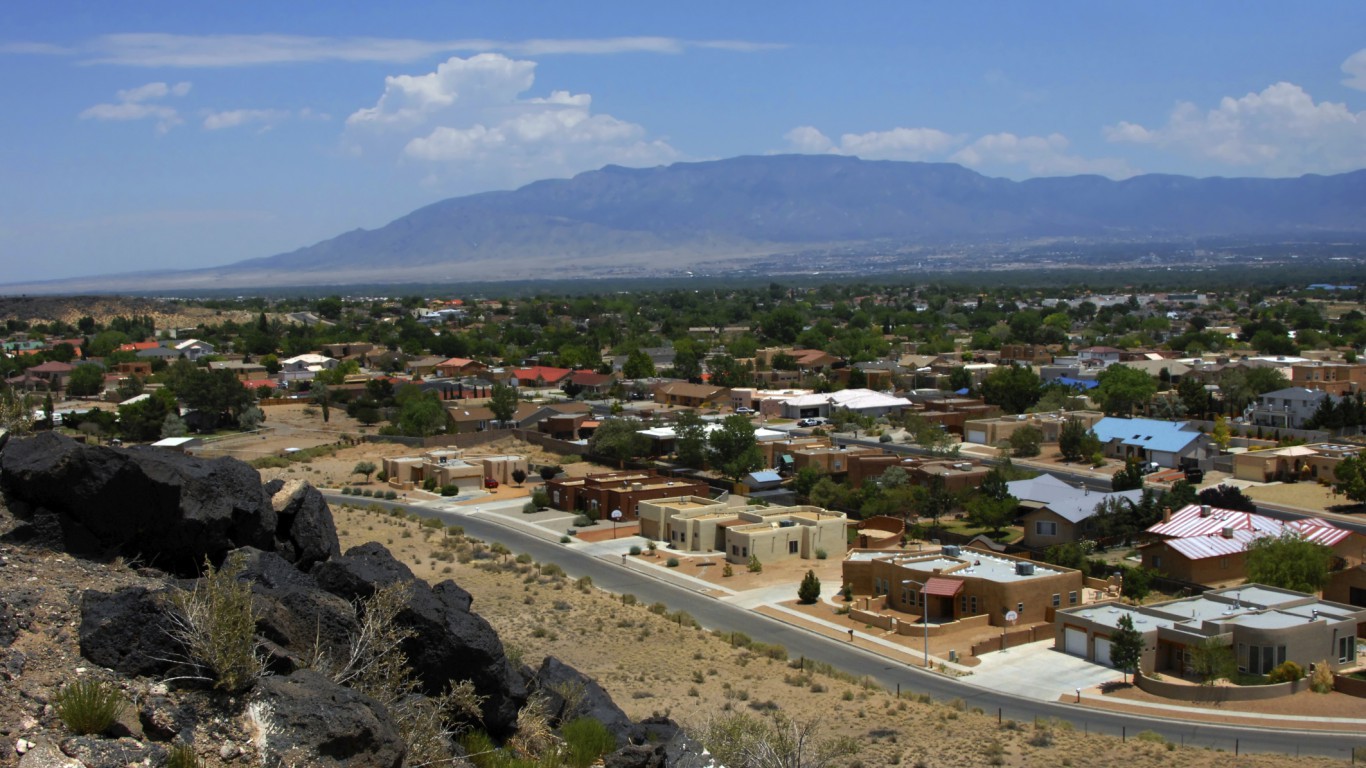
3. New Mexico
> Violent crimes per 100,000: 656.1
> Total population: 2,085,109 (15th lowest)
> Total 2015 murders: 117.0 (19th fewest)
> Poverty rate: 20.4% (2nd highest)

2. Nevada
> Violent crimes per 100,000: 695.9
> Total population: 2,890,845 (16th lowest)
> Total 2015 murders: 178.0 (24th fewest)
> Poverty rate: 14.7% (23rd highest)

1. Alaska
> Violent crimes per 100,000: 730.2
> Total population: 738,432 (3rd lowest)
> Total 2015 murders: 59.0 (12th fewest)
> Poverty rate: 10.3% (5th lowest)
Credit card companies are at war. The biggest issuers are handing out free rewards and benefits to win the best customers.
It’s possible to find cards paying unlimited 1.5%, 2%, and even more today. That’s free money for qualified borrowers, and the type of thing that would be crazy to pass up. Those rewards can add up to thousands of dollars every year in free money, and include other benefits as well.
We’ve assembled some of the best credit cards for users today. Don’t miss these offers because they won’t be this good forever.
Flywheel Publishing has partnered with CardRatings for our coverage of credit card products. Flywheel Publishing and CardRatings may receive a commission from card issuers.
Thank you for reading! Have some feedback for us?
Contact the 24/7 Wall St. editorial team.