Special Report
The Richest Countries in the World
Published:
Last Updated:

The distribution of wealth across the globe is anything but even. North America is home to just 4.9% of the world’s population — and 26.5% of its wealth. Meanwhile, South Asia is home to 23.7% of the global population but owns just 3.6% of global wealth.
While gross domestic product provides an accurate picture of the size of a nation’s economy, gross national income, or GNI, is a more precise measure of the financial well-being of its citizens. GNI includes GDP as well as the net income of the country’s residents obtained outside the country’s borders. If an entrepreneur from San Francisco owns a factory in Mexico, the factory’s profits would be included in the GNI but not the GDP of the United States. Similarly, the profits of foreign-owned enterprises within the United States are excluded from the U.S. GNI.
[in-text-ad]
As some portion of the value generated in a country is bound to leave the country, and increasing global connectivity continues to facilitate the conduct of international business and the flow of income across international borders, GNI becomes a more useful measure of national wealth.
Click here to see the richest countries in the world.
While national economies are extraordinarily complex, the wealthiest countries share certain characteristics that can help explain their prosperity.
Many of the wealthiest countries in the world have abundant oil reserves and export-oriented economies. Many of these countries often have a state-owned national oil company. Such national oil companies currently control 90% of all proven reserves worldwide. The decision to nationalize petroleum supplies in many oil-rich countries was meant as a safeguard against exploitation by private Big Oil corporations and was instrumental in achieving the wealth these countries enjoy today. Qatar, which has one of the largest proven oil reserves in the world, has the highest GNI per capita of any country.
Some countries are not endowed with abundant natural resources, but their location may be advantageous to a trade economy. Hong Kong, for example, is the maritime access point to China for most of Southeast Asia, and its port ships more cargo than all but three other ports worldwide. Relative to its GDP, Hong Kong trades more than any other country. Like other heavily trade-dependent economies, Hong Kong facilitates open trade with low taxes and other business-friendly regulations.
One of the most common and successful economic models is the balanced, diversified, open economy found throughout Western Europe and in the United States and Canada. Such mixed economies often maintain slight trade surpluses, heavily exporting and importing a variety of products to neighboring countries. Many of these countries also benefit from a wealth of natural resources.
Because of their diverse sources of revenue, the mixed economies of Western Europe, the United States, and Canada are often more resilient to global market fluctuations than economies that rely on one industry. In Macao, the gambling capital of Asia, for example, more than 40% of the national GDP is generated by the tourism industry. Gambling revenues in Macao fell precipitously after the global economic downturn and a corruption crackdown from the Chinese government. Macao’s GDP fell by 20.3% in 2015, the most of any country.
Depending on the distribution of wealth within a country, citizens of nations with higher GNI per capita may enjoy a higher quality of life. In the mixed economies of Western Europe, income inequality is low and increased national wealth often results in decreases in poverty and unemployment and increases in life expectancy and educational attainment. In places with greater income inequality, as is found in many of the Middle Eastern oil-rich countries, not all citizens may reap the benefits of national wealth or enjoy a high quality of life.
To identify the richest countries, 24/7 Wall St. reviewed GNI data from the World Bank. We ranked the top 25 countries based on GNI per capita and supplemented our analysis with GDP and GDP growth rates from the International Monetary Fund, as well as poverty and unemployment rates, life expectancy, literacy, Gini coefficients, educational enrollment, agricultural employment, export, and import figures from the World Bank, and additional trade data from MIT’s Observatory of Economic Complexity for 2014. In our analysis, we also included Transparency International’s Corruption Perceptions Index score, which ranks countries based on perceived corruption.
These are the 25 richest countries.
25. Oman
> GNI per capita: $35,235.76
> 2015 GDP: $167.82 billion
> Population: 4,490,541
> Life expectancy: 77.1 years at birth
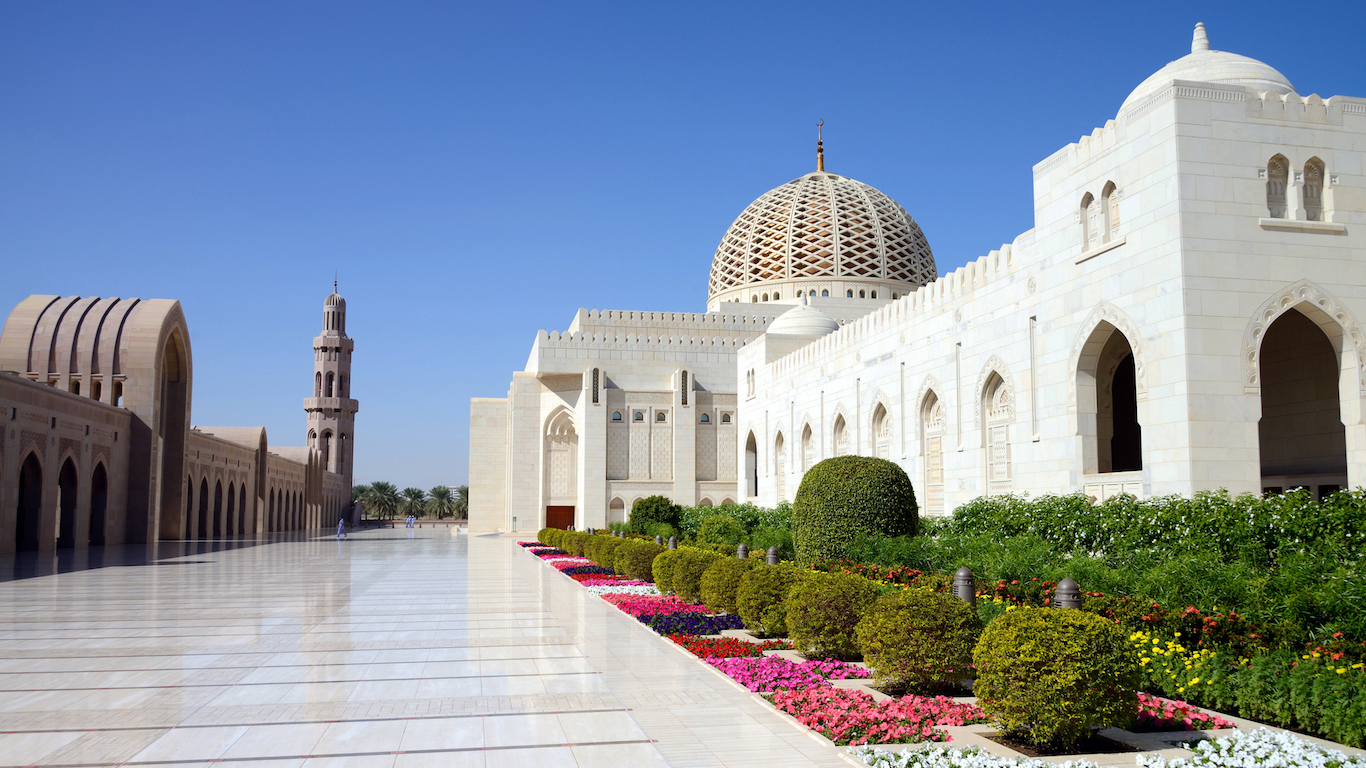
With fewer than 5 million residents and a GDP of $167.8 billion, Oman’s population and economy are far smaller than of the world’s wealthiest nations. With substantial natural resources and a burgeoning tourist industry, the nation’s GNI of approximately $35,236 per capita is the 25th highest in the world. Oman is by far the largest producer of crude oil in the Middle East that is not a member of the Organization of the Petroleum Exporting Countries. Oman’s production capacity was greater than 1 million barrels per day as of the middle of last year.
[in-text-ad]
In stark contrast to its war-torn neighbor, Yemen, and other nations in the region, Oman has also become an increasingly popular tourist destination. To help diversify its economy and wean the country off oil, Oman plans to invest $35 billion into its tourism industry. The government aims to increase the sector’s annual contribution to GDP from 2.5% to 6.0% and draw 5 million international visitors annually by 2040.
24. Bahrain
> GNI per capita: $36,584.21
> 2015 GDP: $64.16 billion
> Population: 1,377,237
> Life expectancy: 76.7 years at birth
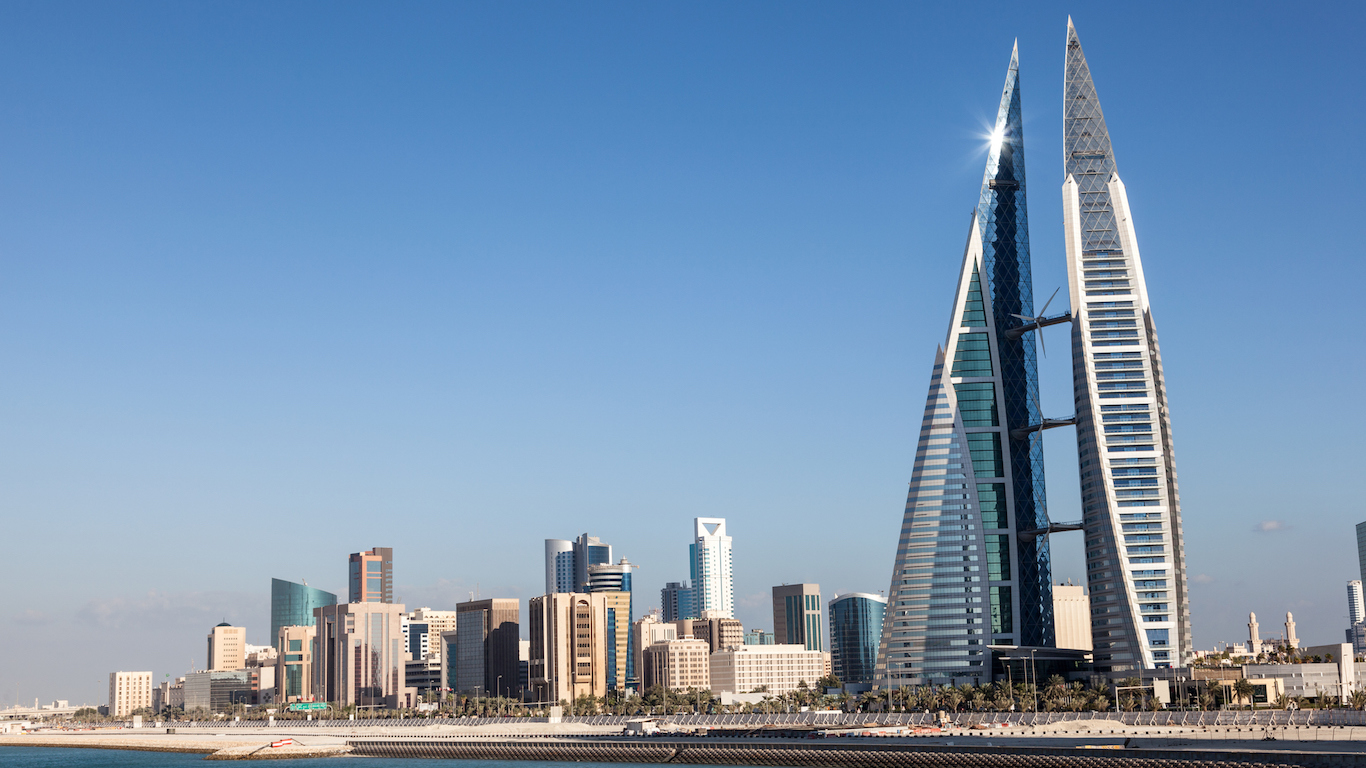
Bahrain is one of a few countries in the Persian Gulf region that is not an especially large oil producer. In 2013, the island kingdom produced 48,000 barrels per day of crude oil, the lowest of any country in the region and a fraction of the world-leading output of its neighbor Saudi Arabia. Still, oil revenues continue to make up the largest portion of Bahrain’s economy, and Bahraini residents are quite wealthy as a result. Like a number of other resource-rich Middle Eastern nations, Bahrain heavily taxes and profits from its oil and gas sector. Otherwise, however, there are no corporate taxes on income, sales, capital gains, or estates. Apart from a social insurance tax, personal income is not taxed whatsoever.
23. Japan
> GNI per capita: $37,267.96
> 2015 GDP: $4.84 trillion
> Population: 126,958,472
> Life expectancy: 83.6 years at birth
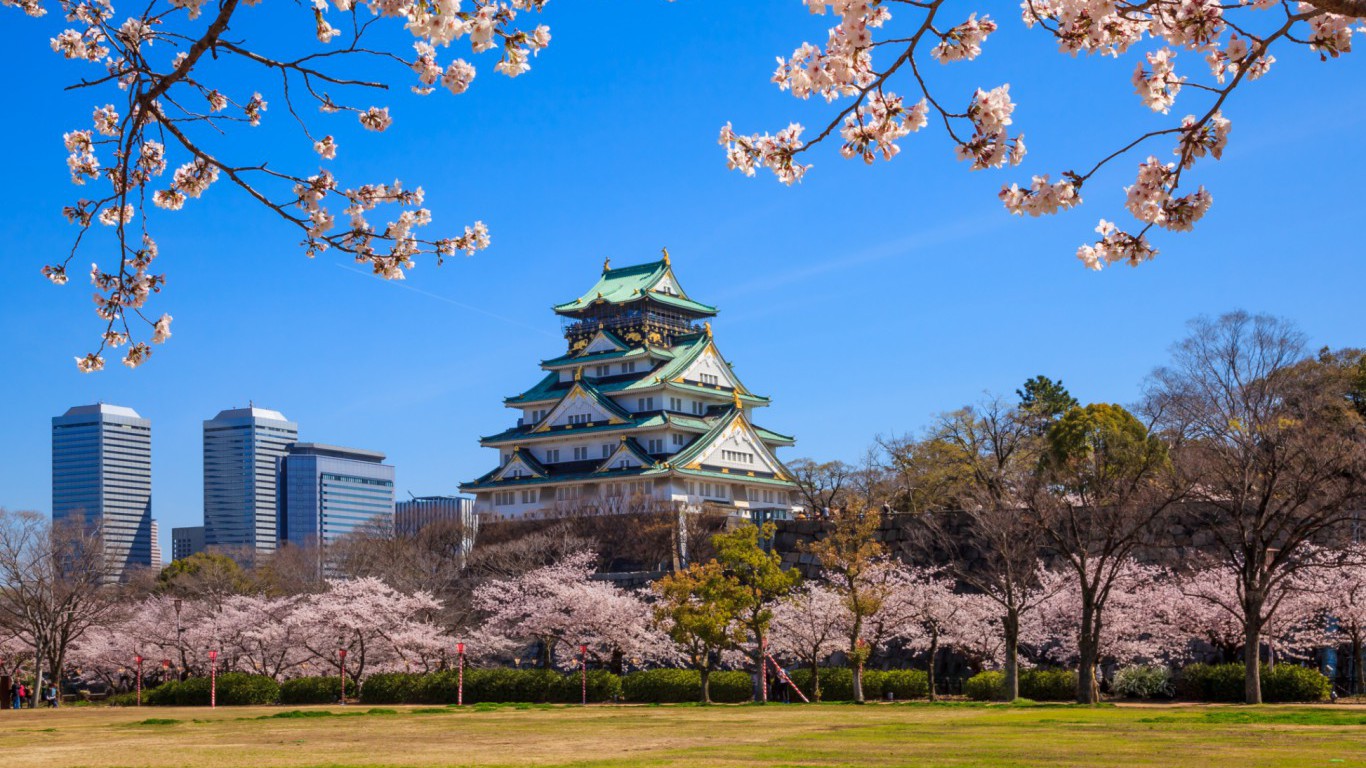
After several decades of economic stagnation, Japan’s economy took a turn for the better following the much covered 2012 election of Prime Minister Shinzo Abe. In a risky economic experiment nicknamed Abenomics, Japan injected large amounts of cash into the economy. The short-term outcome was soaring corporate profits. However, the effects of the policy are still being interpreted as there has yet to be a meaningful increase in wages or consumer spending.
Still, Japan is one of the world’s wealthiest nations. Its GDP of $4.8 trillion is third highest of all countries reviewed after the United States and India. Japan’s GNI per capita of $37,268 is on par with the world’s most advanced economies.

22. France
> GNI per capita: $37,827.08
> 2015 GDP: $2.67 trillion
> Population: 66,808,385
> Life expectancy: 82.4 years at birth
France’s GNI per capita of $37,827 is similar to the average GNI per capita across all eurozone countries of $37,693, and it is among the highest in the world. France is the leading exporter of planes, helicopters, and spacecrafts, which comprise a bulk of the country’s export revenue. The most visited country in the world, France also benefits from an active tourism industry. Revenue from tourism amounted to 3.6% of France’s GDP in 2014, a relatively large share.
Like many wealthy Western European countries, high taxes and government spending in France likely help the French enjoy a high quality of life. The life expectancy at birth in France is 82.4 years, longer than both the life expectancy across the eurozone of 81.6 years and the U.S. life expectancy of 78.9 years.
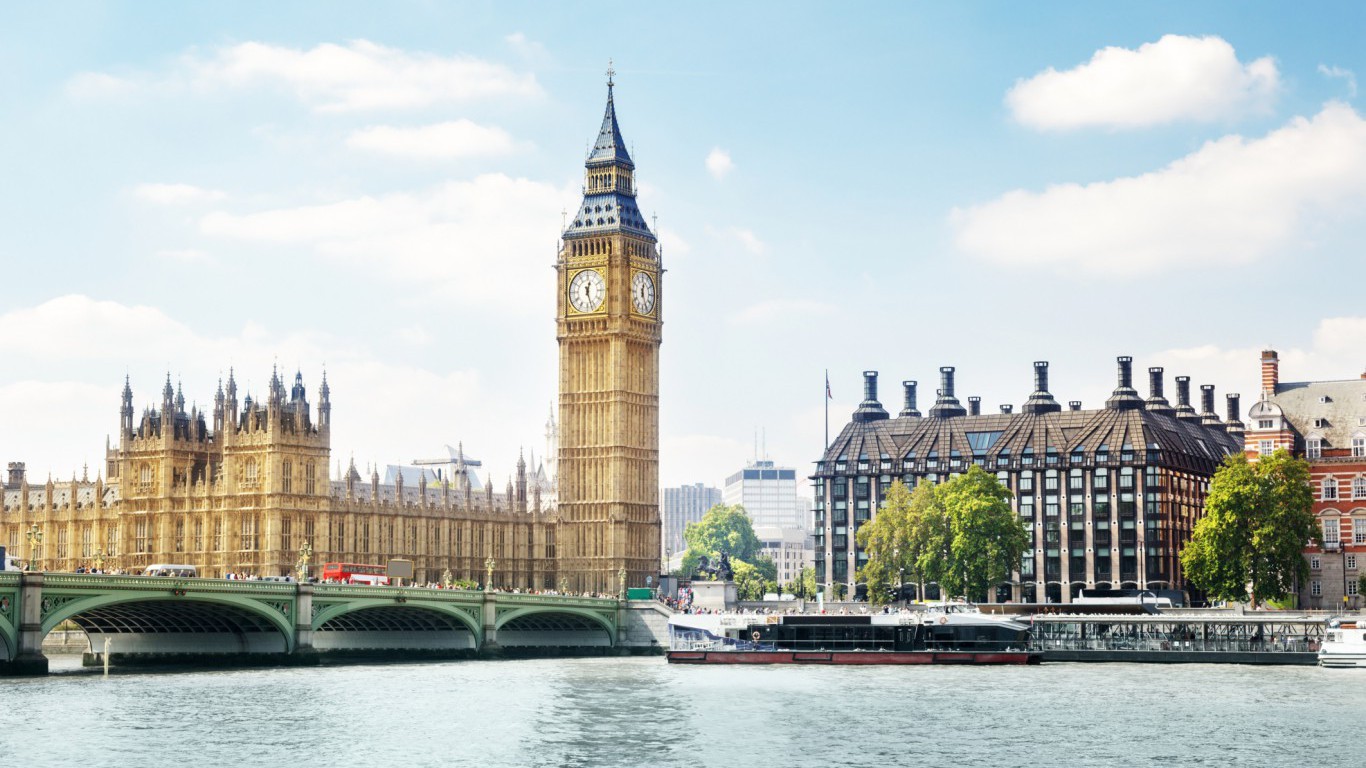
21. United Kingdom
> GNI per capita: $37,930.83
> 2015 GDP: $2.70 trillion
> Population: 65,138,232
> Life expectancy: 81.1 years at birth
Like most developed nations today, the United Kingdom’s economy is service oriented. However, like most developed nations today, the U.K. has a service-oriented economy. The nation’s service sector accounts for 79.2% of GDP, nearly the largest share of any country. The U.K. also has large aerospace, pharmaceutical, automotive, and oil production industries, which are partially reflected by the country’s top exports — cars, gold, crude and refined petroleum, and medicines.
In June 2016, the U.K. voted to exit the European Union. While it is unclear what the effect of the Brexit vote will be, some experts believe it will negatively impact the country’s economy and its citizens’ quality of life. The U.K.’s near world leading foreign investment and London’s status as the world’s top financial center may be hurt by Britain’s exit from the politico-economic union.
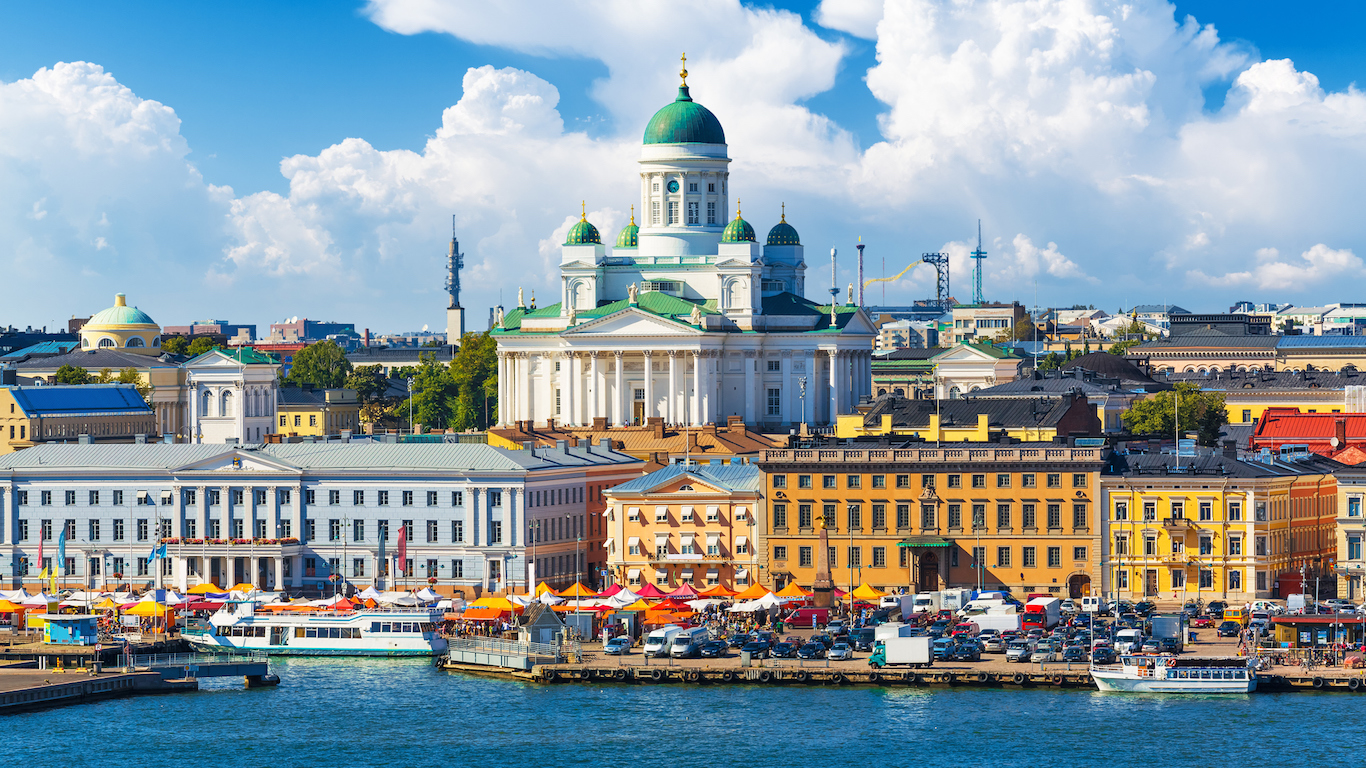
20. Finland
> GNI per capita: $38,868.14
> 2015 GDP: $224.94 billion
> Population: 5,482,013
> Life expectancy: 81.1 years at birth
Finland’s GNI per capita of $38,868 is among the highest in the world. The Nordic country exports primarily raw materials and production supplies. Finland’s forestry sector, for example, accounts for approximately 20% of the country’s export revenue and the country is one of the world’s top producers of paper — also a top export. Global shipments of paper from Finland in 2015 totalled $7.5 billion. While down from 2011, this was well above Finland’s next largest export, wood, which represented $1.9 billion in shipments.
[in-text-ad]
The Finnish people have some of the highest standards of living in the world. Due in part to its tuition-free higher education system, 40% of 25 to 64 year old Finnish residents had attained tertiary education as of 2012, one of the highest college-level attainment rates worldwide.
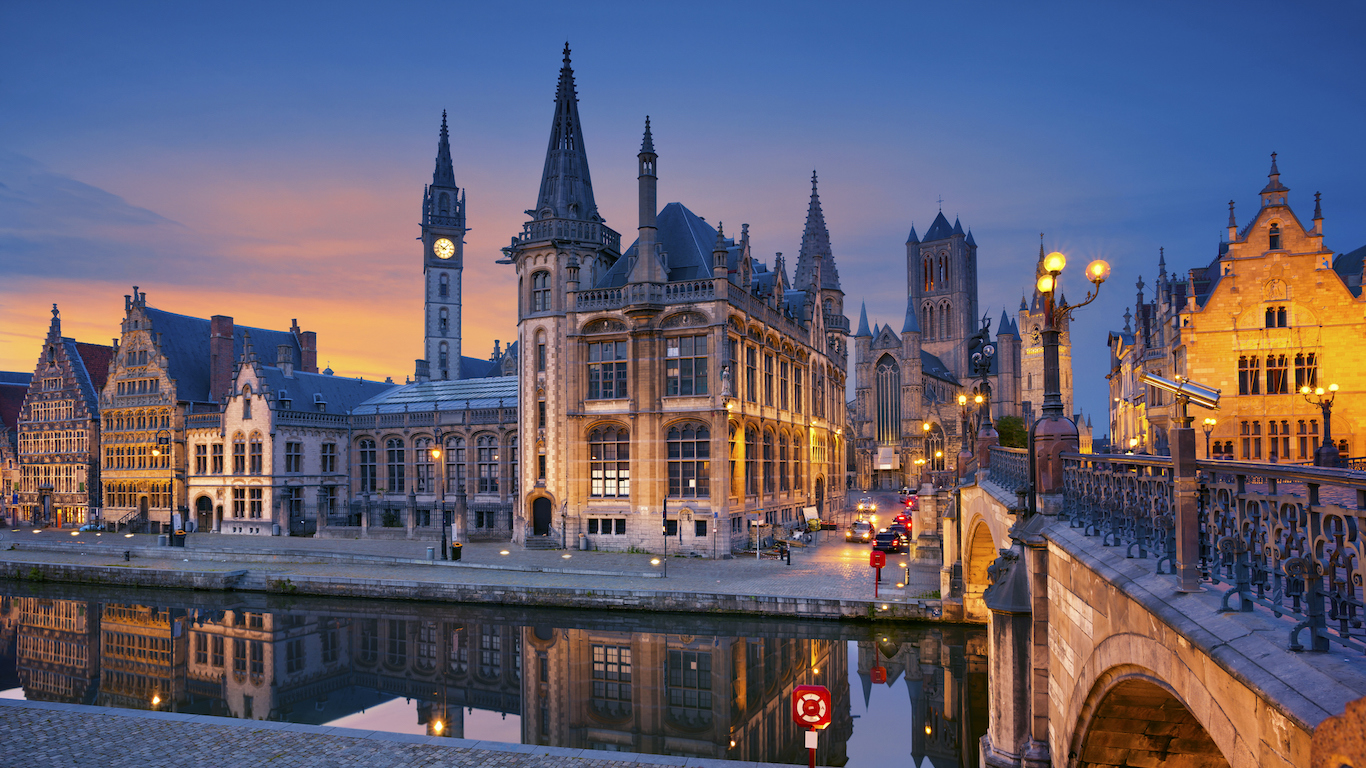
19. Belgium
> GNI per capita: $41,243.31
> 2015 GDP: $494.85 billion
> Population: 11,285,721
> Life expectancy: 80.6 years at birth
Belgium’s top exports are pharmaceuticals, automobiles, and oil — each accounted for between 8% and 11% of the country’s 2015 global shipments. According to a recent international trade study from financial services company ING Group, import demand will grow to $568 billion in 2017, making Belgium the 16th largest importer in the world. The country is the headquarters of both the EU and NATO.
As is the case with the vast majority of wealthy nations, Belgium’s economic prosperity has helped improve living conditions of its residents. The life expectancy in the country, estimated at over 80 years, is among the highest of all countries.
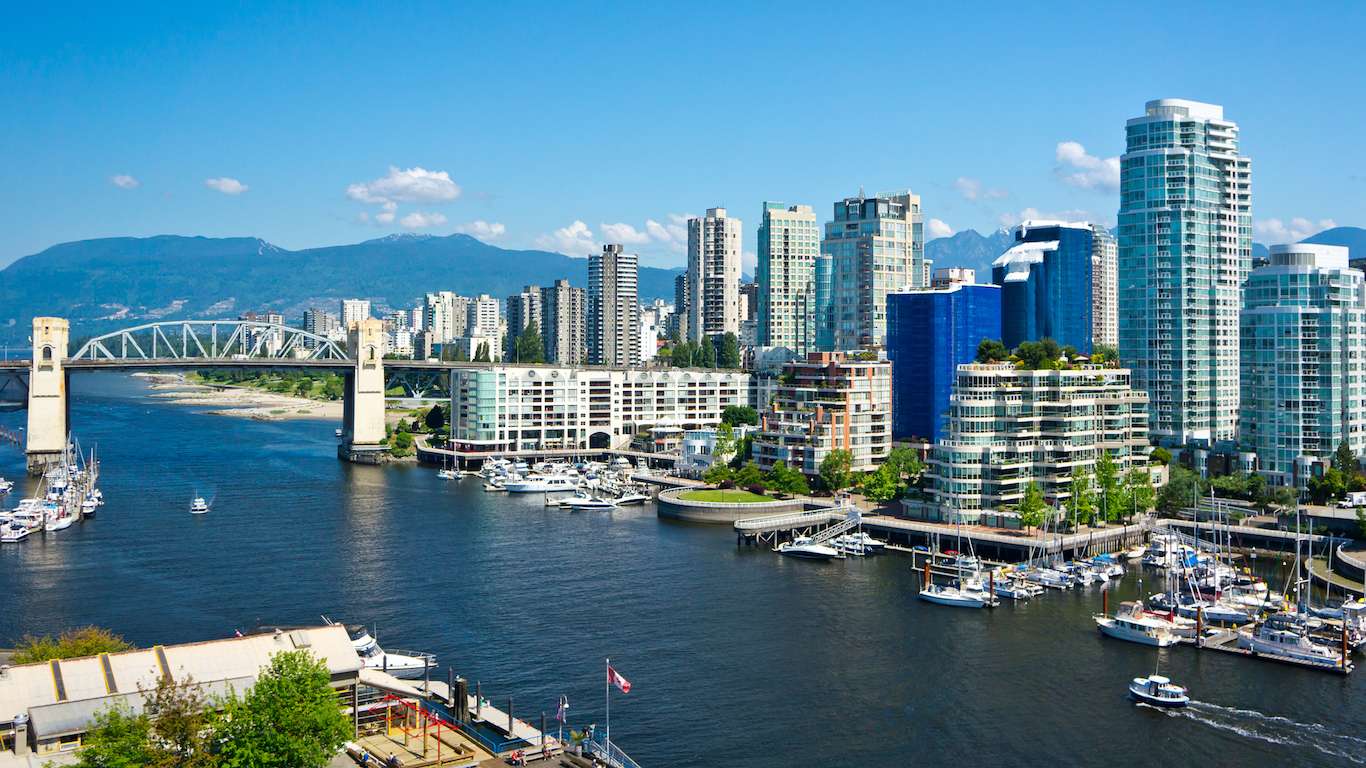
18. Canada
> GNI per capita: $42,581.91
> 2015 GDP: $1.6 trillion
> Population: 35,851,774
> Life expectancy: 82.0 years at birth
The second largest country by landmass, Canada is rich with natural resources. Not surprisingly, a relatively large share of Canada’s economy is derived from natural resource harvesting. While that share has dwindled over the past two decades, the National Bank of Canada estimates that the forest, mineral, and energy industries account for about 14% of the country’s GDP. Canada exports more crude petroleum than any other product, and it is the world’s leading exporter of sawn wood.
By many socioeconomic measures, Canadians enjoy a slightly higher quality of life than their American counterparts. An estimated 88.5% of Canada residents use the internet compared to 74.5% of connected Americans. Additionally, the Canadian life expectancy at birth of 82.0 years is longer than the U.S. life expectancy of 78.9 years.
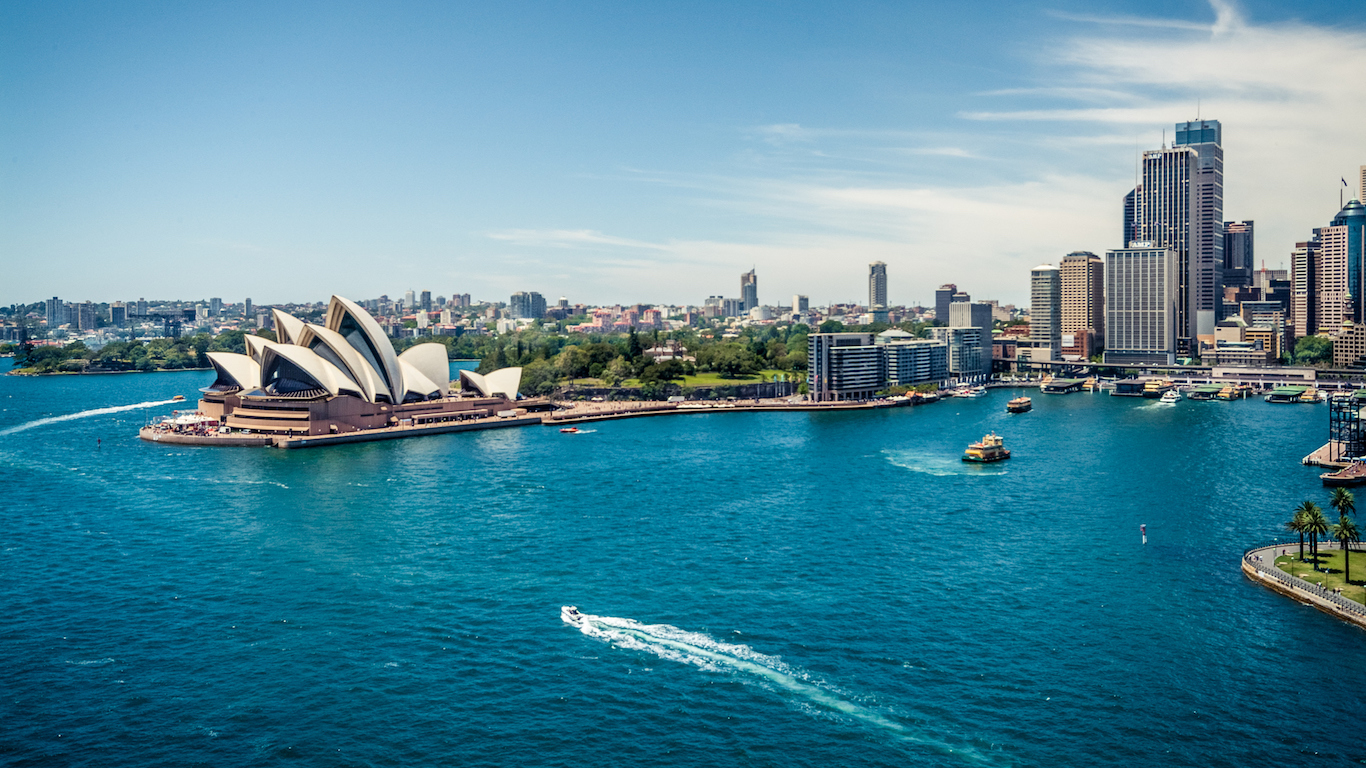
17. Australia
> GNI per capita: $42,822.20
> 2015 GDP: $1.14 trillion
> Population: 23,781,169
> Life expectancy: 82.3 years at birth
Australia’s economy is the 18th largest in the world and its residents rank as the 17th wealthiest in the world. The country supplies almost half of the world’s iron ore, three-fourths of which it trades to China. Approximately 17% of Australia’s economic output comes from exports, and over half of Australia’s exports are oil, ores, slag, and ash.
Across the country, citizens enjoy some of the best educational and health outcomes worldwide. More than one-fourth of Australians have at least a bachelor’s degree, one of the highest attainment rates in the world. The life expectancy at birth in the country is 82.3 years, the eighth longest of any country.
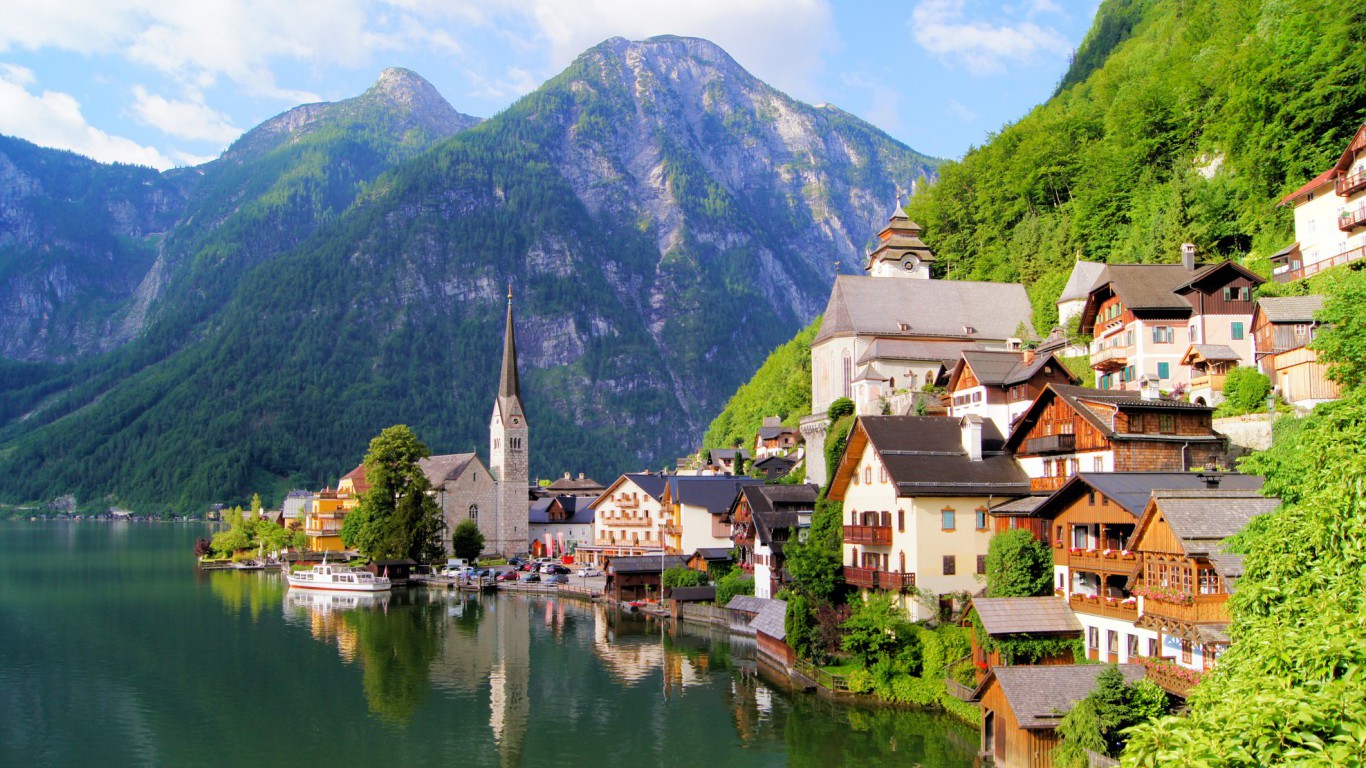
16. Austria
> GNI per capita: $43,608.82
> 2015 GDP: $405.06 billion
> Population: 8,611,088
> Life expectancy: 81.3 years at birth
Landlocked between Switzerland, the Czech Republic, Germany, Hungary, Italy, Slovakia, and Slovenia, Austria has a diversified economy and exports a variety of products, including pharmaceuticals, electronic equipment, and automobiles. Austria’s closest trading partner is Germany, where it sends more than one-quarter of its exports.
The Austrian government spends 46.4% of its GDP on public goods and services — above the 38.3% average among all E.U. nations, and much higher than the 23.0% the U.S. government spends. Perhaps indicative of the country’s relatively high standard of living is Austria’s life expectancy. Austrians can expect to live to be about 81 years old versus the average across Europe and Central Asia of 77 years.

15. Ireland
> GNI per capita: $43,797.97
> 2015 GDP: $305.04 billion
> Population: 4,640,703
> Life expectancy: 81.2 years at birth
Ireland’s economy grew by 26.3% in 2015, by far the fastest of any country the World Bank reviewed. However, this growth has likely been a gross overestimate. As the Irish Times reported in July, large GDP growth distortions can occur when Irish-based companies acquire larger foreign companies or even after the government implements new tax rules. Even if GDP growth is misleading, the country’s GNI of $43,797 per capita makes Ireland residents some of the wealthiest in the world.
[in-text-ad]
A recent IMF report on the stability of the Irish economy predicts the UK’s vote to leave the EU is very likely to have adverse effects on Ireland’s financial system.

14. Denmark
> GNI per capita: $44,518.92
> 2015 GDP: $258.78 billion
> Population: 5,676,002
> Life expectancy: 80.5 years at birth
Much like other wealthy European, particularly Nordic, countries, Denmark imposes high tax rates and provides generous social programs. Denmark’s top marginal tax rate of approximately 56% and the effective personal income tax rate of between 35% and 48% are each some of the highest tax rates anywhere. While public social spending as a percentage of GDP has fallen in some wealthy countries — including Germany and Canada — in recent years, it remained high in other countries, including Denmark. In fact, Denmark spends on social programs the third most as a percentage of its GDP after France and Finland.
In its most recent evaluation of national government transparency, research organization Transparency International ranked Denmark as the world’s least corrupt country.
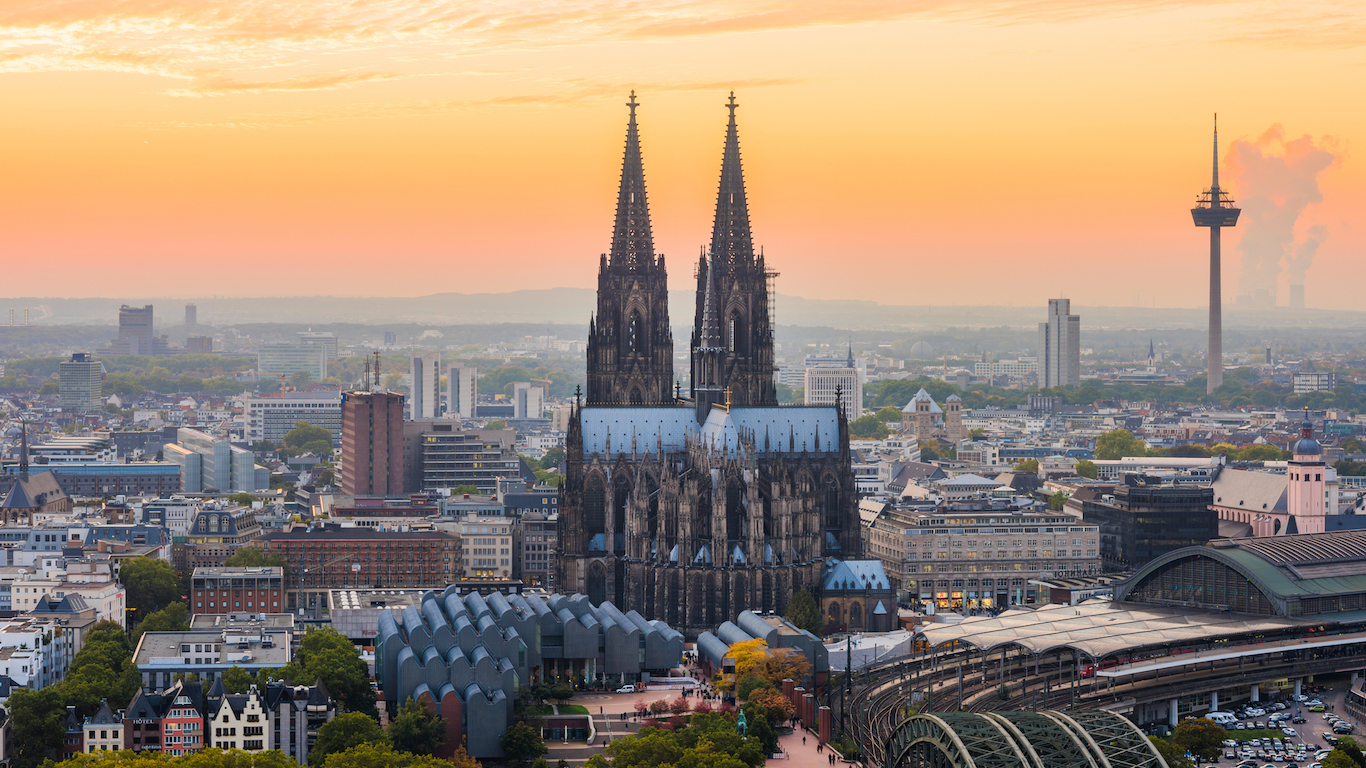
13. Germany
> GNI per capita: $44,999.65
> 2015 GDP: $3.86 trillion
> Population: 81,413,145
> Life expectancy: 80.8 years at birth
With a GNI of $45,000 per capita, Germany is one of the wealthiest countries in the world. Germany has the world’s third largest export economy, and its exports include an array of machine, transportation, chemical, and metal products. Home to the headquarters of Audi, Mercedes-Benz, BMW, Volkswagen, and Porsche, Germany is the largest exporter of cars worldwide.
While crude oil and refined petroleum are some of Germany’s top imports today, their importance to the German economy may dwindle in the near future. As a relatively affluent nation, Germany has been able to invest substantial resources to develop alternative energy sources. Germany currently generates 31% of its electricity through renewable fuel sources, roughly triple the share from a decade ago.
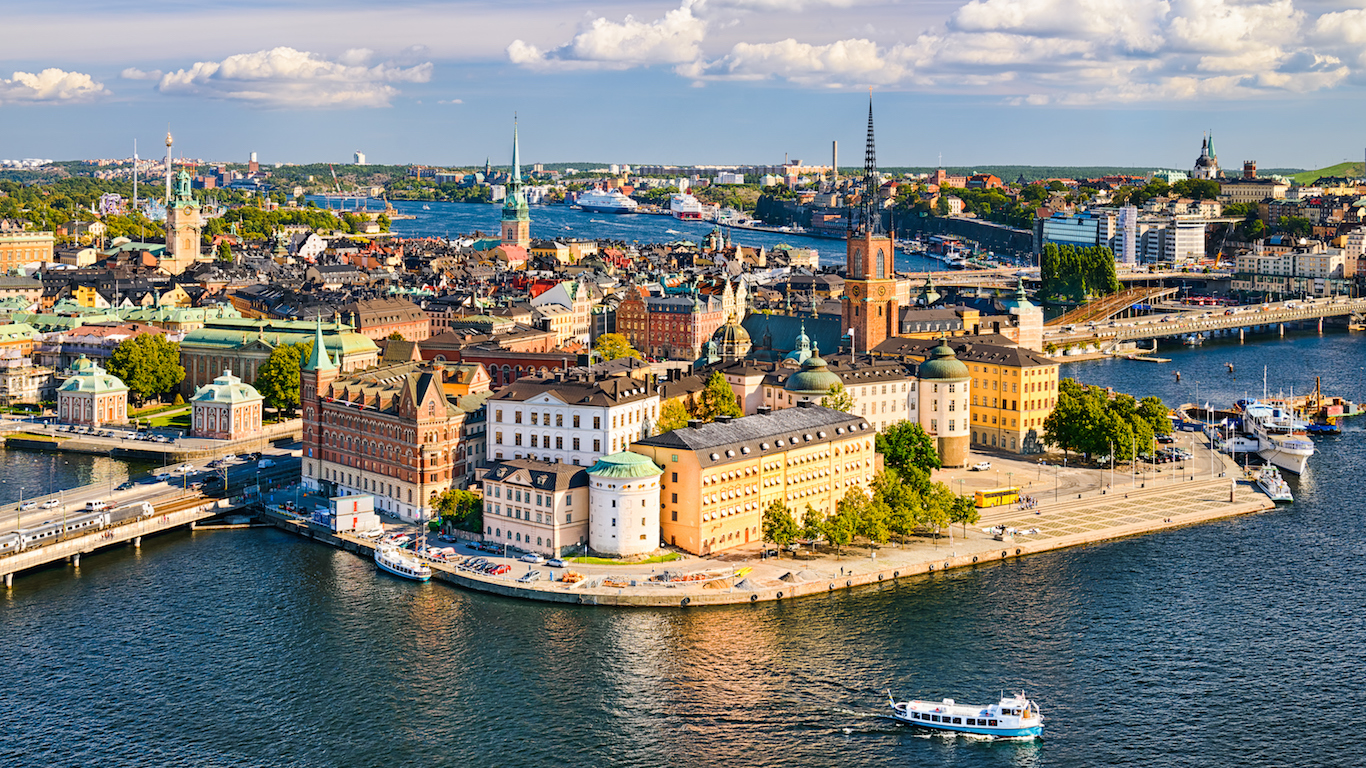
12. Sweden
> GNI per capita: $46,250.79
> 2015 GDP: $474.81 billion
> Population: 9,798,871
> Life expectancy: 82.0 years at birth
With a GNI of $46,251 per capita, the Swedish are the second wealthiest people in the Nordic region. An export-oriented economy, Sweden maintains a positive trade balance. The country’s top exports are refined petroleum, medicine, automobile parts, and telephones. Sweden’s top trading partners are similarly wealthy nations — Germany, the United Kingdom, and Denmark.
Like most Nordic countries, Sweden’s high taxes and government spending help redistribute the nation’s wealth, ensuring relatively high national income equality, and allowing most of the population to enjoy a high quality of life. The average Swedish life expectancy at birth is 82 years, far longer than the U.S. life expectancy of 78.9 years.
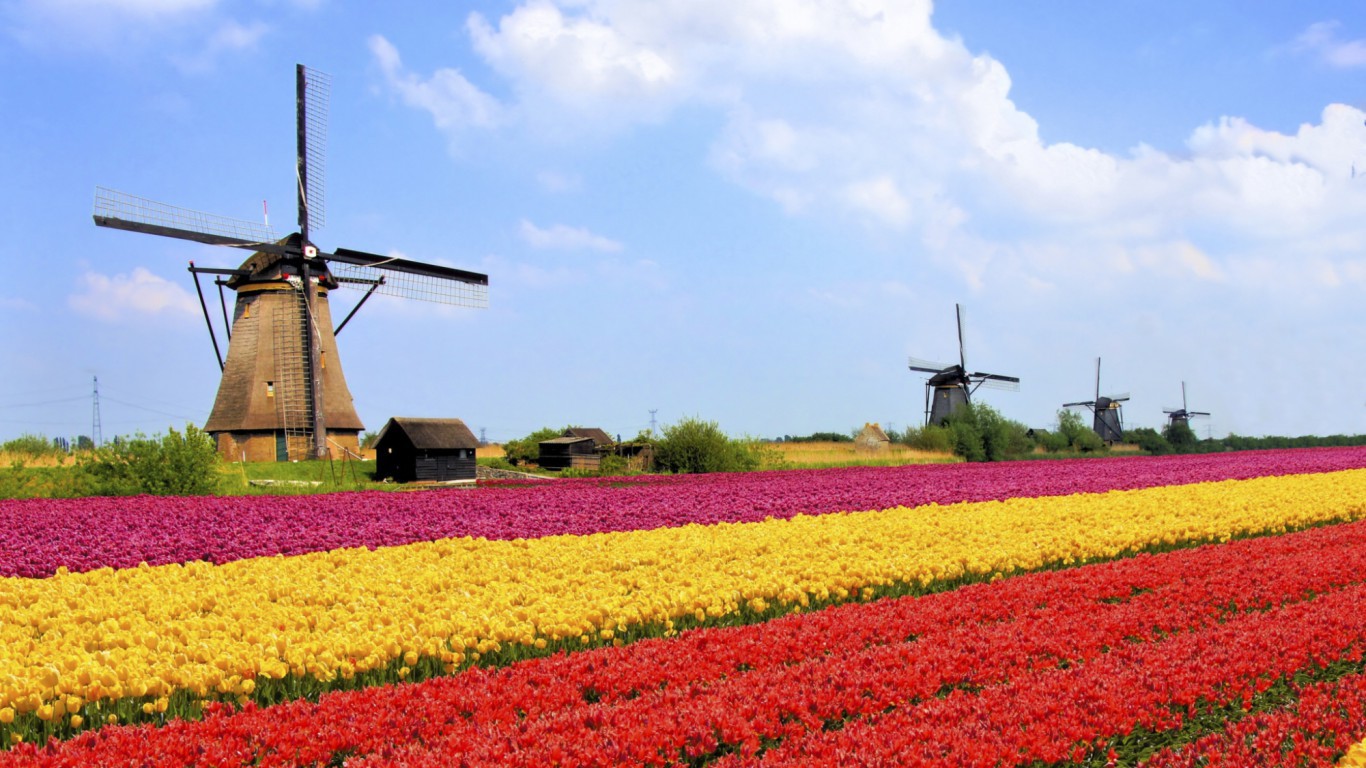
11. Netherlands
> GNI per capita: $46,325.58
> 2015 GDP: $840.47 billion
> Population: 16,936,520
> Life expectancy: 81.3 years at birth
Like many wealthy countries in Europe, the Netherlands has a mixed economy that relies heavily on trade, especially with other countries on the continent. As a testament to the Netherlands’ trade-dependence, government officials have advocated for policies that will improve the Dutch economy through strengthening Europe’s economy as a whole. After the United States, the Netherlands is the second-largest exporter of agricultural products, which account for 18.8% of Dutch exports. Agricultural product shipments from the Netherlands totalled approximately $87.6 billion in 2015, with by far the largest portion of trade going to Germany. These products include primarily vegetables, meat, dairy, and eggs, but also flowers and plants.
With a GNI of $46,326 per capita, well above the EU average of $35,339, Dutch residents are some of the richest people in the world.
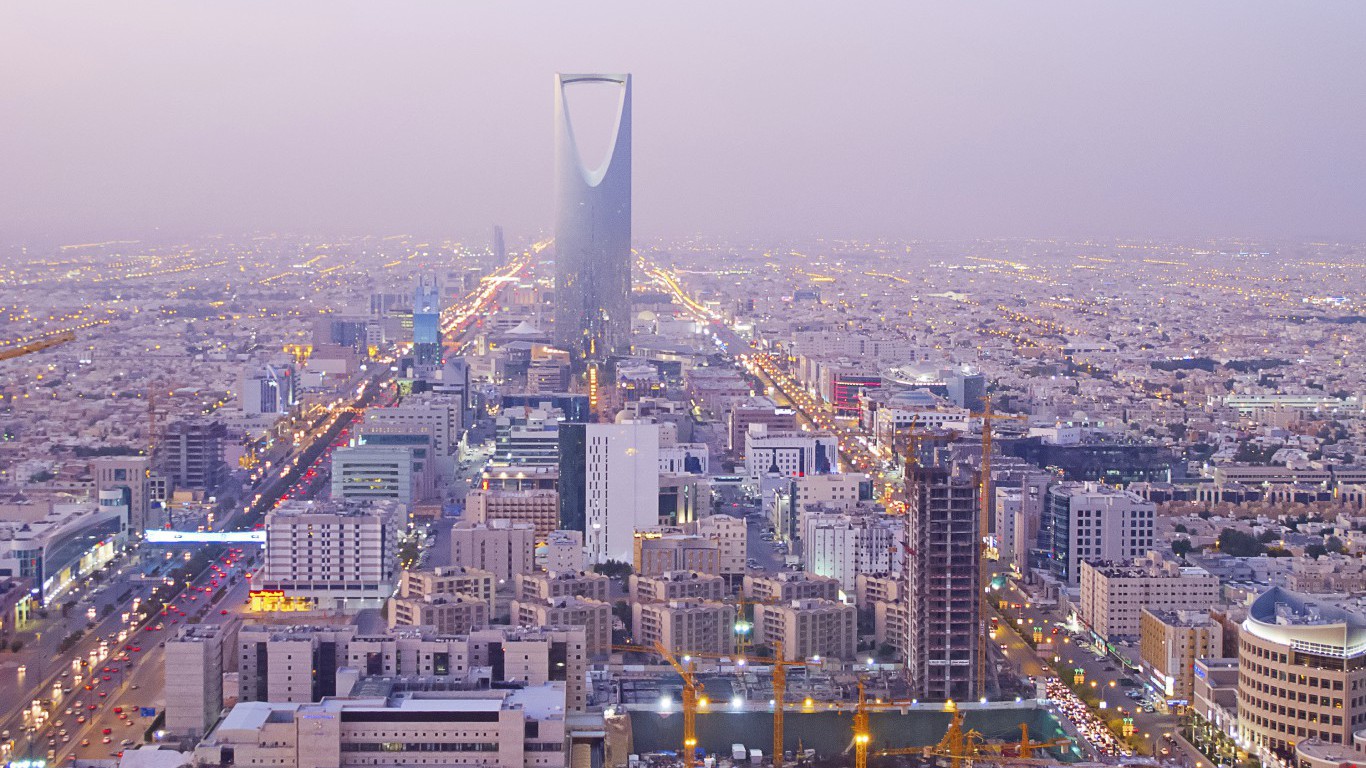
10. Saudi Arabia
> GNI per capita: $50,641.31
> 2015 GDP: $1.69 trillion
> Population: 31,540,372
> Life expectancy: 74.3 years at birth
Explorers in Saudi Arabia first struck oil in 1938. Today, the kingdom — home to 18% of all known petroleum reserves — is the world’s largest exporter of petroleum and the Middle East’s largest economy. Much like other countries that have reaped the wealth of natural resources and depend excessively on oil, Saudi’s economy has suffered with the recent drop in oil prices. The recent decline in the price of crude oil led to growing budget deficits in Saudi Arabia and cuts in government programs. Climate change policies and competition from U.S. oil production could exacerbate Saudi Arabia’s budget problems. In light of these concerns, Prince Mohammed bin Salman, who heads Saudi Arabia’s state oil monopoly, has initiated massive government restructuring.
[in-text-ad]
On the whole, Saudis enjoy substantially better living conditions than many other residents of the Middle East. For example, the life expectancy at birth of 74.3 years is well above the average life expectancy of 70.6 for the Arab region. The life expectancy in Saudi Arabia still trails most countries in Europe and the United States, however.

9. United States
> GNI per capita: $53,245.08
> 2015 GDP: $18.04 trillion
> Population: 321,418,820
> Life expectancy: 78.9 years at birth
The United States has the largest economy in the world and the ninth wealthiest people. Despite being the second largest exporter in the world after China and one of the largest exporters of refined petroleum products such as gasoline, the United States imports more than it exports, running a trade deficit of $36.4 billion in September.
The American people are relatively prosperous and enjoy an excellent standard of living compared to the rest of the world. Americans consume more than any other country and account for more than one-fourth of all goods and services bought worldwide. Americans live to be approximately 79 years old on average, about eight years longer than the global life expectancy but still lower than a number of European and other wealthy nations.
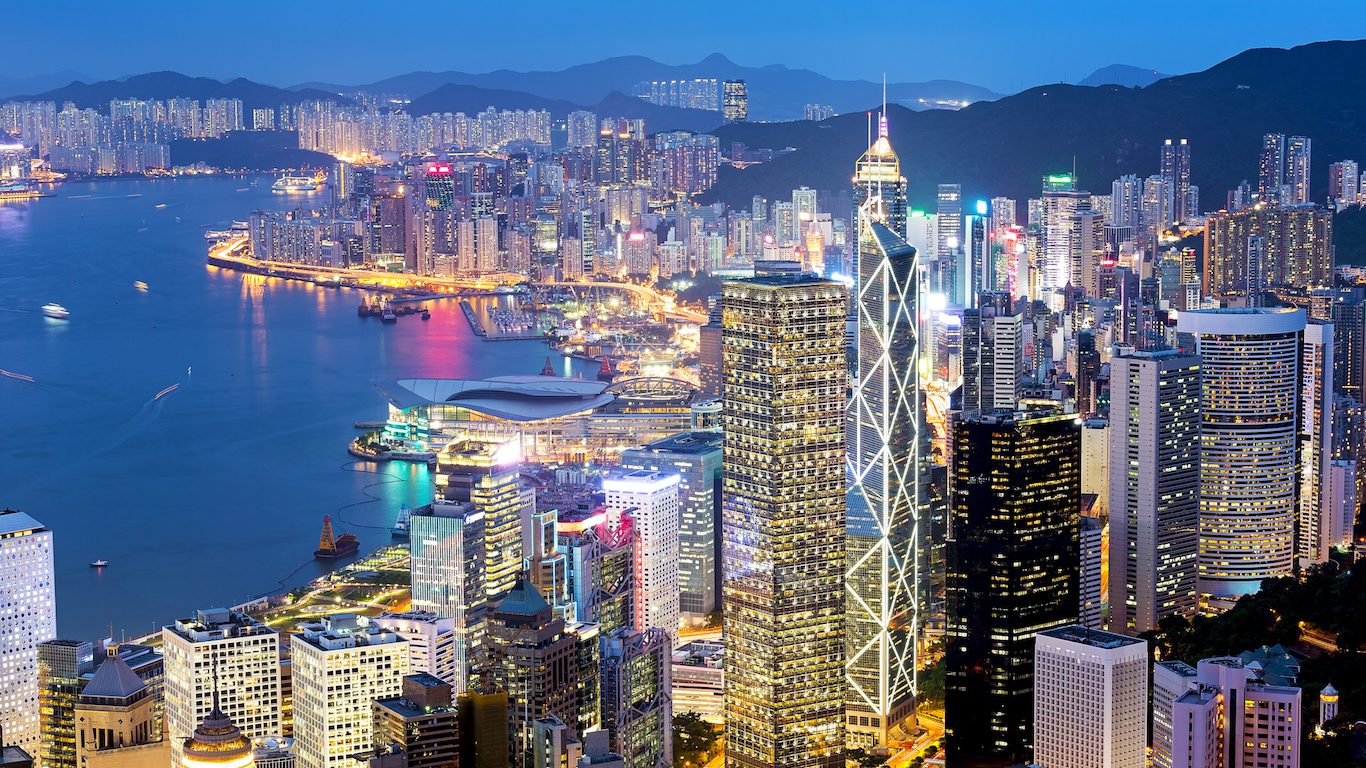
8. Hong Kong SAR, China
> GNI per capita: $54,264.91
> 2015 GDP: $415.87 billion
> Population: 7,305,700
> Life expectancy: 84.0 years at birth
Located along the southern tip of China and across the South China Sea from Thailand, Vietnam, and the Philippines, Hong Kong is one of the world’s most active trade economies. The Port of Hong Kong is the maritime access point to China for most of Southeast Asia, and it ships more cargo than all but three other ports worldwide. Hong Kong’s total exports are worth more than twice the Special Administrative Region’s GDP of $415.9 billion, and imports almost as much. Hong Kong is also one of the world’s top financial centers, bolstered in part by the region’s business-friendly tax climate.
High incomes often have a positive impact on regional health outcomes. The average Hong Kong resident can expect to live for 84 years, the longest life expectancy of any region reviewed.
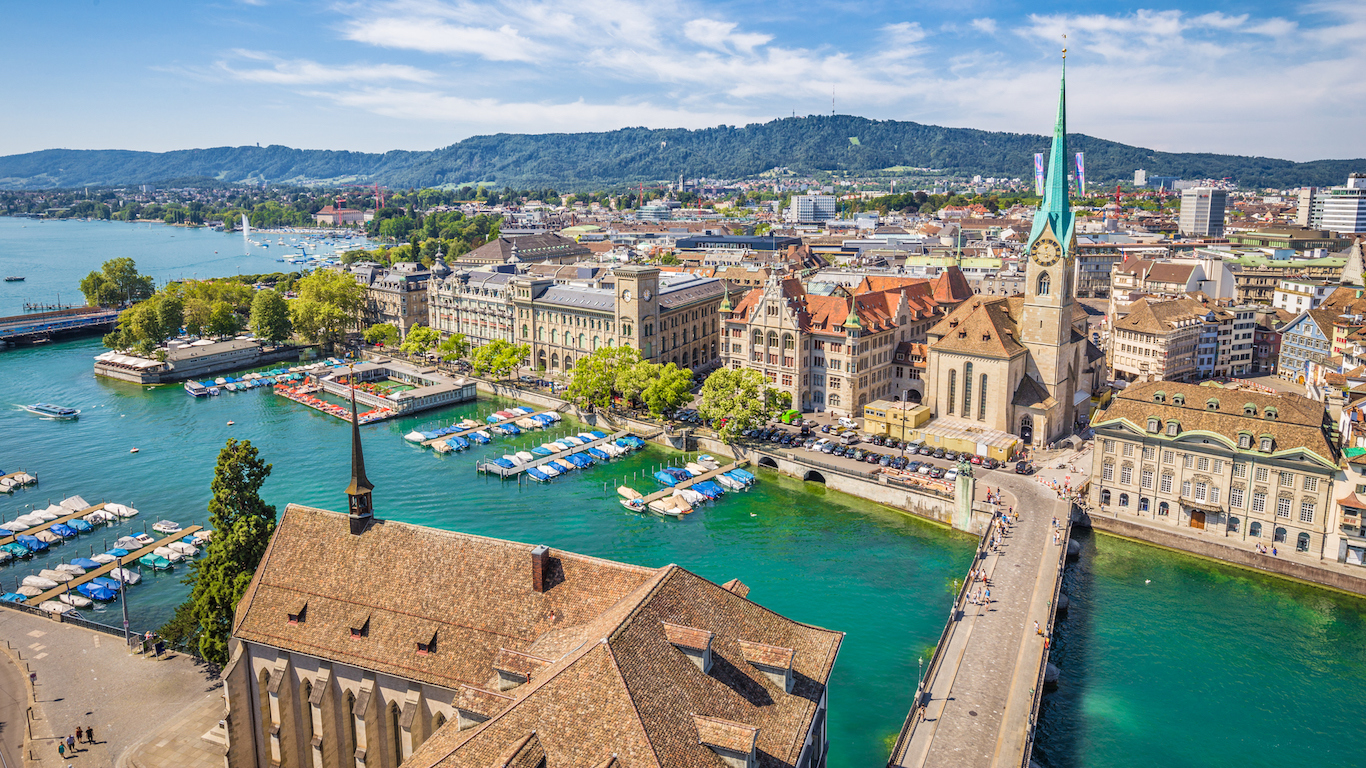
7. Switzerland
> GNI per capita: $56,363.96
> 2015 GDP: $483.14 billion
> Population: 8,286,976
> Life expectancy: 82.8 years at birth
With a GNI of $56,364 per capita, Switzerland’s 8.3 million citizens are among the wealthiest in the world and more than $20,000 wealthier than the average citizen across all E.U. countries. Like most developed nations, the bulk of Switzerland’s economy consists of service industries. The famous Swiss banking sector brings substantial foreign investment to the country. Roughly one quarter of all private offshore funds worldwide are held at Swiss banks, the largest share of any country. Switzerland is also the world’s leading exporter of gold and precious metal watches. Exports account for 63.5% of the country’s GDP, a larger share than the 42.9% average for EU countries.
A further indication of the nation’s affluence, access to medical care in Switzerland is second-to-none. There are more than four physicians for every 1,000 people in the country. Access to care and the myriad benefits of national prosperity have likely made the Swiss one of the healthiest populations in the world. The average life expectancy at birth in Switzerland is 82.8 years, the fourth longest of any nation.

6. United Arab Emirates
> GNI per capita: $64,661.37
> 2015 GDP: $643.99 billion
> Population: 9,156,963
> Life expectancy: 77.4 years at birth
With a GNI of $64,661 per capita, the United Arab Emirates is the sixth wealthiest country in the world. The country has one of the largest reserves of crude petroleum. The UAE’s oil and gas industry currently accounts for an estimated 30% of the nation’s GDP. Nearly all of the confirmed crude oil reserves in the UAE are located in Abu Dhabi and are controlled by the state-owned Abu Dhabi National Oil Company. With 137 billion barrels of oil, ADNOC is the fourth largest oil company worldwide.
Due to the recent global decline in oil prices, the UAE government last year posted its first fiscal deficit since 2009. Like many oil-rich countries, the UAE has begun initiatives to lower its dependence on oil revenue. The country has an active tourism industry and has recently made efforts to boost its non-oil foreign trade, renewable energy, and logistics sectors.
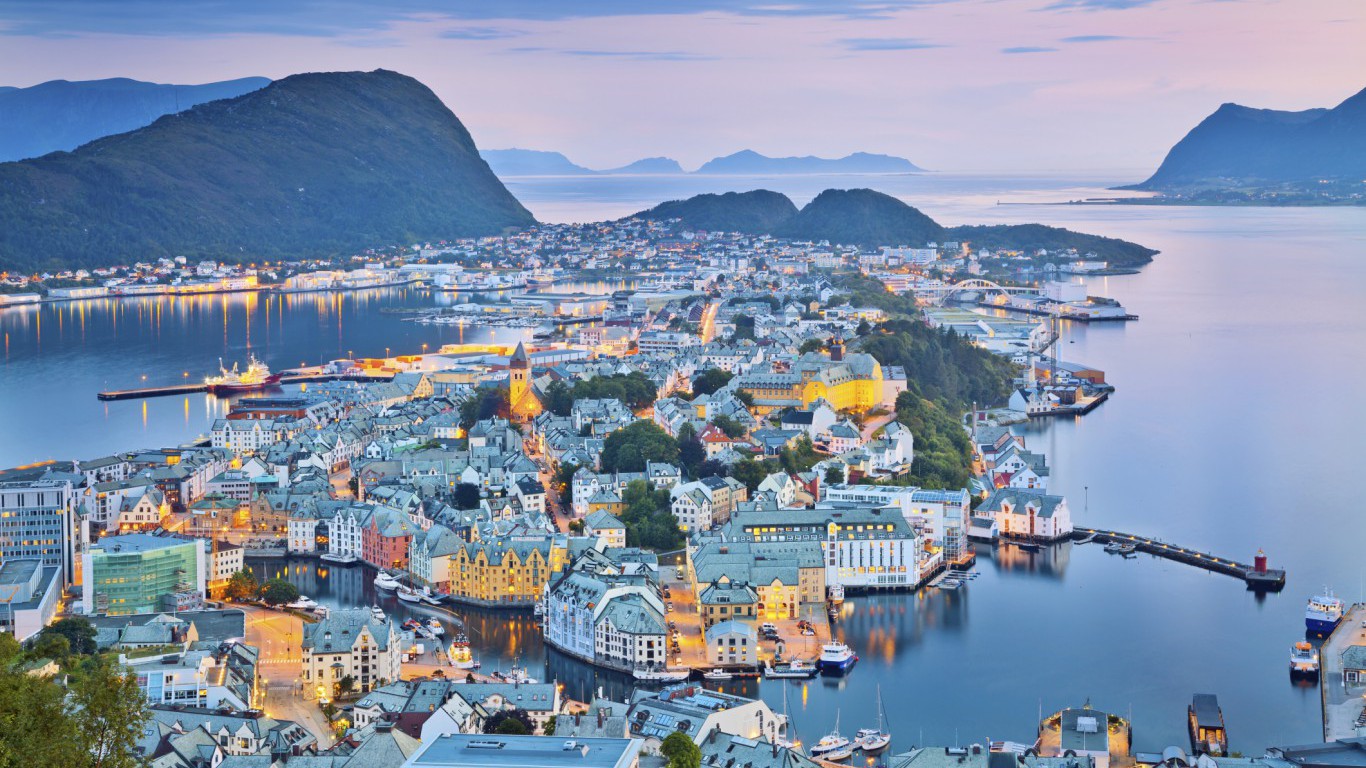
5. Norway
> GNI per capita: $67,614.35
> 2015 GDP: $357.05 billion
> Population: 5,195,921
> Life expectancy: 81.8 years at birth
The largest holder of natural gas and crude oil reserves in Europe, Norway is the wealthiest Nordic country and the fifth wealthiest of any nation worldwide. Extracted from the North Sea, most of Norway’s crude oil and natural gas is sold to the United Kingdom, Germany, and the Netherlands. State-owned Statoil largely controls Norway’s oil trade, which accounts for an estimated 40% of the country’s export revenue. As the price of oil fell over the past several years, Norway’s oil revenues fell accordingly. Oil revenue may continue to fall regardless of commodity prices in the coming years, however, as the North Sea’s fields are dwindling.
[in-text-ad]
While Norway’s national oil company is similar to that of oil-rich Arab nations, the country’s high taxes and redistribution of wealth are more in line with the social policies of its Scandinavian neighbors. According to the Gini index, Norway has the third most equal distribution of wealth of any country.

4. Kuwait
> GNI per capita: $76,075.21
> 2015 GDP: $289.93 billion
> Population: 3,892,115
> Life expectancy: 74.6 years at birth
The small, densely populated country of Kuwait is heavily dependent on its natural resources — which have so far also made residents extraordinarily wealthy. The Kuwaiti oil and gas sector accounts for approximately 60% of the economy and nearly all of its export revenue. The country’s gross national income per capita of $76,075 exceeds that of all but three countries.
Due largely to the recent global drop in oil prices, Kuwait, like a number of other Middle Eastern nations, has taken steps to reduce its oil dependency. Due to economic uncertainty tied to falling oil prices, the Kuwaiti government dissolved its parliament in October, triggering a new election cycle.
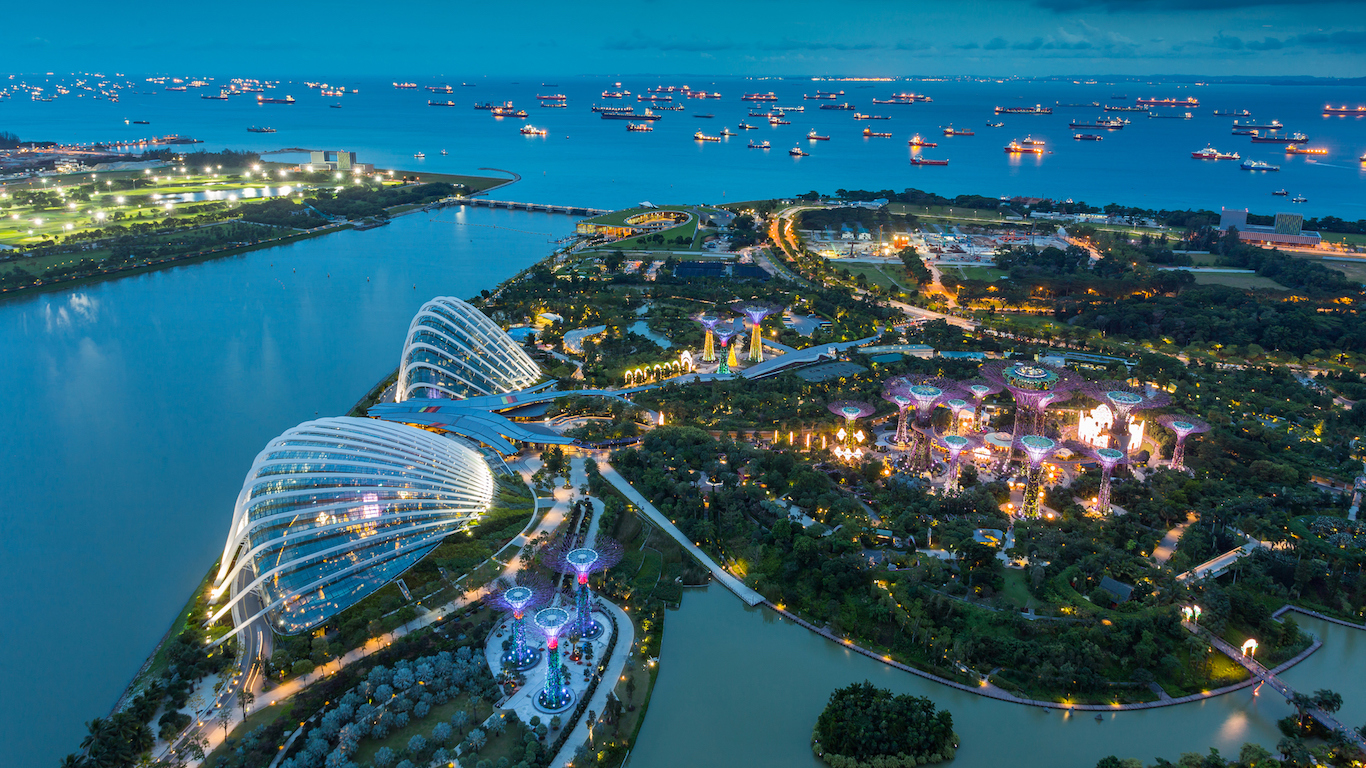
3. Singapore
> GNI per capita: $77,537.90
> 2015 GDP: $472.59 billion
> Population: 5,535,002
> Life expectancy: 82.6 years at birth
Situated on the southern tip of Malaysia and the mouth of the Strait of Malacca, through which approximately 40% of the world’s maritime cargo is shipped, Singapore is one of the most active trade economies on the globe. The Port of Singapore is the second busiest in the world. Roughly two-thirds of the Southeast Asian nation’s exports, which include electronic equipment, machines, petroleum, and much more, were imported from another country, as opposed to being produced locally. The country exports 1.7 times the value of its GDP and imports 1.5 times its GDP value in a near-perfect trade balance, making it the second-most trade dependent nation.
With a GNI of $77,538 per capita, Singapore citizens are the third wealthiest in the world. The average Singaporean can expect to live for more than 82 years, the sixth highest life expectancy worldwide.

2. Macao SAR, China
> GNI per capita: $114,445.17
> 2015 GDP: $65.52 billion
> Population: 587,606
> Life expectancy: 80.6 years at birth
Known as the gambling capital of Asia, more than 40% of Macao’s GDP is generated by its tourism industry. In January 2015, the average tourist in Macao spent about $1,200 gambling, nearly twice the average amount a gambler spends in Las Vegas, Nevada. In addition to gambling, Macao has an active trade economy. The total value of the country’s exports amounts to 78% of the Macao GDP, one of the highest trade ratios in the world. Without a wealth of natural resources, Macao imports many of its basic goods — water, refined petroleum, and consumer electronics — from China.
Macao’s dependence on foreign tourism has made it particularly vulnerable to the slowdown in economic growth in China. Largely due to dwindling gambling revenue, Macao’s GDP shrank by 20.3% in 2015 — a larger contraction than in any other country. Declining gambling revenue was also partly due to an anti-corruption campaign led by Chinese President Xi Jinping.
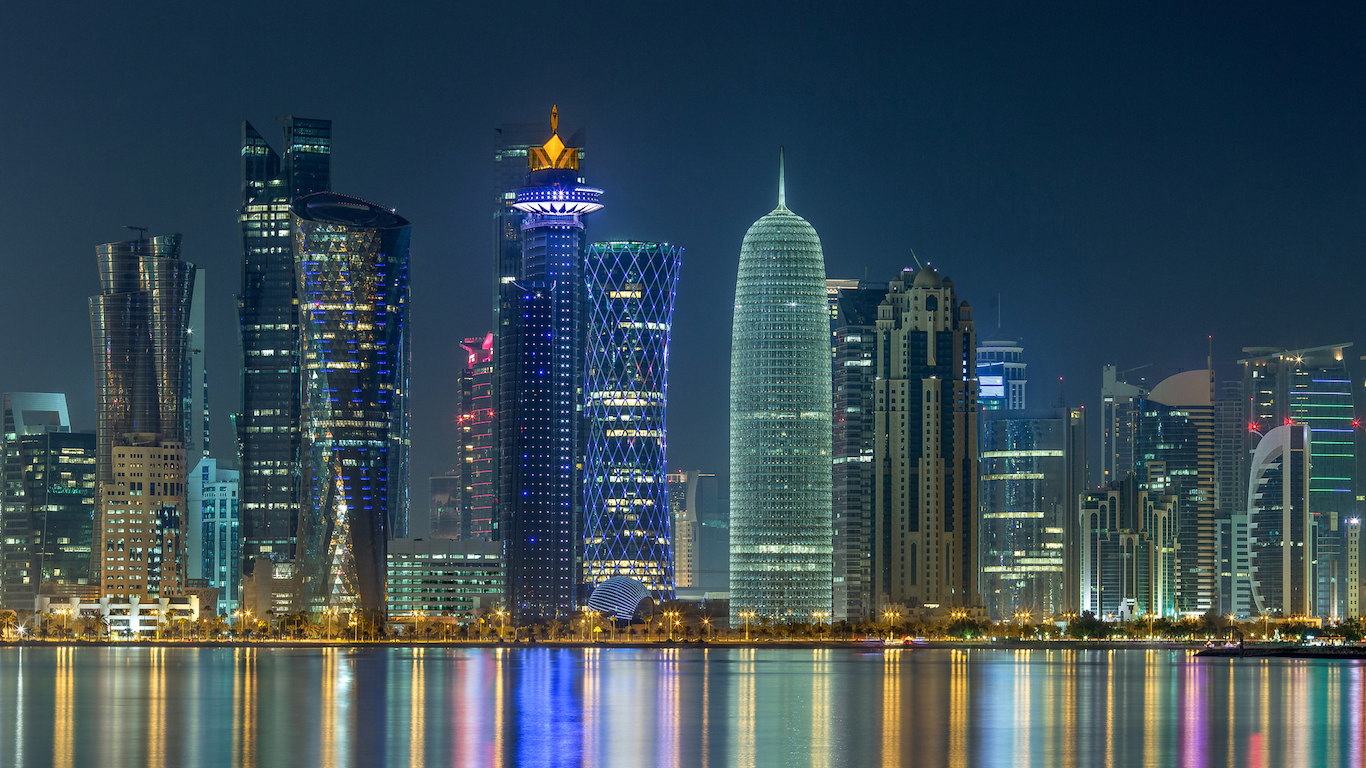
1. Qatar
> GNI per capita: $129,076.58
> 2015 GDP: $321.69 billion
> Population: 2,235,355
> Life expectancy: 78.6 years at birth
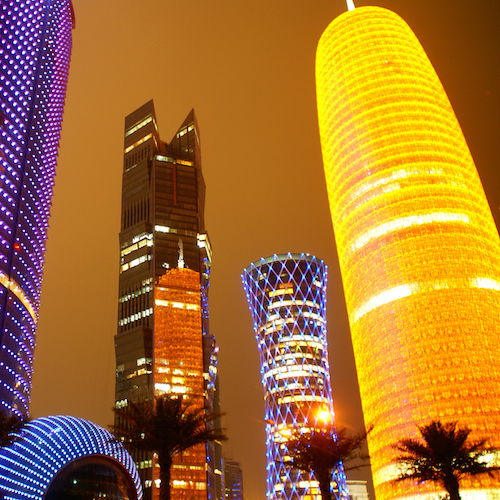
Qatar is the wealthiest country in the world. The nation’s GNI per capita of $129,077 dwarfs that of every nation. Only Macao, a special administrative region of China, comes close with a six-figure GNI per capita. Qatar’s wealth is due primarily to its oil and gas resources. The Middle Eastern nation is one of the world’s top exporters of petroleum and natural gas. Unlike most countries worldwide, the global economic downturn did not erode Qatar’s financial condition — Qatar maintained a budget surplus from 2009 through 2014.
Recent oil price drops are affecting the country however. Falling oil prices have resulted in massive revenue declines in the oil-rich nation. The recently approved national budget for 2016 includes large spending cuts in what officials are expecting to be Qatar’s first budget shortfall in 15 years.
After two decades of reviewing financial products I haven’t seen anything like this. Credit card companies are at war, handing out free rewards and benefits to win the best customers.
A good cash back card can be worth thousands of dollars a year in free money, not to mention other perks like travel, insurance, and access to fancy lounges.
Our top pick today pays up to 5% cash back, a $200 bonus on top, and $0 annual fee. Click here to apply before they stop offering rewards this generous.
Flywheel Publishing has partnered with CardRatings for our coverage of credit card products. Flywheel Publishing and CardRatings may receive a commission from card issuers.
Thank you for reading! Have some feedback for us?
Contact the 24/7 Wall St. editorial team.