Special Report
Countries With the Most Generous Welfare Programs

Published:
Last Updated:

Public social spending has remained at approximately 21% of GDP on average since 2009 across 34 member nations of the Organization for Economic Cooperation and Development. Public spending in the United States amounts to 19.3% of the U.S. economy, which is the world’s largest.
24/7 Wall St. reviewed OECD data published in the OECD Social Expenditure Database. According to the October 2016 update, “Social spending stays at historically high levels in many OECD countries.” France leads the world with annual public social expenditure equivalent to 31.5% of its GDP. Mexico trails every other OECD member nation with public social spending at just 7.5% of GDP.
[in-text-ad]
Public spending as a percentage of GDP grew or remained high after the global financial crisis in many European nations. This was not because of any actual major increases in social spending, but because of GDP contractions in these countries.
Click here to see the countries with the most generous welfare programs.
Notably, Greece is among the top 10 countries worldwide for its social spending not because of abundant resources but because the country’s economy contracted by almost 20% from 2009 through 2014.
Generous public assistance programs are also found in the world’s wealthiest and most prosperous nations. Germany, in particular, is able to provide its generous welfare programs because of its economic strength. After expanding faster in recent years than almost every other country, the German economy is the third largest in the world with a GDP of $3.8 trillion. Germany’s per capita GDP of $46,347 is ninth largest in the OECD.
Old-age and health expenditures make up the majority, about two-thirds, of public social spending in OECD countries. The largest expenditure, at 8.7% of GDP on average across the OECD, is spending on the elderly, which includes pensions. This is often especially the case in countries that spend a great deal overall on social programs. A high share of elderly residents in many of these countries likely helps explain their greater social spending on senior citizens. In the United States, 14.5% of the population is at least 65 years old. In many of these countries, the share of the elderly population is around 20% or higher.
The official poverty rate in each of these nations is calculated after taxes and transfers. This means that with larger pensions, fewer elderly residents fall under the poverty threshold; with more help from a country’s generous welfare program, financial constraints are less likely to push individuals into poverty. As a consequence, the countries with the largest social nets tend to have relatively low poverty rates.
To identify the countries with the most generous social programs in the world, 24/7 Wall St. reviewed public social expenditures as a percentage of GDP from “Social Spending Stays at Historically High Levels in Many OECD Countries,” a report published in 2016 by the Organization for Economic Cooperation and Development (OECD). The ranking is based on preliminary 2016 estimates. The latest year of official expenditure data for OECD nations is 2013. Supplementary data from the OECD, including public spending for old-age support programs, health-related programs, family spending, incapacity, and labor market programs as a percentage of GDP are for 2013 — also the latest year for which detailed data are available. GDP (PPP), and GDP per capita is from the International Monetary Fund (IMF).
These are the countries with the world’s most generous social welfare programs.

10. Norway
> Public spending as pct. of GDP: 25.1%
> GDP per capita: $67,429
> Poverty rate: 7.8%
> Avg. income tax rate: 20.2%
The Norwegian government spends the equivalent of 25.1% of national GDP on public social programs, the 10th highest of any country and higher than the average of 21,0% across all OECD member nations. The Norwegian welfare system is funded in part by heavy taxation. The average Norwegian pays 20.2% of their income in taxes, the seventh highest income tax rate in the OECD.
[in-text-ad]
Approximately one-quarter of public social benefits spending in Norway goes to the bottom 20% of earners in the country, a larger share than a majority of OECD nations. The substantial redistribution of wealth and cash assistance received by Norway’s low-income households likely helps to reduce income inequality and poverty in the country. Norway has the fifth lowest level of income inequality among working-age residents in the OECD, and the nation’s 7.8% poverty rate is also the fifth lowest.

9. Germany
> Public spending as pct. of GDP: 25.3%
> GDP per capita: $46,347
> Poverty rate: 9.1%
> Avg. income tax rate: 19.2%
For some countries public expenditure as a percentage of GDP rose during the Global Financial Crisis. The increases were due largely not to spending surges but to weak economic growth or even contractions. The opposite is true for Germany, where GDP expanded by 39.7% over the decade through 2014. The German economy is third largest in the OECD, and per capita GDP is $46,347, ninth highest of countries reviewed.
Compared with other broad social policy areas, old age-related public spending accounts for by far the largest share of expenditures across the OECD and this is especially the case in Germany. Old-age support programs account for over 10% of expenditures in Germany, versus the OECD average of 8.7%. Elderly Germans also make up 21.4% of the population, second highest after only Japan. This partially explains the country’s large public social expenditure.

8. Greece
> Public spending as pct. of GDP: 27.0%
> GDP per capita: $26,006
> Poverty rate: 15.1%
> Avg. income tax rate: 8.8%
Greece was slammed by the financial crisis and continues to struggle today. In the first quarter of 2015, Greece’s unemployment rate exceeded 25%, the highest in Europe and well above the EU average jobless rate of 9.8%. Greece’s social public expenditure as a percentage of its GDP, which was lower than the OECD average in 1990, is today considerably higher. However, this is primarily due to GDP contractions rather than increased spending — spending has actually fallen in recent years. While like every other country in Europe Greece’s economy has expanded since 1990 until last decade’s global recession, Greece’s GDP dropped by $52 billion from 2009 — the only OECD country that has yet to return to pre-recession GDP levels. While the average annual spending on all forms of Greek public social programs increased from 2005 through 2009, most forms of public expenditure fell over the following years from 2010 through 2014.

7. Sweden
> Public spending as pct. of GDP: 27.1%
> GDP per capita: $46,256
> Poverty rate: 8.8%
> Avg. income tax rate: 17.7%
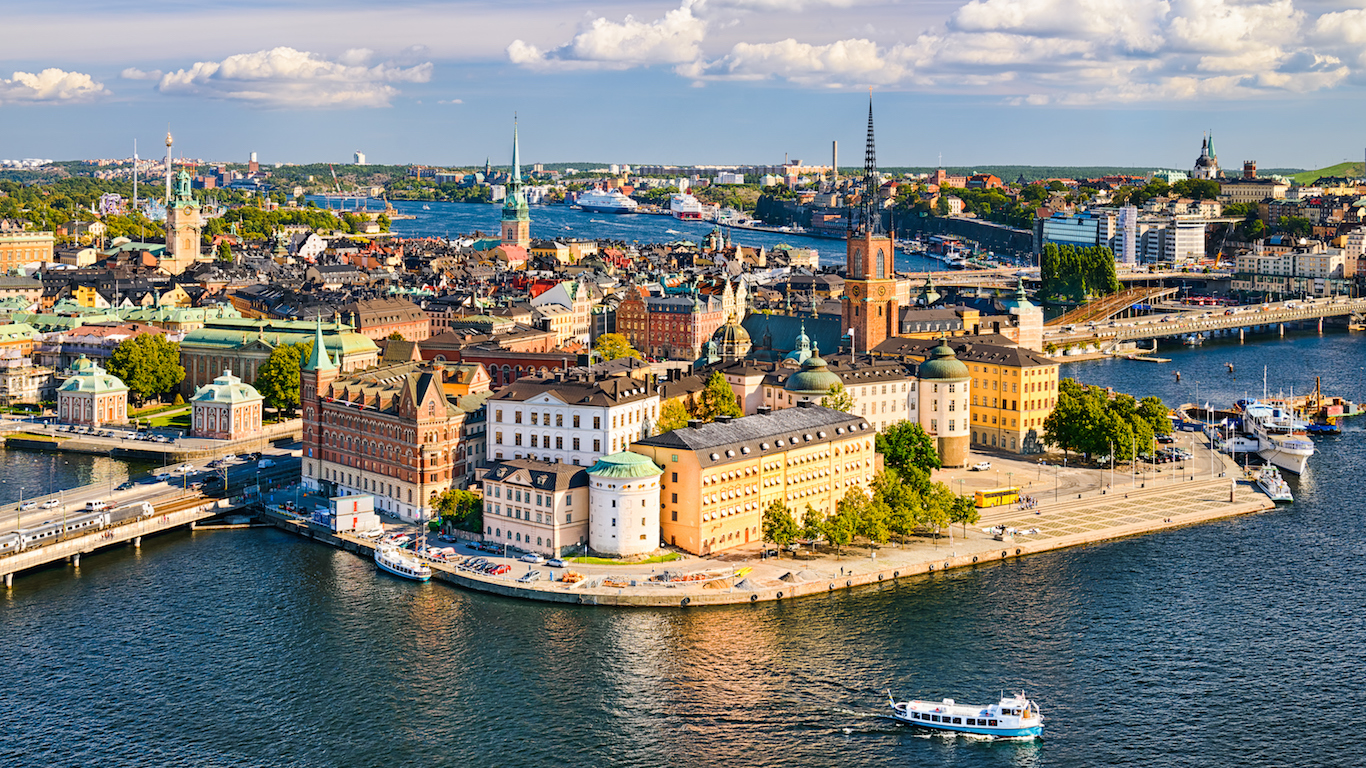
Like other Scandinavian nations, Sweden’s total public spending is among the highest in the world relative to the size of the country’s economy. Social spending includes programs devoted to the welfare of the elderly. For most countries that spend a large share of GDP on social programs, senior citizens-related programs represent the largest expense, followed by health-related spending. This is the case in Sweden as well, where old age spending is equivalent to 10% of the country’s GDP, while health spending comes to 6.6% of GDP. However, unlike some of the nations on this list, Sweden also spends a disproportionately high 4.3% of its GDP on the disabled, the second highest share of any OECD nation and more than double the OECD average of 2.1% of GDP. On the whole, in part due to higher spending on families as well as the disabled, about 32% of social spending goes directly to poor, working-age residents, much higher than the 23.1% OECD average.
[in-text-ad]

6. Austria
> Public spending as pct. of GDP: 27.8%
> GDP per capita: $46,504
> Poverty rate: 9.0%
> Avg. income tax rate: 16.8%
Old age spending accounts for 8.7% of total GDP expenditure across the OECD. Next highest is health spending, at 6.0% of GDP. In some of the countries spending the most on social programs, spending on the elderly is even higher. Although in Austria social spending has increased less than in most OECD nations over the last decade, 14.0% of GDP goes to programs for senior citizens, more than double all other major categories of spending combined. In part because of this high old age spending, just 16.7% of the country’s total social outlays go to low-income, working-age residents. While Austria has one of the most generous old age pension systems in the world, it does not appear to be distributed based on income needs. Just 9.1% of the country’s total social expenditure goes to low-income elderly residents, the second lowest share in the OECD.

5. Denmark
> Public spending as pct. of GDP: 28.7%
> GDP per capita: $45,054
> Poverty rate: 5.4%
> Avg. income tax rate: 36.1%
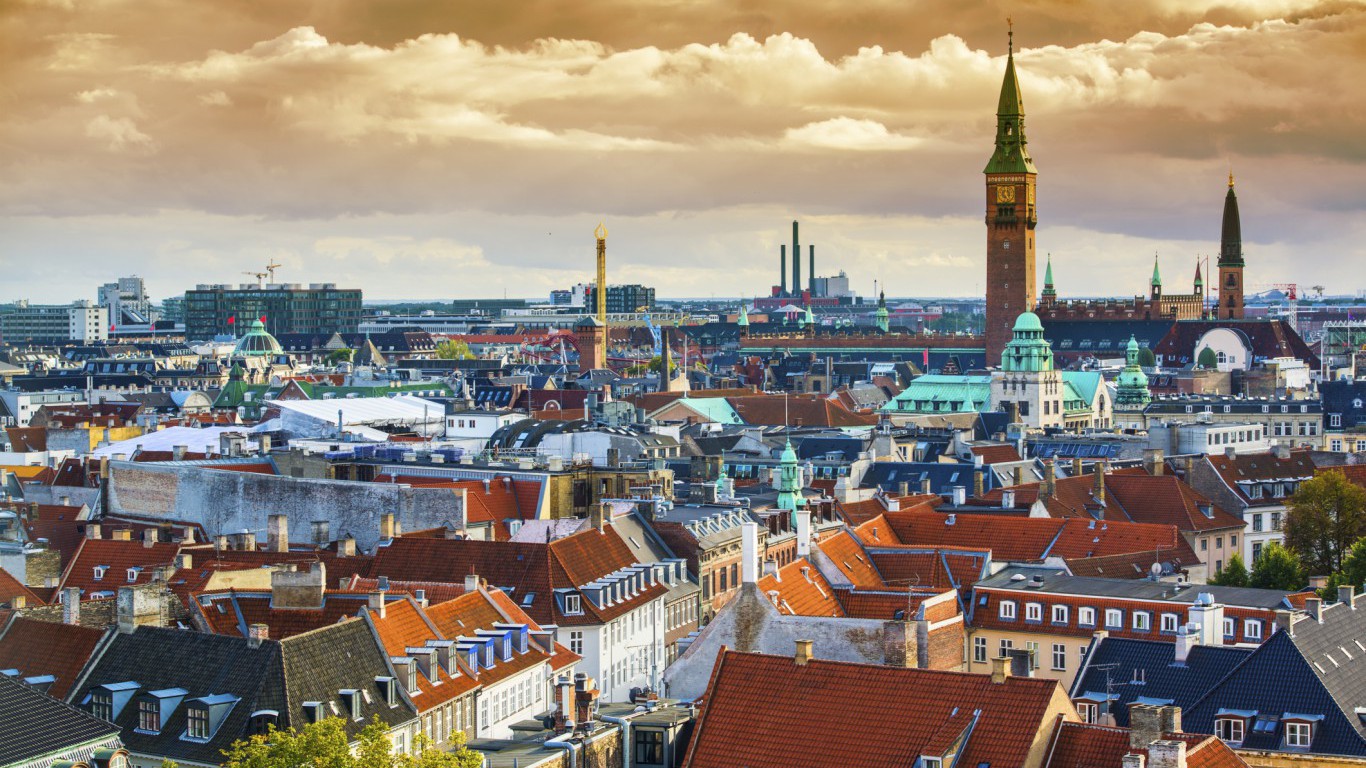
Denmark’s average income tax rate of 36.1% is the highest of all OECD countries, which helps explain the country’s ability to provide extremely generous social programs. Across the OECD, the largest share of public social spending, 8.7% of GDP, goes to old age-related programs, followed by health-related programs. Some portion of elderly recipients of public resources are low-income country residents. With not only one of the largest, but also one of the most evenly distributed public welfare programs, people with low incomes in Denmark receive relatively large shares of government resources. More than 33% of all transfers go to the bottom 20% of working-age earners, and more than 20% of transfers go to low-income elderly residents, each among the largest such shares in the OECD. Perhaps as a result, Denmark has nearly the lowest poverty rate in the OECD at just 5.4%.

4. Italy
> Public spending as pct. of GDP: 28.9%
> GDP per capita: $35,141
> Poverty rate: 13.3%
> Avg. income tax rate: 21.6%
Public spending on social programs in Italy amount to 28.9% of the country’s GDP, the fourth highest such proportion of any nation in the OECD. Not all residents benefit from the heavy social expenditure, however. Less than 10% of spending on public benefit programs in Italy goes to the bottom fifth of earners in the country, one of the smallest shares in the OECD.
With 21.3% of residents 65 and older, Italy has one of the oldest populations of any high-income nation. Such a large elderly population helps explain the high social public expenditure in Italy. More than 16% of all social expenditure in Italy goes to programs for elderly residents, the second largest share in the OECD and nearly twice the average across all member nations. According to some critics, heavy spending on the elderly has adversely affected younger citizens. With less money to spend on education and job training, Italy’s youth unemployment rate is close to 45%.

3. Belgium
> Public spending as pct. of GDP: 29.0%
> GDP per capita: $43,105
> Poverty rate: 10.0%
> Avg. income tax rate: 28.1%
Belgium spends the equivalent of 4% of GDP on labor programs such as unemployment benefits, highest in the OECD. This is despite the fact that Belgium’s Q1 2015 unemployment rate of 8.9% is only slightly higher than the OECD average jobless rate and below that of the EU. The country also spends relatively high shares of GDP on family benefits, disability, and health spending.
[in-text-ad]
The country is likely able to fund its generous social support system through high tax revenue. The country’s average income tax rate of 28.1% is third highest in the OECD. The U.S. average income tax rate, in comparison, is 18.0%.

2. Finland
> Public spending as pct. of GDP: 30.8%
> GDP per capita: $40,739
> Poverty rate: 6.8%
> Avg. income tax rate: 22.7%
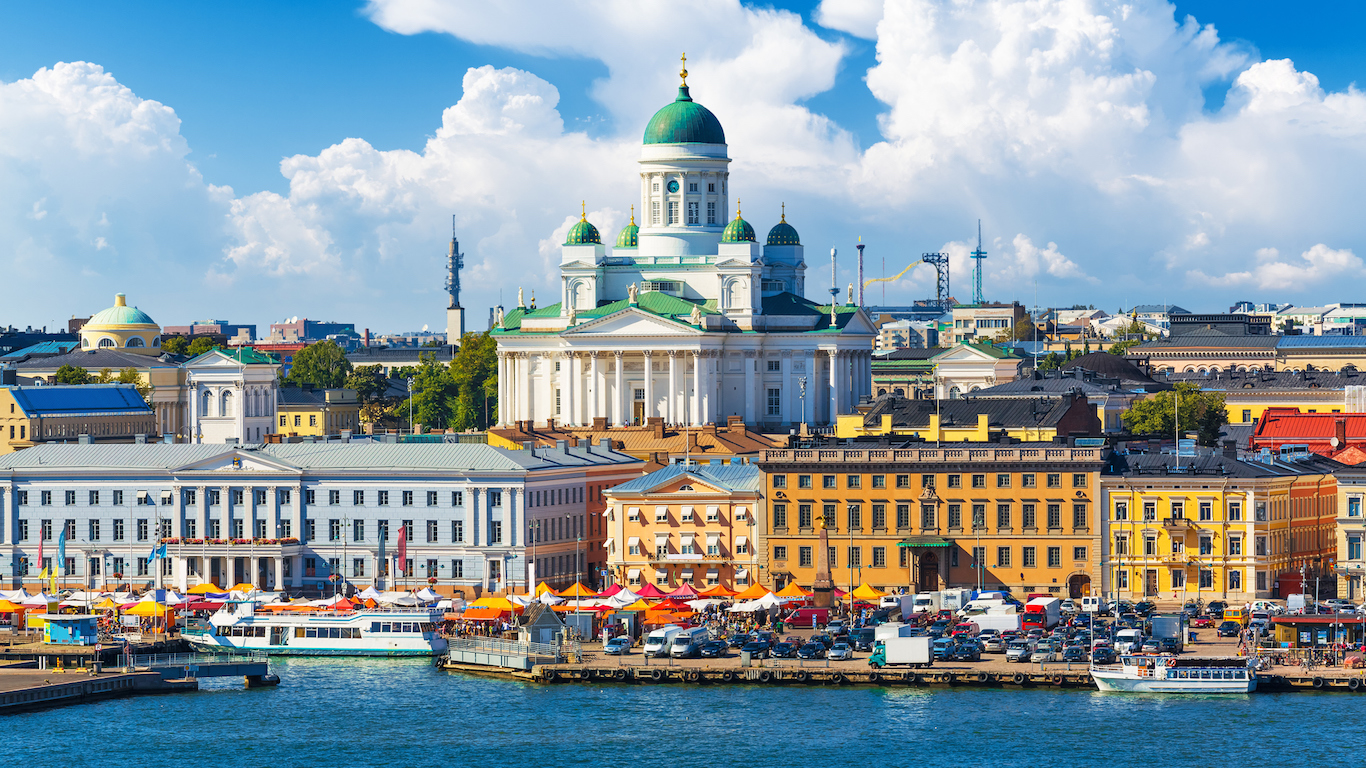
Finland provides what many consider to be the best education system in the world. Perhaps as a testament to the country’s generous social programs, not only do Finnish students frequently report world-leading international test scores, but also the education system is famous for emphasizing equality over excellence.
Elderly Finland residents, particularly lower-income elderly residents, are major recipients of public resources. Elderly Finnish people in the bottom 20% of the income distribution receive 34.4% of annual public transfers, the highest such share of all OECD nations. Country residents 65 and older also make up approximately 20% of the population, the fourth largest proportion of countries reviewed.

1. France
> Public spending as pct. of GDP: 31.5%
> GDP per capita: $40,704
> Poverty rate: 8.0%
> Avg. income tax rate: 14.7%
France’s social security deficit was approximately $22 billion in 2012. According to the French government, policies enacted in recent years, including pension reforms and the promotion of generic medicines, have improved the deficit. Government officials expected in 2015 the deficit to reach a decade low this year.
Despite the cutbacks, France has the most generous social welfare spending, which amounts for 31.5% of its GDP. As is generally the case in Europe and other OECD member nations, the bulk of this spending goes to old-age support programs and health. In France, these policy areas account for 14.3% and 8.6% of GDP, the third and the largest such shares of all OECD member nations, respectively.
Start by taking a quick retirement quiz from SmartAsset that will match you with up to 3 financial advisors that serve your area and beyond in 5 minutes, or less.
Each advisor has been vetted by SmartAsset and is held to a fiduciary standard to act in your best interests.
Here’s how it works:
1. Answer SmartAsset advisor match quiz
2. Review your pre-screened matches at your leisure. Check out the advisors’ profiles.
3. Speak with advisors at no cost to you. Have an introductory call on the phone or introduction in person and choose whom to work with in the future
Thank you for reading! Have some feedback for us?
Contact the 24/7 Wall St. editorial team.