Special Report
The Best and Worst Run States in America: A Survey of All 50

Published:
Last Updated:

Comparing the quality of governance between states can be challenging. The decisions state governors, legislators, city mayors and other elected officials make can have wide-reaching effects on state residents, and these decisions can sometimes take years to have an impact.
Aware of these inherent challenges, 24/7 Wall St. has for seven straight years reviewed the outcomes and conditions of every state in the country, ranking each based on finances as well as social and economic indicators. This year, for the fifth year in a row, North Dakota ranks as the best run state in the country. For the second consecutive year, New Mexico ranks worst.
[in-text-ad]
There is no comprehensive measure of how well or poorly a government runs a state. Our basis for this ranking consists of measures of financial health and fiscal responsibility, as well as socioeconomic outcomes such as unemployment, poverty, and crime — conditions state governments are tasked with managing and improving.
Click here to see the best and worst run states in America: a survey of all 50.
Selecting appropriate criteria to compare 50 states is difficult because governing does not occur in a vacuum. Each state has different populations, obstacles, and means with which to work. Some states are more rural, while others are highly urbanized and densely populated. Some states depend disproportionately on one industry, while economies in other states are more diverse. Some states rely on high-skilled sectors, such as technology and business services, while others are rich in natural resources.
These circumstances can have a meaningful impact on where they rank in our list. North Dakota’s economy, for example, experienced a boom a few years back due to the explosive development of the Bakken shale oil formation. The consequent population and employment growth helped result in extremely low poverty and unemployment rates, and helped propel the state higher in the rankings.
The very resources that help some states can become a burden to those that are overdependent on them. The massive decline in global oil prices from the second half of 2014 through 2015 has taken a serious toll on state oil revenues. Should prices persist at these low levels, the socioeconomic benefits from the oil boom in these states may soon evaporate.
While some states’ economic fortunes are closely tied to the rise and fall of individual industries, which are often outside of the government’s control, each state must make the best of its own situation. Governments, as stewards of their own economies, need to prepare for the worst, including the collapse of a vital industry. Good governance is about balancing tax collection and state expenditure in a way that provides essential services to residents without sacrificing a state’s long-term fiscal health. Setting aside a rainy day fund and not incurring too much debt, for example, are ways to plan for the worst.
For a majority of states, the bulk of government revenue comes from taxes. To ensure a healthy tax base, states can create grants, subsidies, and incentives to encourage the growth of businesses in the region. Some of the best run states on our list have a high share of workers in professional, scientific, and financial jobs, which tend to be higher-paying.
The best run states also have growing populations, with many new residents likely attracted by educational and occupational opportunities. The best run states often attract the wealthiest, most educated residents, and, with the resulting tax revenue, can continue to promote smart economic development.
Click here to read our methodology.
These are the best and worst run states.
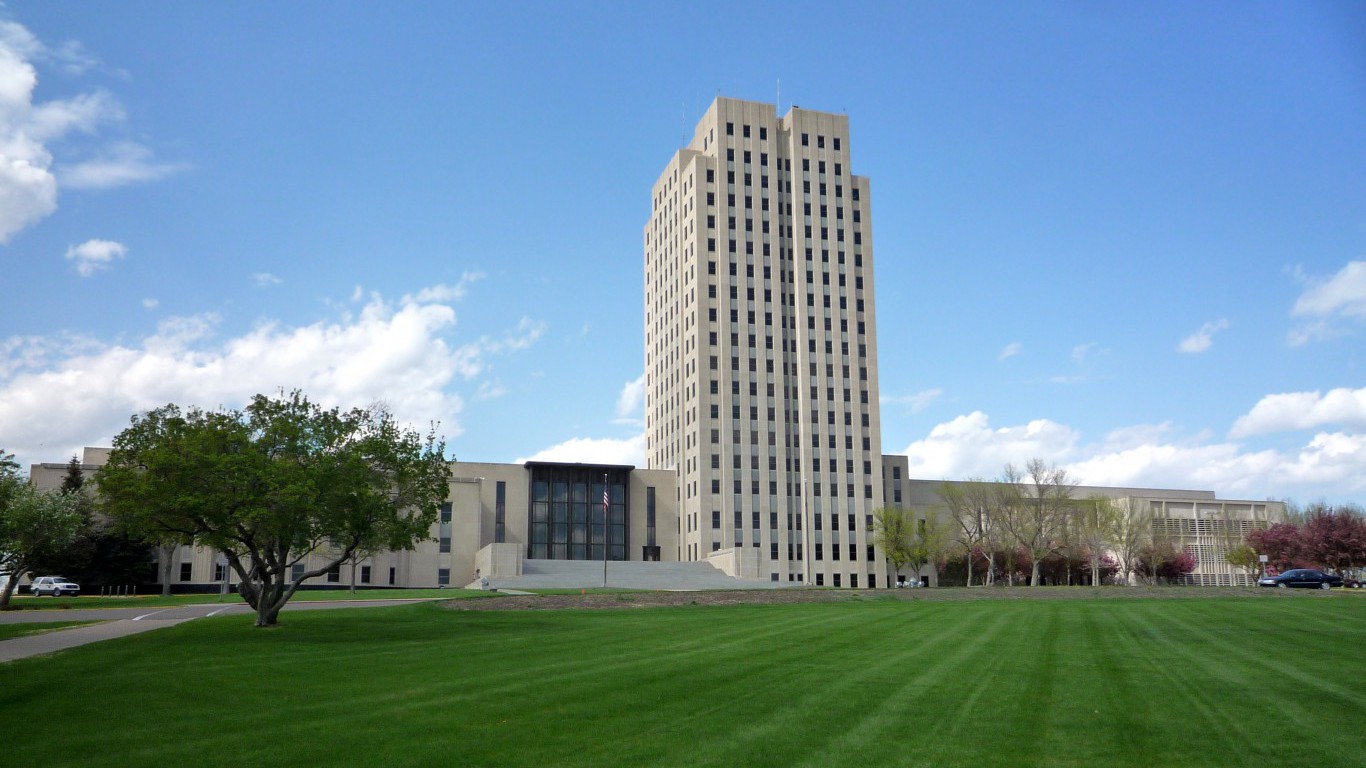
1. North Dakota
> Debt per capita: $2,493 (18th lowest)
> 2015 Unemployment rate: 2.7% (the lowest)
> Credit rating: Aa1/AA+
> Poverty: 11.0% (9th lowest)
North Dakota tops our list of best-run states for the fifth year in a row. While the plunge in oil prices in 2014 was bad news for North Dakota oil companies, rich oil resources continue to stimulate the state’s economy. The unemployment rate remains lower than in any other state, and the median home value in North Dakota surged by 40.7% over the past five years, the largest increase of any state.
[in-text-ad]
Like most of the nation’s best-run states, North Dakota has low debt levels. The state’s total debt was equal to just 18.9% of its 2014 revenue, the fourth lowest percentage of all states. This helps explain the state’s Aa1 rating from Moody’s and its AA+ rating from S&P. Despite its relatively high rating, North Dakota is the only relatively well-run state on our list with a negative outlook from Moody’s. The poor outlook is a reflection of a relatively large budget gap, as well as lack of confidence in future revenue streams. The state’s economy shrank last year by 2.1%, the largest GDP contraction of any state.

2. Minnesota
> Debt per capita: $2,882 (19th lowest)
> 2015 Unemployment rate: 3.7% (tied-7th lowest)
> Credit rating: Aa1/AA+
> Poverty: 10.2% (tied-3rd lowest)
In addition to direct government policy, numerous factors outside of a government’s control can affect a state’s poverty level. Still, economic and social prosperity among a state’s population is a good sign the state is being run relatively well. Minnesota is one such state. The state’s poverty rate of 10.2% is tied for third lowest in the country, and the median household income of $63,488 annually is 12th highest of all states. Also, due in part to Gov. Mark Dayton’s decision to expand Medicaid in 2013, just 4.5% of Minnesotans do not have health insurance, the fourth lowest uninsured rate and less than half the national rate of 9.4%.
The financial well-being of the residents of well-run states also helps increase tax revenue for the state. Minnesota’s tax revenue in its fiscal 2014 totalled $4,213 per capita, higher than all but five other states.

3. Nebraska
> Debt per capita: $1,007 (2nd lowest)
> 2015 Unemployment rate: 3.0% (2nd lowest)
> Credit rating: No GO debt/AAA
> Poverty: 12.6% (19th lowest)
One way to gauge how well a government runs a state is by looking at the state’s finances. Without large revenue streams, a high debt-to-revenue ratio is a bad sign for a state’s ability to fund projects and programs and meet its debt obligations. Nebraska’s debt is equal to just 15.8% of annual revenue, the second lowest such percentage of all states.
Nebraska’s unemployment insurance system is not as friendly as other well-run states. The average weekly payout to claimants of $305 is below the national average. Partially as a result, the average percentage of income that is replaced by the system, at 37.9%, is also relatively low compared with other top states on this list. Despite the less than generous UI system, however, just 3.0% of the state’s labor force was unemployed over the course of 2015, the second lowest jobless rate of all states.

4. Wyoming
> Debt per capita: $1,586 (7th lowest)
> 2015 Unemployment rate: 4.2% (tied-13th lowest)
> Credit rating: No GO debt/AAA
> Poverty: 11.1% (10th lowest)
With a large energy industry, Wyoming is heavily dependent on tax revenues from the sector. As a result, the state’s tax revenue is especially vulnerable to market fluctuations, and its revenue fell with the decline in oil prices. Still, with the largest rainy day fund in the nation, Wyoming is in a relatively strong financial position. Wyoming’s reserve coffers amount to 50% of total annual expenditures, the largest share of any state. While Wyoming is one of two states without a formal law dictating how to spend the fund, lawmakers have recently suggested the reserves be spent to cover the budget shortfalls resulting from lost oil revenues.
The Wyoming government spends $15,797 per student on education, roughly $4,800 more than the national average. Heavy education spending may be one reason for Wyoming’s high educational attainment. An estimated 92.2% of Wyoming adults have at least a high school diploma compared to 87.1% nationwide.

5. Utah
> Debt per capita: $2,446 (17th lowest)
> 2015 Unemployment rate: 3.5% (5th lowest)
> Credit rating: Aaa/AAA
> Poverty: 11.3% (12th lowest)
Utah is the only state in which more than one in three residents is younger than 20 years old. With the highest child-to-adult ratio in the country, Utah’s education system demands more resources than in many other states — and with fewer income earners comprising the tax base. However, while the state’s education budget accounts for a nation-leading 41.2% of total spending, this expenditure is equal to just $6,500 per student, the least of any state.
Utah also has a healthy economy and provides generous unemployment benefits. Just 3.5% of the state’s labor force was out of work in 2015, the fifth lowest unemployment rate of all states. For those who are out of a job, unemployment insurance covers 45.2% of wages on average, one of the highest replacement rates of any state.

6. Iowa
> Debt per capita: $2,031 (11th lowest)
> 2015 Unemployment rate: 3.7% (tied-7th lowest)
> Credit rating: Aaa/AAA
> Poverty: 12.2% (tied-16th lowest)
Based on its reserves and debt levels, Iowa has some of the best fiscal management in the country. The state’s rainy day fund is equal to 10% of total expenditures, more than in a majority of states. Additionally, Iowa’s debt per capita of just $2,031 is approximately $1,500 less than the national average across all states.
[in-text-ad]
Iowa has a healthy economy and provides generous benefits for the unemployed. Just 3.7% of the state’s workforce was unemployed in 2015, one of the lowest annual jobless rates in the country. The average unemployment insurance payment covers 45.2% of wages, the fourth highest replacement rate in the country. Just about one in four unemployment insurance recipients exhaust their allotted benefits before returning to work, far less than in most states.

7. Texas
> Debt per capita: $1,524 (6th lowest)
> 2015 Unemployment rate: 4.5% (18th lowest)
> Credit rating: Aaa/AAA
> Poverty: 15.9% (14th highest)
Over the last half decade, Texas has steadily risen in the ranking of best run states. Ranking 36th in 2010, Texas has climbed quickly over the years and is now ranked seventh.
Rapid population growth is often a bellwether of a well managed state. In the last five years, 1.2 million more people have moved to the Lone Star State than have left, the second largest net migration of any state in the country. The state’s economy accommodated the influx handily. Last year, only 4.5% of the Texas labor force was out of a job, lower than the 5.3% national unemployment rate. The state’s budget also appears well managed and relatively well equipped to weather an economic downturn. It has the highest possible credit rating from Moody’s and S&P. Also, the state has managed to save nearly a fifth of its total expenditures, a larger share of rainy day funds than all but two other states.

8. Colorado
> Debt per capita: $3,103 (22nd lowest)
> 2015 Unemployment rate: 3.9% (10th lowest)
> Credit rating: Aa1/AA
> Poverty: 11.5% (tied-13th lowest)
Over the last five years, Colorado’s population increased by 4.6% from net migration, nearly three times the corresponding national growth rate. Some of the state’s new residents likely relocated there due to favorable job prospects. Just 3.1% of the Colorado labor force was out of work in October, one of the lowest unemployment rates in the country. In addition to the state’s relatively strong job market, the state also provides generous unemployment benefits. The average weekly unemployment check is roughly $400, among the most of any state.
Colorado’s GDP increased by 3.6% in 2015, the fourth most of any state in the country. One reason for the strong economic growth is the state’s legalization of recreational marijuana. The state’s marijuana industry — and its $1 billion in sales last year — generated $135.1 million in taxes, license, and fee revenue for Colorado. Close to one-quarter of the 2015 state marijuana revenue will be spent on school construction projects.

9. Washington
> Debt per capita: $4,407 (12th highest)
> 2015 Unemployment rate: 5.7% (tied-17th highest)
> Credit rating: Aa1/AA+
> Poverty: 12.2% (tied-16th lowest)
Washington’s population has grown by 3.5% from net migration over the last five years, faster than most other states. One pull factor for Washington’s new residents may be the state’s advanced, growing economy. An estimated 12.5% of the Washington workforce is employed in the high-paying professional, scientific, and management field, one of the larger shares nationwide. Washington also has a large wholesale trade sector, in part bolstered by the state’s proximity to Canada and other partners across the Pacific Ocean. Washington ships $12,043 worth of exports per resident, more than any other state. Washington’s GDP grew by 2.9% in 2015, the eighth most nationwide.
While the the state’s 5% October unemployment rate is higher than in most states, out-of-work Washingtonians receive substantial unemployment benefits. The average weekly unemployment check in Washington is $424, more than in all but three other states.

10. Oregon
> Debt per capita: $3,620 (21st highest)
> 2015 Unemployment rate: 5.7% (tied-17th highest)
> Credit rating: Aa1/AA+
> Poverty: 15.4% (tied-17th highest)
Many Oregon residents benefit from the state’s fast-growing economy. Oregon’s GDP grew 4.1% in 2015, more than any other state nationwide. Many of the best-performing companies in the financial and consumer discretionary industries are headquartered in Oregon, including Nike — the top performing stock in the Dow Jones Industrial Average in 2015.
Oregon also has a well balanced budget. It is one of just three states with a fully funded pension, and its $1 billion reserve fund makes up a larger share of its budget than in most states. However, a funded pension may soon come at the expense of other departments. According to the proposed budget for the 2017-19 fiscal period, a bulk of funding for the pension fund will come from local governments in the state. That, and a planned reduction in federal support for Medicaid, will likely shrink the state’s reserve fund.
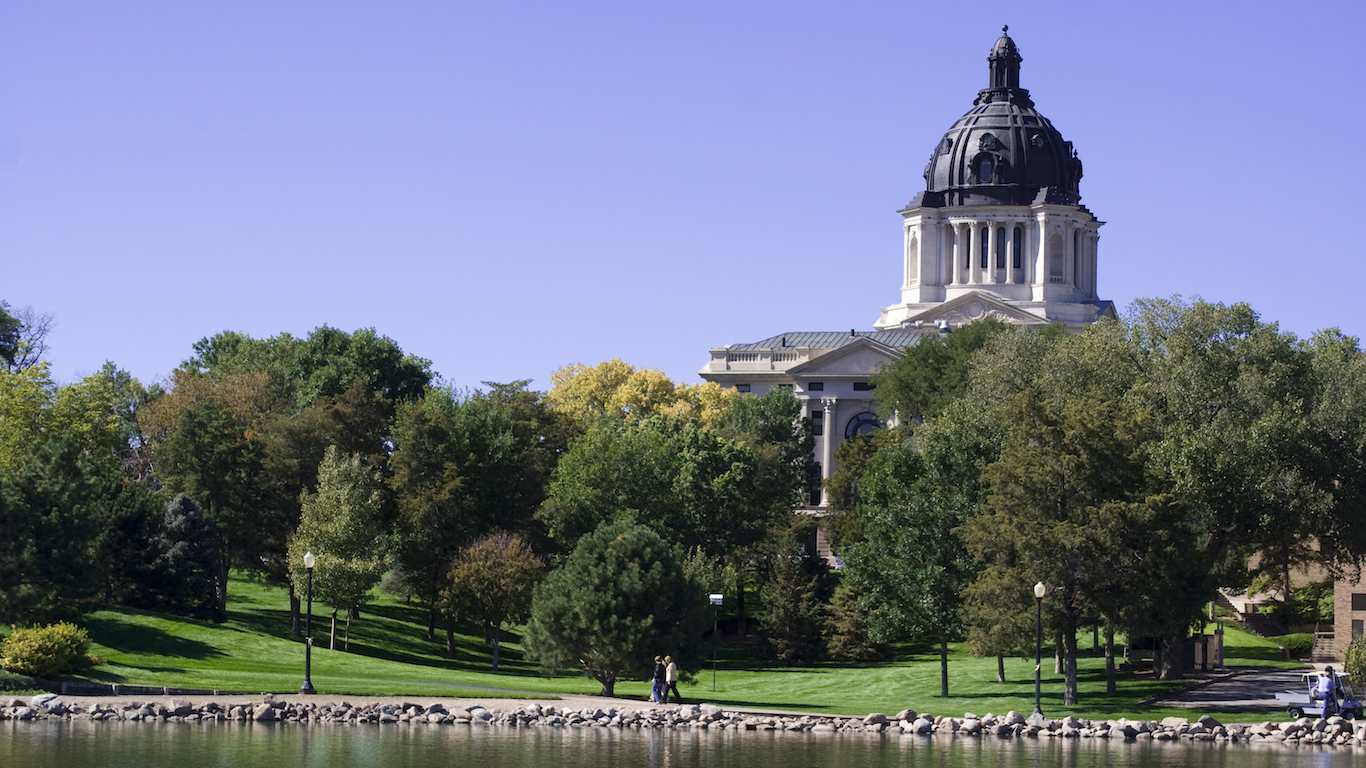
11. South Dakota
> Debt per capita: $3,773 (19th highest)
> 2015 Unemployment rate: 3.1% (3rd lowest)
> Credit rating: Aaa/AAA
> Poverty: 13.7% (24th lowest)
The South Dakota government appears to have a better-managed budget better than nearly any other U.S. state. South Dakota has the most well-funded pension in the country, with funding exceeding pension obligations by 7.3%. The state’s surplus coffers comprise 9.0% of the current annual budget, one of the larger rainy day funds nationwide. Credit ratings agency Moody’s has given South Dakota the highest possible credit rating and a stable outlook. State lawmakers managed to produce a balanced budget despite collecting less revenue than public officials had projected. According to the state’s chief economist, one reason for the low revenue figure was the increased popularity of online shopping. Increased online shopping redirects revenue from brick-and-mortar retailers in the state to retailers in other parts of the country, ultimately decreasing tax revenue for South Dakota.
[in-text-ad]

12. Hawaii
> Debt per capita: $5,886 (8th highest)
> 2015 Unemployment rate: 3.6% (6th lowest)
> Credit rating: Aa1/AA+
> Poverty: 10.6% (7th lowest)
Hawaii is one of the most expensive states to live in. Goods and services cost about 17% more than they do on average across the United States. As is often the case in parts of the country that require higher incomes to offset the higher cost of living, Hawaii is home to one of the most affluent populations in the country. The typical household earns $73,486 a year, second most in the country.
The state’s high incomes likely lead to high tax revenue. Hawaii’s tax revenue of $4,214 per capita in fiscal 2014 was fifth highest of any state. However, even with substantial tax revenues, the state has only funded about 64% of its total pension obligations, less than in the majority of states. As of the current fiscal year, the state’s accumulated rainy day fund only amounts to 2.8% of the state’s budget, less than half the average across all states.

13. Delaware
> Debt per capita: $5,660 (9th highest)
> 2015 Unemployment rate: 4.9% (tied-21st lowest)
> Credit rating: Aaa/AAA
> Poverty: 12.4% (18th lowest)
The Delaware population increased by 3.4% from net migration over the last five years, twice the corresponding national growth rate. The state of Delaware’s economy may be one attraction to incoming residents. Delaware’s GDP of $63,463 per capita is the fifth highest in the country, and export revenue of $5,712 per capita is the seventh highest. State lawmakers have fostered foreign and domestic investment through corporate-friendly tax laws and an easy incorporation process. According to the state, more than half of all U.S. publicly traded companies are incorporated in Delaware. Close to one in 10 members of the Delaware workforce are employed in the finance, insurance, and real estate industry, the largest share of any state.
Delaware is also very well-positioned to meet its pension obligations. The state’s pension is 92.4% funded compared to the 74.8% average across all states.
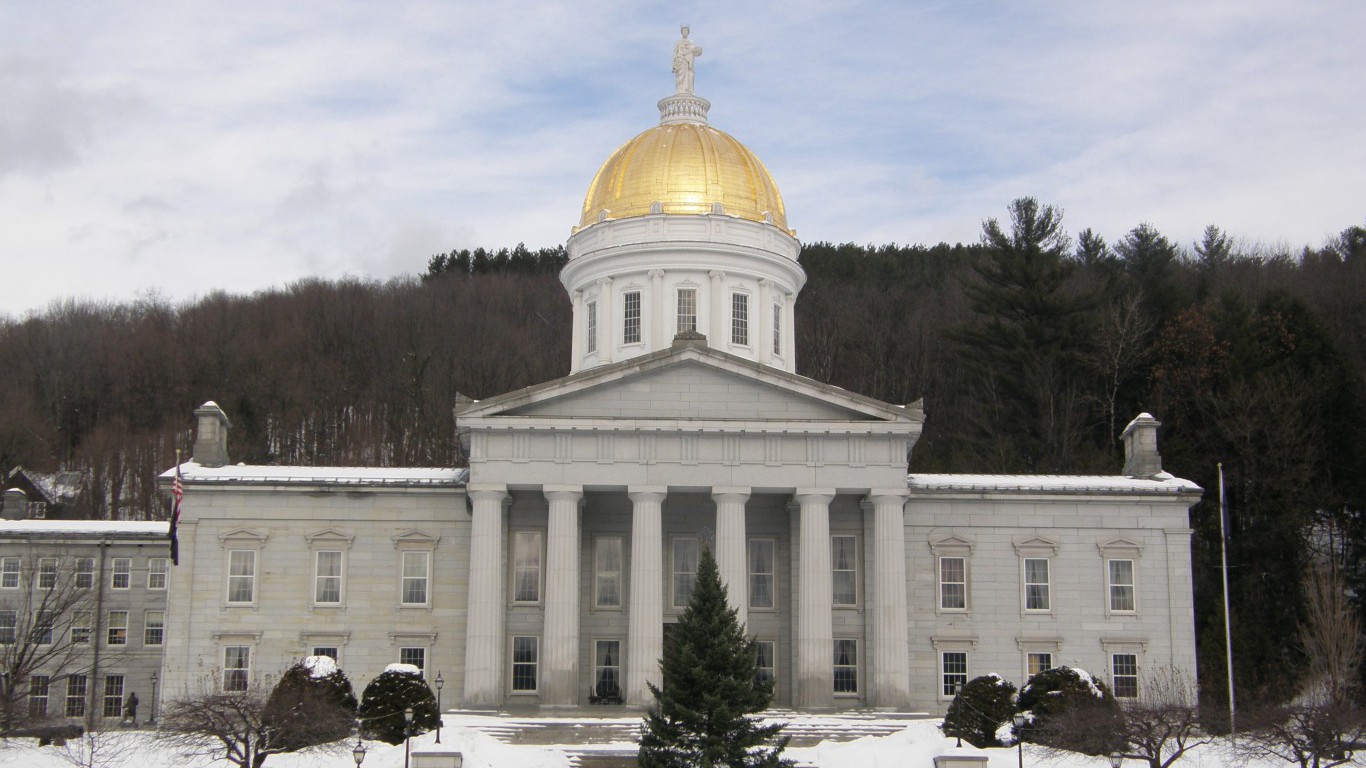
14. Vermont
> Debt per capita: $5,257 (10th highest)
> 2015 Unemployment rate: 3.7% (tied-7th lowest)
> Credit rating: Aaa/AA+
> Poverty: 10.2% (tied-3rd lowest)
Vermont’s housing market is doing well, and residents are far less likely than people in most states to fall into poverty. Just 1 in every 605 state homes are in foreclosure, the fifth lowest foreclosure rate of all states. By contrast, 1 in every 122 housing units nationwide are in foreclosure. And while close to 15% of people nationwide live in poverty, 10.2% of Vermonters earn incomes below the poverty line, tied for third lowest of all states. Vermont also has the lowest incidence of crime in the nation. The 2015 violent and property crime rates, at 118 and 1,406 incidents reported per 100,000 people, are each the lowest of all states.
With an unemployment rate of 3.7% last year, Vermont’s job market is also in relatively good shape. However, while low unemployment often points to a growing population and job market, Vermont has been losing residents to other states. The state’s labor force contracted by 3.8% in the last five years, nearly the largest decline of all states.

15. Idaho
> Debt per capita: $2,179 (13th lowest)
> 2015 Unemployment rate: 4.1% (11th lowest)
> Credit rating: Aa1/AA+
> Poverty: 15.1% (20th highest)
There are more than two children younger than 18 for every five working-age adults in Idaho, the second highest child dependency ratio in the country. This means there are fewer residents earning wages — and more children to educate. Idaho is also fairly rural, which can further strain a state’s ability to educate its children through added transportation costs. Idaho’s education system demands more resources than in many other states. While the state’s education budget accounts for 31.7% of total spending, slightly more than is typical across the nation, this expenditure is equal to just $6,621 per student, the second least of any state.
Idaho lawmakers have managed some components of the budget quite well. The state pension system is 95.2% funded, far more than the 74.8% average across all states. Additionally, the state’s debt totals just $2,179 per resident, roughly $1,400 less than the average across states.
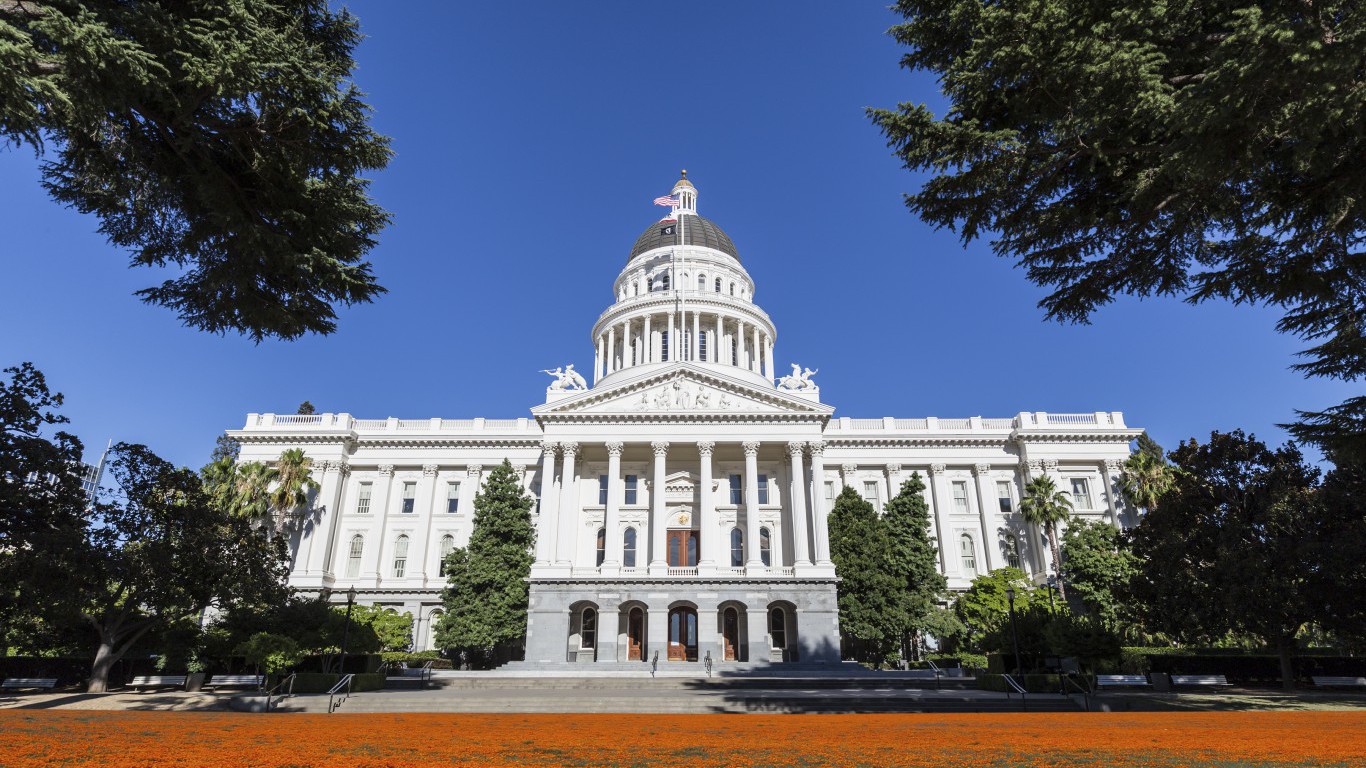
16. California
> Debt per capita: $4,006 (17th highest)
> 2015 Unemployment rate: 6.2% (7th highest)
> Credit rating: Aa3/AA-
> Poverty: 15.3% (19th highest)
California is one of the largest and best performing economies in the country. The state’s GDP of $56,365 per capita is roughly $7,000 greater than the national average. Largely due to innovation in the state’s technology industry, California’s economy grew more than that of any other U.S. state last year. Growing 4.1% in 2015, California’s economy surpassed France and Brazil to become the sixth largest in the world.
[in-text-ad]
Despite the strong economy, California has one of the worst school systems in the nation. Just 82.2% of California adults have graduated from high school, the lowest educational attainment rate in the country. California also spends relatively little on education. The state dedicates 28.0% of its total expenditures to education spending, which amounts to roughly $1,400 less on education per student than the average across all states.

17. Massachusetts
> Debt per capita: $10,926 (the highest)
> 2015 Unemployment rate: 5.0% (tied-23rd lowest)
> Credit rating: Aa1/AA+
> Poverty: 11.5% (tied-13th lowest)
With a wealthy tax base and substantial tax revenue, Massachusetts regularly reports some of the best health and education outcomes of all states. The state spends $15,087 on education per student, about $4,000 more than the national average. An estimated 90.2% of adults have at least a high school diploma, well above the national rate, and 41.5% have at least a bachelor’s degree, the highest of all states. Additionally, just 2.8% of Massachusetts residents do not have health insurance, the lowest uninsured rate in the country.
Heavy spending, however, has saddled the state with debt. State debt is equal to $10,926 per resident, more than three times the average across all states. At the end of last year, Massachusetts was on track to hit its $21.7 billion debt ceiling in the 2017 fiscal year. Citing possible financial instability resulting from the state’s heavy borrowing, S&P recently downgraded its outlook on Massachusetts from stable to negative.
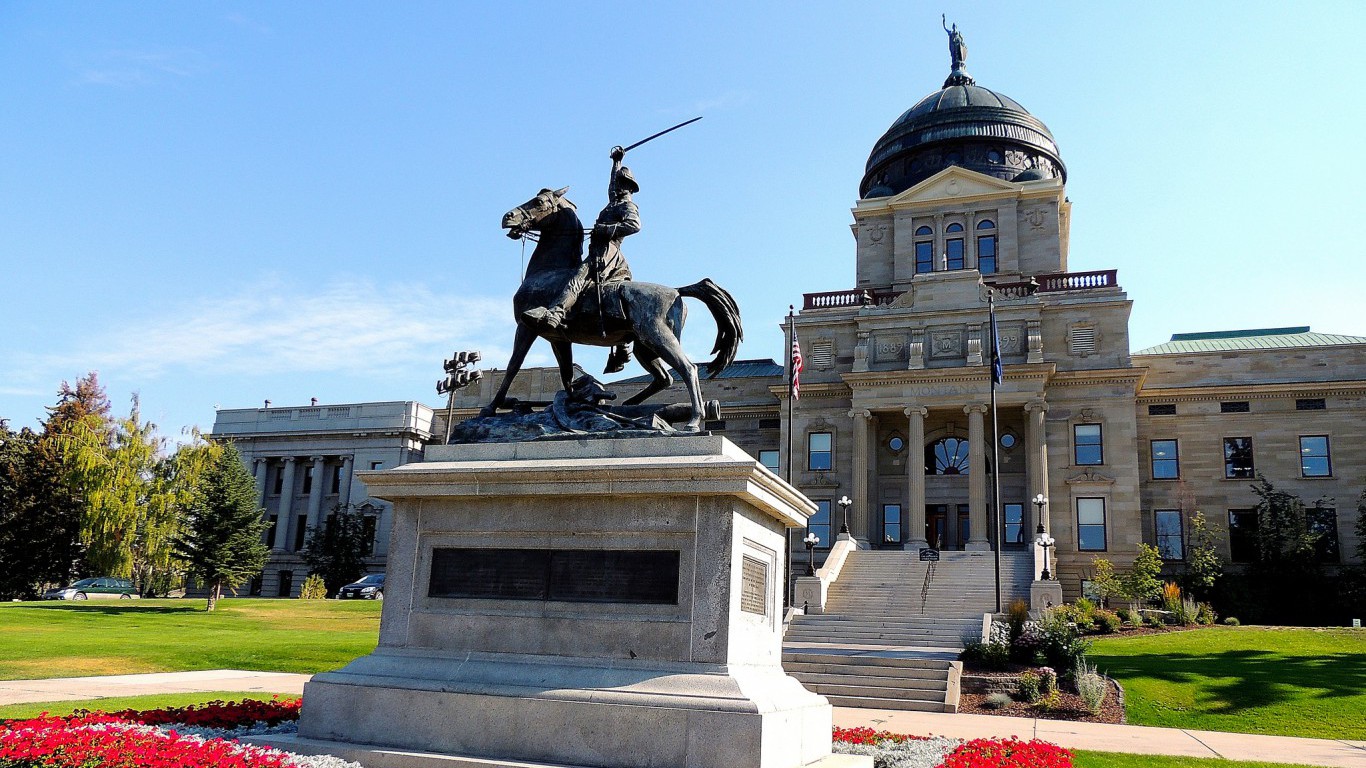
18. Montana
> Debt per capita: $3,294 (25th highest)
> 2015 Unemployment rate: 4.1% (11th lowest)
> Credit rating: Aa1/AA
> Poverty: 14.6% (24th highest)
While Montana still ranks in the upper half of our list, its ranking has fallen compared to years past. Just three years ago, the state ranked 11th best. This year it ranks 18th. One of the factors contributing to the state’s downward trajectory is the state’s rainy day fund, which is now depleted. While the state’s reserves totalled 17.5% of its fiscal 2014 budget, eighth best in the country that year, the state has no reserves for its 2017 fiscal year.
One positive factor is the state’s favorable job environment. The state labor force increased by 4.3% from 2011 through 2015, the fifth largest increase over that time period. Also, the state’s annual unemployment rate of 4.1% is better than a majority of states.

19. Virginia
> Debt per capita: $3,309 (23rd highest)
> 2015 Unemployment rate: 4.4% (tied-16th lowest)
> Credit rating: Aaa/AAA
> Poverty: 11.2% (11th lowest)
Virginia ranks relatively well in a number of socioeconomic measures. Of the state’s adults, 37% have at least a bachelor’s degree, nearly the highest such share of any state. High educational attainment typically correlates with lower crime and unemployment rates and with higher incomes — Virginia is no exception. The state’s violent crime rate is third lowest of all states, and its 2015 annual unemployment rate of 4.4% is nearly a full percentage point below the corresponding national figure. Additionally, Virginia’s 11.2% poverty rate is well below the 14.7% nationwide poverty rate.
However, the state faces certain budget problems. Only about three-quarters of the state pension is funded, and government debt comprises more than half of Virginia’s total revenue. While many states perform better in these measures, Virginia’s reputation of responsible long-term financial planning, among other things, has earned it the highest possible credit rating from Moody’s and S&P.

20. Wisconsin
> Debt per capita: $3,876 (18th highest)
> 2015 Unemployment rate: 4.6% (19th lowest)
> Credit rating: Aa2/AA
> Poverty: 12.1% (15th lowest)
A declining population, particularly when residents are moving out of state, often can be traced to a lack of job opportunities or a low quality of life. Between 2010 and 2015, 14,210 more people moved out of the state than moved in, equivalent to a net population loss of 0.2% over that time. Wisconsin is one of just 14 states with a net negative migration over the last five years. Home values in the state remained effectively stagnant over that time, even as the U.S. median home value increased by 12%. This is likely a product of outbound migration from the state.
One major positive for the state is its apparent fiscal responsibility. Wisconsin is one of just three states with enough assets allocated to fully meet its future pension obligations.
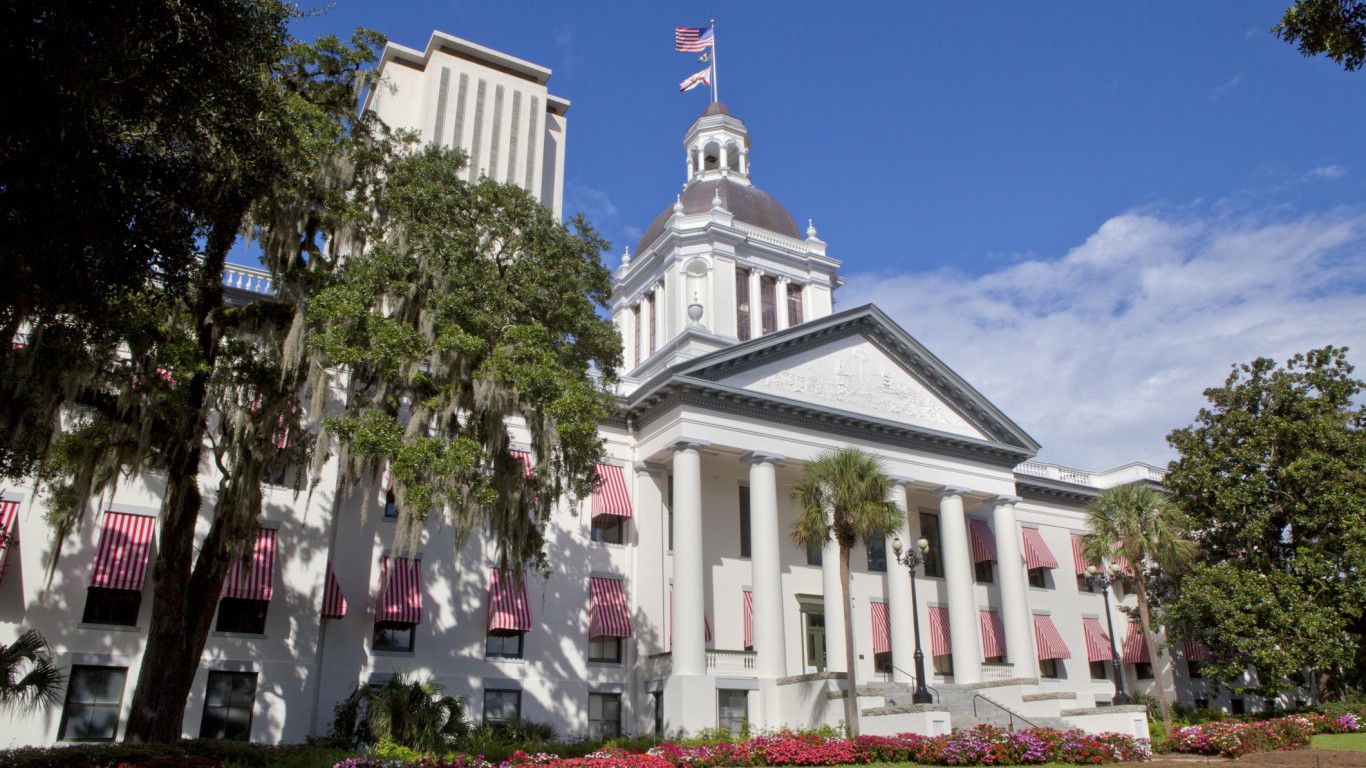
21. Florida
> Debt per capita: $1,793 (9th lowest)
> 2015 Unemployment rate: 5.4% (tied-22nd highest)
> Credit rating: Aa1/AAA
> Poverty: 15.7% (16th highest)
Florida’s population has grown by 6.2% from migration over the last half decade, the largest such growth of all states after only North Dakota. People often move for work, but Florida’s job market is not a likely explanation for the population surge. Rather, population growth is likely due to retirees relocating. The state’s 5.4% annual unemployment rate is slightly worse than the corresponding 5.3% national figure. For many who cannot find work, unemployment insurance benefits are not adequate. Only one in 10 unemployed Floridians receive UI benefits, the smallest share of any state. Additionally, nearly half of those receiving UI benefits exhaust them, nearly the highest share in the country.
[in-text-ad]
Florida’s housing market also faces serious challenges. Hit especially hard by the housing crisis, about 1 in every 56 Florida homes were in foreclosure last year, nearly the largest share in the country.

22. Maryland
> Debt per capita: $4,392 (13th highest)
> 2015 Unemployment rate: 5.2% (tied-25th highest)
> Credit rating: Aaa/AAA
> Poverty: 9.7% (2nd lowest)
Median household income in Maryland is $75,847 a year, more than $20,000 above the typical American household income and the highest among all states. Also, as is often the case in high-income states, Maryland’s poverty rate is low, with just 9.7% of the population living below the poverty line. Unlike many affluent states, Maryland has not leveraged its wealthy tax base into a balanced budget. Among the factors dragging down the state’s rank is the relatively high state debt as well as one of the highest foreclosure rates in the United States. Maryland’s debt amounts to 59.0% of the state’s annual budget, and an estimated 1 in every 62 houses in the state are in foreclosure, more than double the national foreclosure rate.

23. North Carolina
> Debt per capita: $1,778 (8th lowest)
> 2015 Unemployment rate: 5.7% (tied-17th highest)
> Credit rating: Aaa/AAA
> Poverty: 16.4% (12th highest)
The North Carolina pension system is 99.3% funded, the fourth best-met obligation of any state pension program. According to a research report by the right-leaning think tank Mercatus Center of George Mason University, the growing cost of health care in North Carolina may lead to a major shortfall. Researchers found that the cost of Medicaid in North Carolina has tripled since 1970, outpacing the nation as a whole and now comprising more than one-third of the state budget.
An estimated 4.9% of the North Carolina labor force was out of work in October, in line with the average unemployment rate nationwide. As unemployment has declined in recent years, the state has reduced benefits for those out of work. Just 12% of unemployed workers in North Carolina receive unemployment insurance, for example, the smallest share of any state other than Florida.
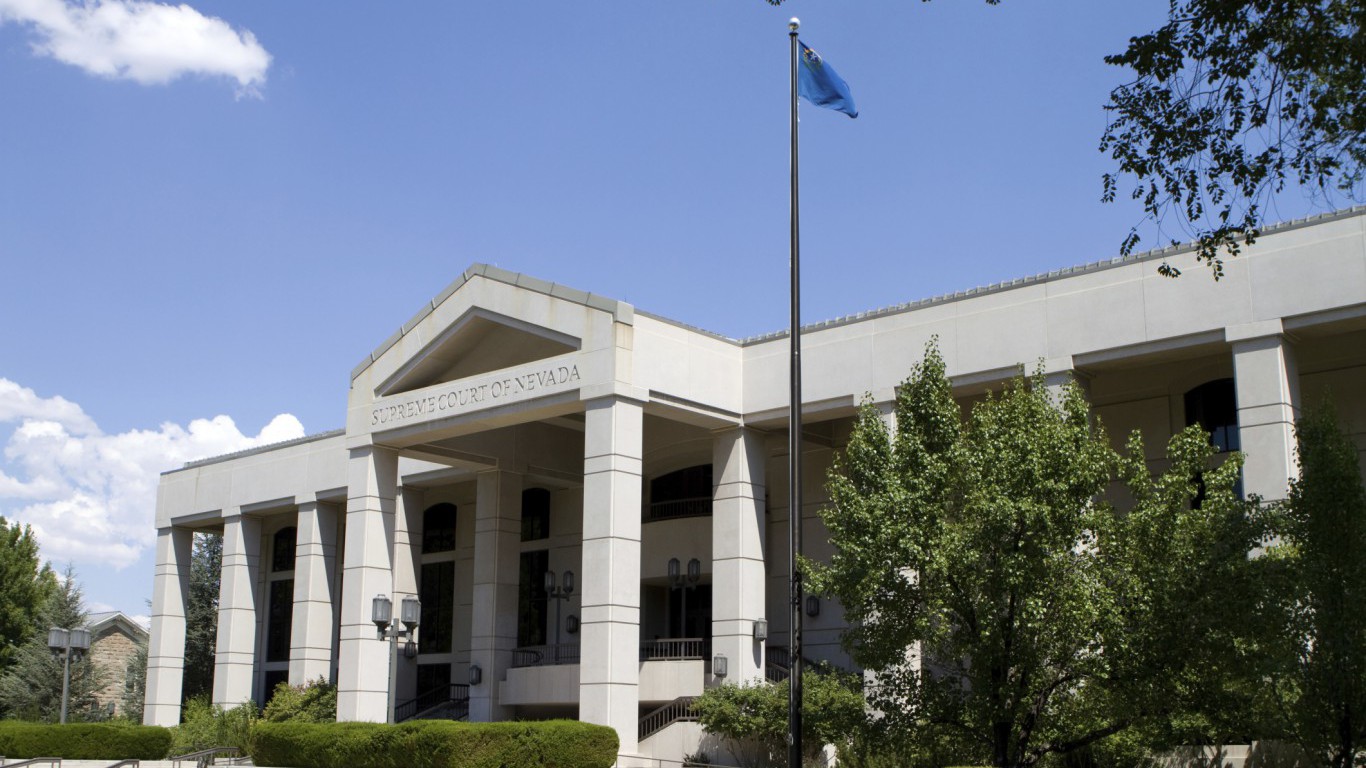
24. Nevada
> Debt per capita: $1,218 (3rd lowest)
> 2015 Unemployment rate: 6.7% (tied-the highest)
> Credit rating: Aa2/AA
> Poverty: 14.7% (23rd highest)
Nevada’s rank on this list has improved dramatically in just a few years. In the 2013 edition, the state ranked 5th worst. This year, the state ranks 24th overall. The improvement is in part due to a rebound in the state’s housing market over the last few years. After falling by more than 50% from 2007 to 2012, the state’s median home value surged by about 40% in the last five years, the second largest increase during that time.
One of the reasons the state ranks about in the middle of this list is its uneven record on budgetary management. On the one hand, the state has among the lowest government debt, at 18.5% of revenue in fiscal 2014. On the other hand, as of the current fiscal year, the state has set no funds aside for economic hardship, one of just six states with no rainy day fund.

25. Michigan
> Debt per capita: $3,177 (24th lowest)
> 2015 Unemployment rate: 5.4% (tied-22nd highest)
> Credit rating: Aa1/AA-
> Poverty: 15.8% (15th highest)
Although Michigan ranks only in the middle of this list, it has improved dramatically from just a few years ago, when it ranked third worst. The better rank is at least partially due to a relative improvement in the state’s housing market. Between 2007 and 2012, the state’s median home value fell by nearly 25%. Over the last five years, it is up by 16.4%, a larger increase than in most states. One criticism of Michigan’s government relates to oversight and handling of corruption. The Center for the Advancement of Public Integrity rated Michigan’s corruption problems worst of any state.
The state also has a history of budget problems. Michigan, with a AA- debt rating from S&P, is one of just nine states to receive less than a AA credit rating. Based on recent state budgets, however, Michigan’s finances are showing some positive signs. The state had an unexpected surplus of more than $570 million this year, due in part to higher than anticipated tax revenues. Michigan’s rainy day fund amounts to 6.3% of the state’s current budget, better than more than 30 states.
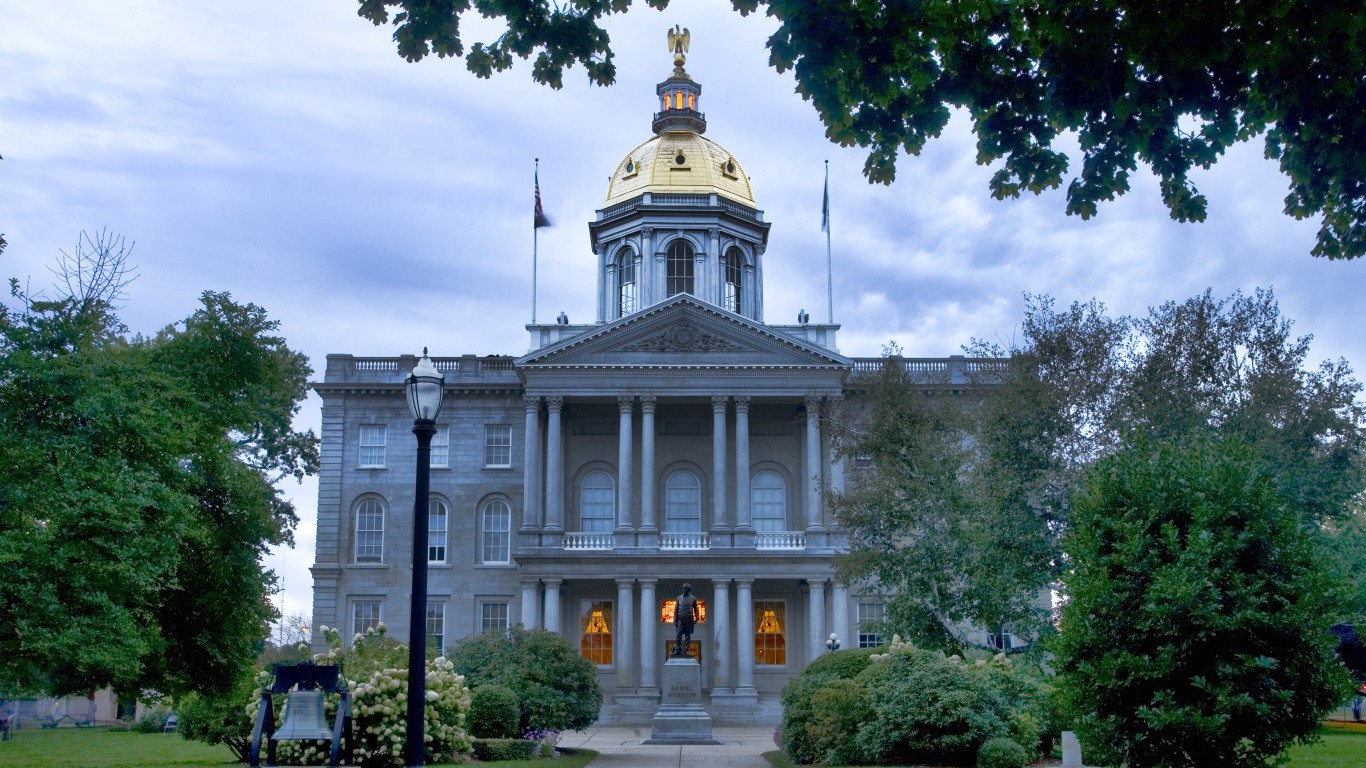
26. New Hampshire
> Debt per capita: $6,087 (7th highest)
> 2015 Unemployment rate: 3.4% (4th lowest)
> Credit rating: Aa1/AA
> Poverty: 8.2% (the lowest)
A low concentration of poverty in a state is often indicative of other positive conditions as poverty tends to correlate with a strong economy, low crime, and high educational attainment. This is certainly the case in New Hampshire, which has the lowest poverty rate in the nation at just 8.2%, much lower than the national rate of 14.7%. New Hampshire also has among the lowest violent crime rates in the country, as well as one of the best high school and college attainment rates among adults.
[in-text-ad]
The state performs less favorably in budgetary management measures. While S&P rates most states’ debt at either a AAA or AA+, New Hampshire’s debt is rated at AA. This is likely due in part to the fact that the state has a relatively high debt load per capita, which in turn could be due to the state collecting relatively little tax revenue per capita. The state also has a rainy day fund of just 1.8% of its expenditures, smaller than the vast majority of states.

27. Georgia
> Debt per capita: $1,310 (4th lowest)
> 2015 Unemployment rate: 5.9% (tied-12th highest)
> Credit rating: Aaa/AAA
> Poverty: 17.0% (9th highest)
Georgia is one of 19 states to refuse to expand Medicaid benefits under the Affordable Care Act. As a direct result, a larger than average share of residents lack health insurance. Nearly 14% of state residents do not have insurance compared to only about 9% of Americans. Since Medicaid’s purpose is to help poorer Americans, many of those without insurance are also likely among the 17% of state residents who live below the poverty line, one of the highest poverty rates of all states. Georgia is also far less generous than most states with unemployment benefits. The state’s $278 average weekly unemployment benefit payout is $56 below the average across all states
While Georgia may lag behind much of the rest of the country in social benefits, it reliably pays its debts. The state has a perfect credit rating from both Moody’s and S&P.

28. Ohio
> Debt per capita: $2,899 (20th lowest)
> 2015 Unemployment rate: 4.9% (tied-21st lowest)
> Credit rating: Aa1/AA+
> Poverty: 14.8% (tied-21nd highest)
A Rust Belt state, Ohio’s economy remains relatively dependent on its manufacturing sector. The industry employs 15.5% of the state’s workforce, the fifth largest manufacturing employment of all states. Hit especially hard by the economic crisis, unemployment peaked in Ohio at 11% in 2010. Today, Ohio’s 4.6% unemployment rate is slightly lower than the 4.9% national rate. Under Gov. John Kasich’s fiscally conservative policies, Ohio’s rainy day fund has increased. The state’s reserves are equal to 5.5% of annual expenditure, more than the majority of states. Additionally, following tax cuts under Kasich’s administration, Ohio’s per capita tax revenue is lower than in the majority of states. While his administration has been praised for fiscal responsibility, others have attributed local budget shortfalls to the governor’s state-level cuts.
Ohio is also one of a minority of states with a negative net migration, as nearly 58,000 more people left than moved in between 2010 and 2015.

29. Indiana
> Debt per capita: $3,191 (25th lowest)
> 2015 Unemployment rate: 4.8% (20th lowest)
> Credit rating: Aaa/AAA
> Poverty: 14.5% (25th highest)
By several important measures, most notably unemployment and poverty, Indiana is faring better on average than the nation as whole. The state does, however, has a housing problem. There was one foreclosure for every 110 homes in the state last year, one of the highest foreclosure rates in the country.
A diversified economy is better equipped to weather economic downturns, and Indiana may be overly dependent on its manufacturing sector. Nearly one in five workers in the state are employed in manufacturing, the largest share of any state in the country.

30. Alaska
> Debt per capita: $8,191 (4th highest)
> 2015 Unemployment rate: 6.5% (5th highest)
> Credit rating: Aa2/AA+
> Poverty: 10.3% (5th lowest)
No state has experienced a more precipitous drop in the rankings than Alaska. Just two years ago, the state ranked seventh overall. It fell to 18th last year, and this year it is 30th best on our list. At the heart of Alaska’s decline is largely what has previously propped it up — the state’s massive petroleum industry.
Alaska collects billions of dollars in oil revenue each year. The state uses these revenues to easily fund state programs as well as pay a dividend of more than $1,000 to every state resident. This payment in turn contributes to Alaska’s high median household income. However, with the recent decline in oil prices, Alaska’s revenue from the industry has plummeted from nearly $10 billion in fiscal 2012 to less than half that in 2015. Last year, the state faced a $3.5 billion budget deficit and the state spent a huge portion of its reserves to cover the shortfall.
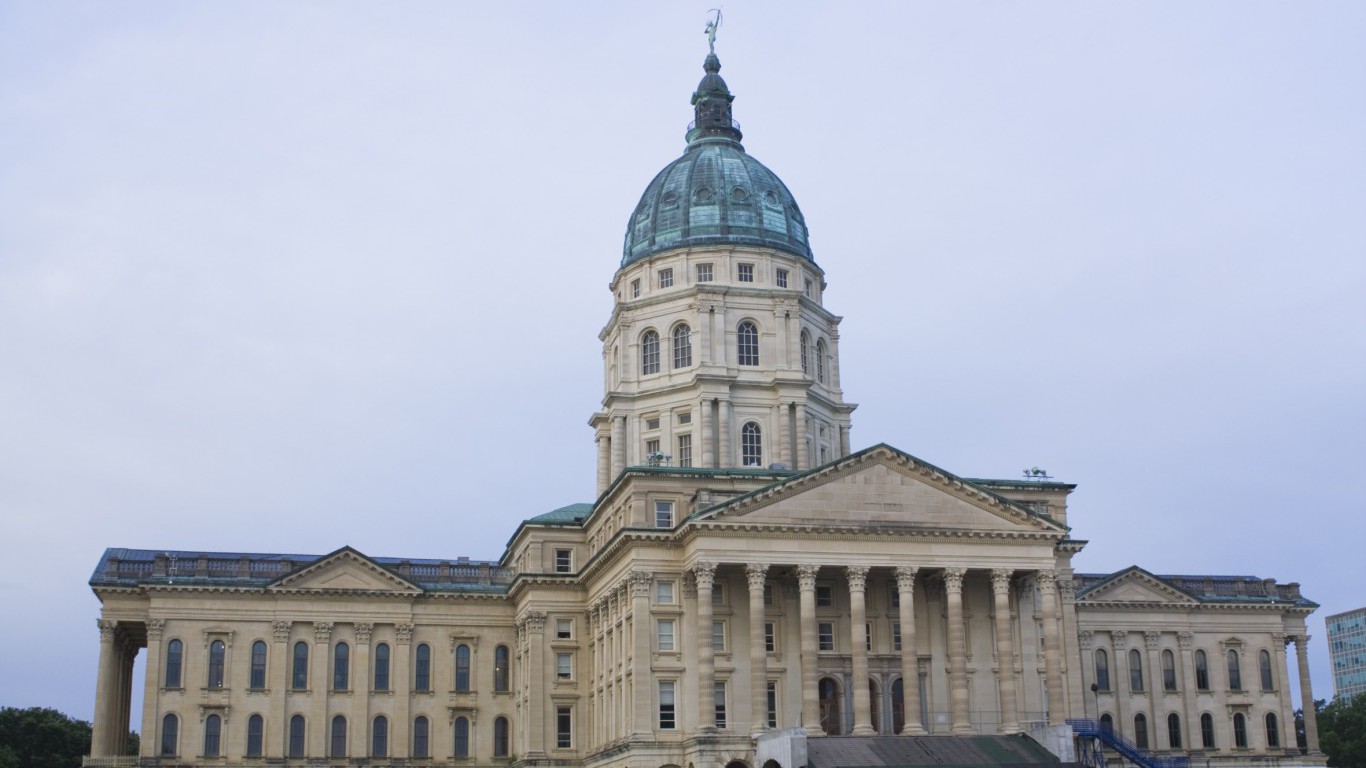
31. Kansas
> Debt per capita: $2,316 (15th lowest)
> 2015 Unemployment rate: 4.2% (tied-13th lowest)
> Credit rating: Aa2/AA-
> Poverty: 13.0% (20th lowest)
For the second time in two years, credit rating agency S&P downgraded Kansas’ credit rating. Only three states now have a lower rating than the AA- grade that S&P has given Kansas. The ratings agency cited the state’s structural budget problems as the primary reason for the downgrade.
[in-text-ad]
Many blame the state’s budget problems on policies implemented by Gov. Sam Brownback, who relied heavily on tax cuts to spur the state economy. Kansas collected an average of $2,519 in tax revenue per capita in 2014, less than the majority of states. Brownback’s cuts have left many services underfunded. Only 67% of the state pension is funded, less than the 75% average across all states.

32. Tennessee
> Debt per capita: $917 (the lowest)
> 2015 Unemployment rate: 5.8% (14th highest)
> Credit rating: Aaa/AAA
> Poverty: 16.7% (10th highest)
Tennessee’s tax revenue is only $1,789 per capita, nearly the lowest of any state in the country. Despite a limited revenue stream, the state has minimal debt and receives top credit ratings from both Moody’s and S&P. Tennessee’s debt of only $917 per capita is the lowest of any state. The state is also one of only a few to have a nearly fully funded pension system.
While the state’s 4.9% unemployment rate is in line with the jobless rate nationwide, unemployed workers in Tennessee likely face greater financial hardship than most unemployed Americans. The average weekly unemployment insurance payment in Tennessee is only $228, nearly the lowest in the country and over $100 less than the national average.

33. New York
> Debt per capita: $6,892 (6th highest)
> 2015 Unemployment rate: 5.3% (23rd highest)
> Credit rating: Aa1/AA+
> Poverty: 15.4% (tied-17th highest)
New York has a long history of corruption, going back as far as the days of Tammany Hall in New York City. Over the past 10 years alone, more than 30 separate lawmakers working in Albany, the state capital, have been fined or jailed for corruption, including former Gov. David Paterson, former Assembly Speaker Sheldon Silver, and former Senate Majority Leader Dean Skelos. Corruption can hinder an government’s effectiveness, but it is impossible to tell the extent to which the state’s integrity issues led to its relatively high government debt as well as the state’s relatively small rainy day fund, equal to just 2.5% of the state’s annual expenditure.
One positive state attribute is the strength of its economic output. The state’s GDP per capita of $63,929 is fourth highest of any state. The typical household has an income of $60,850 a year, compared to a national median household income of $55,775.

34. Oklahoma
> Debt per capita: $2,313 (14th lowest)
> 2015 Unemployment rate: 4.2% (tied-13th lowest)
> Credit rating: Aa2/AA+
> Poverty: 16.1% (13th highest)
Oklahoma’s economy grew by only 1.3% in 2015, considerably slower than the 2.4% national GDP growth over the same time. Unemployment has also risen in the Sooner State. The state’s October 2015 unemployment rate of 4.2% climbed to 4.9% in October 2016.
Following Donald Trump’s electoral victory, the President-elect appointed Oklahoma Gov. Mary Fallin as a vice chair to his transition team. Critics argue the appointment will take Fallin’s attention away from her duties in her home state, specifically pointing to the state’s budget difficulties. During her term as governor, Fallin has slashed tax rates, which resulted in a $1.3 billion budget shortfall. Oklahoma has a less than perfect credit rating and a negative outlook from both S&P and Moody’s.

35. Arizona
> Debt per capita: $2,097 (12th lowest)
> 2015 Unemployment rate: 6.1% (tied-8th highest)
> Credit rating: Aa2/AA
> Poverty: 17.4% (8th highest)
Arizona’s 6.1% annual unemployment rate is nearly the highest in the country. Not only are residents more like to be unemployed than in other other states, but those unemployed workers receive less financial support than in most of the country. The average weekly unemployment insurance payout is only $223, nearly the lowest of any state and well below the $334 national average. In addition, 41% of those receiving unemployment insurance exhaust their benefits before finding a job, a far larger share than is typical.
Despite the state’s problems, conditions in Arizona have improved considerably. Arizona was the third most poorly run state in the country in 2010. It has climbed in the rankings steadily in recent years and now is now ranked higher than it has been in any of the last seven years.
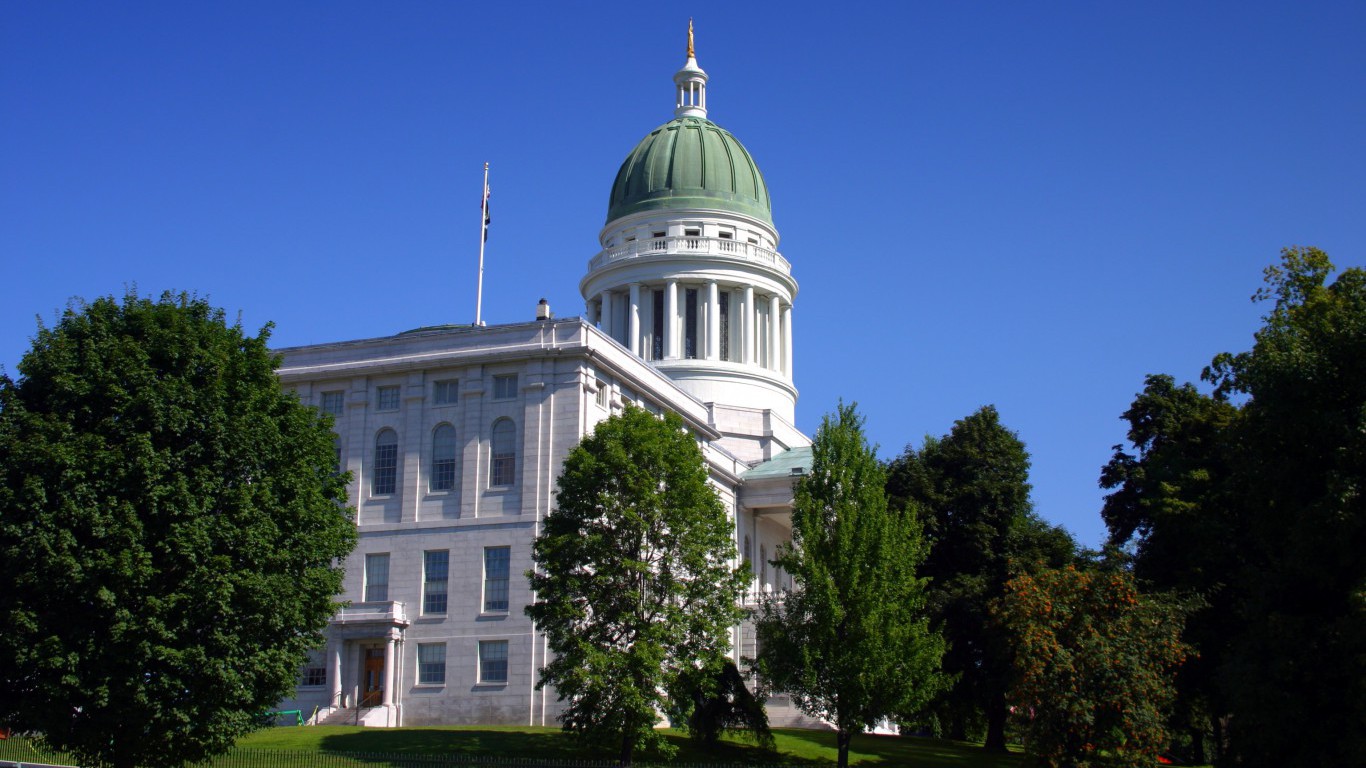
36. Maine
> Debt per capita: $4,118 (15th highest)
> 2015 Unemployment rate: 4.4% (tied-16th lowest)
> Credit rating: Aa2/AA
> Poverty: 13.4% (22nd lowest)
Maine ended its most recent fiscal year with a $93 million budget surplus. State lawmakers rejected Gov. Paul LePage’s proposal to put the majority of the money in the rainy day fund, instead putting it towards benefits for retired state workers and other expenses in the current fiscal year. Maine’s rainy day fund total 3.5% of the state’s annual budget, a far lower share than the 6.2% average across all states.
[in-text-ad]
Economic growth has been slow in Maine. Maine’s GDP increased by less than 0.5 percentage points in 2015, far slower than the 2.4% economic growth nationwide last year.
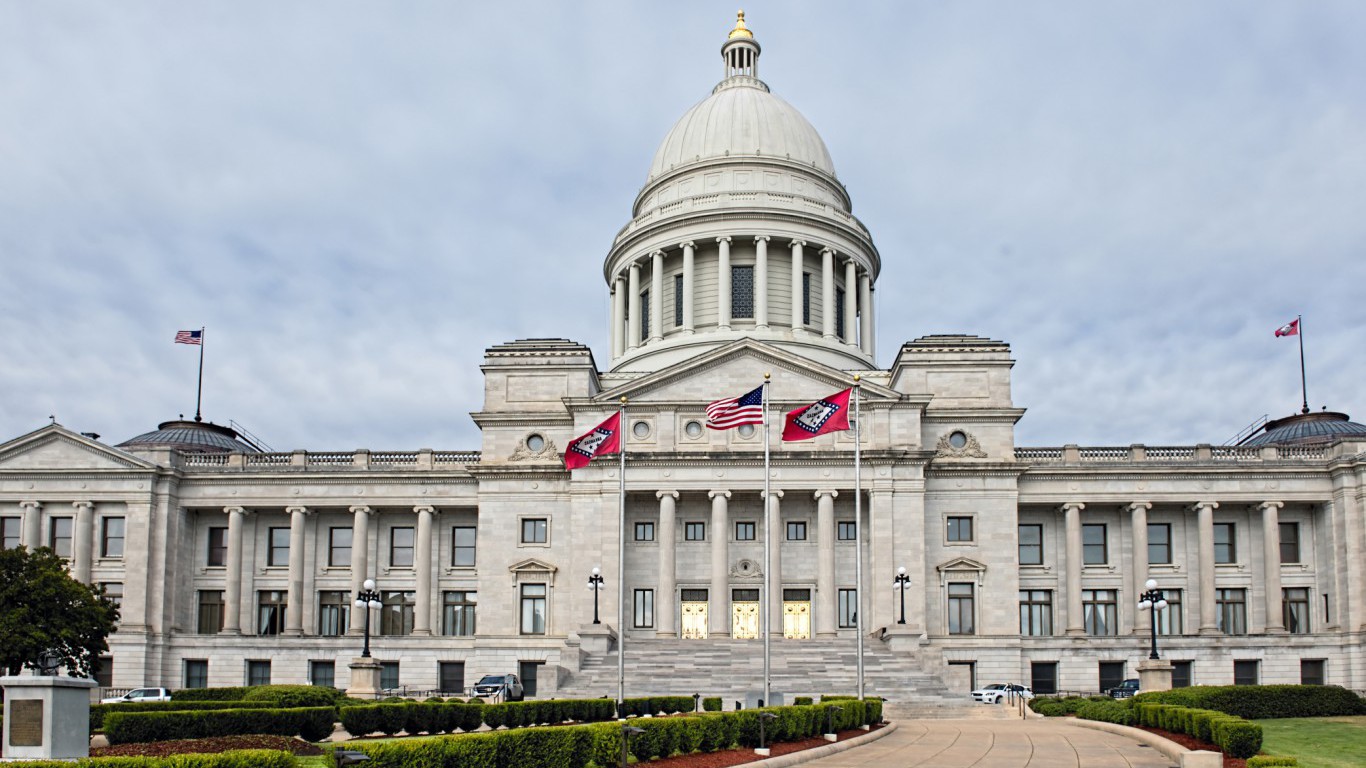
37. Arkansas
> Debt per capita: $1,522 (5th lowest)
> 2015 Unemployment rate: 5.2% (tied-25th highest)
> Credit rating: Aa1/AA
> Poverty: 19.1% (4th highest)
With a median household income of $41,995 a year, Arkansas is the second least wealthy state in the country. Arkansas is also one of just a few states without any reserve coffers. Despite lower resident incomes and limited savings, Arkansas has managed to maintain a fairly balanced budget without amassing large debt. The state’s debt is equivalent to just 19.4% of total revenue, far less than the 48.7% average across all states.
One reason behind the state’s lack of debt is its unique budgeting program, the Revenue Stabilization Act. The system, which allocates spending money to projects of various priorities based on conservative revenue forecasts, has resulted in full funding for all top priority projects in 30 of the past 36 years in the state. The budget process has largely been credited as one of the main reasons why the Arkansas economy remained in good health throughout the Great Recession.
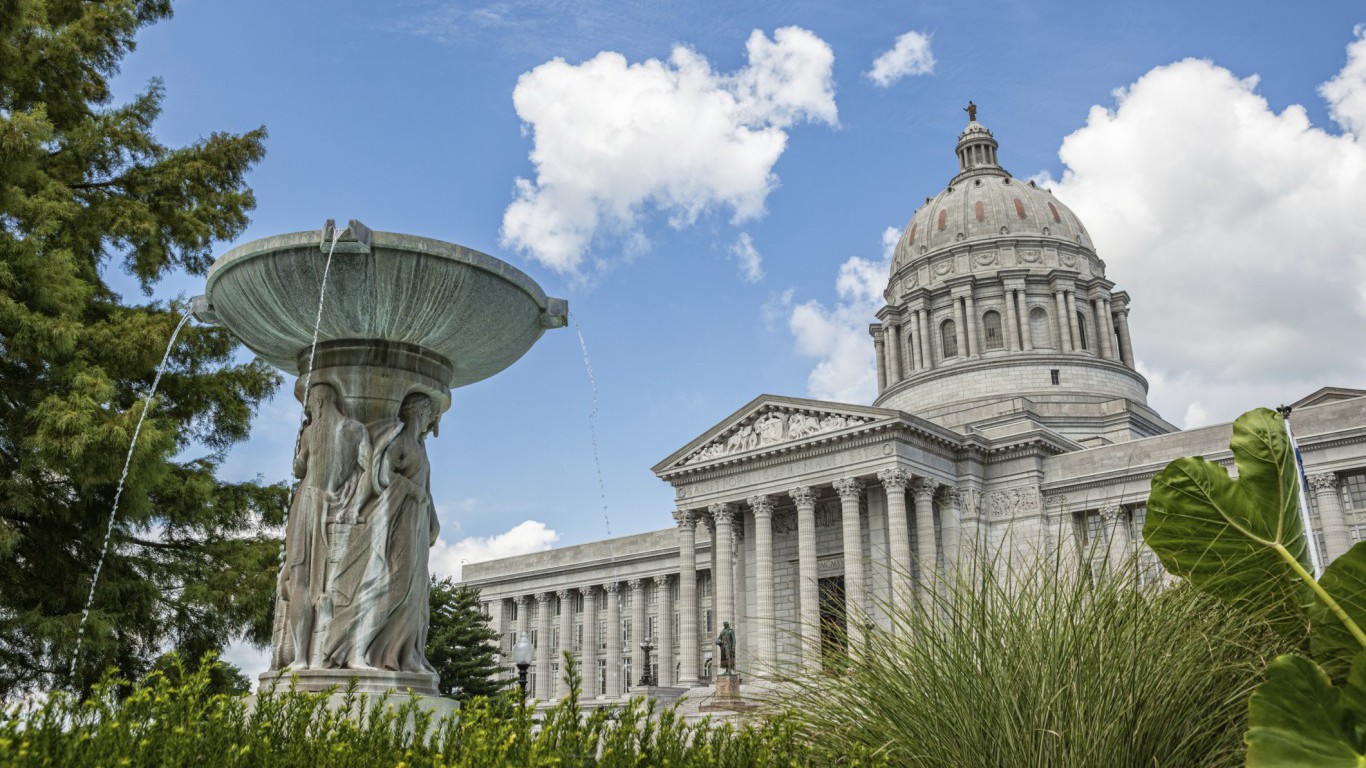
38. Missouri
> Debt per capita: $3,130 (23rd lowest)
> 2015 Unemployment rate: 5.0% (tied-23rd lowest)
> Credit rating: Aaa/AAA
> Poverty: 14.8% (tied-21nd highest)
Missouri is the lowest ranked state with a perfect credit rating from both Moody’s and S&P. Despite the state’s creditworthiness, Missouri has a relatively heavy debt burden, equal to nearly half its total annual revenue, or $3,130 per capita. If Missouri is to meet its debt obligation, it will not likely do so with high tax revenue. The state collects only $1,848 per capita, the sixth lowest per capita tax revenue of all states. Now serving his final term, Missouri’s Gov. Jay Nixon has led the state since taking office in 2009. He is leaving his successor, Gov.-elect Eric Greitens, a $200 million budget shortfall.
Like a number of other states towards the bottom of our ranking, Missouri is not especially safe. Last year, 497 violent crime were reported for every 100,000 state residents, among the highest rates of all states.
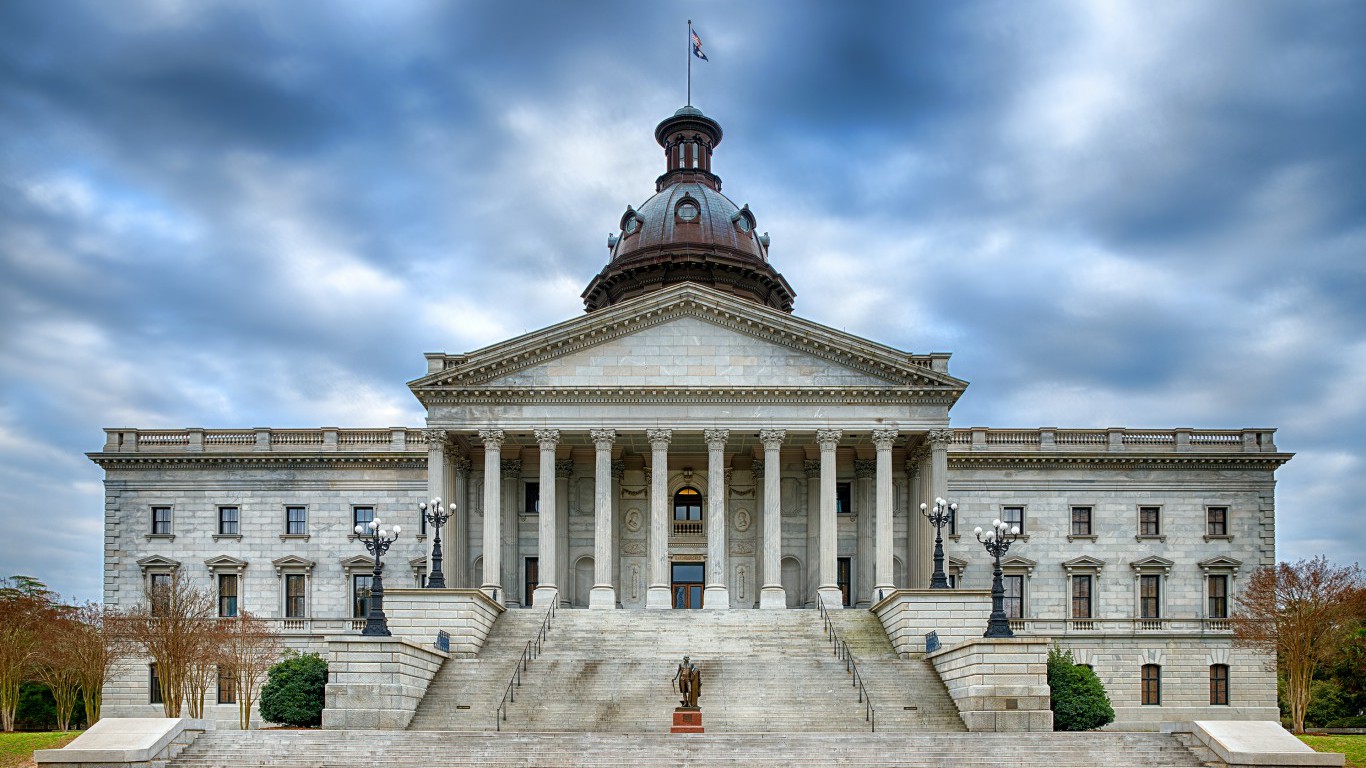
39. South Carolina
> Debt per capita: $3,082 (21st lowest)
> 2015 Unemployment rate: 6.0% (tied-10th highest)
> Credit rating: Aaa/AA+
> Poverty: 16.6% (11th highest)
South Carolina faces several significant socioeconomic challenges. Violent crime and poverty are far more common across the state than is typical nationwide. Additionally, the state’s 6% annual unemployment rate is one of the highest in the country. For South Carolina residents in need of work, conditions are not favorable. Though unemployment has dropped in 2016, South Carolina has one of the least inclusive unemployment insurance programs in the country. Only 13% of jobless workers receive unemployment insurance benefits, well below the 28% average recipiency rate across all states.

40. Connecticut
> Debt per capita: $9,254 (2nd highest)
> 2015 Unemployment rate: 5.6% (tied-19th highest)
> Credit rating: Aa3/AA-
> Poverty: 10.5% (6th lowest)
The typical Connecticut household earns $71,346 annually, the fifth most of any state. Despite a wealthy tax base, Connecticut is able to meet just over half of its pension obligations, a larger funding gap than any state other than Illinois, Kentucky, and New Jersey. The state failed to save cash for its pension from 1930 to 1980, which in turn hindered the government’s ability to capitalize on the stock boom of the 1990s that helped most state pensions reach full funding. Connecticut has since reduced many of the pension benefits for future retirees and has also increased taxes to help cover the budgeting shortfall.
Connecticut’s budget problems extend beyond its pension liabilities. It is one of just four states in which total debt has surpassed annual revenue. It also has one of the smallest rainy day funds of all states. Connecticut’s financial difficulties may continue as its tax base shrinks. The state lost 0.5% of its population to outbound migration over the last five years, among the most of any state.
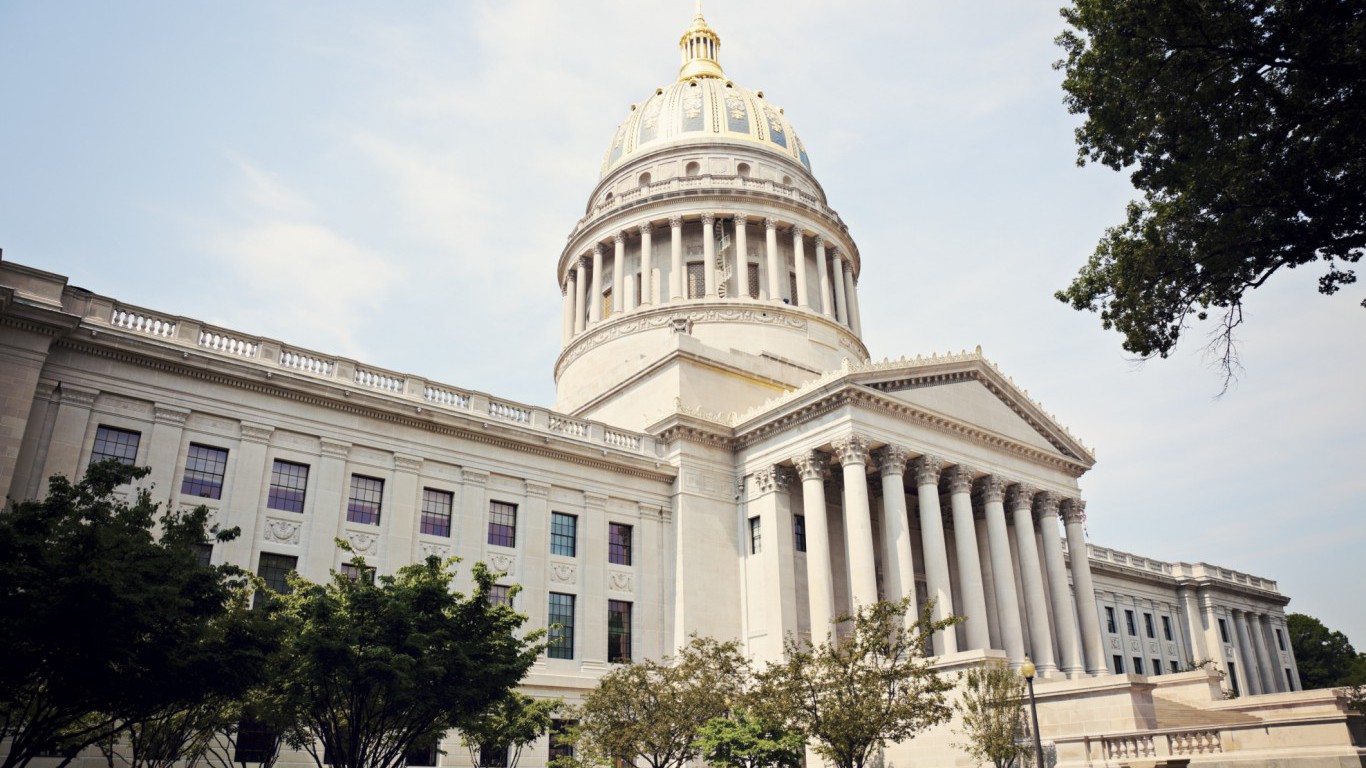
41. West Virginia
> Debt per capita: $4,331 (14th highest)
> 2015 Unemployment rate: 6.7% (tied-the highest)
> Credit rating: Aa1/AA-
> Poverty: 17.9% (7th highest)
Amid declining tax revenue, West Virginia faces an $87 million revenue shortfall. As a result, Gov. Earl Ray Tomblin last month ordered $11 million in spending cuts across the state’s public school districts. Spending cuts underscore a number of the state’s other economic challenges.
West Virginia’s annual unemployment rate of 6.7% is the second highest of all states. A high jobless rate accompanies weak economic growth. Last year, West Virginia’s GDP expanded by 0.1%, the slowest positive growth of any state. Poor economic conditions in the state are not likely to attract highly educated residents. Only 19.6% of adults in West Virginia have at least a bachelor’s degree, the smallest share of any state.

42. Pennsylvania
> Debt per capita: $3,716 (20th highest)
> 2015 Unemployment rate: 5.1% (tied-25th lowest)
> Credit rating: Aa3/AA-
> Poverty: 13.2% (21st lowest)
Pennsylvania’s reserve coffers comprise just 0.2% of the state’s total expenditures for the 2017 fiscal year, nearly the smallest rainy day fund of any state. According to analysis by the Pew Charitable Trusts, Pennsylvania’s rainy day fund could finance the state’s operations for just about three days, less than any state other than Arkansas. Pennsylvania’s pension is also underfunded. The state has just 59.6% of the assets it needs to fund its future pension obligations, the fifth least of any state. Likely due in part to poor fiscal management, Pennsylvania has a AA- rating and a negative outlook from S&P.
Pennsylvania’s labor market is also not doing especially well. The state’s October unemployment rate of 5.4% is up from the same time the year before when unemployment was at 4.8%.

43. New Jersey
> Debt per capita: $7,378 (5th highest)
> 2015 Unemployment rate: 5.6% (tied-19th highest)
> Credit rating: A2/A-
> Poverty: 10.8% (8th lowest)
New Jersey has among the smallest reserve funds of any state. According to analysis by the Pew Charitable Trusts, New Jersey would be able to operate just eight full days with its budget reserves alone, less than a third of the average across all states. New Jersey also has just 42.5% of the assets it needs to meet its future pension obligations, nearly the smallest share of any state. Credit ratings agency S&P recently downgraded New Jersey’s bonds from A to A-, nearly the worst rating in the country. The agency cited the underfunded pension as one of the main reasons for the downgrade as well as the recently announced tax cut.
The tax cuts, which will amount to an estimated $1.4 billion in lost revenue a year by 2021, have been criticized as politically expedient and financially irresponsible as New Jersey struggles to balance its budget. New Jersey’s credit rating has been downgraded 10 times under Gov. Chris Christie, more than any other governor in U.S. history.

44. Louisiana
> Debt per capita: $4,067 (16th highest)
> 2015 Unemployment rate: 6.3% (6th highest)
> Credit rating: Aa3/AA
> Poverty: 19.6% (3rd highest)
With abundant crude oil and natural gas reserves as well as several of the nation’s largest ports, Louisiana’s annual exports totalled $10,530 per capita in 2015, the second highest of all states after Washington. Louisiana is one of the 10 largest crude oil producers in the nation, and more crude oil is shipped to the Louisiana Offshore Oil Port from foreign nations than to any other U.S. port.
Despite the presence and exploitation of natural resources, Louisiana’s population struggles with high poverty, low educational attainment, and high violent crime. Nearly two in every five state residents live in poverty, the third highest poverty rate of all states. Just 84.6% of adults have a high school diploma, and 23.2% have at least a bachelor’s degree, each among the lowest attainment rates of all states. Also, there were 540 violent crimes reported for every 100,000 residents last year, the fifth highest violent crime rate.
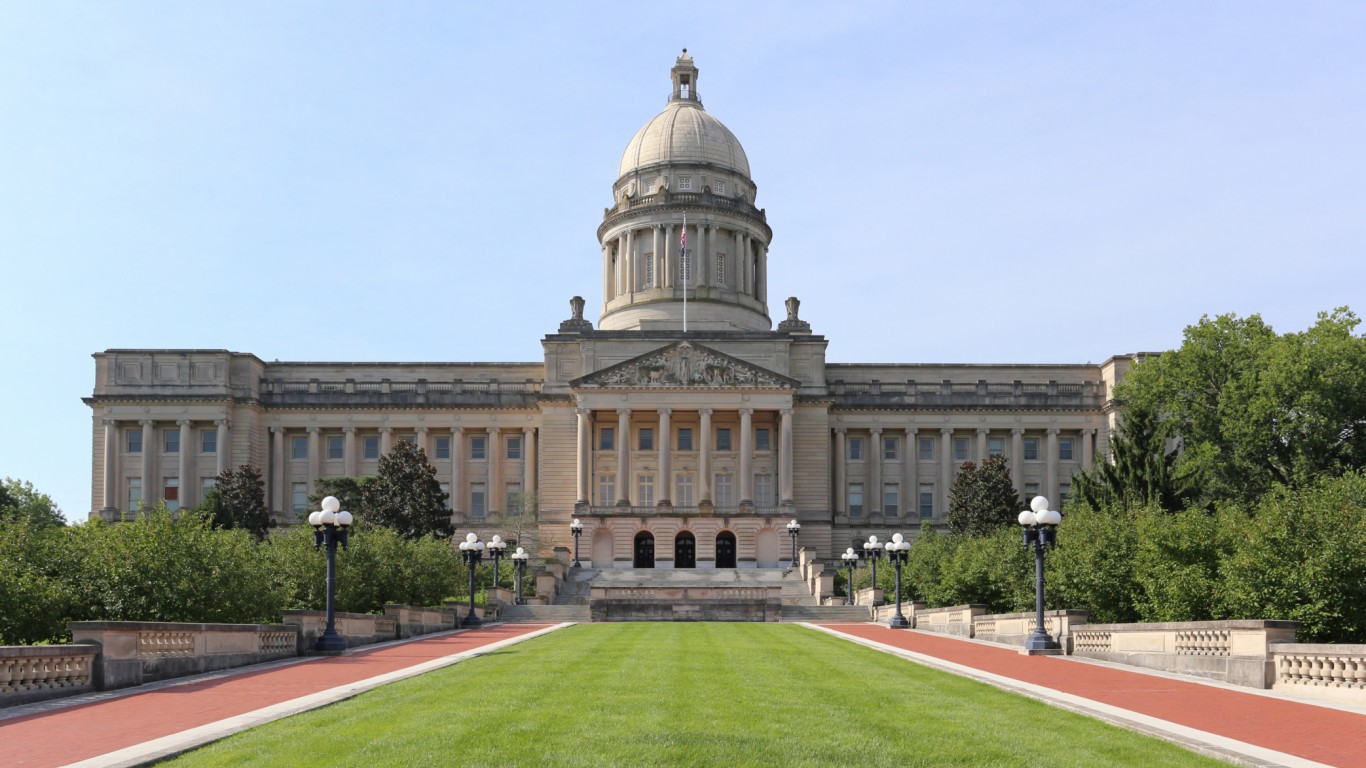
45. Kentucky
> Debt per capita: $3,351 (22nd highest)
> 2015 Unemployment rate: 5.4% (tied-22nd highest)
> Credit rating: Aa2/A+
> Poverty: 18.5% (tied-5th highest)
While Kentucky’s 2015 unemployment rate of 5.4% was in line with the national rate, the state’s labor force shrunk by 5.0% between 2011 and 2015, the second largest labor force contraction of all states. The average unemployment insurance claimant receives benefits for 18.7 weeks, the second longest of all states and an indication that it is difficult to find a job once out of work in Kentucky. Kentuckians are also considerably more likely to live in poverty than people in other states — the state’s poverty rate of 18.5% is tied as the fifth highest.
Based on the state’s foreclosure rate of 1 in every 236 housing units, Kentucky’s housing market is doing relatively well. Home values are low, however. While the median home value in the state grew by 7.8% between 2011 and 2015, this was much less than the national increase of 12.0%. The current median home value of $130,000 remains among the lowest of all states.
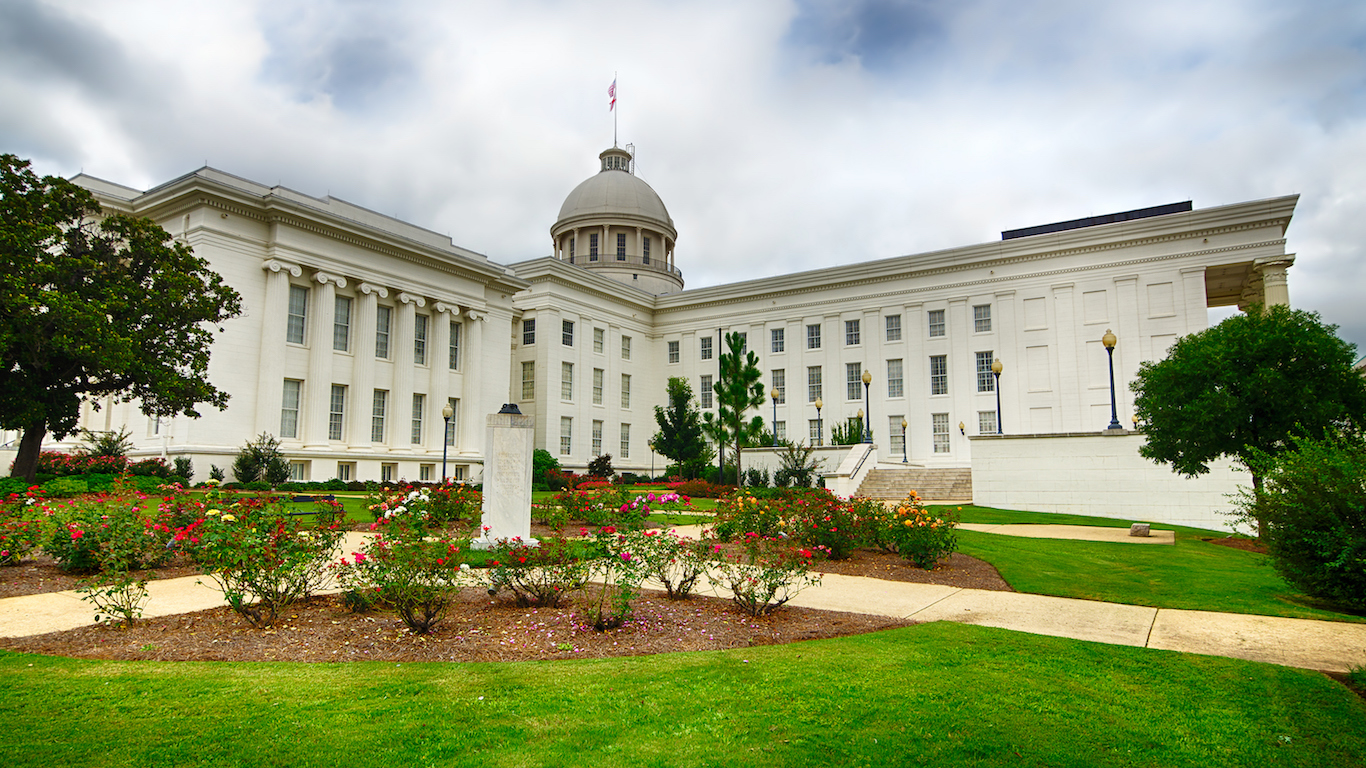
46. Alabama
> Debt per capita: $1,833 (10th lowest)
> 2015 Unemployment rate: 6.1% (tied-8th highest)
> Credit rating: Aa1/AA
> Poverty: 18.5% (tied-5th highest)
One of the poorest states in the country, 18.5% of Alabama residents live in poverty, a far larger share than the 14.7% national poverty rate. With a weak tax base, Alabama’s government has relatively little to work with financially. The state is one of only nine with a per capita tax revenue of less than $2,000. Partially as a result, the state has faced year after year of budget shortfalls. Recently, the Alabama legislature created a budget reform tax force. The 14-member team has been tasked with designing and implementing a long-term plan to solve recurring budget problems.

47. Mississippi
> Debt per capita: $2,374 (16th lowest)
> 2015 Unemployment rate: 6.5% (5th highest)
> Credit rating: Aa2/AA
> Poverty: 22.0% (the highest)
Last year, 6.5% of Mississippi’s workers were unemployed, nearly the worst jobless rate of any state. For most of those in need of a job, social safety nets were not likely adequate. Only 15% of jobless Mississippians receive unemployment insurance benefits, and the average weekly unemployment insurance payout in the state is only $204, the lowest in the country. Financial hardship is common throughout the state — its 22% poverty rate is the highest in the country. Mississippi’s job market has likely been hindered by slow growth. The state’s total economic output increased by only 0.7% in 2015, far less than half the 2.4% growth rate nationwide.
While the connection between school spending and educational outcomes is complex, educational spending is effectively an investment in the future. Though Mississippi currently only spends 27.5% of its budget on education, slightly less than is typical, its priorities may be shifting. Gov. Phil Bryant has stated his new budget will include spending cuts across state programs, but he has also indicated his intention to increase funding for K-12 education by $16.4 million.

48. Rhode Island
> Debt per capita: $8,888 (3rd highest)
> 2015 Unemployment rate: 6.0% (tied-10th highest)
> Credit rating: Aa2/AA
> Poverty: 13.9% (25th lowest)
Rhode Island residents benefit from relatively safe communities, high health insurance coverage, and high incomes. The state’s violent crime rate of 243 incidents per 100,000 residents is 11th lowest. The percentage of people without health insurance of 5.7% is sixth lowest. Also, the median household income of $58,073 a year is above the national median of $55,775.
Despite these strengths, Rhode Island’s economy is struggling, and measures of state finances suggest poor fiscal management. The state’s economy grew by 1.1% in 2015, slower than most states and less than half the national GDP growth rate. Also, Rhode Island’s outstanding debt is larger than its annual revenue, nearly the highest compared with other states and double the average debt-to-revenue ratio across all states.

49. Illinois
> Debt per capita: $5,119 (11th highest)
> 2015 Unemployment rate: 5.9% (tied-12th highest)
> Credit rating: Baa2/BBB
> Poverty: 13.6% (23rd lowest)
Due to ongoing political gridlock, Illinois lawmakers have not agreed on annual budget for its next fiscal year. With a growing tab of unpaid bills and debt, Illinois has the worst credit rating of all states. The state’s outstanding bills totalled nearly $9 billion in October, up from less than $6 billion in October of last year and the highest since February 2013.
In addition to fiscal management problems, the state’s housing market and economy are struggling. Approximately 1 in every 80 housing units are in some stage of foreclosure in Illinois, nearly the worst foreclosure rate of all states. The state’s labor force has also declined over the past five years, and the unemployment rate of 5.5% as of October was among the highest in the nation.

50. New Mexico
> Debt per capita: $3,303 (24th lowest)
> 2015 Unemployment rate: 6.6% (3rd highest)
> Credit rating: Aa1/AA
> Poverty: 20.4% (2nd highest)
New Mexico ranks as the worst run state on our list for the second consecutive year. Following a large and unexpected tax shortfall in the state’s fiscal 2016 and 2017 budgets, Moody’s downgraded the state’s credit rating and outlook. Despite the outlook, according to the credit agency, New Mexico has a strong history of balancing its budget, and the state’s debt levels are manageable and on the decline.
[in-text-ad]
The likelihood of living in poverty is very high for individuals without a high school diploma. In New Mexico, fewer than 85% of adults have a high school diploma, nearly the lowest high school attainment rate, and more than 20% of state residents live in poverty, the second highest rate of all states. Like most poorly-run states, New Mexico’s labor market is struggling. The state’s labor force declined over the last five years, and 6.5% of workers were unemployed as of October, the highest October jobless rate of all states.
Methodology
To determine how well each state is run, 24/7 Wall St. constructed an index of numerous measures from a variety of sources. From the U.S. Census Bureau, we looked at net migration to a state from April 2010 to July 2015 as a percentage of the population in 2015. We reviewed each state’s finances for the 2014 fiscal year, including revenue, per capita tax collection, expenditure and debt levels, all from the Census. Also from the Census, we reviewed the per capita value of a state’s exports.
Additionally, we considered pension funding ratios for each state from Washington D.C.-based think tank The Pew Research Center, as well as each state’s rainy day fund balance as a percentage of total general fund expenditures estimated for fiscal 2017 from The National Association of State Budget Officers (NASBO). NASBO defines rainy day funds as “budget stabilization funds set aside to respond to unforeseen circumstances.” Government general obligation ratings were provided by Standard & Poor’s and Moody’s Investors Service, and are the most recent as of this writing.
From the U.S. Census Bureau’s 2015 American Community Survey (ACS), we also considered a range of socioeconomic factors to assess social outcomes and residents’ well-being. We looked at poverty, high school educational attainment, the percentage of adults without health insurance, median household income, and 1- and 5-year changes in median home value. Violent crime rates came from the Federal Bureau of Investigation’s (FBI) 2015 Uniform Crime Report. Annual foreclosure rates, measured as the number of housing units at some stage in the foreclosure process, were provided by housing market data tracker Attom Data Solutions and are for 2015.
To evaluate each state’s job market, we reviewed annual 2015 unemployment rates as well as jobless rates as of October from the Bureau of Labor Statistics (BLS). Additionally, we reviewed the change in a state’s labor force from 2011 to 2015. Characteristics of each state’s unemployment insurance (UI) benefits system, including average weekly benefit amounts in dollars and as a percentage of the average weekly wage (the replacement rate), the percentage of UI claimants exhausting their benefits before finding a job (the exhaustion rate), the average duration in weeks of insurance benefits, and the percentage of unemployed individuals receiving UI benefits (the recipiency rate) are from the Department of Labor’s Employment and Training Administration (DOLETA) as of the twelve months ending Q1 2016.
Lastly, to assess the strength of each state’s economy, we reviewed real GDP growth rates and per capita real GDP for 2015 from the Bureau of Economic Analysis (BEA). Also from the BEA, we considered 2014 regional price parity, a proxy for an area’s cost of living.
If you missed out on NVIDIA’s historic run, your chance to see life-changing profits from AI isn’t over.
The 24/7 Wall Street Analyst who first called NVIDIA’s AI-fueled rise in 2009 just published a brand-new research report named “The Next NVIDIA.”
Click here to download your FREE copy.
Thank you for reading! Have some feedback for us?
Contact the 24/7 Wall St. editorial team.