Special Report
American Cities Adding the Most Jobs This Year

Published:
Last Updated:

The U.S. economy added nearly 2.5 million employed workers in the last 12 months, a growth of 1.7%. Employment is expanding even more rapidly in some parts of the country. Due to a variety of factors, employment growth in a number of cities was more than double the national growth rate. Together, the 25 cities with the fastest employment growth added more than half a million new jobs.
To determine the 25 U.S. cities adding the most jobs, 24/7 Wall St. compared employment levels in 387 metro areas in October 2016 with levels a year prior. Employment growth in these 25 cities ranged from 4.4% in Ithaca, New York to 7.6% in the Bend-Redmond metro area in Oregon.
[in-text-ad]
National employment growth is often attributed to thriving industries. In the past year, the education and health services industry added the most workers, while professional and business services was the second biggest contributor to employment growth nationwide. Meanwhile, manufacturing was the biggest drag on employment, followed by the information industry.
Click here to see the American cities adding the most jobs this year.
These broad national trends, however, often do not reflect economic conditions within a given metro area. Many of the cities adding the most jobs have thriving manufacturing industries, and only four reported employment declines in their manufacturing sectors.
In an interview with 24/7 Wall St., Martin Kohli, chief regional economist with the Bureau of Labor Statistics, explained that steady manufacturing employment has been very important to certain cities on this list, particularly in Oregon and Tennessee. “The Portland area has actually got one of the largest concentrations of employment in computer and electronic product manufacturing,” Kohli said. Nashville, too, “has unusual concentrations of employment in electrical equipment and transportation equipment manufacturing.” Both the Portland and Nashville metro areas have either maintained steady manufacturing employment or added to the sector’s workforce in the past year.
In many of the cities on this list, rapidly growing job markets often create something of a virtuous cycle. “When you have strong growth,” Kohli said, “that will attract people and jobs.” It is perhaps no coincidence that labor force growth was within a percentage point of total employment growth in all but two cities on this list as people entered the workforce to fill newly available employment opportunities.
A rapidly growing labor force will have implications across many industries, often health care, education, and construction in particular. Of course, in return, these sectors add more jobs. Such seems to be the case in Oregon, where job growth in other industries also caused a construction employment boom. “Nationally, employment in construction and residential construction is still below where it was back in 2006,” Kohli said, “so the fact that you’re seeing 8% [employment] growth in construction in some of these areas in Oregon is remarkable.” More than one out of every four cities adding the most workers is in Oregon.
Unlike construction job growth, which is more unique to some growing areas, education and health care employment growth seems to follow the national trend. Much like across the country, the industry was a leading contributor to increased employment in 13 of the 25 cities adding the most jobs.
Strong annual job growth does not always mean a given area’s economy is especially healthy. Though the number of jobs in the Detroit metro has grown by 4.4% in the past year, faster than in all but 21 other U.S. metros, Detroit has been the poster child of the decline of American manufacturing in the last several decades. Similarly, though Yuma, Arizona’s job market grew by 6.8% since October 2015, the third highest rate in the country, the city’s 18.4% unemployment rate remains nearly the highest in the country.
To identify the cities with the greatest employment growth, 24/7 Wall St. reviewed metropolitan statistical areas with the largest employment growth from October 2015 through October 2016. Unemployment rates, the size of the labor force, and employment levels are from the Bureau of Labor Statistics (BLS) and are seasonally adjusted. Industry-specific growth rates for the same period are from the Current Employment Survey (CES), a monthly BLS survey. Educational attainment and median household income came from the 2015 American Community Survey (ACS) of the U.S. Census Bureau.

25. Ithaca, NY
> Employment change: 4.37%
> No. of jobs Oct. 2015: 52,077
> No. of jobs Oct. 2016: 54,353
> Unemployment rate Oct. 2016: 3.8%
The Ithaca metro area added more than 2,200 jobs in the 12 months ending in October 2016. This 4.4% employment growth was the 25th highest of any metro area in the country. The area’s unemployment rate also fell over the same time period, from 4.0% to only 3.8%. Home to both Cornell University and Ithaca College, 54.6% of Ithaca adults have at least a bachelor’s degree, the largest share of any metro area in New York.
[in-text-ad]

24. Auburn-Opelika, AL
> Employment change: 4.41%
> No. of jobs Oct. 2015: 67,726
> No. of jobs Oct. 2016: 70,714
> Unemployment rate Oct. 2016: 5.2%
Since October 2015, the Auburn metro area’s labor force — the number of people either employed or actively seeking work — grew by about 3,200, or about 4.4%. The number of employed people grew at about the same rate. In the last 12 months, the city added nearly 3,000 jobs, also a 4.4% growth rate.
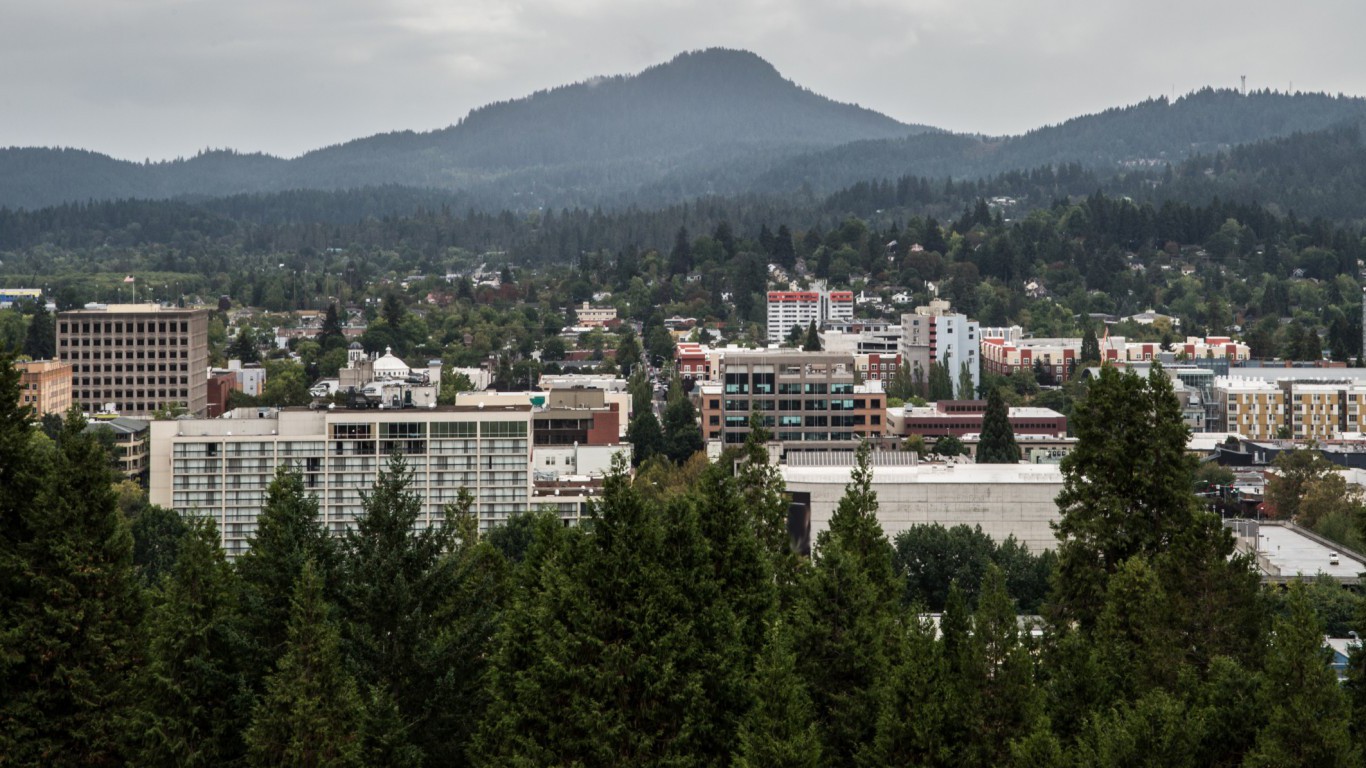
23. Eugene, OR
> Employment change: 4.44%
> No. of jobs Oct. 2015: 162,780
> No. of jobs Oct. 2016: 170,006
> Unemployment rate Oct. 2016: 5.5%
The number of workers in Eugene, Oregon increased by 4.4% in the past year, one of the fastest rates in the country. It appears area employment has a good chance to continue growth in the coming year as well. Semiconductor supplier, Avago Industries, just bought a 1.2 million square foot plant in the city to manufacture cell phone components. The Eugene Chamber of Commerce anticipates the facility will bring hundreds of new jobs to the area.

22. Detroit-Warren-Dearborn, MI
> Employment change: 4.44%
> No. of jobs Oct. 2015: 1,879,073
> No. of jobs Oct. 2016: 1,962,510
> Unemployment rate Oct. 2016: 5.3%
Parts of the Detroit metro area are among the most economically depressed in the country. However, the broader metro area has added to its employment total faster than the vast majority of U.S. metros. Expanding by 83,400 workers, total employment in the area increased by 4.4% between October 2015 and October 2016. Employment in the majority of sectors in the area grew faster than their growth rates nationwide, including in the manufacturing sector, as well as the professional and business services sectors.

21. Atlanta-Sandy Springs-Roswell, GA
> Employment change: 4.47%
> No. of jobs Oct. 2015: 2,688,412
> No. of jobs Oct. 2016: 2,808,572
> Unemployment rate Oct. 2016: 5.0%
One of the largest metro areas in the country, Atlanta has also undergone one of the largest employment booms. Nearly every industry in the Atlanta metro added to employment totals in the past year, with the professional and business services sector adding the most new workers. Additionally, like many of the cities that added the most jobs, the Atlanta metro area reported an uptick in manufacturing employment, bucking the national trend of employment declines in the industry.

20. Elizabethtown-Fort Knox, KY
> Employment change: 4.60%
> No. of jobs Oct. 2015: 60,387
> No. of jobs Oct. 2016: 63,166
> Unemployment rate Oct. 2016: 4.7%
In the Elizabethtown metro area, 4.6% employment growth brought unemployment in the area below the national rate. Between October 2015 and October 2016, employers in Elizabeth added nearly 2,800 jobs, bringing unemployment down from 5.2% to 4.7%. Meanwhile, the U.S. economy added 2.4 million workers, which brought unemployment down from 5.0% to 4.9%. The professional and business services industry contributed most to employment growth in the area.
[in-text-ad]

19. Clarksville, TN-KY
> Employment change: 4.61%
> No. of jobs Oct. 2015: 102,105
> No. of jobs Oct. 2016: 106,811
> Unemployment rate Oct. 2016: 5.5%
Clarksville, Tennessee added around 4,700 workers over the past year, a 4.6% increase in total employment. The largest drivers of growth appeared to be in the education and health services sector as well as the trade, transportation, and utilities sector, the latter of which added about 600 workers over the past year. While the employment growth helped drive the area’s unemployment rate down 0.5 percentage points to 5.5%, the jobless rate remains above the national rate of 4.9%.

18. Fargo, ND-MN
> Employment change: 4.62%
> No. of jobs Oct. 2015: 129,048
> No. of jobs Oct. 2016: 135,014
> Unemployment rate Oct. 2016: 2.5%
The number of workers in Fargo increased by 4.6% between October 2015 and October 2016, far faster than growth rate nationwide. Despite the rapid employment growth, the number of new workers in the area did not keep pace with labor force expansion over the same period. As a result, the unemployment rate in the Fargo metro area climbed from 2.3% to 2.5%. Still, unemployment in Fargo is well below the 4.9% unemployment rate nationwide and appears likely to remain there as the city continues to add jobs. Specifically, the Sanford Fargo Medical Center, the largest employer in the area, provides more than 6,600 jobs and is opening a new 11 story, million square foot facility in 2017.

17. Seattle-Tacoma-Bellevue, WA
> Employment change: 4.67%
> No. of jobs Oct. 2015: 1,879,827
> No. of jobs Oct. 2016: 1,967,536
> Unemployment rate Oct. 2016: 4.4%
The employment total in the Seattle metro area grew by 4.7% in the last 12 months. Employment growth in the information and trade and transportation industries was particularly strong. Seattle is home to the headquarters of Amazon.com, Boeing Commercial Airplanes, and Microsoft.

16. Knoxville, TN
> Employment change: 4.69%
> No. of jobs Oct. 2015: 384,235
> No. of jobs Oct. 2016: 402,262
> Unemployment rate Oct. 2016: 4.7%
The Knoxville area labor force — the number of people either with a job or looking for one — increased by 16,700 over the 12-month period ending in October 2016. While an increase in the labor force can lead to rising unemployment, Knoxville added an even greater number of workers — about 18,000 — over the same period. As a result, the area’s unemployment rate fell from 5.2%, slightly above the national figure at the time of 5.0%, to 4.7%, below the national rate of 4.9%. Last October, Comcast announced it was expanding a Knoxville call center and adding 250 jobs.

15. Savannah, GA
> Employment change: 4.86%
> No. of jobs Oct. 2015: 166,559
> No. of jobs Oct. 2016: 174,646
> Unemployment rate Oct. 2016: 4.9%
A city steeped in historical significance, Savannah is a popular tourist destination. As such, the metro area’s leisure and hospitality industry accounts for a much larger share of jobs than is typical. It has also accounted for a considerable share of job growth in the past year, expanding industry employment in the area by nearly 5%, more than double the industry’s employment growth nationwide. Overall, Savannah’s job market grew far faster in the past year than the vast majority of U.S. metro areas.
[in-text-ad]
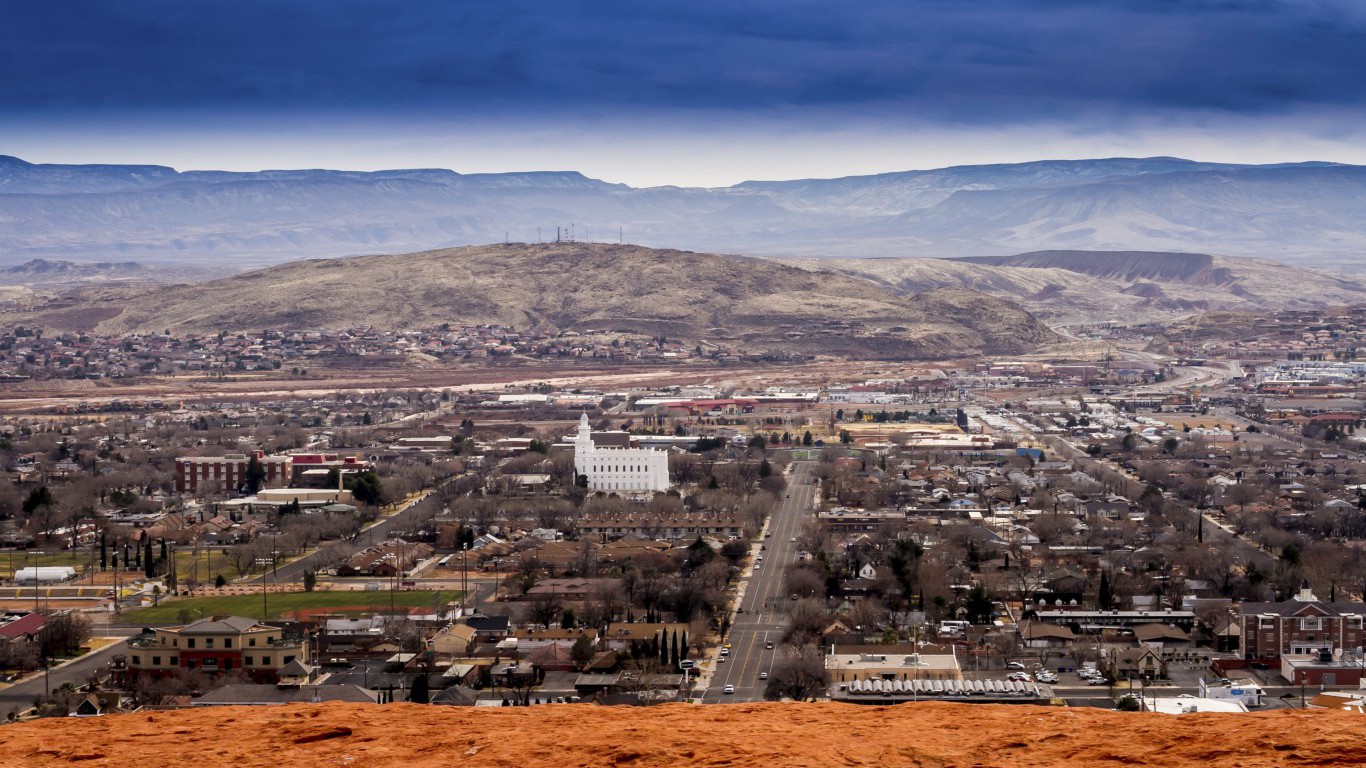
14. St. George, UT
> Employment change: 4.89%
> No. of jobs Oct. 2015: 62,386
> No. of jobs Oct. 2016: 65,435
> Unemployment rate Oct. 2016: 3.6%
When populations expand, regardless of the driving factors, the government and health services sector, as well as the education sector typically expand to accommodate the growing population. In a large number of metro areas with the greatest employment growth, one of these two sectors had the largest proportional employment increases of all sectors in the area. In St. George, employment in the government sector increased slightly, while the education and health services sector added around 800 workers, the largest increase of any sector in the area.

13. Grants Pass, OR
> Employment change: 5.06%
> No. of jobs Oct. 2015: 30,906
> No. of jobs Oct. 2016: 32,471
> Unemployment rate Oct. 2016: 7.0%
Despite declines in government employment and a loss of jobs in the leisure and hospitality sector, Grants Pass, Oregon has added more to its workforce than all but a dozen other U.S. metro areas since October 2015. An especially small city, the net addition of some 1,600 workers in the past year has helped drive down the metro area’s unemployment rate from 7.8% to a still quite high 7.0%. Bucking national trends, the area’s manufacturing sector and mining, logging, and construction industries reported especially strong 3.3% and 11.1% employment growth respectively.

12. Medford, OR
> Employment change: 5.10%
> No. of jobs Oct. 2015: 91,343
> No. of jobs Oct. 2016: 96,006
> Unemployment rate Oct. 2016: 6.3%
In Medford, Oregon, every major industry, from manufacturing to government, added workers in the past year. The metro area is one of seven in Oregon to rank among the 25 U.S. metros adding the most to employment. Despite the addition of nearly 4,700 jobs, Medford’s 6.3% unemployment rate remains well above the corresponding 4.9% national rate.

11. Nashville-Davidson–Murfreesboro–Franklin, TN
> Employment change: 5.16%
> No. of jobs Oct. 2015: 893,361
> No. of jobs Oct. 2016: 939,494
> Unemployment rate Oct. 2016: 3.9%
The United States shed tens of thousands of manufacturing workers between October 2015 and October 2016. In the Nashville metro area, however, employment surged in the manufacturing industry. Manufacturing employment grew by 5.9% in the past year. Major manufacturing employers in the area include automakers Nissan and General Motors.

10. Albany, OR
> Employment change: 5.20%
> No. of jobs Oct. 2015: 50,990
> No. of jobs Oct. 2016: 53,641
> Unemployment rate Oct. 2016: 5.8%
Metal manufacturing is central to Albany’s economy. Specialty metal alloy maker Allegheny Technologies Incorporated is one of the largest employers in the area. Within the past year, employment in the area’s mining, logging, and construction sector grew by 13.3%, the eighth largest employment growth in the sector among U.S. metro areas. Like many Oregon metros, the rapid employment growth was not enough to bring unemployment below the 4.9% national rate.
[in-text-ad]

9. Portland-Vancouver-Hillsboro, OR-WA
> Employment change: 5.21%
> No. of jobs Oct. 2015: 1,171,041
> No. of jobs Oct. 2016: 1,232,021
> Unemployment rate Oct. 2016: 5.0%
At over 1.2 million, the Portland metro area has one of the largest workforces in the country. The area’s job market is also growing rapidly, adding nearly 61,000 workers in the past year — a 5.2% increase in total employment. Despite far faster than average employment growth, the city’s 5.0% unemployment rate is roughly in line with the corresponding 4.9% national rate.

8. Morristown, TN
> Employment change: 5.46%
> No. of jobs Oct. 2015: 46,612
> No. of jobs Oct. 2016: 49,159
> Unemployment rate Oct. 2016: 5.5%
The 5.5% employment growth in the Morristown metro area was higher than in all but a handful of other U.S. metro areas. Employment growth greatly outpaced the labor force expansion, and as a result, the area’s unemployment rate fell from 6.3% in October 2015 to 5.5% in October 2016. The education and health services industry helped drive growth, with employment in the sector increasing by 10.9%, far faster than any other industry in the area.

7. Athens-Clarke County, GA
> Employment change: 5.52%
> No. of jobs Oct. 2015: 88,488
> No. of jobs Oct. 2016: 93,375
> Unemployment rate Oct. 2016: 5.0%
The number of workers in the Athens metro area increased by about 4,900, in line with the area’s labor force expansion. Home to the University of Georgia, Athens also happens to be a highly educated area. A highly educated population can be more attractive to potential employers, and 38.0% of area adults have at least a bachelor’s degree, a far larger share than the 30.6% of adults nationwide.
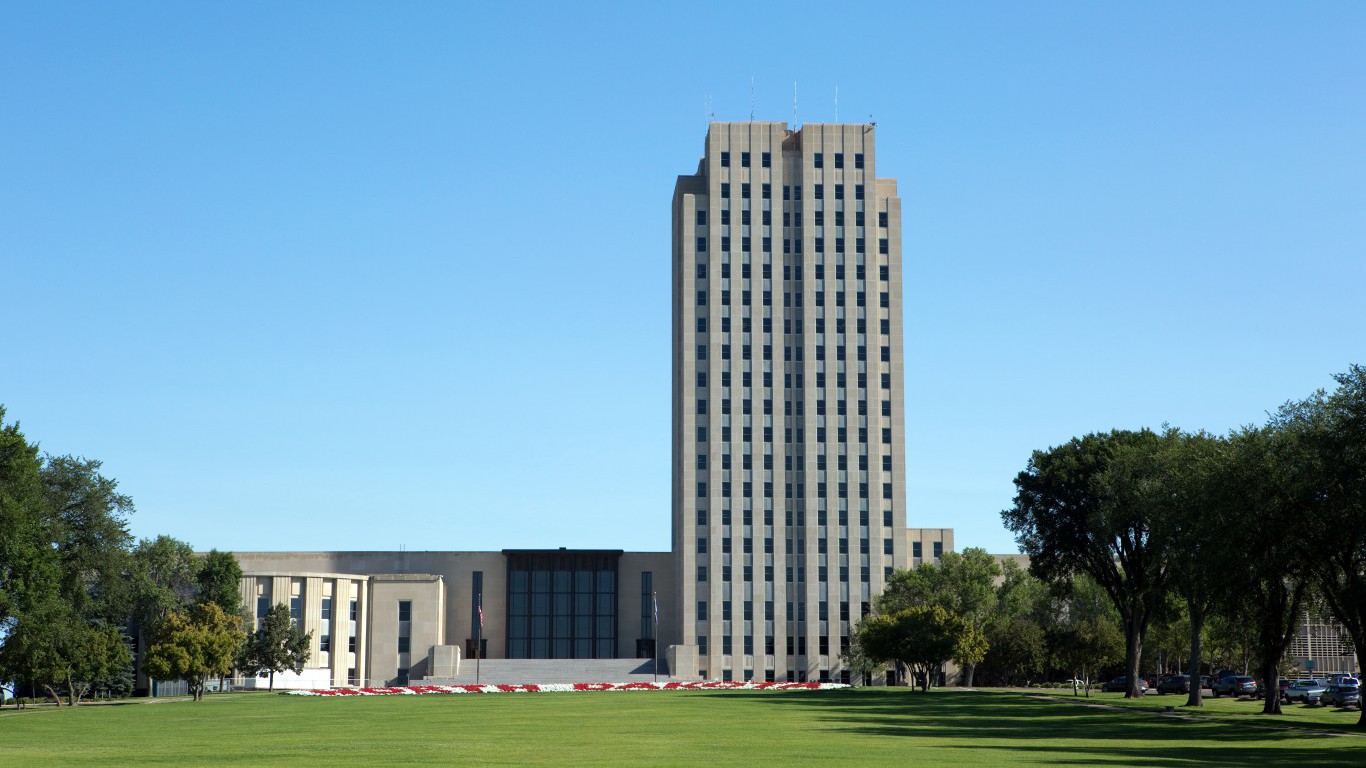
6. Bismarck, ND
> Employment change: 6.00%
> No. of jobs Oct. 2015: 66,278
> No. of jobs Oct. 2016: 70,255
> Unemployment rate Oct. 2016: 2.8%
The number of workers in the Bismark, North Dakota metro area increased by 6% between October 2015 and October 2016, faster than in all but five other U.S. metros. While employment growth was strong, it did not keep pace with the area’s growing labor force. Over the same time period, Bismarck’s labor force expanded by about 6.5%, or roughly 400 more workers than jobs. Still, the area’s 2.8% unemployment rate is nearly the lowest in the country.

5. Salem, OR
> Employment change: 6.01%
> No. of jobs Oct. 2015: 179,402
> No. of jobs Oct. 2016: 190,190
> Unemployment rate Oct. 2016: 5.4%
No state has more metro areas on this list than Oregon. In Salem, the number of workers increased by 6% last year, more than in all but four other metro areas. The city’s mining, logging, and construction sector, as well as the professional and business services sector grew the most rapidly. Employment in each grew by 6.7% and 17.5%, respectively, well above the industries’ 1.1% and 2.7% corresponding growth rates nationwide.
[in-text-ad]
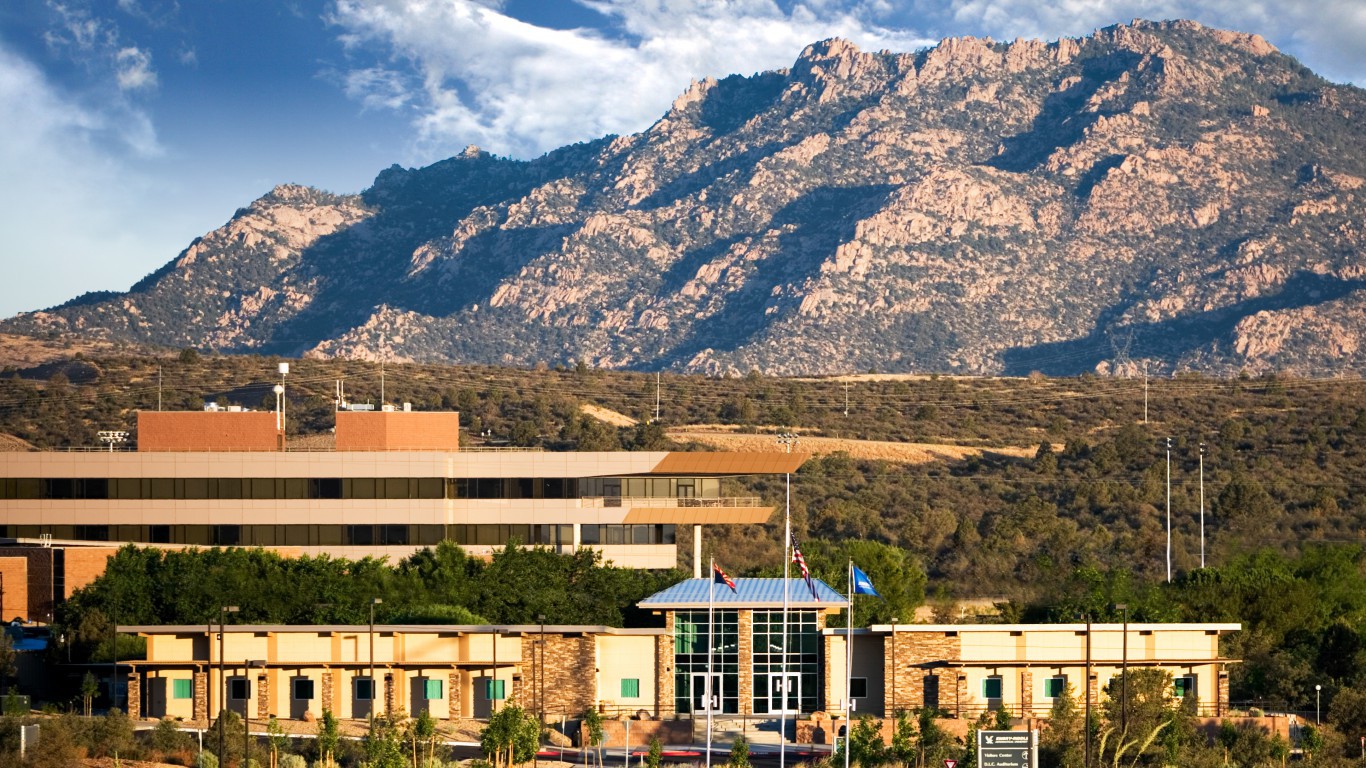
4. Prescott, AZ
> Employment change: 6.57%
> No. of jobs Oct. 2015: 92,552
> No. of jobs Oct. 2016: 98,637
> Unemployment rate Oct. 2016: 4.7%
The number of workers in Prescott, Arizona has spiked by 6.6% since October 2015. Job growth in hospitality, education and health services, and trade, transportation and utilities each was more than double the corresponding national growth rate. Employment in the area’s manufacturing sector also grew by 2.9%, even as manufacturing employment nationwide fell by half a percentage point. Prescott is home to major manufacturing plants of firearm maker Sturm Ruger & Co. and of aircraft parts company Cobham Aerospace Communications.

3. Yuma, AZ
> Employment change: 6.81%
> No. of jobs Oct. 2015: 72,473
> No. of jobs Oct. 2016: 77,407
> Unemployment rate Oct. 2016: 18.4%
Yuma’s employment increased more than any metro area in Arizona and all but two other American metros. The city added nearly 5,000 new workers in the last year, a 6.8% increase. While Yuma’s growth was rapid, the city’s overall economic picture is bleak. More than 18% of Yuma’s labor force is unemployed, the second highest share of any metro area in the country.

2. Cleveland, TN
> Employment change: 7.31%
> No. of jobs Oct. 2015: 53,770
> No. of jobs Oct. 2016: 57,700
> Unemployment rate Oct. 2016: 4.7%
Cleveland is one of five Tennessee metro areas on this list and one of only two metro areas in the country with more than 7% employment growth. Driving employment growth was the area’s professional and business services industry. Employment in the industry grew by 20.3% between October 2015 and October 2016, more than in any other U.S. metro. Major employers in the area include Whirlpool Corporation and Amazon.com.

1. Bend-Redmond, OR
> Employment change: 7.63%
> No. of jobs Oct. 2015: 80,446
> No. of jobs Oct. 2016: 86,587
> Unemployment rate Oct. 2016: 5.2%
The Bend-Redmond metro area had the most rapid employment growth of any U.S. metro over the past year. The 7.6% employment growth was more than quadruple the nationwide job growth. A former saw mill town, wood products still make up a significant share of the area’s economy. Last year, employment in mining, logging, and construction went up by 10.3%, more than in any other industry in the area. Strong growth in a number of other industries, including leisure and hospitality as well as professional and business services were enough to offset a 4.3% decline in the area’s finance industry.
If you missed out on NVIDIA’s historic run, your chance to see life-changing profits from AI isn’t over.
The 24/7 Wall Street Analyst who first called NVIDIA’s AI-fueled rise in 2009 just published a brand-new research report named “The Next NVIDIA.”
Click here to download your FREE copy.
Thank you for reading! Have some feedback for us?
Contact the 24/7 Wall St. editorial team.