Special Report
Cities With the Shortest Life Expectancy in Every State
Published:
Last Updated:

To highlight how life expectancy trends vary across the United States, 24/7 Wall St. listed the city in every state with the shortest life expectancy at birth. Across all metro areas, life expectancy is lowest in Gadsden, Alabama, where life expectancy at birth is only 73.3 years. By contrast, average life expectancy in Naples-Immokalee-Marco Island, Florida is more than 10 years longer.
Wealthier individuals tend to be healthier, and poorer individuals less healthy. In the poorer end of the income spectrum, especially for those living in poverty, income has an outsized impact on health. Adults living in poverty are nearly five times more likely to report being in poor or fair health than more affluent adults. The cities on this list tend to have lower household incomes and a larger share of residents living in poverty than metro areas with longer life expectancies. Median household incomes are lower than the national median in all but nine of the 50 cities.
Click here to see the cities with the shortest life expectancy in every state.
Click here to see the cities with the longest life expectancy in every state.
Another common trend among the cities with the shortest life expectancy in their state is the tendency to report more unhealthy behaviors than cities with longer life expectancies. Inactivity and unhealthy eating contribute to higher obesity rates, which in turn increase the risk of life-shortening diseases. Of the 50 cities with the shortest life expectancy in their state, 40 have higher obesity rates than the nation as a whole.
While every city on this list has the shortest life expectancy in their state, these life expectancies are not necessarily short in a national context. For example, because life expectancy is so high across Massachusetts, even in Pittsfield — the city with the shortest life expectancy in the state — residents are expected to live longer than the typical American.
To determine the metropolitan areas in each state where people have the lowest life expectancy, 24/7 Wall St. reviewed 2013 county-level life expectancy at birth figures provided by the Institute for Health Metrics and Evaluation (IHME), a global research center affiliated with the University of Washington. Using death records data from the National Center for Health Statistics, researchers applied a mixed effects Poisson statistical model and Gaussian Process Regression to estimate age-specific mortality rates for U.S. counties from 1985 to 2013.
To obtain metro area life expectancy estimates, we mapped the counties to their corresponding metro areas and calculated the average life expectancy by sex across all counties in a given metro area. County estimates were weighted by 2013 5-year population figures from the American Community Survey (ACS). To ensure 2008 and 2013 life expectancy estimates were comparable, both estimates were weighted by populations in 2013.
Metro-level median household income came from the U.S. Census Bureau’s 2015 American Community Survey. Obesity rates came from County Health Rankings & Roadmaps program, a collaboration between the Robert Wood Johnson Foundation and the University of Wisconsin Population Health Institute.
These are the metro areas in each state where people live the shortest lives.

1. Alabama
> Metro area: Gadsden
> Life expectancy: 73.3 yrs.
> Obesity rate: 34.7%
> Median household income: $43,346

2. Alaska
> Metro area: Anchorage
> Life expectancy: 78.5 yrs.
> Obesity rate: 27.4%
> Median household income: $78,238

3. Arizona
> Metro area: Lake Havasu City-Kingman
> Life expectancy: 75.2 yrs.
> Obesity rate: 28.1%
> Median household income: $40,908

4. Arkansas
> Metro area: Pine Bluff
> Life expectancy: 73.8 yrs.
> Obesity rate: 38.3%
> Median household income: $36,538

5. California
> Metro area: Redding
> Life expectancy: 76.5 yrs.
> Obesity rate: 27.2%
> Median household income: $46,693

6. Colorado
> Metro area: Pueblo
> Life expectancy: 77.5 yrs.
> Obesity rate: 26.3%
> Median household income: $40,050

7. Connecticut
> Metro area: Norwich-New London
> Life expectancy: 80.0 yrs.
> Obesity rate: 26.7%
> Median household income: $65,764

8. Delaware
> Metro area: Dover
> Life expectancy: 77.6 yrs.
> Obesity rate: 33.2%
> Median household income: $56,778

9. Florida
> Metro area: Panama City
> Life expectancy: 76.4 yrs.
> Obesity rate: 30.4%
> Median household income: $48,066

10. Georgia
> Metro area: Macon
> Life expectancy: 74.9 yrs.
> Obesity rate: 30.9%
> Median household income: $40,067

11. Hawaii
> Metro area: Kahului-Wailuku-Lahaina
> Life expectancy: 80.8 yrs.
> Obesity rate: 22.4%
> Median household income: $70,468

12. Idaho
> Metro area: Pocatello
> Life expectancy: 77.3 yrs.
> Obesity rate: 28.2%
> Median household income: $41,530

13. Illinois
> Metro area: Danville
> Life expectancy: 76.1 yrs.
> Obesity rate: 37.3%
> Median household income: $45,098

14. Indiana
> Metro area: Terre Haute
> Life expectancy: 75.5 yrs.
> Obesity rate: 32.7%
> Median household income: $40,974

15. Iowa
> Metro area: Sioux City
> Life expectancy: 78.3 yrs.
> Obesity rate: 33.9%
> Median household income: $52,698

16. Kansas
> Metro area: Wichita
> Life expectancy: 77.8 yrs.
> Obesity rate: 30.9%
> Median household income: $51,591

17. Kentucky
> Metro area: Bowling Green
> Life expectancy: 76.3 yrs.
> Obesity rate: 30.9%
> Median household income: $43,437

18. Louisiana
> Metro area: Alexandria
> Life expectancy: 74.4 yrs.
> Obesity rate: 36.1%
> Median household income: $42,778

19. Maine
> Metro area: Bangor
> Life expectancy: 77.7 yrs.
> Obesity rate: 31.0%
> Median household income: $44,173

20. Maryland
> Metro area: Hagerstown-Martinsburg
> Life expectancy: 77.0 yrs.
> Obesity rate: 34.3%
> Median household income: $55,142

21. Massachusetts
> Metro area: Pittsfield
> Life expectancy: 79.5 yrs.
> Obesity rate: 22.9%
> Median household income: $50,765

22. Michigan
> Metro area: Flint
> Life expectancy: 76.0 yrs.
> Obesity rate: 36.0%
> Median household income: $44,025

23. Minnesota
> Metro area: Duluth
> Life expectancy: 78.7 yrs.
> Obesity rate: 26.8%
> Median household income: $50,566

24. Mississippi
> Metro area: Hattiesburg
> Life expectancy: 75.2 yrs.
> Obesity rate: 34.6%
> Median household income: $41,938
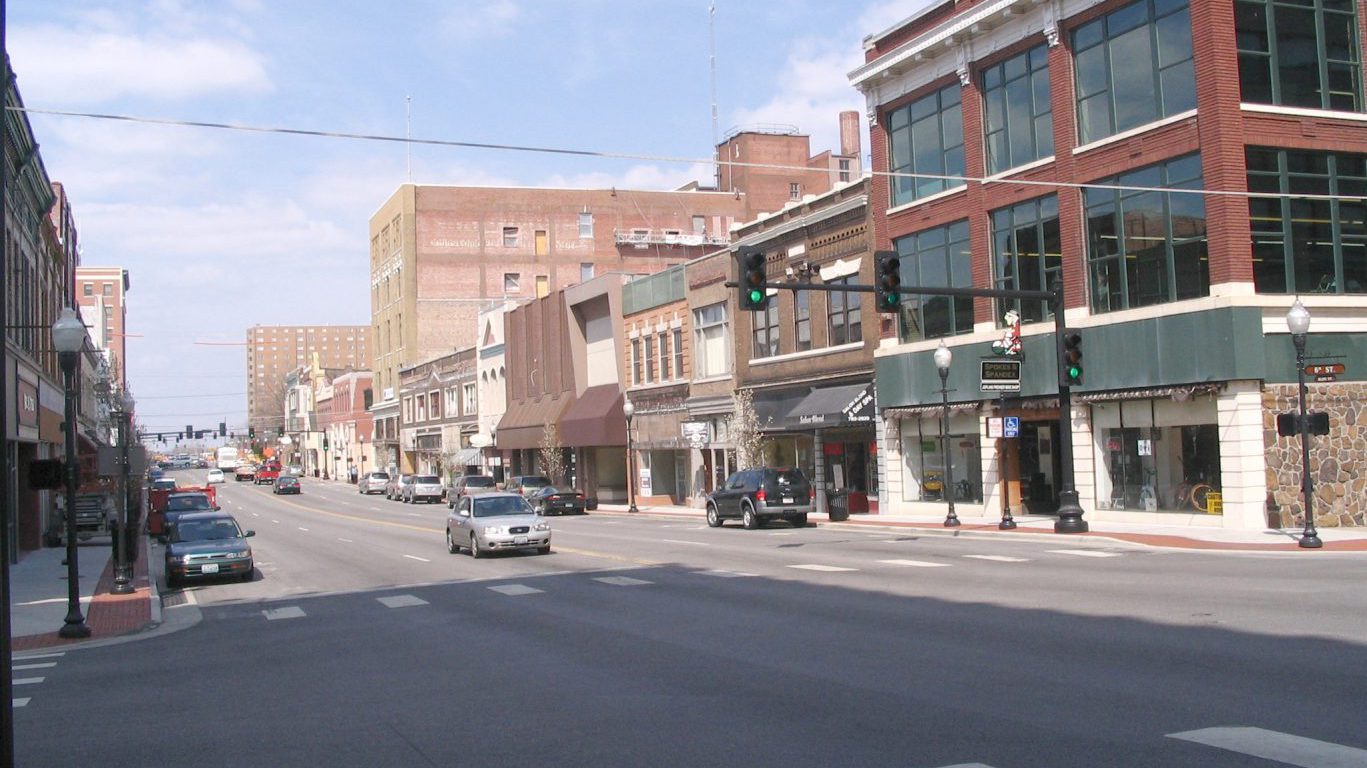
25. Missouri
> Metro area: Joplin
> Life expectancy: 75.7 yrs.
> Obesity rate: 32.3%
> Median household income: $45,089


27. Nebraska
> Metro area: Omaha-Council Bluffs
> Life expectancy: 79.1 yrs.
> Obesity rate: 29.7%
> Median household income: $61,024

28. Nevada
> Metro area: Carson City
> Life expectancy: 76.6 yrs.
> Obesity rate: 24.1%
> Median household income: $42,251

29. New Hampshire
> Metro area: Manchester-Nashua
> Life expectancy: 80.1 yrs.
> Obesity rate: 27.3%
> Median household income: $74,323

30. New Jersey
> Metro area: Vineland-Bridgeton
> Life expectancy: 76.5 yrs.
> Obesity rate: 33.6%
> Median household income: $51,315

31. New Mexico
> Metro area: Farmington
> Life expectancy: 77.8 yrs.
> Obesity rate: 30.3%
> Median household income: $49,613

32. New York
> Metro area: Watertown-Fort Drum
> Life expectancy: 78.1 yrs.
> Obesity rate: 27.4%
> Median household income: $51,107

33. North Carolina
> Metro area: Rocky Mount
> Life expectancy: 76.0 yrs.
> Obesity rate: 34.1%
> Median household income: $37,324

34. North Dakota
> Metro area: Grand Forks
> Life expectancy: 78.8 yrs.
> Obesity rate: 29.7%
> Median household income: $53,443

35. Ohio
> Metro area: Springfield
> Life expectancy: 75.7 yrs.
> Obesity rate: 30.4%
> Median household income: $47,963

36. Oklahoma
> Metro area: Lawton
> Life expectancy: 76.0 yrs.
> Obesity rate: 34.9%
> Median household income: $47,617

37. Oregon
> Metro area: Grants Pass
> Life expectancy: 77.0 yrs.
> Obesity rate: 26.3%
> Median household income: $41,493

38. Pennsylvania
> Metro area: Scranton–Wilkes-Barre–Hazleton
> Life expectancy: 76.9 yrs.
> Obesity rate: 29.6%
> Median household income: $49,670

39. Rhode Island
> Metro area: Providence-Warwick
> Life expectancy: 79.5 yrs.
> Obesity rate: 27.0%
> Median household income: $58,965

40. South Carolina
> Metro area: Florence
> Life expectancy: 74.0 yrs.
> Obesity rate: 36.3%
> Median household income: $38,062

41. South Dakota
> Metro area: Rapid City
> Life expectancy: 79.7 yrs.
> Obesity rate: 27.8%
> Median household income: $52,809

42. Tennessee
> Metro area: Morristown
> Life expectancy: 75.3 yrs.
> Obesity rate: 29.8%
> Median household income: $40,041

43. Texas
> Metro area: Texarkana
> Life expectancy: 74.9 yrs.
> Obesity rate: 33.0%
> Median household income: $38,814

44. Utah
> Metro area: Salt Lake City
> Life expectancy: 79.3 yrs.
> Obesity rate: 25.4%
> Median household income: $65,792

45. Vermont
> Metro area: Burlington-South Burlington
> Life expectancy: 80.5 yrs.
> Obesity rate: 22.7%
> Median household income: $66,807
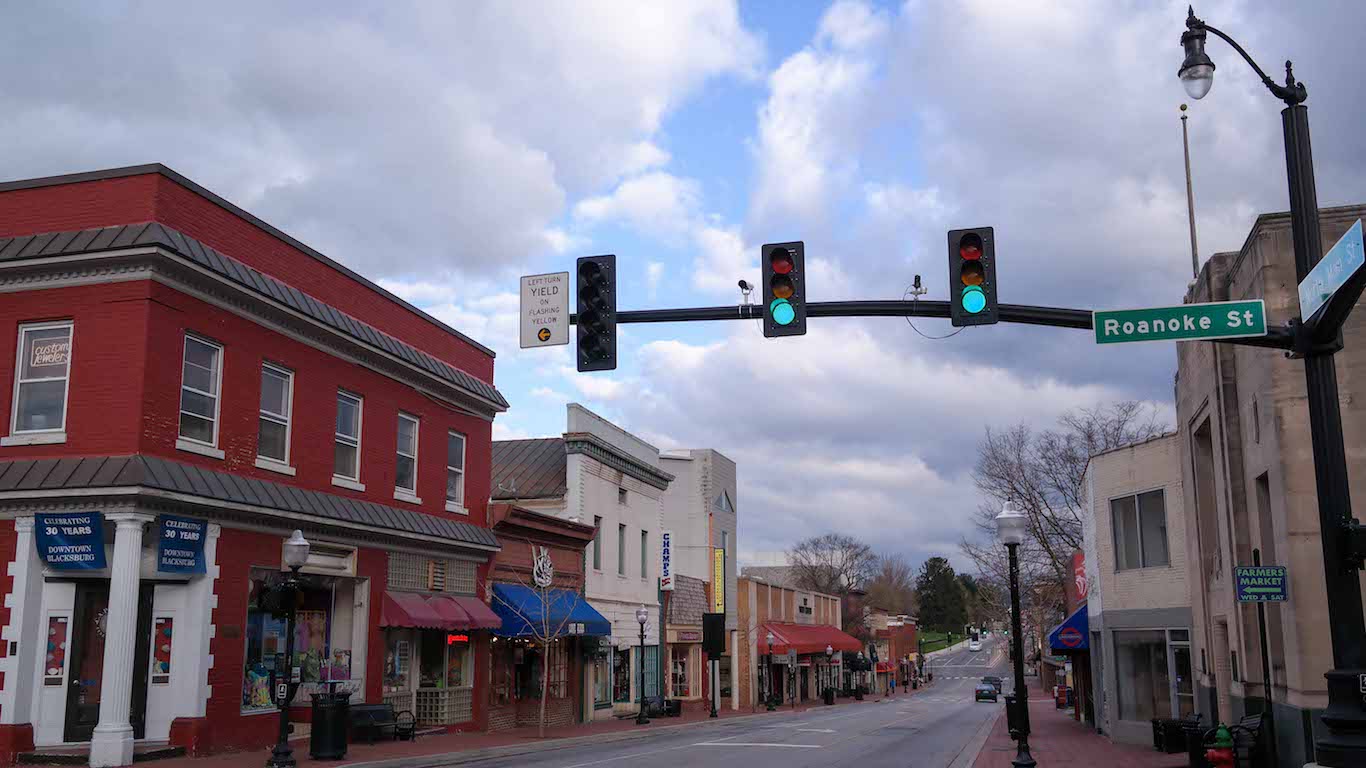
46. Virginia
> Metro area: Blacksburg-Christiansburg-Radford
> Life expectancy: 77.7 yrs.
> Obesity rate: 27.0%
> Median household income: $50,947

47. Washington
> Metro area: Longview
> Life expectancy: 77.7 yrs.
> Obesity rate: 32.4%
> Median household income: $49,949
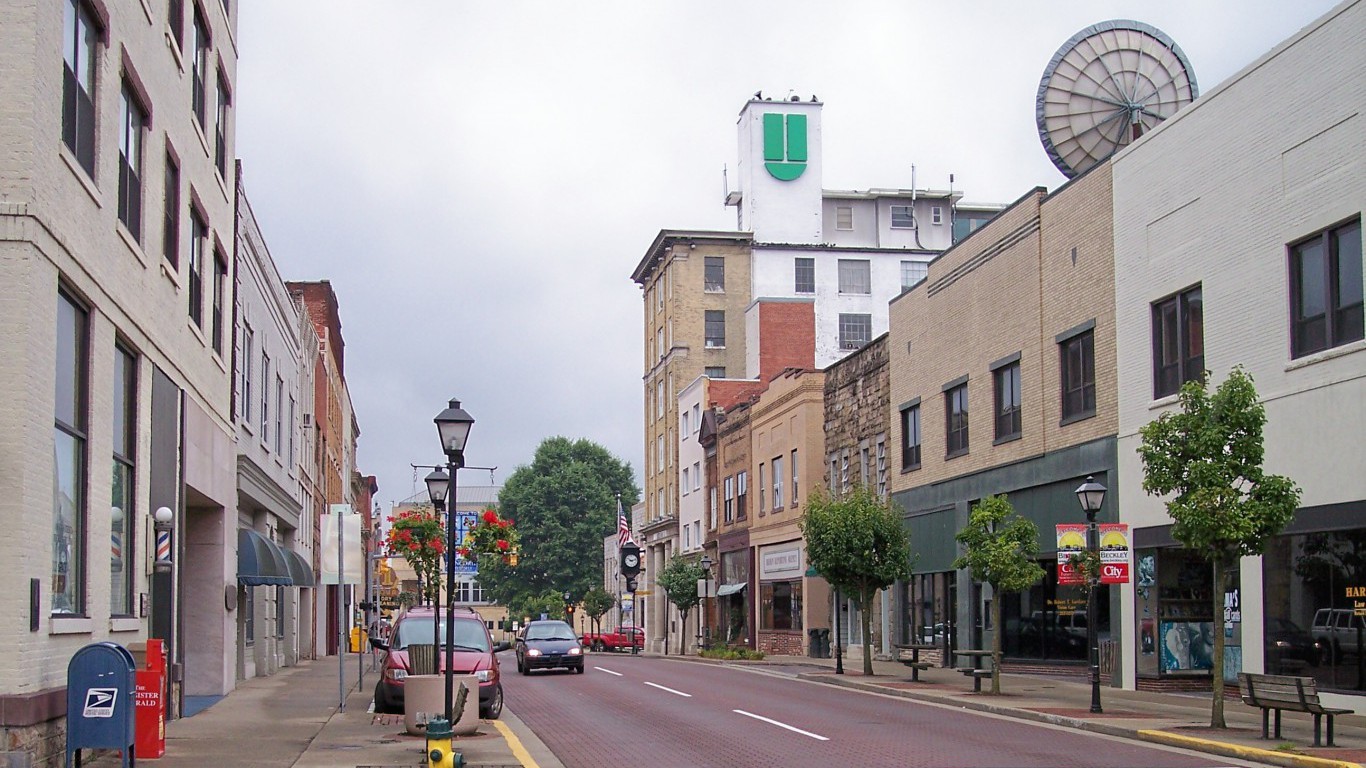
48. West Virginia
> Metro area: Beckley
> Life expectancy: 73.5 yrs.
> Obesity rate: 34.5%
> Median household income: $37,101

49. Wisconsin
> Metro area: Janesville-Beloit
> Life expectancy: 78.3 yrs.
> Obesity rate: 33.7%
> Median household income: $53,777

50. Wyoming
> Metro area: Casper
> Life expectancy: 76.9 yrs.
> Obesity rate: 28.1%
> Median household income: $52,886
After two decades of reviewing financial products I haven’t seen anything like this. Credit card companies are at war, handing out free rewards and benefits to win the best customers.
A good cash back card can be worth thousands of dollars a year in free money, not to mention other perks like travel, insurance, and access to fancy lounges.
Our top pick today pays up to 5% cash back, a $200 bonus on top, and $0 annual fee. Click here to apply before they stop offering rewards this generous.
Flywheel Publishing has partnered with CardRatings for our coverage of credit card products. Flywheel Publishing and CardRatings may receive a commission from card issuers.
Thank you for reading! Have some feedback for us?
Contact the 24/7 Wall St. editorial team.