Special Report
Counties That Voted Most Heavily for Trump in Every State

Published:
Last Updated:
Donald Trump will officially become president on January 20. His election has prompted a wide range of reactions, from supporters believing he is a populist leader to opponents fearing his rise to power threatens democracy. For Americans of all political persuasions, the ongoing media coverage of the election results has likely been disorienting to say the least.
While votes cast in the Electoral College determine who is president of the United States based on each state’s level of support for the candidates, there is considerable variation in voting results even within the most conservative and most liberal states.
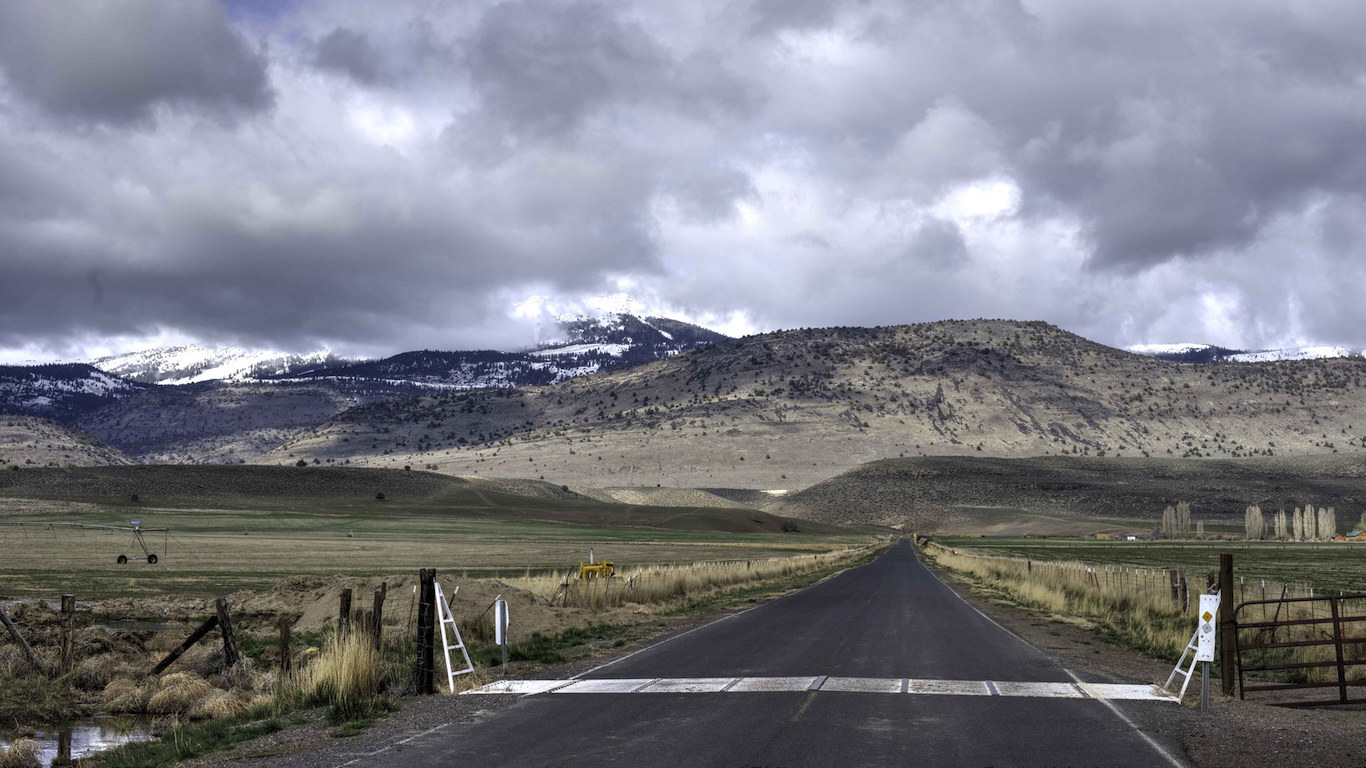
24/7 Wall St. reviewed voting results in every U.S. county from the most recent presidential election. In Roberts County, Texas, 95.3% of the 550 votes cast were for Trump, the highest percentage of the over 3,000 U.S. counties. By contrast, in the District of Columbia (Washington D.C.), a county equivalent area, just 4.1% of voters cast their ballot for Trump, the smallest share of any county.
Click here to see the most pro-Trump county in every state.
Hillary Clinton received 62.4 million votes, well over 1 million more than Trump. In the ongoing process of counting all the votes, this difference has increased, and Clinton may have won the popular vote by more than 2 million votes. However, Trump won a majority of votes in over 80% of counties.
The discrepancy is entirely due to the different population sizes of U.S. counties. Trump’s dominant results at the county level mean that small, low-population areas overwhelmingly voted for Trump. On the other hand, Clinton’s victory in overall votes means that more populous counties, many of which are part of the nation’s largest metropolitan areas, voted for Clinton.
Various economic and social conditions, and how they have changed over recent decades, help explain Trump’s political success. For example, Trump was especially popular among dissatisfied working-class white men. That high level of dissatisfaction would likely have been significantly lower if not for changes in major U.S. industries, such as the manufacturing sector. Further, some analysts have argued Trump would not have been elected if not for the 2008 financial crisis. In a November 2016 paper, “Going to extremes: Politics after financial crises, 1870-2014,” researchers found that financial recessions are typically followed by surges in protests and support for anti-establishment political parties, especially from the far right.
Mirroring the employment makeup of Trump versus Clinton supporters, one of the most notable differences between the two groups is in educational attainment levels. Of the 2,623 counties that voted for Trump over Clinton, only 184, or 7%, have above-average college attainment rates.
The GOP has long been one of the most racially homogenous political parties in the United States — if not the world. During his campaign, Trump’s speeches were considered by many as supportive of white supremacist agendas. Economic factors likely played a greater role than race-related issues in most voters’ decisions. However, while mostly white counties that went for Trump were disproportionately low-income areas, mostly black, low-income areas tended to support Clinton. All but seven of the 50 counties with state-leading Trump support have larger shares of white residents than most other counties in their respective states.
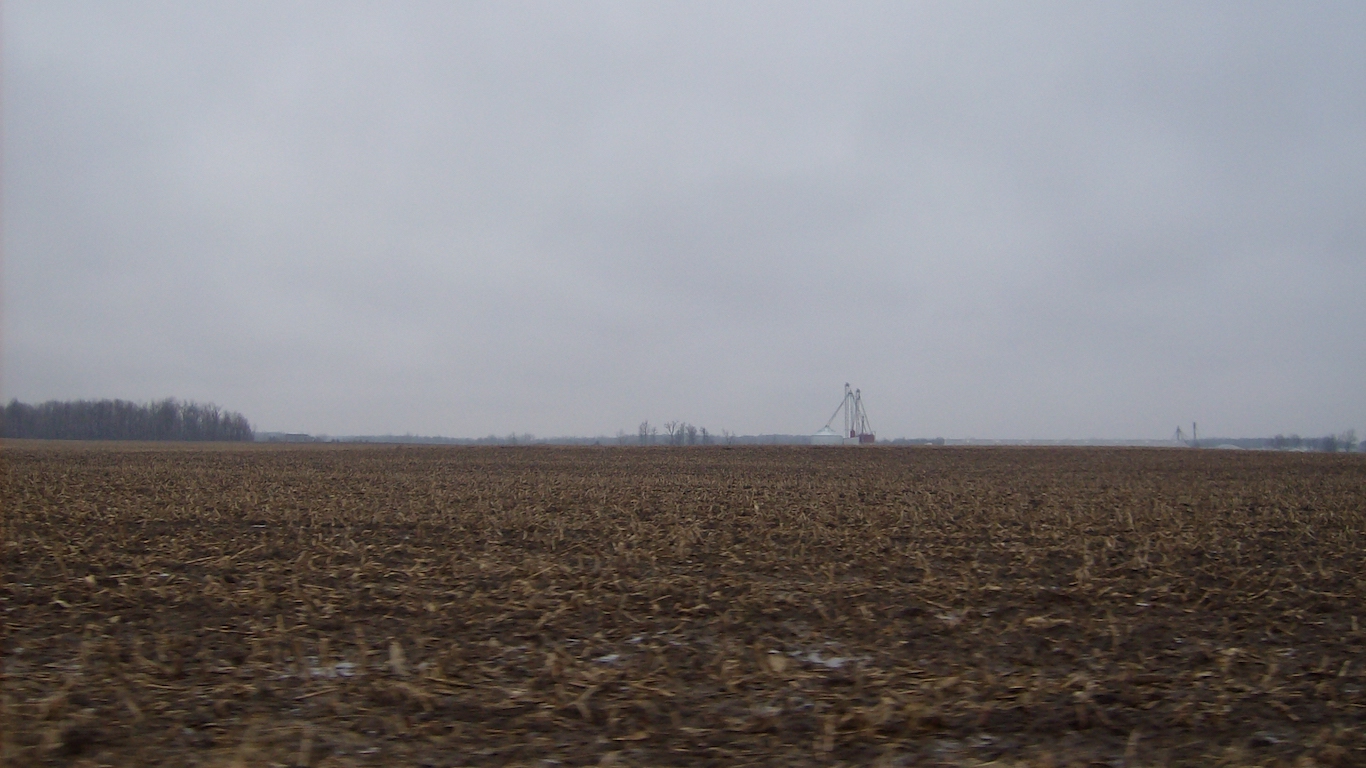
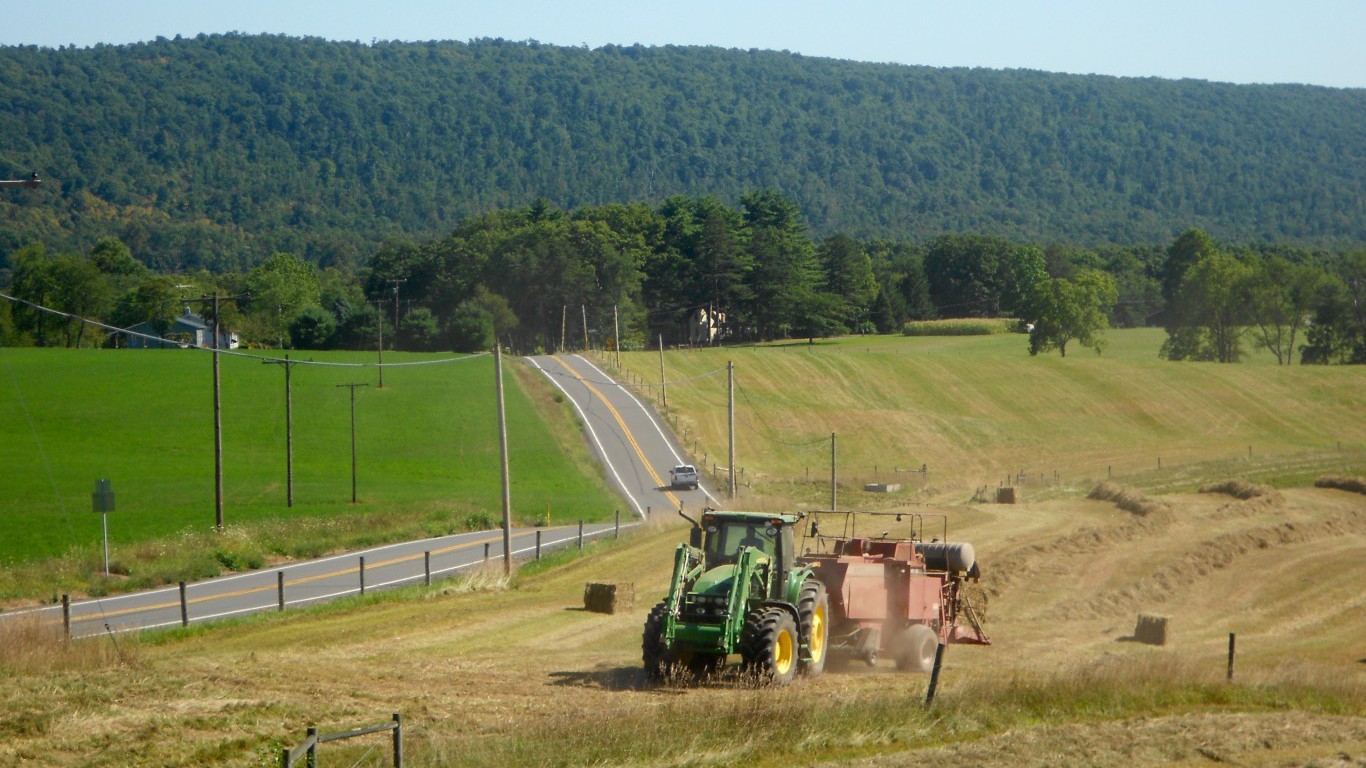
To determine the most pro-Trump county in each state, 24/7 Wall St. reviewed voting results from the 2016 presidential election aggregated by the political news publication Politico. The most pro-Trump county in each state is the one with the largest share of votes cast for the president-elect. Demographic data, such as the shares of whites and African Americans, and college attainment rates, in each county, came from the U.S. Census Bureau’s 2015 American Community Survey and are five-year averages. The percentage of each county’s population living in rural areas came from the U.S. Census Bureau’s 2010 decennial census.
These are the counties in every state that voted most heavily for Trump.
1. Winston, Alabama
> County votes for Trump: 90.0%
> State votes for Trump: 62.9%
> White pop.: 94.3% (1st of 67 AL counties)
> Rural pop.: 84.9% (23rd of 67 AL counties)
[in-text-ad]
2. Alaska
NOTE: Voting results in Alaska are reported at the precinct level and are not available for boroughs (county-equivalents) in Alaska.
3. Mohave, Arizona
> County votes for Trump: 73.7%
> State votes for Trump: 49.5%
> White pop.: 78.2% (2nd of 15 AZ counties)
> Rural pop.: 23.0% (11th of 15 AZ counties)
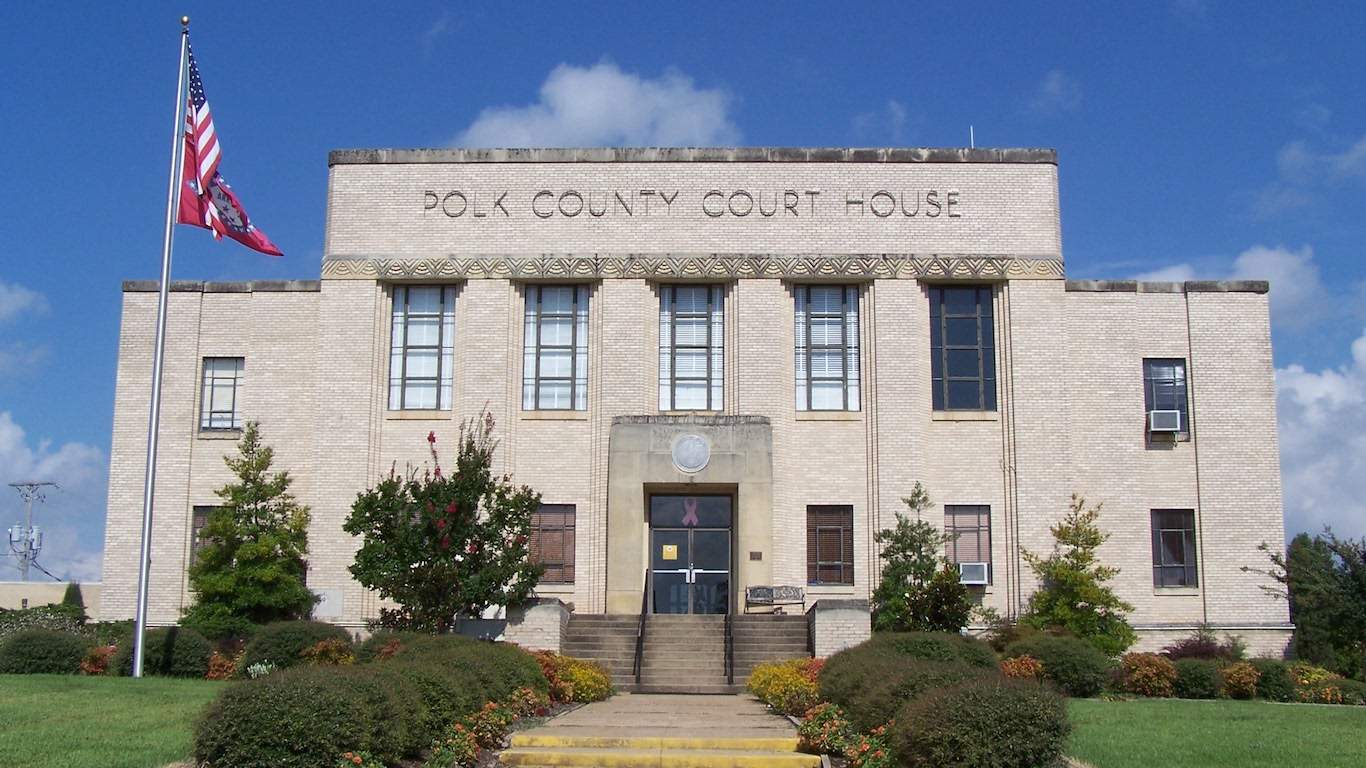
4. Polk, Arkansas
> County votes for Trump: 80.4%
> State votes for Trump: 60.4%
> White pop.: 88.7% (23rd of 75 AR counties)
> Rural pop.: 73.4% (23rd of 75 AR counties)
[in-text-ad-2]
5. Lassen, California
> County votes for Trump: 72.7%
> State votes for Trump: 32.8%
> White pop.: 65.9% (22nd of 58 CA counties)
> Rural pop.: 70.5% (7th of 58 CA counties)
6. Washington, Colorado
> County votes for Trump: 84.3%
> State votes for Trump: 44.4%
> White pop.: 88.3% (10th of 64 CO counties)
> Rural pop.: 100.0% (1st of 64 CO counties)
[in-text-ad]
7. Litchfield, Connecticut
> County votes for Trump: 54.8%
> State votes for Trump: 41.2%
> White pop.: 90.2% (1st of 8 CT counties)
> Rural pop.: 41.4% (2nd of 8 CT counties)
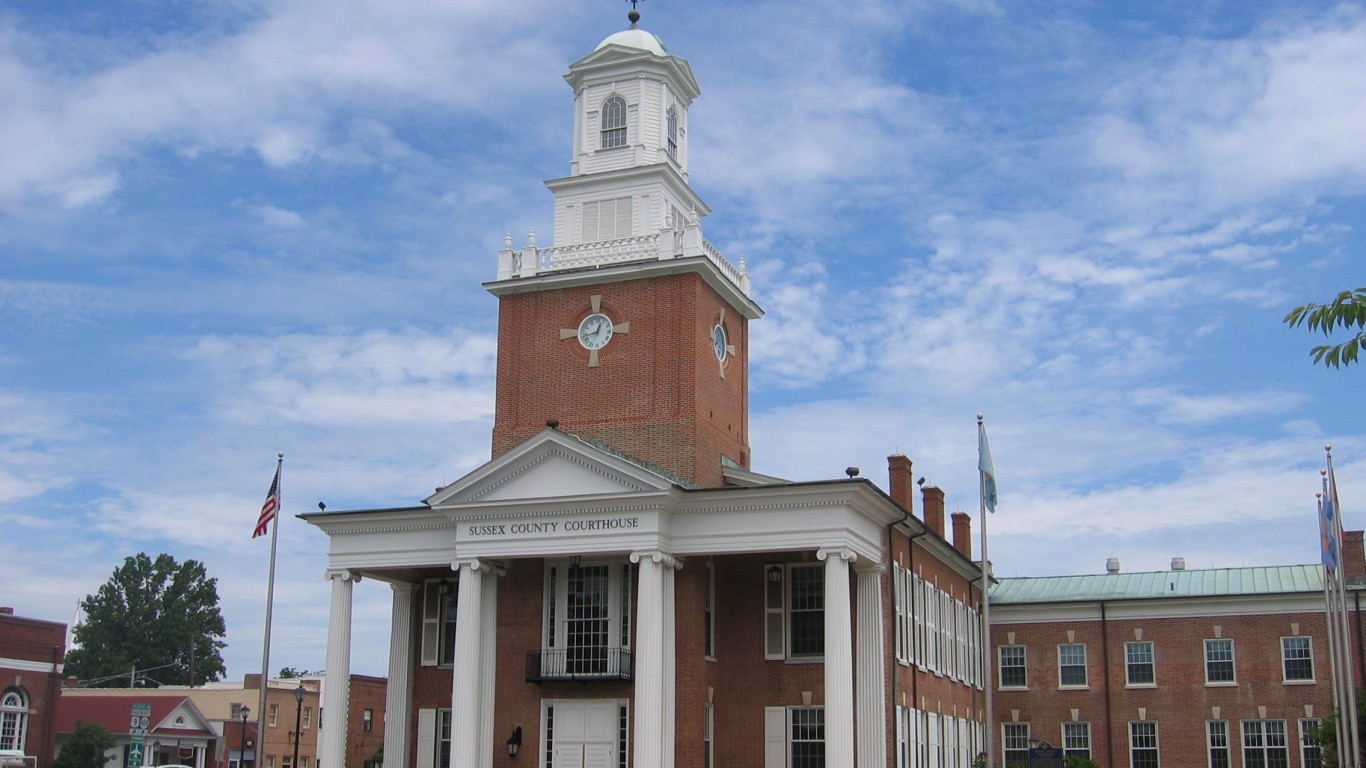
8. Sussex, Delaware
> County votes for Trump: 59.2%
> State votes for Trump: 41.9%
> White pop.: 74.8% (1st of 3 DE counties)
> Rural pop.: 41.3% (1st of 3 DE counties)
9. Holmes, Florida
> County votes for Trump: 87.9%
> State votes for Trump: 49.1%
> White pop.: 87.3% (3rd of 67 FL counties)
> Rural pop.: 78.8% (9th of 67 FL counties)
[in-text-ad-2]
10. Brantley, Georgia
> County votes for Trump: 88.5%
> State votes for Trump: 51.3%
> White pop.: 92.6% (8th of 159 GA counties)
> Rural pop.: 99.4% (25th of 159 GA counties)
11. Honolulu, Hawaii
> County votes for Trump: 31.7%
> State votes for Trump: 30.1%
> White pop.: 19.5% (4th of 5 HI counties)
> Rural pop.: 0.9% (4th of 5 HI counties)
[in-text-ad]
12. Idaho, Idaho
> County votes for Trump: 78.3%
> State votes for Trump: 59.2%
> White pop.: 91.7% (11th of 44 ID counties)
> Rural pop.: 80.6% (13th of 44 ID counties)
13. Wayne, Illinois
> County votes for Trump: 84.3%
> State votes for Trump: 39.4%
> White pop.: 96.7% (17th of 102 IL counties)
> Rural pop.: 69.9% (25th of 102 IL counties)
14. Daviess, Indiana
> County votes for Trump: 79.6%
> State votes for Trump: 57.2%
> White pop.: 93.0% (52nd of 92 IN counties)
> Rural pop.: 60.3% (40th of 92 IN counties)
[in-text-ad-2]
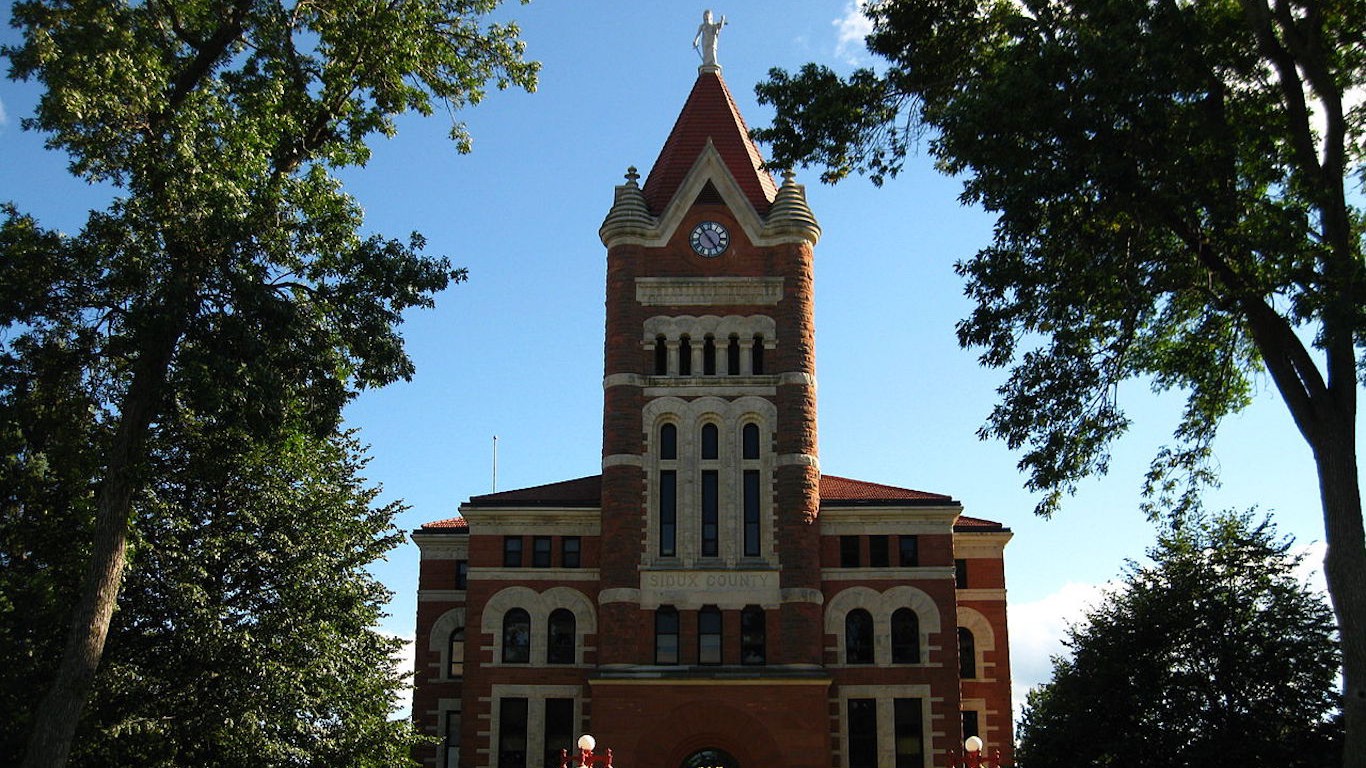
15. Sioux, Iowa
> County votes for Trump: 82.1%
> State votes for Trump: 51.8%
> White pop.: 88.3% (80th of 99 IA counties)
> Rural pop.: 50.8% (66th of 99 IA counties)
16. Scott, Kansas
> County votes for Trump: 84.9%
> State votes for Trump: 57.2%
> White pop.: 81.5% (79th of 105 KS counties)
> Rural pop.: 26.1% (91st of 105 KS counties)
[in-text-ad]
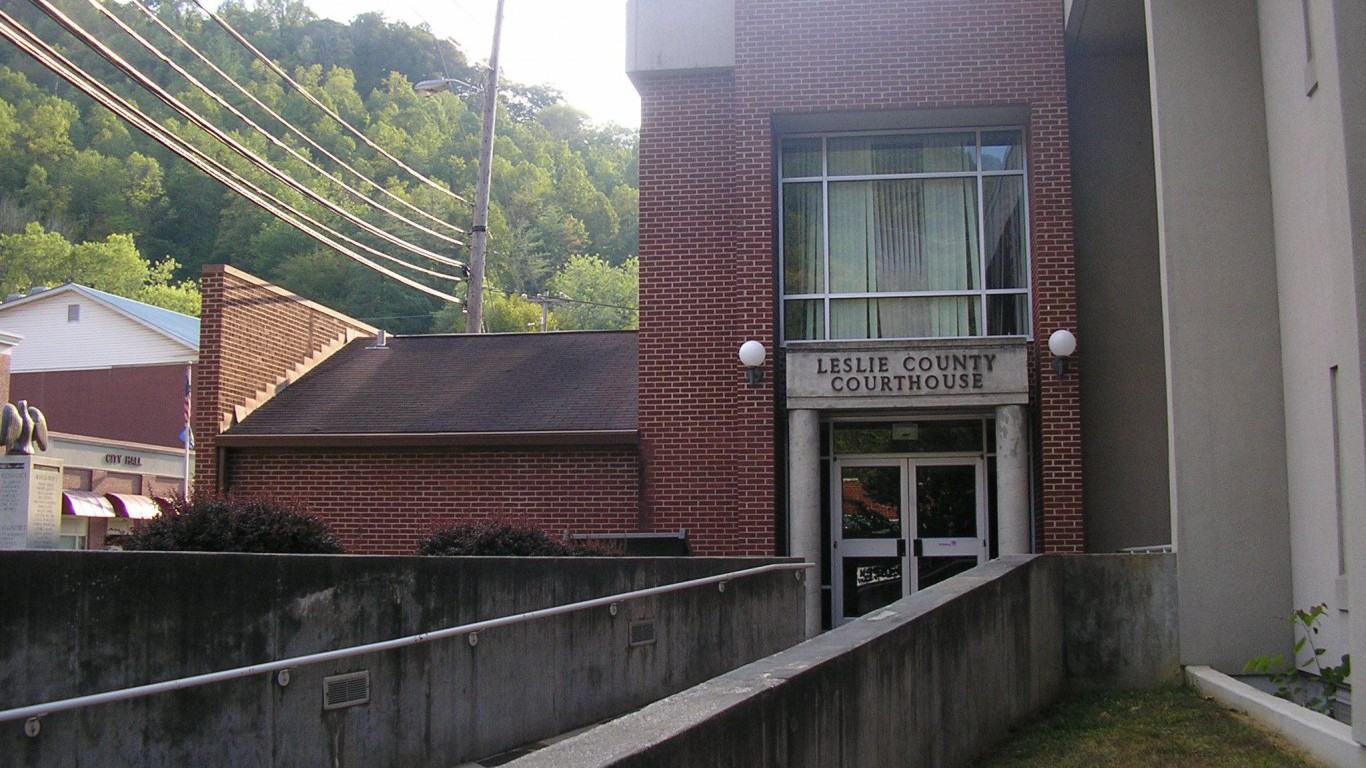
17. Leslie, Kentucky
> County votes for Trump: 89.4%
> State votes for Trump: 62.5%
> White pop.: 98.6% (4th of 120 KY counties)
> Rural pop.: 100.0% (1st of 120 KY counties)
18. LaSalle, Louisiana
> County votes for Trump: 88.8%
> State votes for Trump: 58.1%
> White pop.: 83.2% (3rd of 64 LA counties)
> Rural pop.: 73.2% (17th of 64 LA counties)
19. Piscataquis, Maine
> County votes for Trump: 59.1%
> State votes for Trump: 45.2%
> White pop.: 95.7% (7th of 16 ME counties)
> Rural pop.: 100.0% (1st of 16 ME counties)
[in-text-ad-2]
20. Garrett, Maryland
> County votes for Trump: 79.0%
> State votes for Trump: 35.3%
> White pop.: 96.7% (1st of 24 MD counties)
> Rural pop.: 83.9% (1st of 24 MD counties)
21. Plymouth, Massachusetts
> County votes for Trump: 43.4%
> State votes for Trump: 33.5%
> White pop.: 82.9% (7th of 14 MA counties)
> Rural pop.: 10.3% (7th of 14 MA counties)
[in-text-ad]
22. Missaukee, Michigan
> County votes for Trump: 73.8%
> State votes for Trump: 47.6%
> White pop.: 94.9% (23rd of 83 MI counties)
> Rural pop.: 100.0% (1st of 83 MI counties)
23. Morrison, Minnesota
> County votes for Trump: 73.7%
> State votes for Trump: 45.4%
> White pop.: 96.3% (9th of 87 MN counties)
> Rural pop.: 72.8% (31st of 87 MN counties)
24. George, Mississippi
> County votes for Trump: 88.0%
> State votes for Trump: 58.3%
> White pop.: 87.9% (3rd of 82 MS counties)
> Rural pop.: 88.3% (24th of 82 MS counties)
[in-text-ad-2]

25. Bollinger, Missouri
> County votes for Trump: 85.1%
> State votes for Trump: 57.1%
> White pop.: 96.9% (8th of 115 MO counties)
> Rural pop.: 100.0% (1st of 115 MO counties)
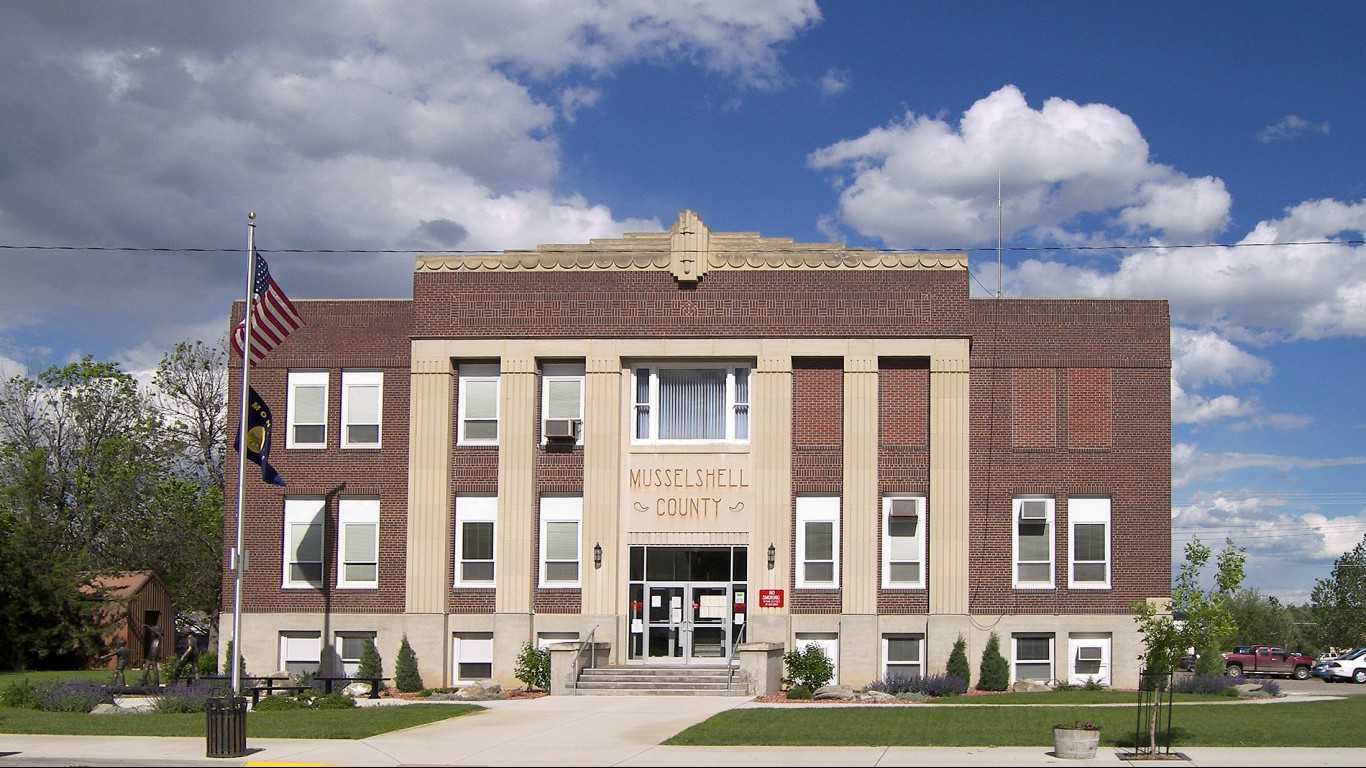
26. Musselshell, Montana
> County votes for Trump: 81.4%
> State votes for Trump: 56.5%
> White pop.: 92.5% (32nd of 56 MT counties)
> Rural pop.: 100.0% (1st of 56 MT counties)
[in-text-ad]
27. Holt, Nebraska
> County votes for Trump: 85.9%
> State votes for Trump: 60.3%
> White pop.: 94.9% (37th of 93 NE counties)
> Rural pop.: 64.7% (59th of 93 NE counties)
28. Lincoln, Nevada
> County votes for Trump: 78.4%
> State votes for Trump: 45.5%
> White pop.: 84.2% (3rd of 17 NV counties)
> Rural pop.: 100.0% (1st of 17 NV counties)
29. Belknap, New Hampshire
> County votes for Trump: 56.0%
> State votes for Trump: 47.2%
> White pop.: 95.1% (3rd of 10 NH counties)
> Rural pop.: 66.3% (3rd of 10 NH counties)
[in-text-ad-2]
30. Ocean, New Jersey
> County votes for Trump: 65.5%
> State votes for Trump: 41.8%
> White pop.: 85.1% (4th of 21 NJ counties)
> Rural pop.: 2.9% (14th of 21 NJ counties)
31. Catron, New Mexico
> County votes for Trump: 71.4%
> State votes for Trump: 40.0%
> White pop.: 79.9% (1st of 33 NM counties)
> Rural pop.: 100.0% (1st of 33 NM counties)
[in-text-ad]
32. Wyoming, New York
> County votes for Trump: 73.0%
> State votes for Trump: 37.5%
> White pop.: 89.8% (29th of 62 NY counties)
> Rural pop.: 64.1% (17th of 62 NY counties)
33. Graham, North Carolina
> County votes for Trump: 79.6%
> State votes for Trump: 50.5%
> White pop.: 88.0% (15th of 100 NC counties)
> Rural pop.: 100.0% (1st of 100 NC counties)

34. Mercer, North Dakota
> County votes for Trump: 81.4%
> State votes for Trump: 64.1%
> White pop.: 93.9% (24th of 53 ND counties)
> Rural pop.: 65.0% (40th of 53 ND counties)
[in-text-ad-2]
35. Mercer, Ohio
> County votes for Trump: 80.7%
> State votes for Trump: 52.1%
> White pop.: 96.2% (17th of 88 OH counties)
> Rural pop.: 61.4% (29th of 88 OH counties)
36. Beaver, Oklahoma
> County votes for Trump: 88.8%
> State votes for Trump: 65.3%
> White pop.: 76.0% (29th of 77 OK counties)
> Rural pop.: 100.0% (1st of 77 OK counties)
[in-text-ad]
37. Lake, Oregon
> County votes for Trump: 78.7%
> State votes for Trump: 41.1%
> White pop.: 85.6% (17th of 36 OR counties)
> Rural pop.: 63.3% (7th of 36 OR counties)
38. Fulton, Pennsylvania
> County votes for Trump: 84.2%
> State votes for Trump: 48.8%
> White pop.: 96.5% (9th of 67 PA counties)
> Rural pop.: 100.0% (1st of 67 PA counties)
39. Kent, Rhode Island
> County votes for Trump: 47.8%
> State votes for Trump: 39.8%
> White pop.: 90.2% (3rd of 5 RI counties)
> Rural pop.: 8.0% (3rd of 5 RI counties)
[in-text-ad-2]
40. Pickens, South Carolina
> County votes for Trump: 73.9%
> State votes for Trump: 54.9%
> White pop.: 86.5% (1st of 46 SC counties)
> Rural pop.: 35.8% (35th of 46 SC counties)

41. Tripp, South Dakota
> County votes for Trump: 78.7%
> State votes for Trump: 61.5%
> White pop.: 82.0% (50th of 66 SD counties)
> Rural pop.: 48.5% (48th of 66 SD counties)
[in-text-ad]
42. Wayne, Tennessee
> County votes for Trump: 86.2%
> State votes for Trump: 61.1%
> White pop.: 90.7% (47th of 95 TN counties)
> Rural pop.: 100.0% (1st of 95 TN counties)

43. Wheeler, Texas
> County votes for Trump: 90.5%
> State votes for Trump: 52.6%
> White pop.: 68.8% (85th of 254 TX counties)
> Rural pop.: 100.0% (1st of 254 TX counties)
44. Emery, Utah
> County votes for Trump: 79.8%
> State votes for Trump: 45.9%
> White pop.: 93.2% (3rd of 29 UT counties)
> Rural pop.: 73.6% (8th of 29 UT counties)
[in-text-ad-2]
45. Essex, Vermont
> County votes for Trump: 55.7%
> State votes for Trump: 32.6%
> White pop.: 95.9% (2nd of 14 VT counties)
> Rural pop.: 100.0% (1st of 14 VT counties)
46. Bland, Virginia
> County votes for Trump: 82.3%
> State votes for Trump: 45.0%
> White pop.: 93.1% (17th of 133 VA counties)
> Rural pop.: 100.0% (1st of 133 VA counties)
[in-text-ad]
47. Lincoln, Washington
> County votes for Trump: 71.9%
> State votes for Trump: 38.2%
> White pop.: 92.2% (2nd of 39 WA counties)
> Rural pop.: 100.0% (1st of 39 WA counties)
48. Grant, West Virginia
> County votes for Trump: 87.7%
> State votes for Trump: 68.7%
> White pop.: 96.7% (19th of 55 WV counties)
> Rural pop.: 78.7% (25th of 55 WV counties)
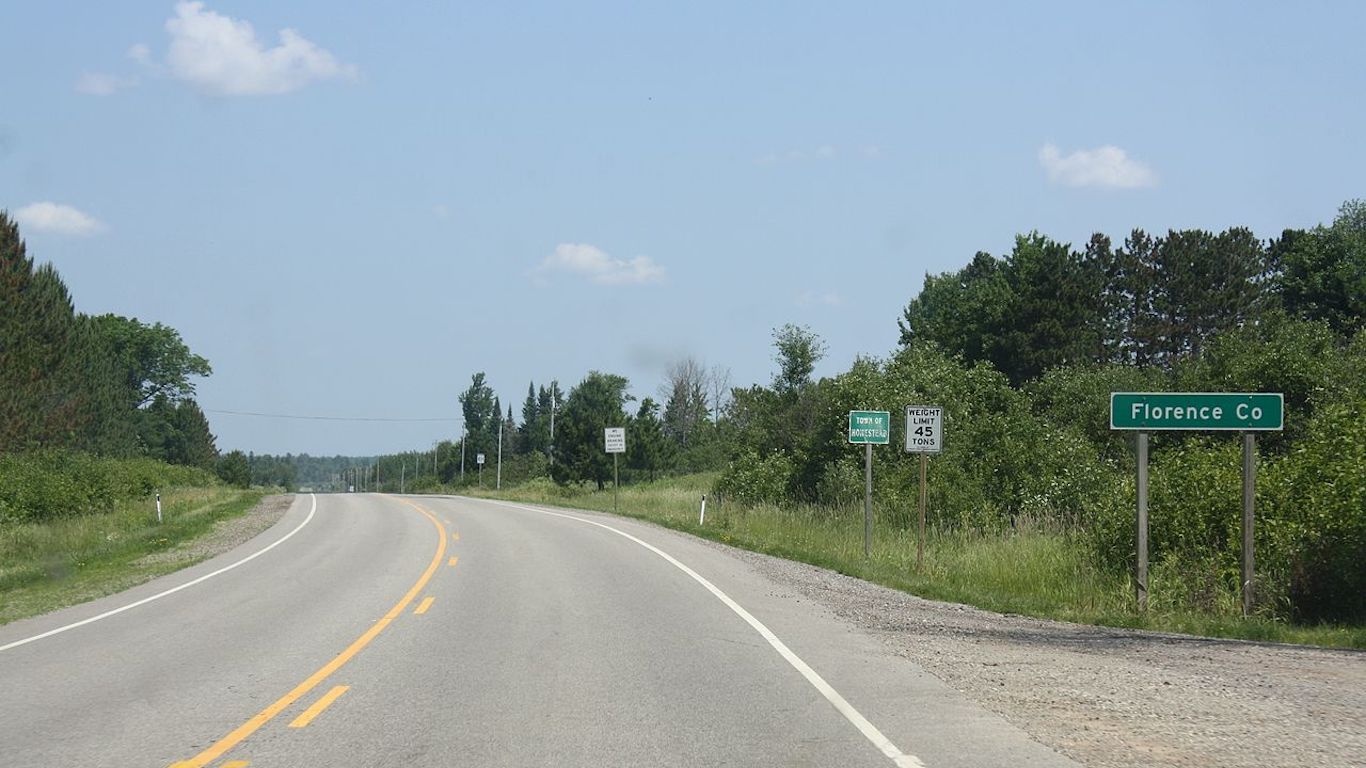
49. Florence, Wisconsin
> County votes for Trump: 71.6%
> State votes for Trump: 47.9%
> White pop.: 97.7% (1st of 72 WI counties)
> Rural pop.: 100.0% (1st of 72 WI counties)
[in-text-ad-2]
50. Crook, Wyoming
> County votes for Trump: 88.8%
> State votes for Trump: 70.1%
> White pop.: 96.8% (1st of 23 WY counties)
> Rural pop.: 100.0% (1st of 23 WY counties)
The average American spends $17,274 on debit cards a year, and it’s a HUGE mistake. First, debit cards don’t have the same fraud protections as credit cards. Once your money is gone, it’s gone. But more importantly you can actually get something back from this spending every time you swipe.
Issuers are handing out wild bonuses right now. With some you can earn up to 5% back on every purchase. That’s like getting a 5% discount on everything you buy!
Our top pick is kind of hard to imagine. Not only does it pay up to 5% back, it also includes a $200 cash back reward in the first six months, a 0% intro APR, and…. $0 annual fee. It’s quite literally free money for any one that uses a card regularly. Click here to learn more!
Flywheel Publishing has partnered with CardRatings to provide coverage of credit card products. Flywheel Publishing and CardRatings may receive a commission from card issuers.
Thank you for reading! Have some feedback for us?
Contact the 24/7 Wall St. editorial team.


Our expert who first called NVIDIA in 2009 is predicting 2025 will see a historic AI breakthrough.
You can follow him investing $500,000 of his own money on our top AI stocks for free.
 24/7 Wall St.
 24/7 Wall St.
 24/7 Wall St.