Special Report
The Best and Worst States to Grow Old
Published:
Last Updated:

The nation’s elderly population is growing. The 2010 decennial census recorded the greatest number and proportion of Americans age 65 and older ever recorded, at 40.3 million people, or 13% of the U.S. population. Today, nearly 15% of the U.S. population is 65 or older, and that share is expected to continue to increase in coming years. According to the U.S. Census Bureau, Americans 65 and older will comprise over 20% of the population before 2050.
State officials, families, and elderly individuals will likely need to spend increasingly large resources and time considering the role of older community residents. Circumstantial factors such as weather preference and the presence of friends and family play a major role in the quality of life for elderly residents. Based on relatively material indicators, including health, labor markets, amenities, and access to medical facilities, elderly populations in some states are better off than in others.
[in-text-ad]
Further, while Americans of all ages face everyday economic, social, and medical challenges, low income, poverty, violent crime, medical expenses, and other such difficulties disproportionately affect older people. Most older Americans will require some level of support sooner or later, and many elderly individuals need long-term care and support services. The experience of growing old can also differ substantially between states.
Click here to see the best and worst states to grow old in.
Many, if not most, of America’s seniors rely heavily on a combination of Social Security, Medicare, and modest retirement income. Due to political changes, expenditures on these government programs are likely to decline rather than increase, leaving many elderly in a state of greater financial uncertainty. There are also few alternatives. Even for older Americans who supplement their income with wages, this income is unlikely to rise substantially. The typical elderly household earns $40,971 annually, and only about half of people 65 and over report having retirement income such as pension payments and 401k withdrawals in addition to Social Security. States where the elderly median household income and the share of seniors with supplemental retirement income were lower than average were considered worse off than other states.
The physical decline that comes with age means disabilities are considerably more likely among older individuals. While largely unavoidable, being disabled in old age is more likely in some states than in others. Nationwide, 35.4% of Americans 65 and over report having some form of disability. A state’s position in the ranking fell the more the elderly disability rate exceeded the national figure. Of the 25 states on the lower end of our list, 16 have above average disability rates among elderly residents. In seven states, all in the top 20, over 40% of seniors report a disability.
The crude annual mortality rate for elderly populations is another indication of health. Nationwide, there are 4,261 deaths per 100,000 people 65 and older a year When the mortality rate far exceeds the national incidence and that of other states, it is likely that adverse health leading to premature death is partially to blame.
Research has shown that elderly people — especially those in poor health and with disabilities — are at greater risk of abuse than other age cohorts. Low social support is among the many factors that significantly increases the odds of mistreatment. Nationwide, there are approximately 30 social establishments per 10,000 people. These include performing arts companies, sports stadiums, museums, historical sites, libraries, bars, casinos, golf course and country clubs, religious organizations, and many other venues. Because the concentration of such organizations in a state pushes up its ranking, they are relatively abundant in the best states to grow old in. The social establishment to 10,000 person ratio exceeds 40 in just six states, all in the top 15.
In addition to reducing the odds of mistreatment, isolation, exclusion, and neglect, the presence of these amenities can of course also be major positive forces for a community’s elderly residents.
Click here to read our methodology.
These are the best and worst states in which to grow old.
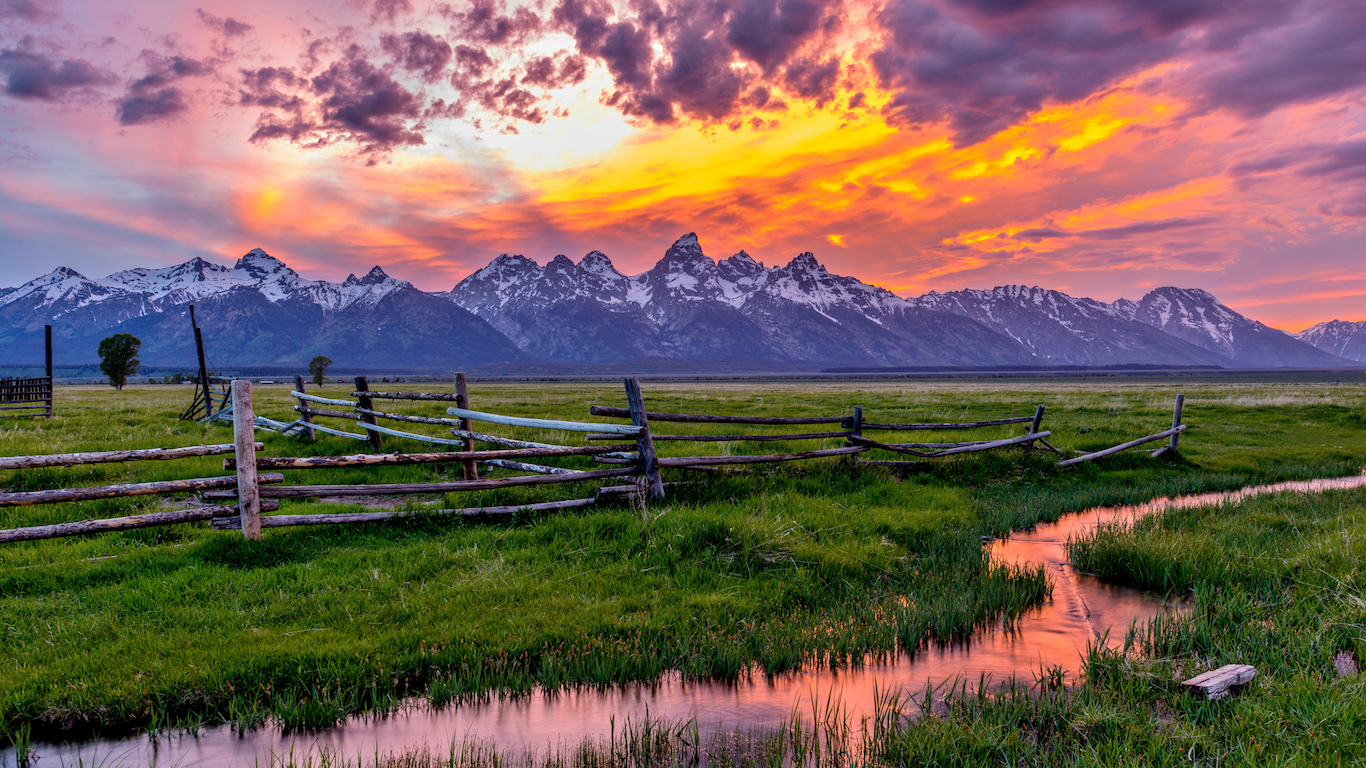
1. Wyoming
> Pct. of pop. age 65 and up: 14.1% (8th lowest)
> 65 and over poverty rate: 8.0% (24th lowest)
> 65 and over bachelor attainment: 27.7% (19th highest)
> Life expectancy at birth: 78.5 years (18th lowest)
Based on a range of metrics, Wyoming is the best state in which to grow old. The physical decline that comes with aging means access to nearby medical facilities is especially beneficial for elderly communities. In Wyoming, There are 4.4 hospitals for every 100,000 residents, the sixth most of all states and several times the nationwide 1.4 hospitals to 100,000 person ratio. Because elderly adults are relatively vulnerable to isolation and exclusion, the presence of social establishments such as historical sites, museums, restaurants, and religious organizations can also play a major role in quality of life for older adults. In Wyoming, there are over 40 such establishments for every 10,000 residents, sixth highest concentration of states and well above the national ratio of 30.1 venues to 10,000 person.
[in-text-ad]
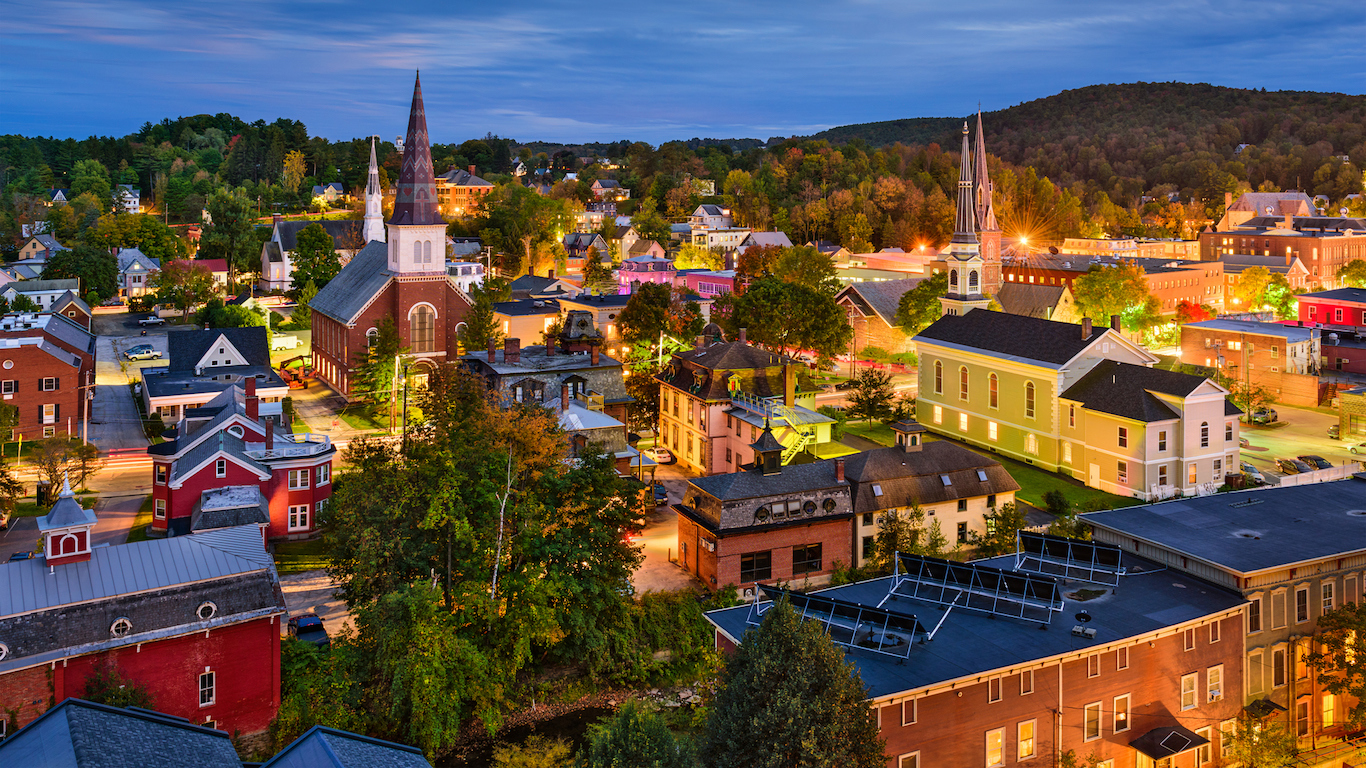
2. Vermont
> Pct. of pop. age 65 and up: 17.6% (4th highest)
> 65 and over poverty rate: 6.6% (4th lowest)
> 65 and over bachelor attainment: 36.5% (the highest)
> Life expectancy at birth: 79.8 years (12th highest)
Safety and opportunities for social inclusion are both important parts of a positive environment for senior citizens, and Vermont has one of the best of any state. The Green Mountain State has the lowest violent crime rate in the country, with just 118 reported incidents for every 100,000 people. The comparable national violent crime rate is 373 incidents per 100,000 people. Vermont is also relatively rich with opportunities for social engagement for the elderly, with more social establishments per capita than any state except for Montana.
Senior citizens in Vermont are also among the most likely to have a college degree, and are therefore more likely to hold, or to have held jobs that pay well. A college education has many other benefits.
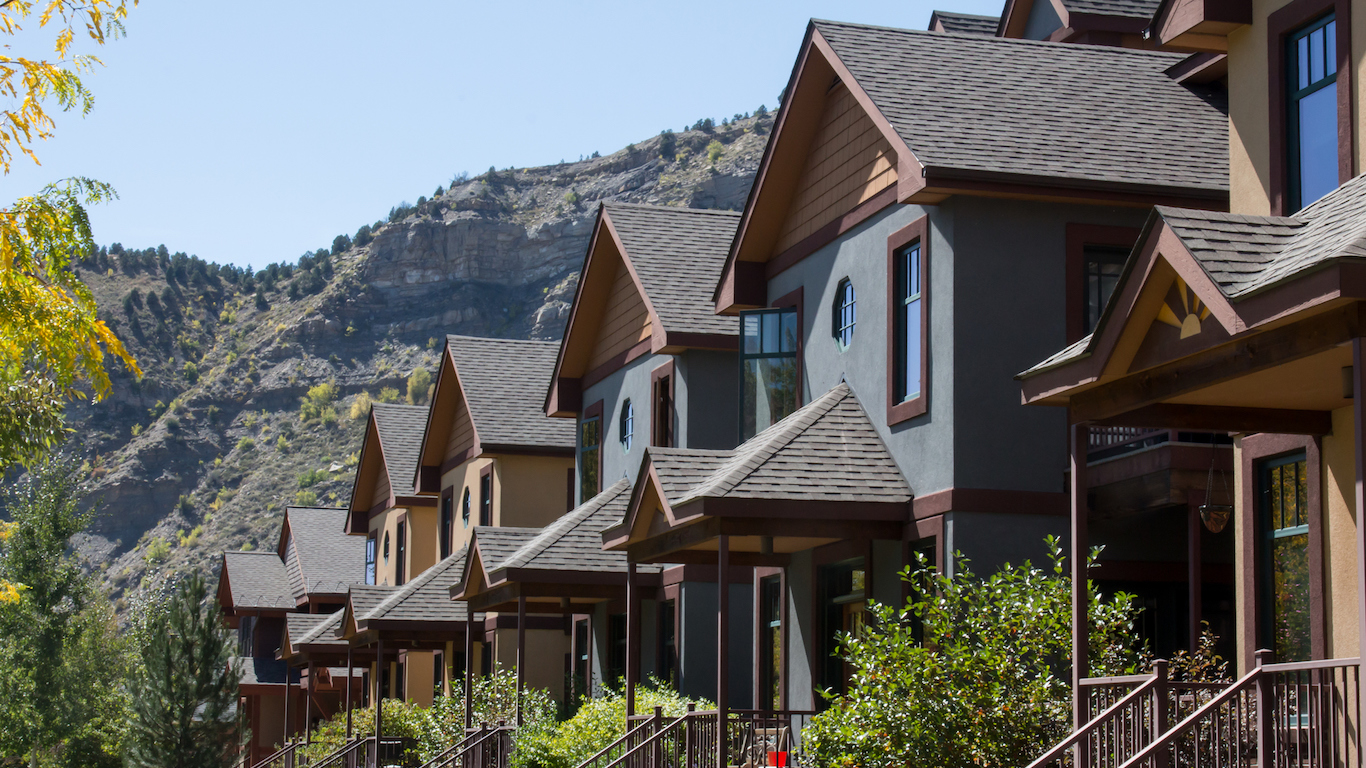
3. Colorado
> Pct. of pop. age 65 and up: 13.0% (5th lowest)
> 65 and over poverty rate: 7.0% (8th lowest)
> 65 and over bachelor attainment: 36.3% (2nd highest)
> Life expectancy at birth: 80.3 years (7th highest)
Elderly households often have fixed incomes, which increases the importance of an area’s affordability. Colorado is more expensive to live in than most states, but expensive living is more than offset by high incomes among the state’s elderly population. The typical elderly Colorado household has an annual income of $46,946, the 10th highest of all states and well above the national 65 and over median household income of $40,971 a year. Similarly, Colorado’s elderly poverty rate of 7% is one of the lowest compared with other states.

4. Montana
> Pct. of pop. age 65 and up: 17.3% (5th highest)
> 65 and over poverty rate: 7.6% (19th lowest)
> 65 and over bachelor attainment: 29.0% (15th highest)
> Life expectancy at birth: 78.8 years (22nd lowest)
Because elderly adults are relatively vulnerable to isolation and exclusion, the presence of social establishments such as movie theaters, casinos, bars, and golf courses can play a major role in the quality of life for older adults. In Montana, there are approximately 50 such establishments for every 10,000 residents, the highest concentration of all states and well above the national 30.1 venues to 10,000 person ratio.
The percentage of a state’s population over 65 years old was not used in our ranking of the best and worst states to grow old. However, an especially high share of seniors in a state certainly could be an indication of favorable conditions. Montana has the fifth largest share of elderly population, at 17.3% of residents.
[in-text-ad-2]
5. South Dakota
> Pct. of pop. age 65 and up: 15.7% (21st highest)
> 65 and over poverty rate: 8.3% (25th lowest)
> 65 and over bachelor attainment: 23.2% (17th lowest)
> Life expectancy at birth: 79.5 years (19th highest)
The elderly are much more likely than younger people to fall dangerously ill, or to suffer from a debilitating chronic disease. For this reason, the availability of quality medical care in an area is an important. In South Dakota, there are nearly six hospitals per 100,000 residents, the most of any state and far more than the 1.4 hospitals per 100,000 residents nationwide ratio.
Social activities such as museums, clubs and organizations, and performing arts center can provide purpose and prevent loneliness for the elderly. South Dakota has 43.9 such organizations per 10,000 people, third highest concentration in the country.

6. New Hampshire
> Pct. of pop. age 65 and up: 16.4% (9th highest)
> 65 and over poverty rate: 6.1% (2nd lowest)
> 65 and over bachelor attainment: 31.2% (7th highest)
> Life expectancy at birth: 80.1 years (10th highest)
Poverty affects people of all ages in the United States. However, for the elderly, who frequently live on fixed incomes and are more likely to struggle to be financially independent, financial hardship can be especially troublesome. With a 65 and over poverty rate of just 6.1%, second lowest of U.S. states, New Hampshire’s elderly population faces relatively little financial hardship compared with other states. Generally speaking, older individuals are also at greater risk than others in unsafe communities. However, with a violent crime rate of less than 200 incidents per 100,000 people, nearly the lowest in the country, New Hampshire is one of the best state to grow old in.
[in-text-ad]

7. Minnesota
> Pct. of pop. age 65 and up: 14.7% (17th lowest)
> 65 and over poverty rate: 6.9% (6th lowest)
> 65 and over bachelor attainment: 26.8% (21st highest)
> Life expectancy at birth: 80.7 years (4th highest)
The elderly are far more likely to suffer from a disability that can drastically worsen their quality of life. In the United States, 35.4% of adults 65 and over have a disability of some kind. In Minnesota, 32% of the age group have a disability, the fifth smallest share in the country. Perhaps as further evidence of the generally better health and quality of life in Minnesota, the average resident can expect to live to 80.7 years, the fourth highest life expectancy of any state.

8. Washington
> Pct. of pop. age 65 and up: 14.5% (13th lowest)
> 65 and over poverty rate: 7.4% (17th lowest)
> 65 and over bachelor attainment: 31.8% (5th highest)
> Life expectancy at birth: 80.2 years (9th highest)
Compared with other states, Washington’s elderly population is well educated and well-off financially. Higher education can improve quality of life in a myriad of ways, including leading to higher-paying jobs. For elderly members of the labor market higher incomes can help improve financial security when income is fixed. Nationwide, 25.8% of people 65 and older have completed at least a bachelor’s degree, while in Washington, 31.8% of elderly residents have, the fifth highest rate of all states. The typical elderly household in the state earns an annual income of $46,144, one of the higher median annual incomes in the country.
9. Oregon
> Pct. of pop. age 65 and up: 16.4% (11th highest)
> 65 and over poverty rate: 7.3% (15th lowest)
> 65 and over bachelor attainment: 29.2% (14th highest)
> Life expectancy at birth: 79.5 years (17th highest)
For millions of senior citizens, financial security is extremely tenuous. Many have no additional sources of income beyond Social Security. Elderly residents in Oregon are more likely to be financially secure. Just 7.3% of state residents 65 and older live in poverty, compared to a national elderly poverty rate of 9.0%. Nearly 52% have retirement income of some kind, such as a pension, higher than the national share of 49.1%. Oregon also has 36.9 social establishments such as clubs, museums, and performing arts centers per 10,000 residents, the 10th highest ratio among states.
Because expectancy has increased through improvements in medicine and health care, people must work longer in order to create the necessary nest egg. In Oregon, a relatively high 29% of seniors have a bachelor’s degree, which makes them more likely to earn a wage that pays well enough to comfortably live and eventually retire on.
[in-text-ad-2]
10. Virginia
> Pct. of pop. age 65 and up: 14.2% (10th lowest)
> 65 and over poverty rate: 7.3% (15th lowest)
> 65 and over bachelor attainment: 29.5% (13th highest)
> Life expectancy at birth: 79.1 years (25th lowest)
Unlike millions of senior citizens nationwide, Virginia’s elderly residents are among the most likely in the country to be financially secure. Among state residents 65 and older, 55.0% receive retirement income from pensions, 401ks, and other sources, compared to 49.1% of all seniors nationwide. The median income of households with senior citizens in the state is $47,402 a year, about $6,400 higher than the median household income for all Americans 65 and over.
11. Maine
> Pct. of pop. age 65 and up: 18.8% (2nd highest)
> 65 and over poverty rate: 8.8% (19th highest)
> 65 and over bachelor attainment: 30.4% (8th highest)
> Life expectancy at birth: 79.1 years (25th highest)
Of people living in Maine, 18.8% are 65 or older, the second largest such share after only Florida. While partially due to younger residents leaving the state, the high share could certainly also indicate favorable living conditions for older Mainers. Housing is relatively affordable in Maine. While nationwide most renters aged 65 and over spend about a third or more of their income on rent, in Maine just 41% spend such a large portion of their income on rent, the second lowest such share. Adults of any age living in Maine are also considerably more likely than people in other states to have a personal doctor, which is often critical for older individuals. Just 11.6% of adults in Maine do not have a personal doctor, the third lowest share of all states and close to half the national percentage of 21.5%.
[in-text-ad]

12. North Dakota
> Pct. of pop. age 65 and up: 14.2% (11th lowest)
> 65 and over poverty rate: 8.9% (18th highest)
> 65 and over bachelor attainment: 19.8% (7th lowest)
> Life expectancy at birth: 79.5 years (18th highest)
Seniors living in North Dakota are not especially financially well-off, nor are they especially well educated. The median income for elderly households in North Dakota is $36,971 a year, and fewer than 20% of adults 65 and over have at least bachelor’s degree, each among the lowest figures of all states. Affordability, as well as plenty of social establishments and medical facilities, however, help make North Dakota one of the better states to grow old in. Goods and services in the state cost approximately 8.5% less than the national average. Also, for every 10,000 North Dakotans, there are 41 social establishments — including social advocacy groups, zoos, sports facilities, bowling lanes, and bed-and-breakfast inns — the fifth highest concentration of such venues. There are also close to six hospitals for every 100,000 people, several times the 1.4 hospital to 100,000 person ratio nationwide.
13. Connecticut
> Pct. of pop. age 65 and up: 15.7% (19th highest)
> 65 and over poverty rate: 7.2% (11th lowest)
> 65 and over bachelor attainment: 31.3% (6th highest)
> Life expectancy at birth: 80.8 years (3rd highest)
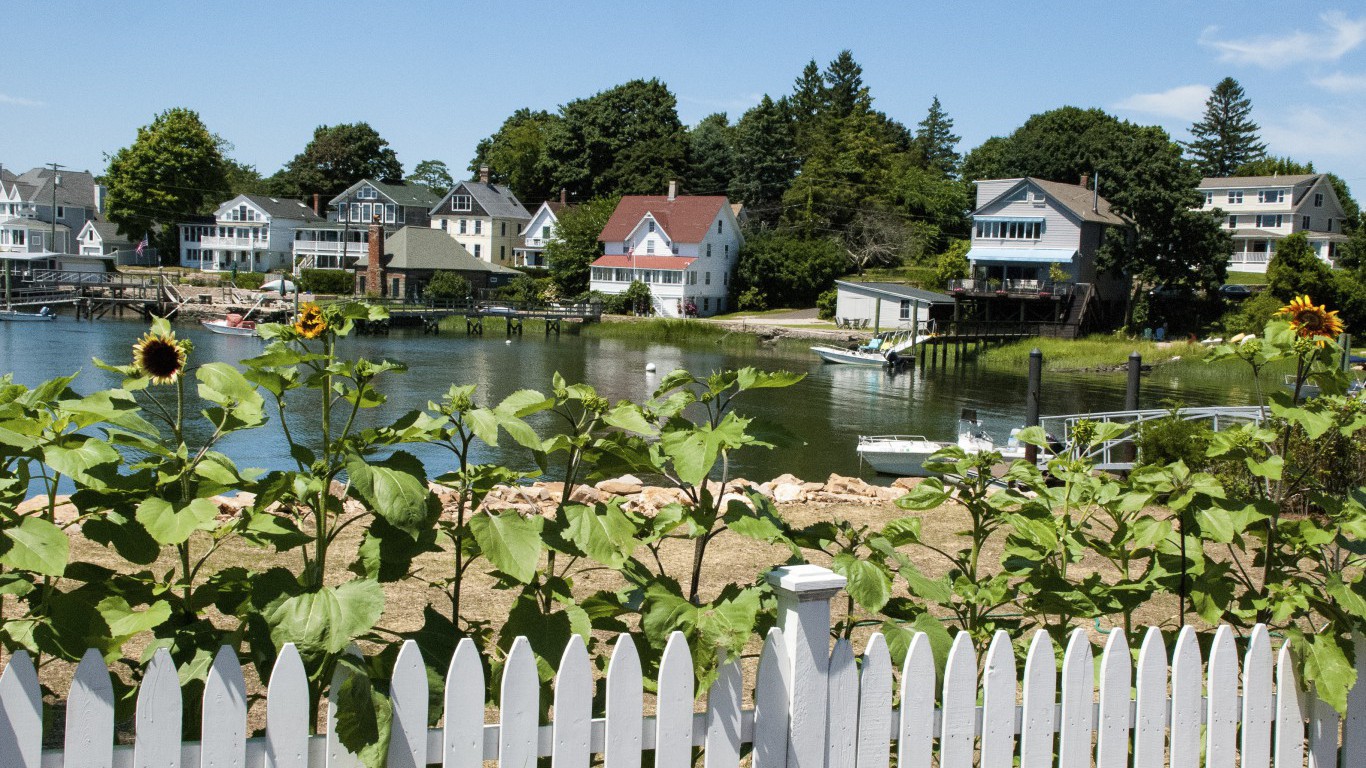
Many elderly Americans struggle to achieve financial independence and security. As many of them stop working, they rely exclusively on Social Security and their savings. In Connecticut, seniors are more likely to be well off. The typical elderly household has an annual income of nearly $50,000, about $9,000 more than the median income for elderly households nationwide. Senior citizens also struggle more often than other age groups with a disability — 35.4% of all Americans 65 and older have some kind of debilitating chronic condition. In Connecticut, just 31.0% of seniors have such a disability, the lowest proportion of any state.
14. Nebraska
> Pct. of pop. age 65 and up: 14.7% (18th lowest)
> 65 and over poverty rate: 7.4% (17th lowest)
> 65 and over bachelor attainment: 22.8% (16th lowest)
> Life expectancy at birth: 79.5 years (20th highest)
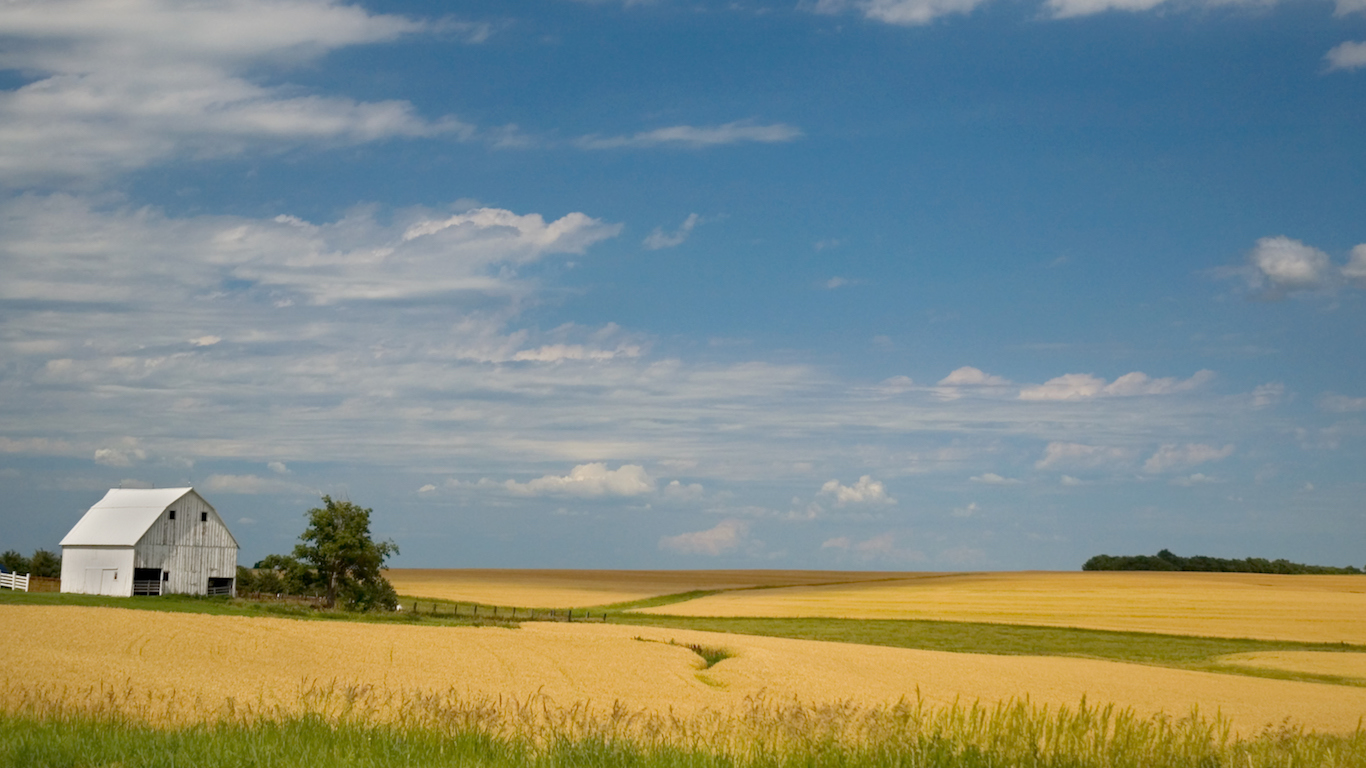
Entertainment venues, social organizations, and other institutions can combat isolation and improve the quality of life of the elderly in a given area. These include performing arts companies, sports stadiums, museums, historical sites, libraries, bars, casinos, golf course and country clubs, religious organizations, and many other venues. In Nebraska, there are 36.8 such social establishments for every 10,000 residents, compared to the 30.1 per 10,000 people nationwide. Nebraska’s elderly also have easier access to medical facilities with 4.7 hospitals for every 100,000 state residents, the fourth highest ratio in the country.
[in-text-ad-2]

15. Idaho
> Pct. of pop. age 65 and up: 14.7% (19th lowest)
> 65 and over poverty rate: 8.7% (20th highest)
> 65 and over bachelor attainment: 24.5% (22nd lowest)
> Life expectancy at birth: 79.2 years (23rd highest)
Generally, older individuals are at greater risk than others in unsafe communities. Therefore, a low violent crime rate is especially important for elderly residents. Idaho’s violent crime rate of 215.6 incidents per 100,000 people is among the lowest of all states.
Elderly Idahoan households are not especially well-off financially, with a median income of $37,321 a year. To compare, the typical elderly household nationwide earns an annual income of $40,971. However, the homeownership rate among elderly householders, at 84.1% is third highest of all states.
16. Wisconsin
> Pct. of pop. age 65 and up: 15.6% (23rd highest)
> 65 and over poverty rate: 7.1% (9th lowest)
> 65 and over bachelor attainment: 22.1% (14th lowest)
> Life expectancy at birth: 79.6 years (15th highest)
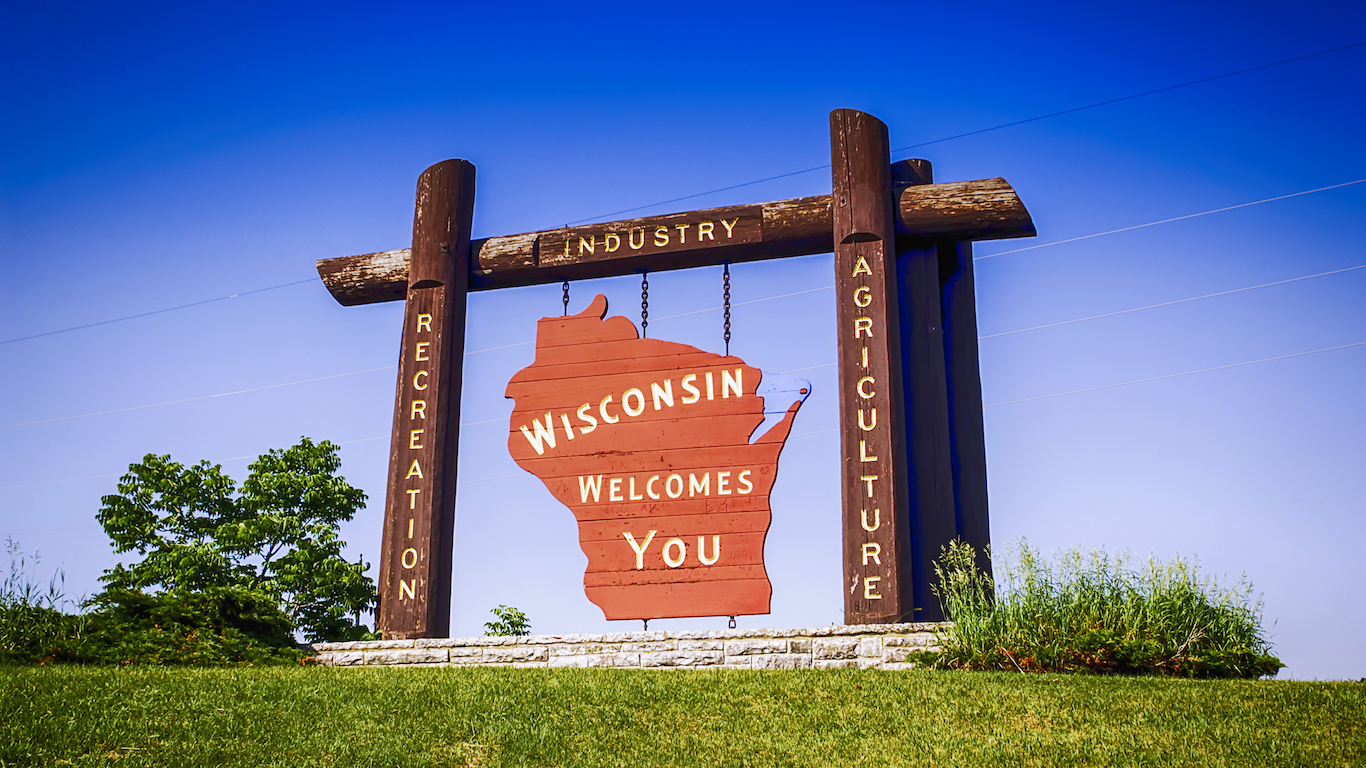
Risk of life-altering mental or physical disability dramatically increases with age. Across the country, 35.4% of Americans 65 and over struggle with a disability. In Wisconsin, the disability rate is much lower, at just 31.7% of seniors, the third-lowest proportion of any state. For Wisconsin seniors who suffer from a disability, access to medical facilities for treatment is easier than in most states. There are 2.1 hospitals per 100,000 state residents, compared to a 1.4 hospitals per 100,000 person ratio nationwide.
[in-text-ad]
17. Massachusetts
> Pct. of pop. age 65 and up: 15.4% (25th highest)
> 65 and over poverty rate: 9.2% (15th highest)
> 65 and over bachelor attainment: 32.1% (4th highest)
> Life expectancy at birth: 80.7 years (5th highest)
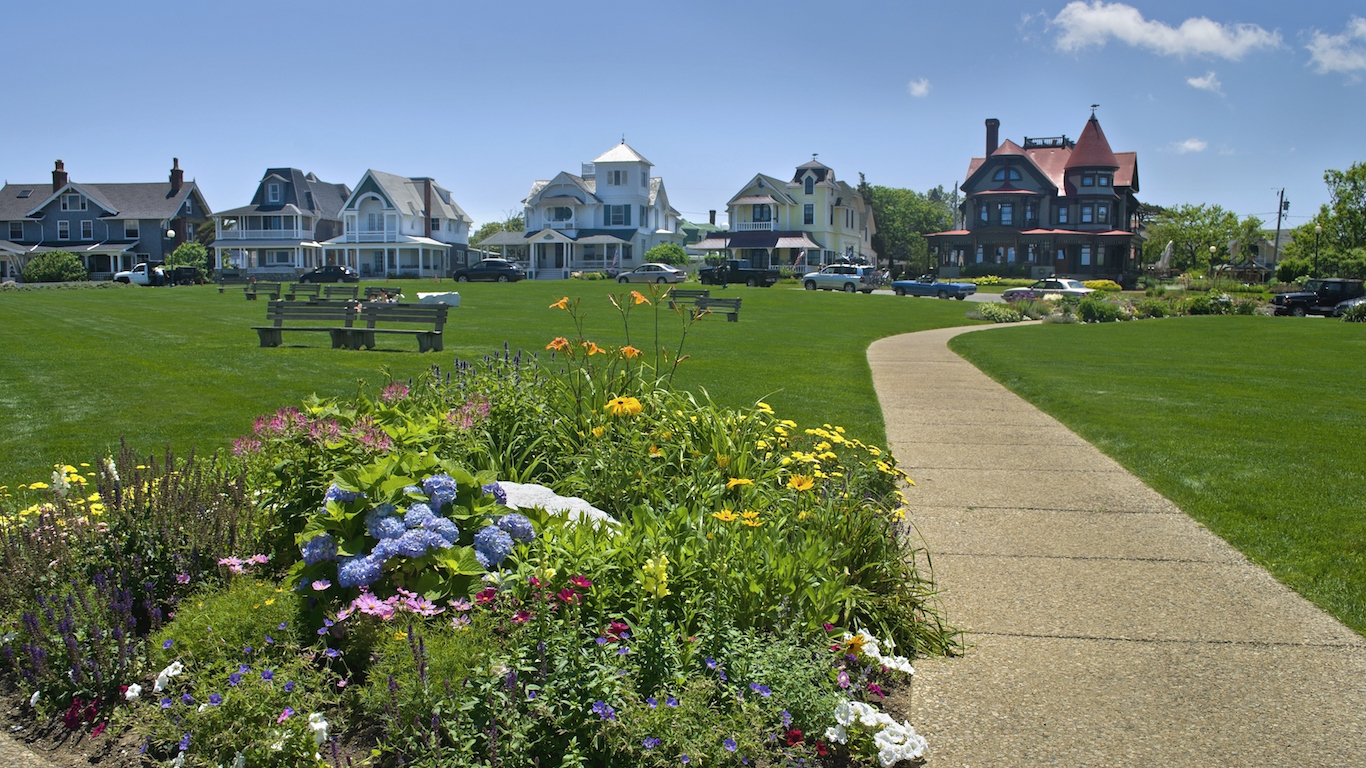
While 65 is considered by many the target age for retirement, many senior citizens continue to work, either out of financial necessity or because it gives a continued sense of purpose and dignity. In Massachusetts, 32.1% of seniors have a bachelor’s degree, a far higher share than the 25.8% of seniors nationwide. Seniors with a degree are more likely to earn higher incomes and live a comfortable and financially independent life.
18. Iowa
> Pct. of pop. age 65 and up: 16.0% (15th highest)
> 65 and over poverty rate: 7.0% (8th lowest)
> 65 and over bachelor attainment: 19.7% (6th lowest)
> Life expectancy at birth: 79.3 years (21st highest)
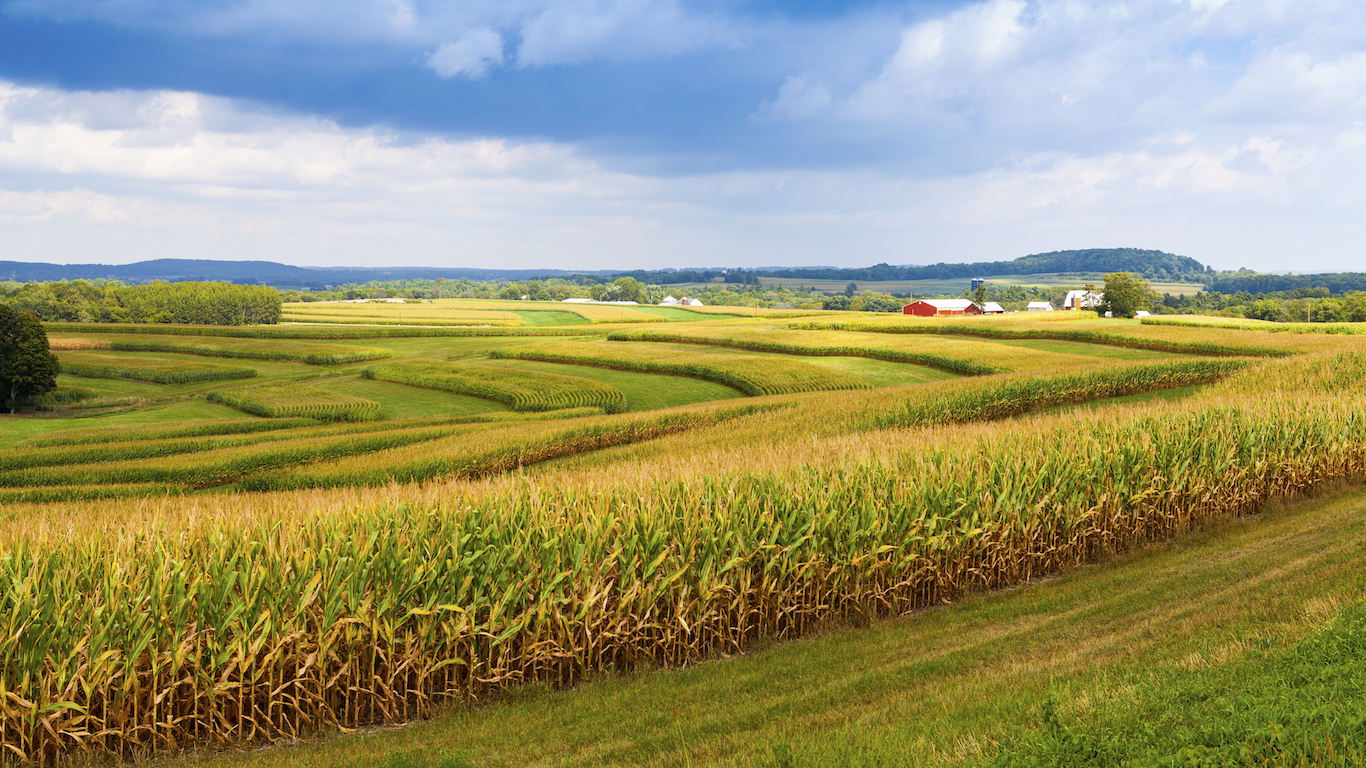
A large share of senior citizens lives on a fixed income, which makes the affordability of essential goods and services in an area a key to financial security. In Iowa, the typical elderly household has an income of $40,144 a year, which is slightly below the U.S. median income for the elderly. However, goods and services in Iowa tend to be very inexpensive, costing about 10 cents less for every dollar spent compared to the nation as a whole.
19. Delaware
> Pct. of pop. age 65 and up: 17.0% (7th highest)
> 65 and over poverty rate: 6.2% (3rd lowest)
> 65 and over bachelor attainment: 26.2% (23rd highest)
> Life expectancy at birth: 78.8 years (24th lowest)
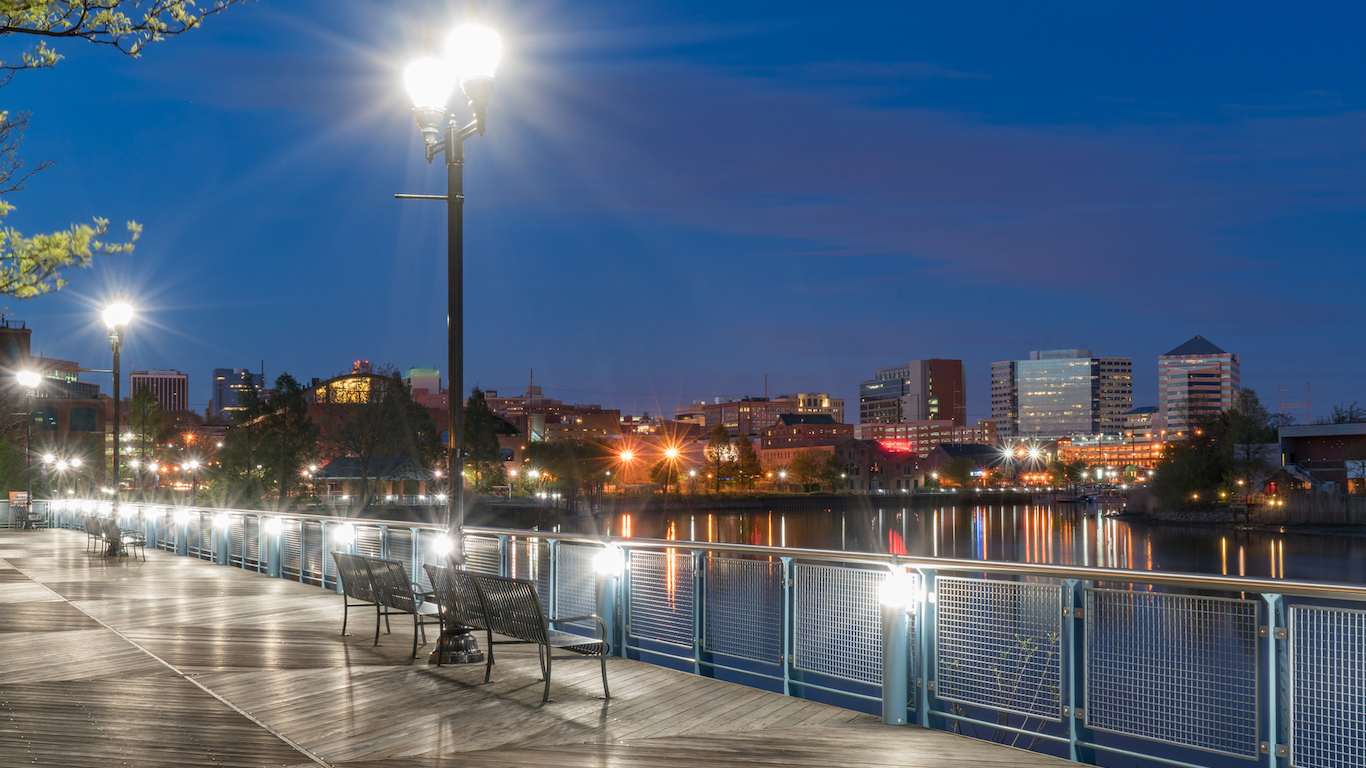
Elderly Delaware residents report the third lowest poverty rate of all states, at 6.2%. The low level of financial hardship is likely largely due to the large share of 65 and older Delaware residents who have retirement income in addition to Social Security, which at 58.5% is the highest of all states. This includes income such as pension payments, 401k withdrawals, and investment returns. Older state residents also report relatively good physical health compared to other states. Of residents 65 and over, 31.5% have a disability, the second lowest share of all states. For reference, 35.4% of all elderly Americans report a disability of any kind.
[in-text-ad-2]

20. Hawaii
> Pct. of pop. age 65 and up: 16.6% (8th highest)
> 65 and over poverty rate: 7.8% (22nd lowest)
> 65 and over bachelor attainment: 28.8% (16th highest)
> Life expectancy at birth: 81.2 years (the highest)
A large share of senior citizens lives on a fixed income, which heightens the importance of the cost of goods and services. Unfortunately for those elderly Hawaiians relying exclusively on Social Security, the cost of goods and services, including housing and medical treatment, is the highest of any state and 17% higher than the average cost nationwide. However, elderly Hawaiians are more likely to be able to afford these higher prices, as the typical senior citizen household earns $62,885 in annual income, the highest of any state.
21. Kansas
> Pct. of pop. age 65 and up: 14.6% (16th lowest)
> 65 and over poverty rate: 7.3% (15th lowest)
> 65 and over bachelor attainment: 25.7% (25th highest)
> Life expectancy at birth: 78.6 years (19th lowest)
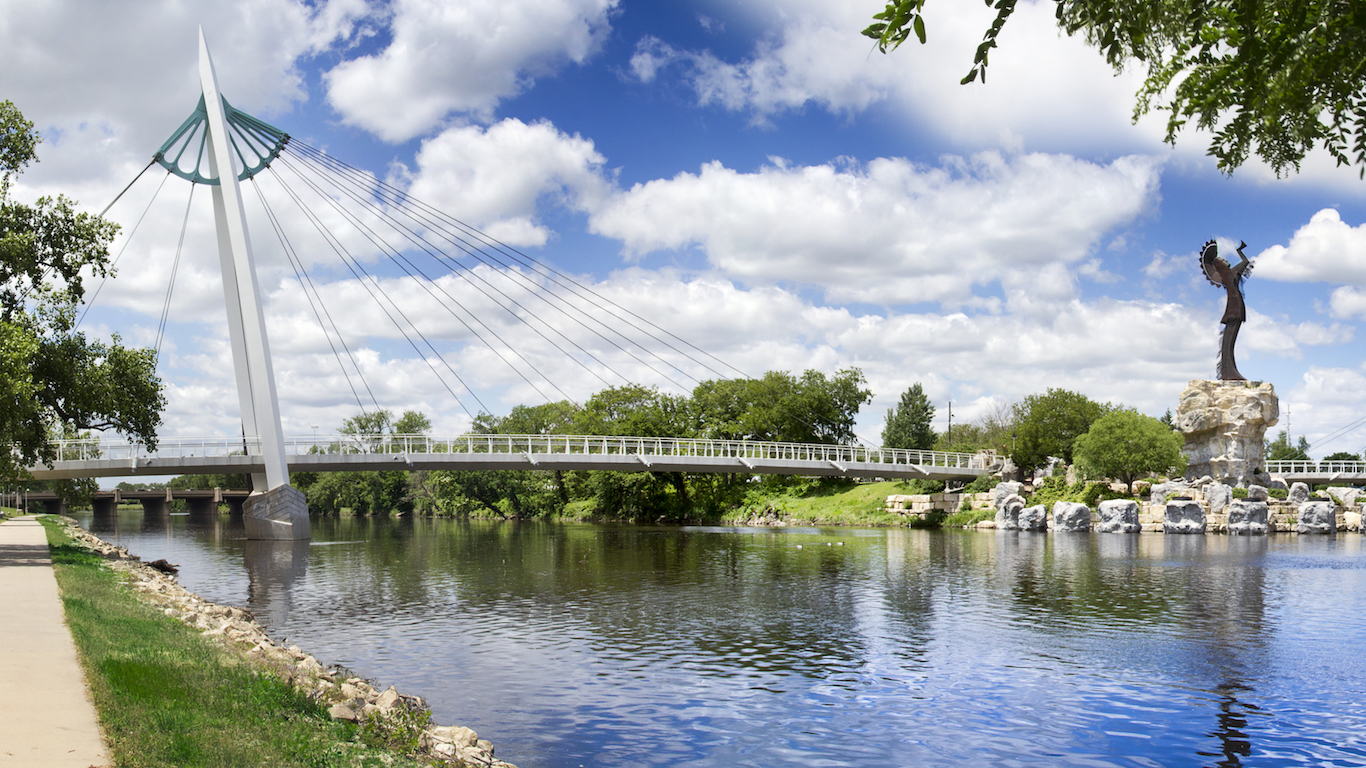
The physical decline that comes with aging means access to nearby medical facilities is especially beneficial for elderly communities. While seniors living in Kansas are not especially better off than elderly populations in most states, there are nearly five hospitals for every 10,000 residents in the state, the fifth highest concentration of all states. Kansas residents 65 and over, many of whom likely do not expect their incomes to rise significantly beyond current levels, also benefit from the state’s low cost of living. On average, goods and services in Kansas cost nearly 10% less than they do nationwide.
[in-text-ad]

22. Arizona
> Pct. of pop. age 65 and up: 16.4% (10th highest)
> 65 and over poverty rate: 9.0% (17th highest)
> 65 and over bachelor attainment: 27.8% (18th highest)
> Life expectancy at birth: 79.6 years (16th highest)
Arizona’s elderly population appears to be relatively healthy. The state has a very low annual elderly mortality rate, at just 3,569 deaths per 100,000 residents 65 and older, compared to a national elderly mortality rate of 4,260 per 100,000 seniors. However, those who live longer may be lonelier and less engaged. Arizona has just 22.2 social establishments such as clubs, artistic venues, and recreational facilities for every 10,000 residents, the second lowest proportion in the country.
23. Maryland
> Pct. of pop. age 65 and up: 14.1% (9th lowest)
> 65 and over poverty rate: 7.3% (15th lowest)
> 65 and over bachelor attainment: 32.6% (3rd highest)
> Life expectancy at birth: 79.3 years (22nd highest)
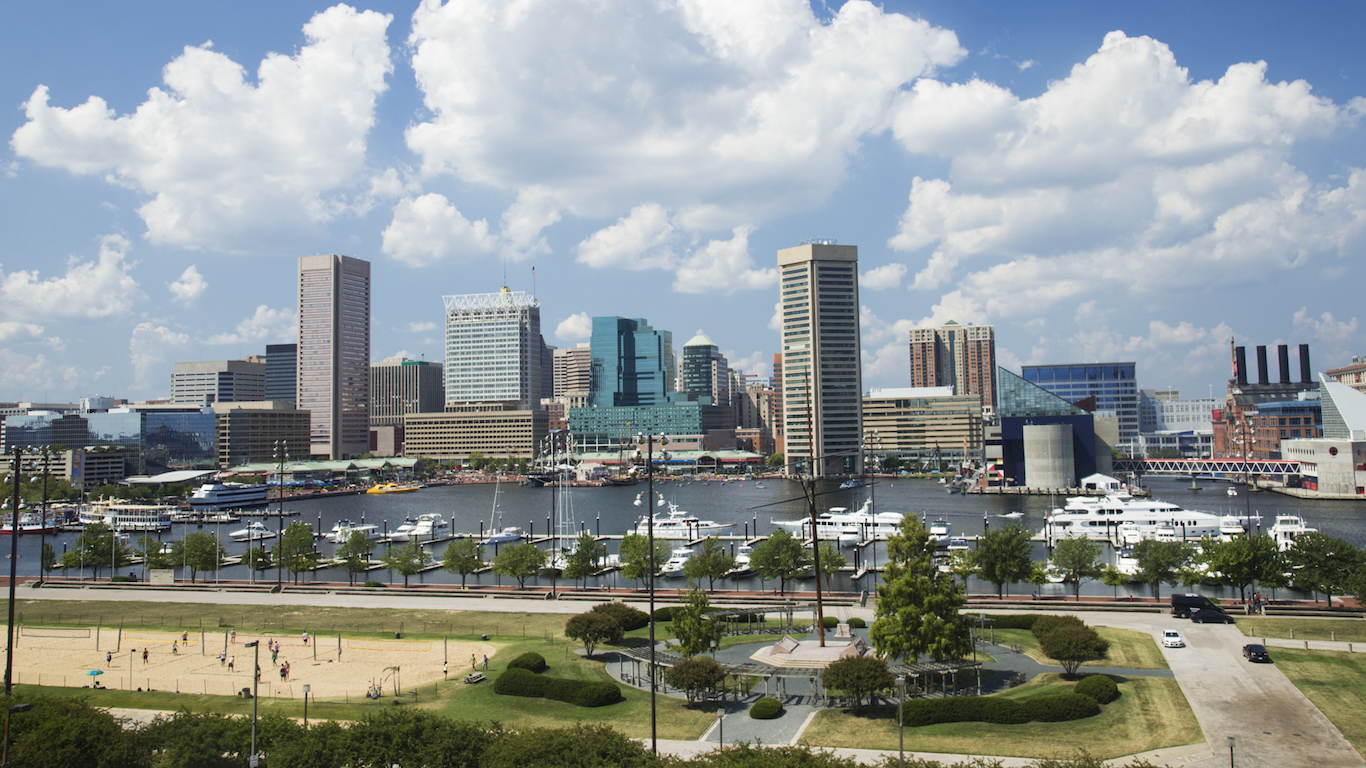
The national average retirement age is 63 years. One consequence of this is that millions of elderly residents are at risk of financial insecurity if Social Security proves insufficient and their savings are not sufficient to cover expenses through end of life. In Maryland, 56.7% of senior citizens have at least one supplemental form of retirement income in addition to Social Security, such as 401ks, pensions, and IRAs. This is higher than the 49.1% of American senior citizens with a supplemental retirement income. The median income of elderly households in the state of $53,401 a year is third highest in the country.
24. Illinois
> Pct. of pop. age 65 and up: 14.2% (12th lowest)
> 65 and over poverty rate: 8.5% (21st highest)
> 65 and over bachelor attainment: 24.3% (20th lowest)
> Life expectancy at birth: 79.2 years (24th highest)
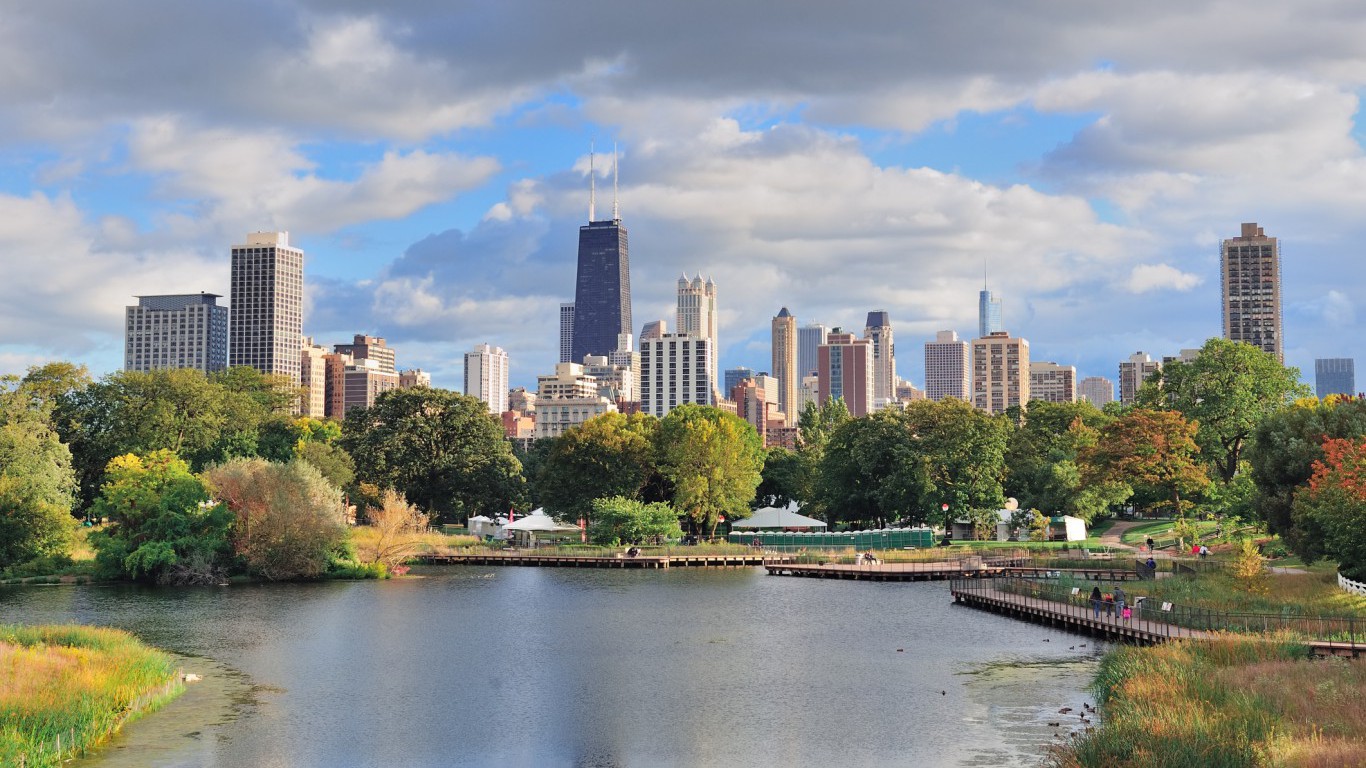
Many senior citizens who lose mobility or the ability to drive lose their sense of independence and their quality of life is often diminished. This loss of independence can be avoided in parts of the country that have more public transportation options such as buses and subways, and where walking from home to the grocery store or bank is possible. Illinois is one such state, as 12.3% of workers walk to work or use public transportation, the fourth highest share in the country.
[in-text-ad-2]
25. California
> Pct. of pop. age 65 and up: 13.3% (6th lowest)
> 65 and over poverty rate: 9.9% (10th highest)
> 65 and over bachelor attainment: 30.1% (9th highest)
> Life expectancy at birth: 80.9 years (2nd highest)
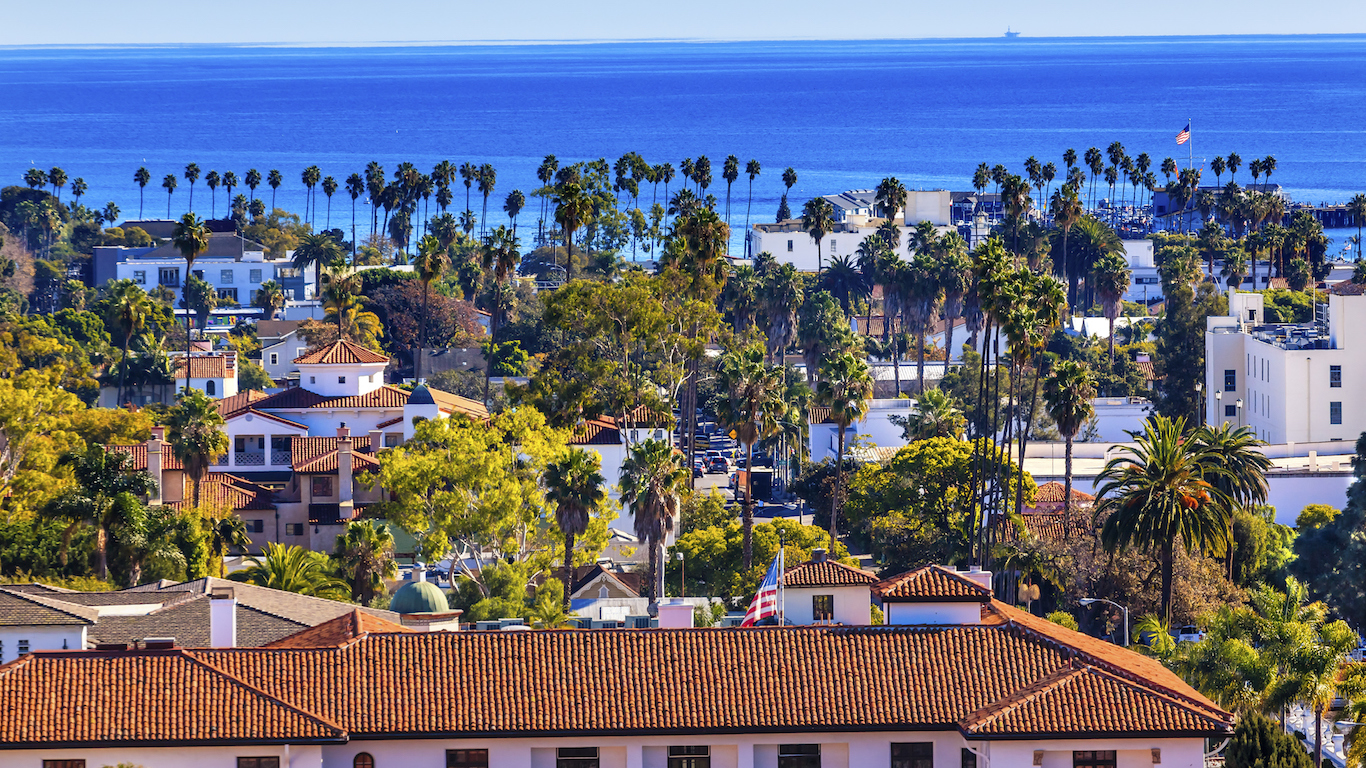
California has one of the higher poverty rates for senior citizens in the country, with about one in 10 living below the poverty line, 10th highest among states. Supplemental forms of retirement income, in addition to Social Security, such as IRAs, 401ks, and pensions, can help seniors living on fixed income to live above the poverty line. In California, only 45% of residents 65 and older have a form of retirement income other than Social Security, compared to 49% senior citizens nationwide.
26. Florida
> Pct. of pop. age 65 and up: 19.5% (the highest)
> 65 and over poverty rate: 10.3% (6th highest)
> 65 and over bachelor attainment: 26.8% (21st highest)
> Life expectancy at birth: 79.7 years (13th highest)
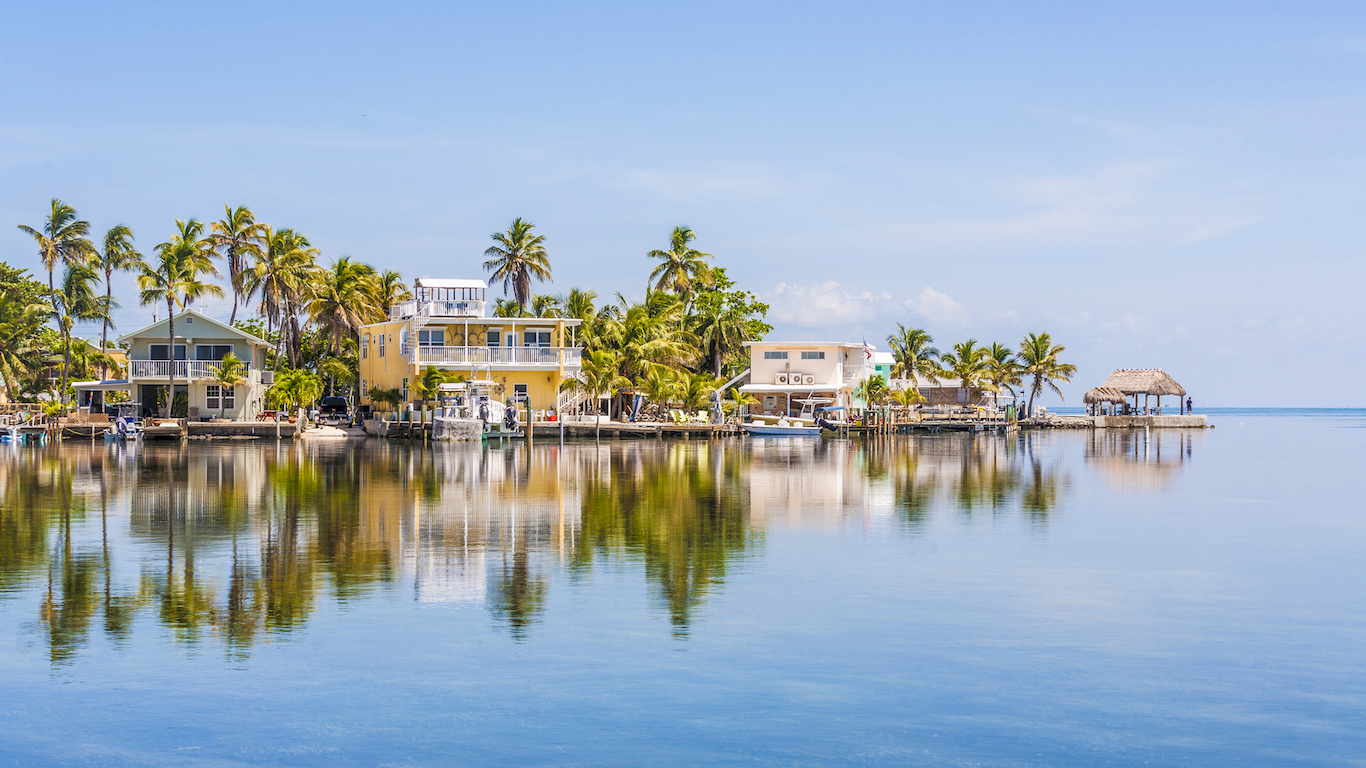
Florida’s popularity as a retirement destination is well known. Elderly state residents comprise nearly 20% of Florida’s population, the highest share in the nation. Despite the advantages of large elderly communities, and the appeal of Florida’s near-tropical climate, other factors peg Florida as just average for elderly Americans. For example, across the state, there are relatively few social establishments per capita. The number of marinas, golf courses, museums, parks, and other such organizations of 25.7 per 10,000 residents is close to the lowest concentration of all states. Even if there were more social opportunities for seniors, a relatively large share of Florida’s elderly would likely not be able to afford them. The poverty rate among Floridians 65 and older of 10.3% is tied for sixth highest in the country.
[in-text-ad]
27. Rhode Island
> Pct. of pop. age 65 and up: 16.1% (13th highest)
> 65 and over poverty rate: 10.3% (6th highest)
> 65 and over bachelor attainment: 26.2% (23rd highest)
> Life expectancy at birth: 79.7 years (14th highest)
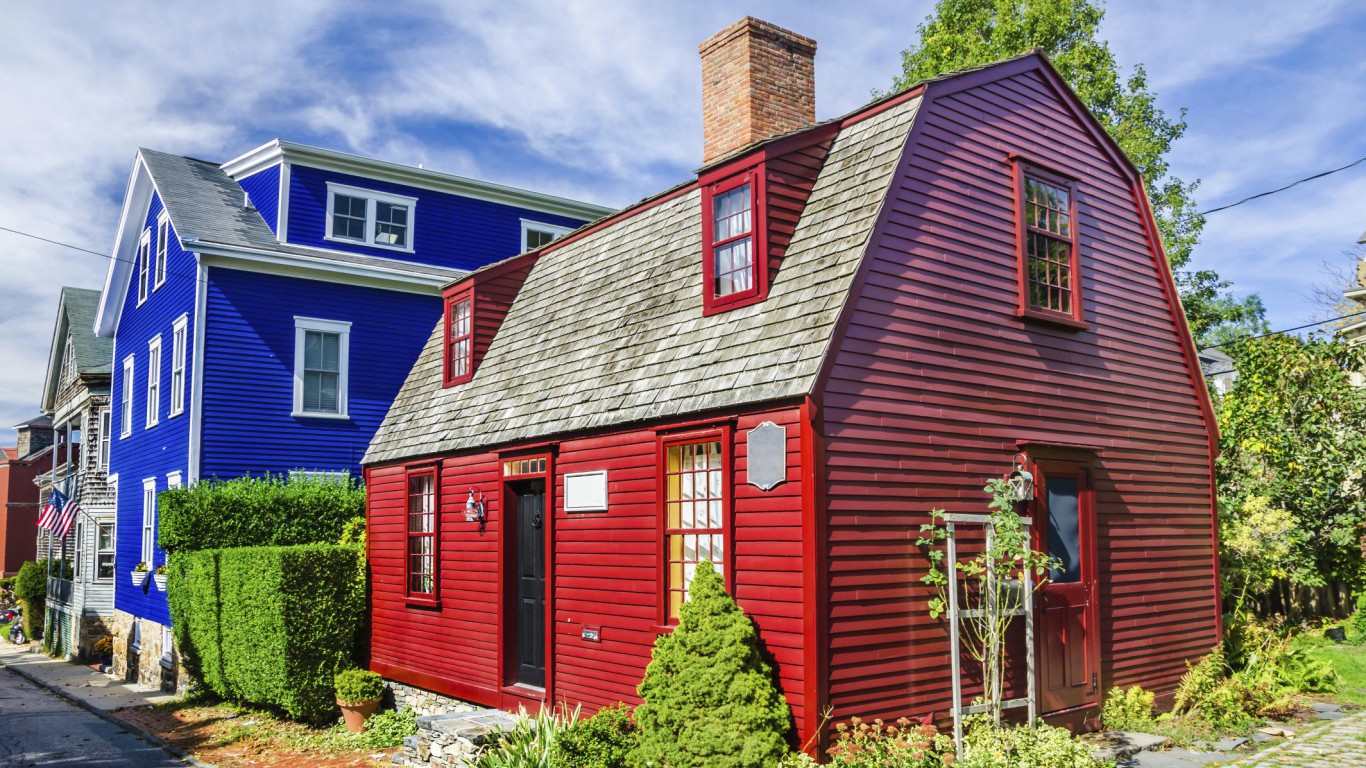
Rhode Island communities are relatively safe, and compared with other states there are abundant opportunities for social engagement. The state’s violent crime rate of 243 incidents per 100,000 people is among the lowest of all states. The concentration of social establishments such as golf course, amusement parks, marinas, and museums in Rhode Island, at 39.5 per 10,000 people, is seventh highest of states.
Yet, due to the relatively high likelihood of financial hardship among Rhode Island’s elderly, the state is slightly worse than most states for seniors. The elderly poverty rate of 10.3% is tied for sixth highest, and the 45% share of elders who have supplemental retirement income such as pension payments and 401k withdrawals is one of the lower percentages compared with other states.
28. North Carolina
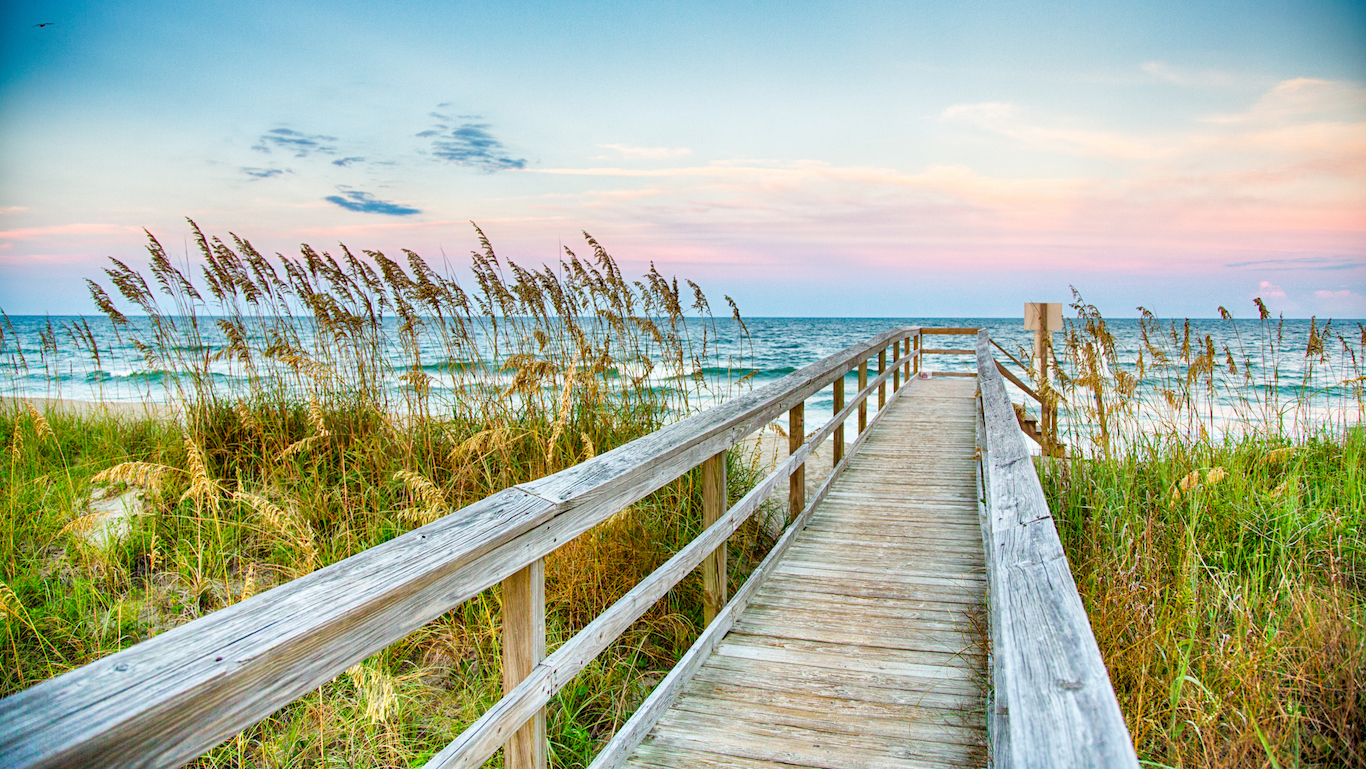
> Pct. of pop. age 65 and up: 15.1% (24th lowest)
> 65 and over poverty rate: 9.2% (15th highest)
> 65 and over bachelor attainment: 24.4% (21st lowest)
> Life expectancy at birth: 77.9 years (14th lowest)
Because elderly Americans frequently rely on lower, often fixed incomes, an area’s cost of living can have an outsized effect on older households. The cost of living in North Carolina, which is nearly 10% lower than the nation’s average, is certainly helpful for the state’s older residents. Still, incomes are also quite low. The typical elderly household in North Carolina has an annual income of $37,468, one of the lower senior income levels of all states.
29. Texas
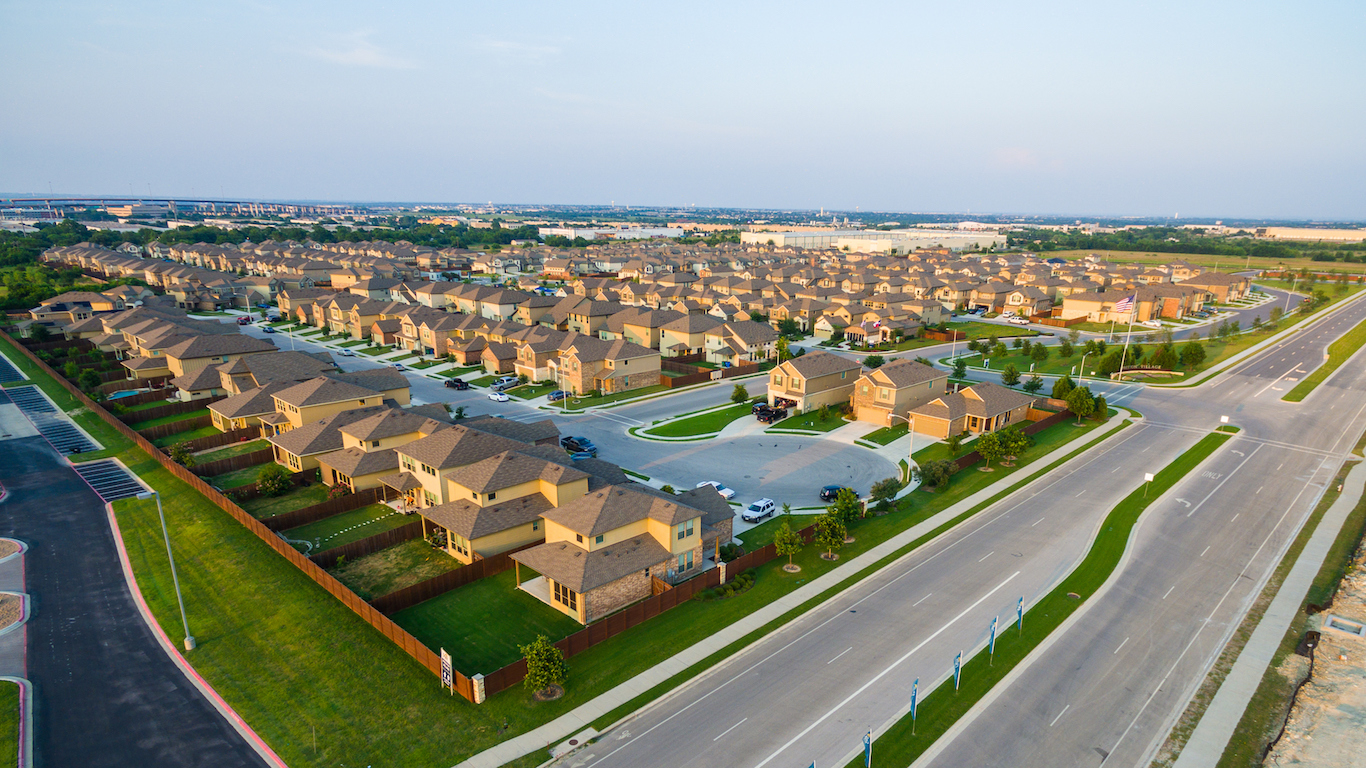
> Pct. of pop. age 65 and up: 11.7% (3rd lowest)
> 65 and over poverty rate: 10.3% (6th highest)
> 65 and over bachelor attainment: 25.0% (25th lowest)
> Life expectancy at birth: 78.6 years (20th lowest)
Elderly Americans are at greater risk of social isolation. The presence of activities, clubs, and the arts can be valuable to seniors by providing human contact and engagement. Nationwide, there are 30.1 such social establishments for every 10,000 people. In Texas, there are only 25.1 such establishments per 10,000 residents, the third smallest concentration among states.
In addition, and perhaps adding to the risk of isolation, Texan senior citizens are more likely to be financially insecure. More than one in 10 state residents 65 and older live below the poverty line, tied for sixth highest among states.
[in-text-ad-2]

30. Utah
> Pct. of pop. age 65 and up: 10.3% (2nd lowest)
> 65 and over poverty rate: 6.8% (5th lowest)
> 65 and over bachelor attainment: 29.9% (11th highest)
> Life expectancy at birth: 79.9 years (11th highest)
Making up just over 10% of the population, Utah has nearly the smallest share of elderly population of all states. This does not mean seniors in the state are worse off than those in other states. In fact, despite Utah’s overall below-average ranking, its elderly population is very well-off by several measures. For example, of state residents 65 and over, 29.9% have a bachelor’s degree, and just 6.8% live in poverty — each among the better measures compared with older cohorts in other states. However, other factors offset these more positive ones. For instance, the concentration of social establishments in the state, at just 20 per 10,000 people, is the lowest of all states. The presence of these organizations can help reduce the generally high likelihood of exclusion and isolation among elderly populations.
31. Georgia
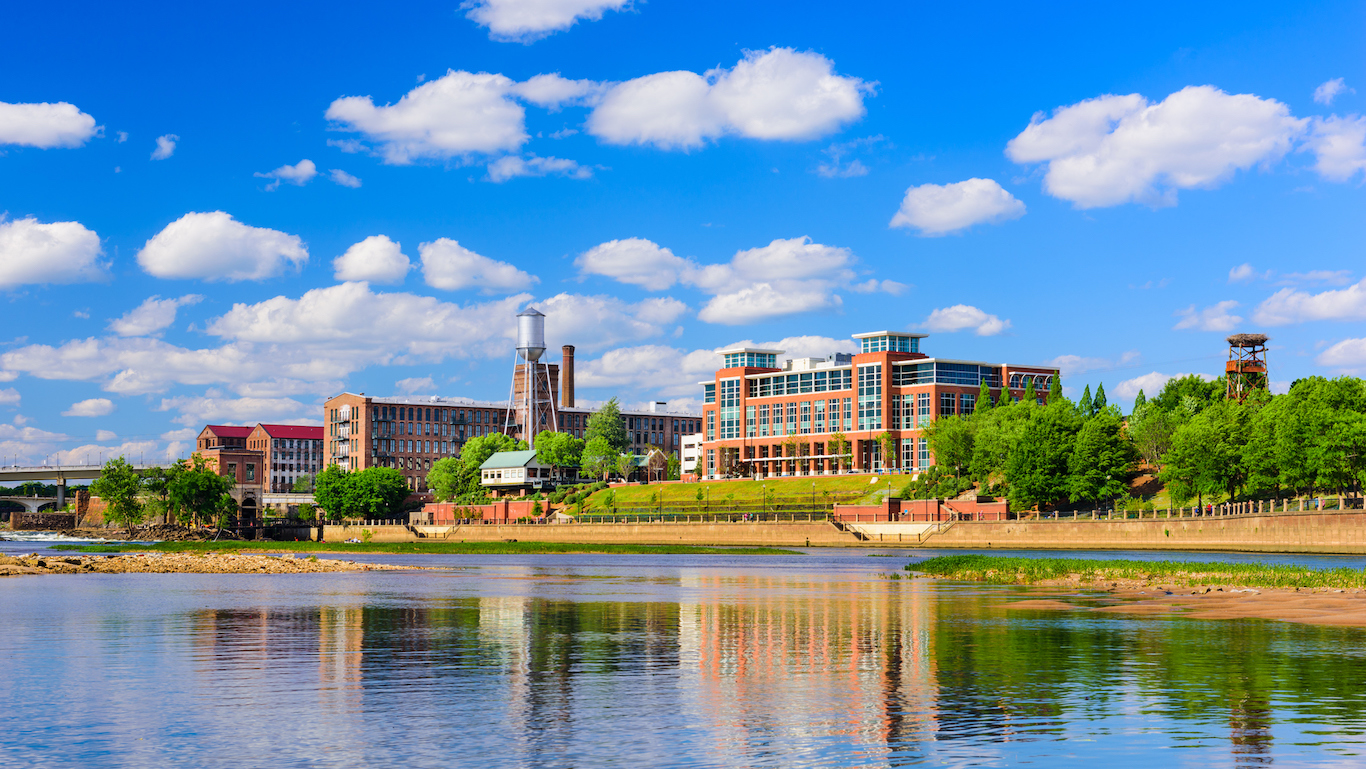
> Pct. of pop. age 65 and up: 12.8% (4th lowest)
> 65 and over poverty rate: 9.7% (13th highest)
> 65 and over bachelor attainment: 25.0% (25th lowest)
> Life expectancy at birth: 77.5 years (11th lowest)
Average life expectancy at birth in Georgia is 77.5 years, 1.3 years lower than the U.S. life expectancy. In addition to living slightly shorter lives on average, Georgia’s elderly may be more at risk of social isolation. The state has just 26.8 social establishments, such as museums, civic organizations, and libraries, per 10,000 residents. Nationwide, there are 30.1 such establishments for every 10,000 people.
[in-text-ad]
32. New Jersey
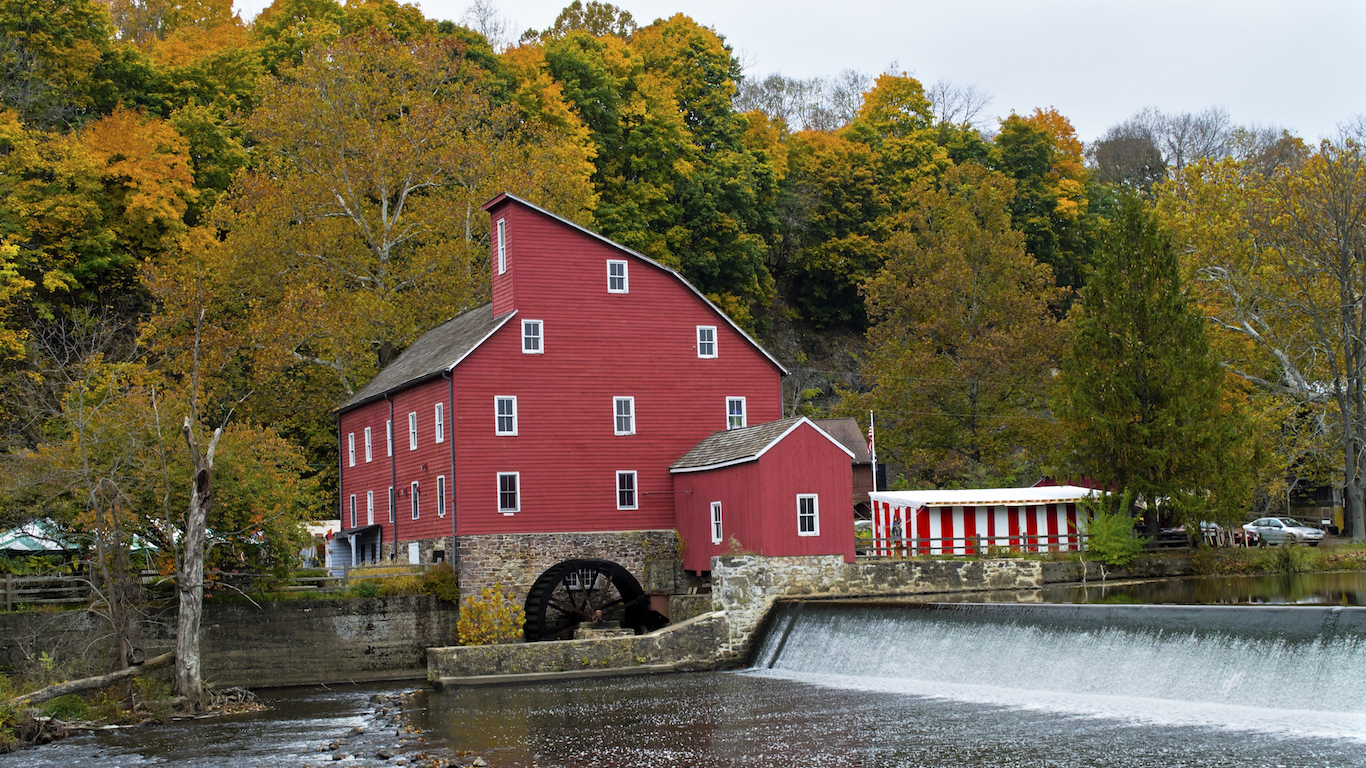
> Pct. of pop. age 65 and up: 15.0% (23rd lowest)
> 65 and over poverty rate: 7.9% (23rd lowest)
> 65 and over bachelor attainment: 28.1% (17th highest)
> Life expectancy at birth: 80.3 years (8th highest)
Like the state’s population as a whole, New Jersey’s elderly residents are relatively well off financially. The typical elderly household has an annual income of $47,355, the eighth highest of all states. Based on life expectancy and disabilities, seniors in New Jersey are also relatively healthy. The life expectancy at birth of over 80 years is eighth highest, and just 32.6% of residents 65 and over report having a disability, the sixth lowest percentage. New Jersey’s position on this list would be higher if not for the state’s high cost of living, which at approximately 14.5% more than the nation’s average prices, is third highest in the country. Further, the concentration of medical facilities — there are just 0.71 hospitals for every 100,000 people — is second lowest in the country.
33. Michigan
> Pct. of pop. age 65 and up: 15.8% (18th highest)
> 65 and over poverty rate: 7.8% (22nd lowest)
> 65 and over bachelor attainment: 23.4% (18th lowest)
> Life expectancy at birth: 78.1 years (15th lowest)
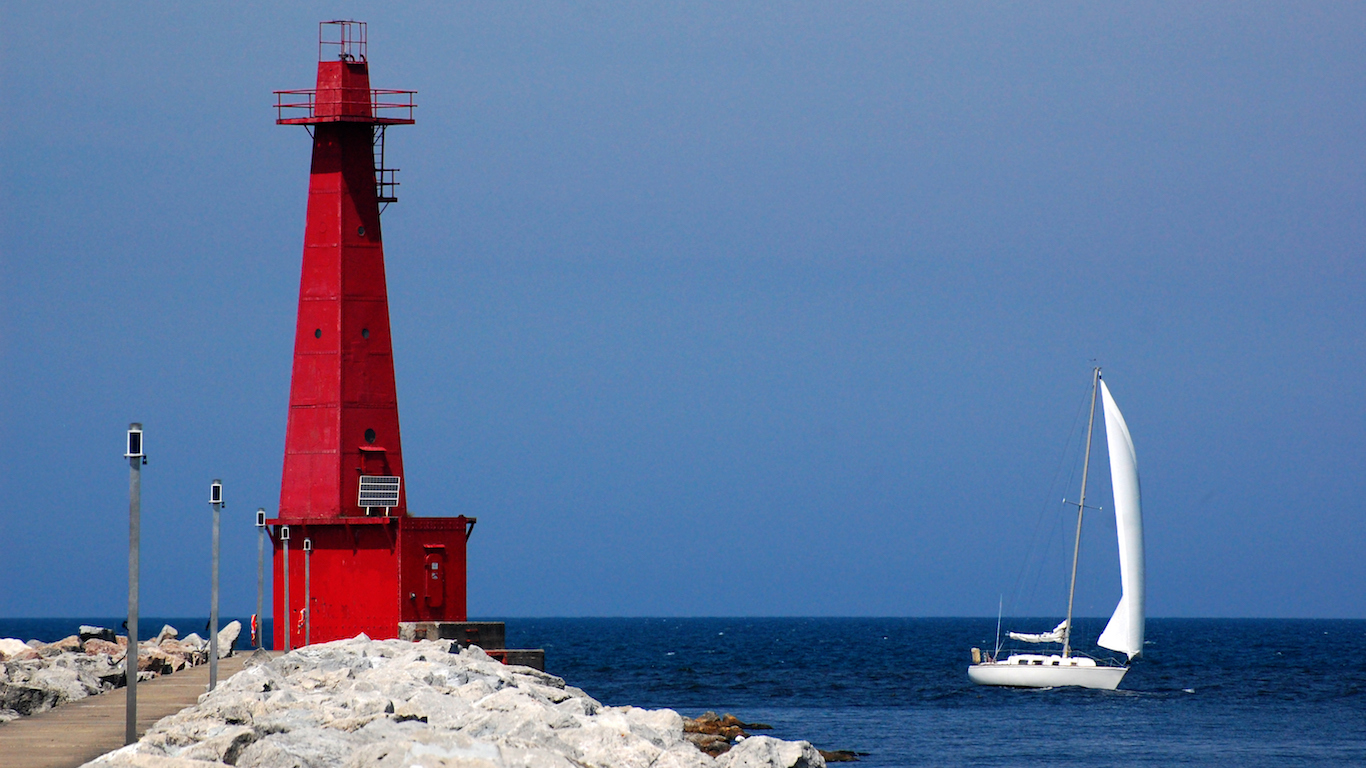
Behind only Delaware seniors, Michigan’s older residents are the most likely in the country to have some form of retirement income other than Social Security. Compared to the 49.1% of Americans 65 and over who earn such incomes, which include IRAs, 401ks, and pensions, 57.4% of Michigan elderly do.
While the state’s seniors may be slightly more financially secure, they are less likely than their peers nationwide to be in perfect health. The state’s annual mortality rate over the age of 65 is higher than the national figure, life expectancy is slightly lower, and fewer adults have a personal doctor than those in most other states.

34. New York
> Pct. of pop. age 65 and up: 15.0% (22nd lowest)
> 65 and over poverty rate: 11.2% (3rd highest)
> 65 and over bachelor attainment: 27.0% (20th highest)
> Life expectancy at birth: 80.5 years (6th highest)
New York’s seniors are among the least likely to be financially secure in the country. Among residents 65 and over, 11.2% live at or below the poverty line, the third highest share across all states. The typical elderly household in the state has an income of $40,918 a year, which is roughly in line with the national median household for the elderly. However, the relative cost of goods and services in New York is very high, about 15% higher than the average cost of living nationwide. For seniors who live on a fixed income, high prices can can add to the financial strain of living on a fixed income.
[in-text-ad-2]
35. New Mexico
> Pct. of pop. age 65 and up: 15.9% (16th highest)
> 65 and over poverty rate: 11.1% (5th highest)
> 65 and over bachelor attainment: 29.9% (11th highest)
> Life expectancy at birth: 78.2 years (16th lowest)
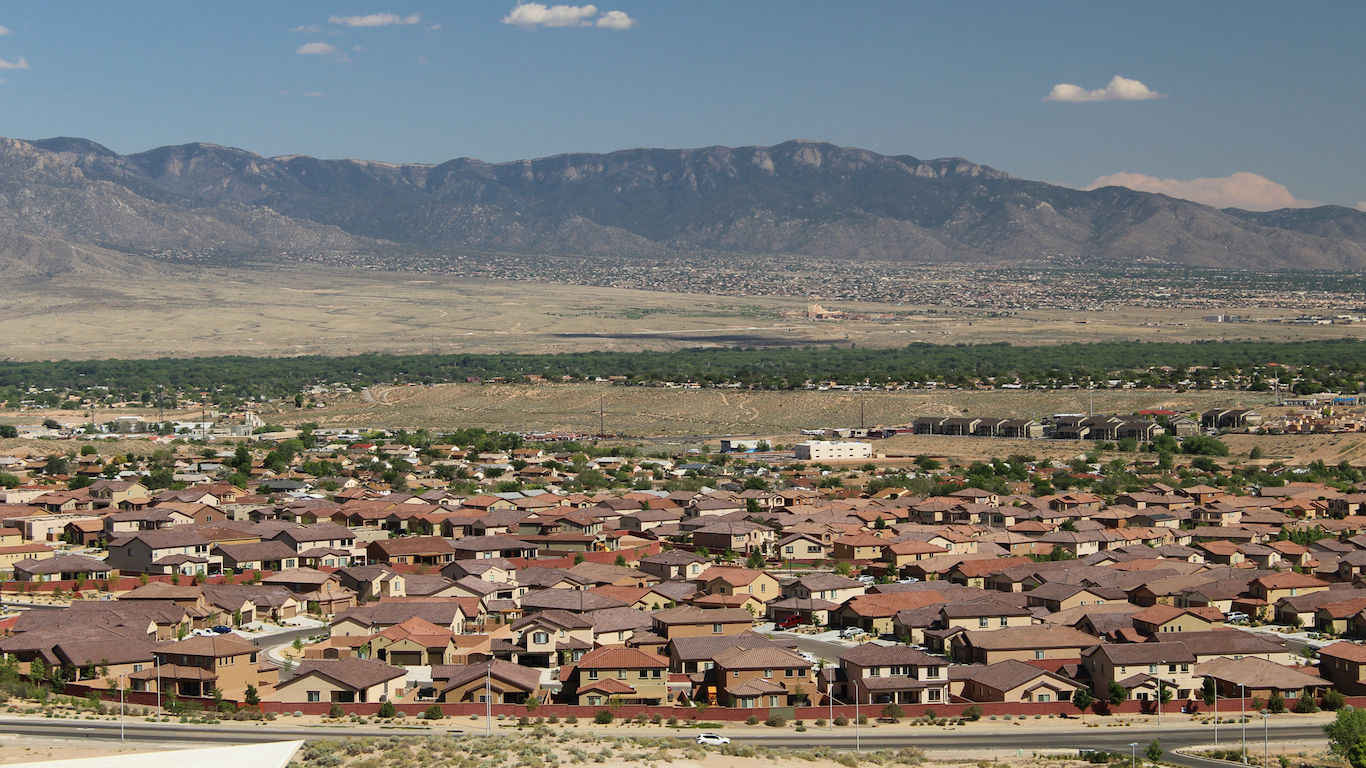
Poor health among New Mexico older residents is one of several indications the state is not the greatest place to grow old. Of new Mexico residents 65 and older, over 40% report having a disability, the seventh highest percentage. While roughly 30% of seniors in New Mexico have a college degree, among the highest elderly educational attainment rates, incomes are low and poverty is relatively high among the age group. At 11.1%, New Mexico residents 65 and older are more likely to be in poverty than older residents in all but four other states. Generally, older individuals are also at greater risk than others in unsafe communities, and New Mexico is not especially safe. The state’s violent crime rate of 656 incidents per 100,000 people is the third highest of all states.
36. South Carolina
> Pct. of pop. age 65 and up: 16.2% (12th highest)
> 65 and over poverty rate: 9.3% (14th highest)
> 65 and over bachelor attainment: 24.2% (19th lowest)
> Life expectancy at birth: 76.9 years (9th lowest)
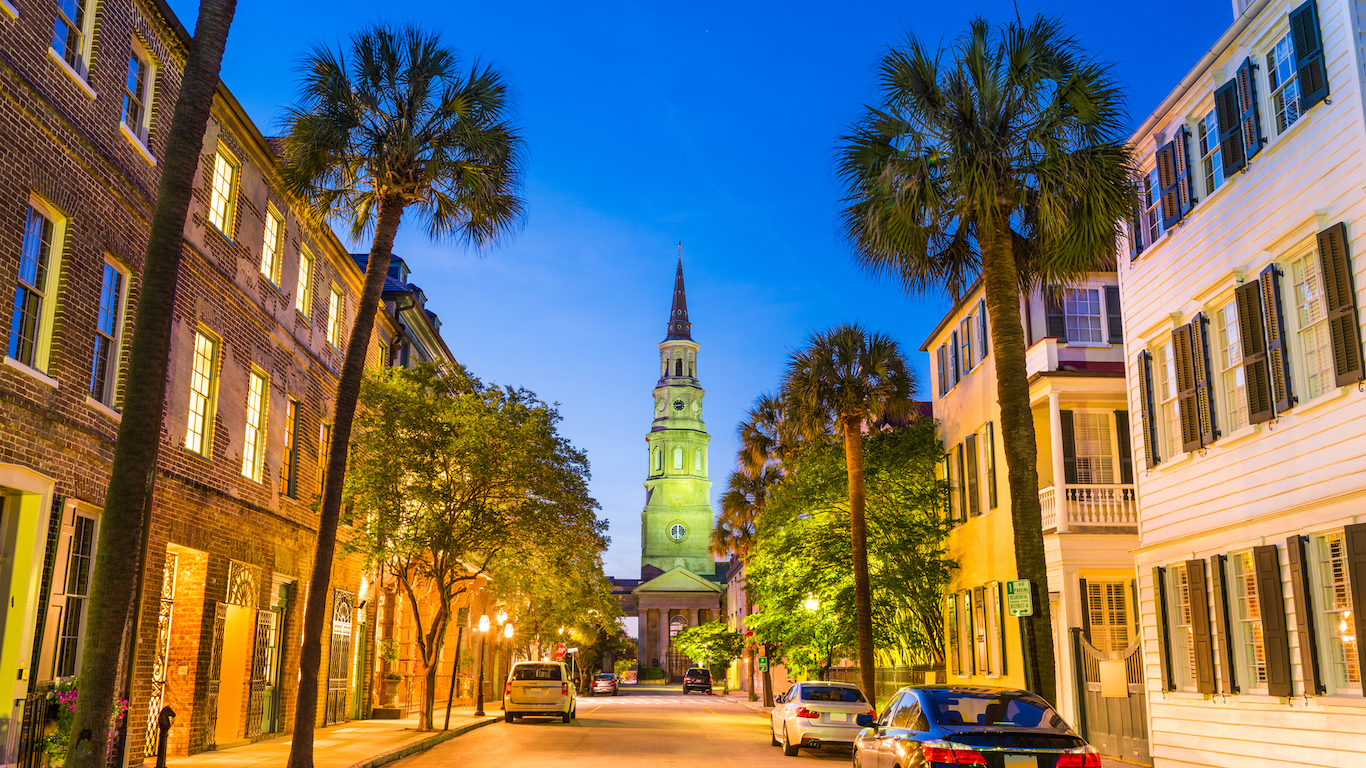
South Carolina’s environment presents some quality of life challenges for seniors. The elderly are more vulnerable to violent crime. South Carolina’s a violent crime rate of more than 500 incidents per 100,000 people is much higher than the national rate of 373 per 100,000. As many seniors stop driving, a public transportation infrastructure or a relatively walkable area can help seniors maintain their independence. In South Carolina, perhaps as a sign of the importance of driving in the state, just 2.5% of workers commute to work, compared to 8.0% of all workers nationwide. This is the third lowest proportion in the country.
[in-text-ad]

37. Missouri
> Pct. of pop. age 65 and up: 15.6% (22nd highest)
> 65 and over poverty rate: 8.5% (21st highest)
> 65 and over bachelor attainment: 21.7% (13th lowest)
> Life expectancy at birth: 77.6 years (12th lowest)
Missouri’s seniors are less likely to be healthy than those in most other states. A higher than average share of seniors suffer from a disability, and the annual mortality rate of residents 65 and older is higher than average.
Older Americans are vulnerable to mistreatment of all sorts, including physical violence. In Missouri, the likelihood of growing old in a safe community is lower than in most states. The state’s violent crime rate of nearly 500 incidents per 100,000 people is ninth highest nationwide.

38. Pennsylvania
> Pct. of pop. age 65 and up: 17.0% (6th highest)
> 65 and over poverty rate: 7.8% (22nd lowest)
> 65 and over bachelor attainment: 21.7% (13th lowest)
> Life expectancy at birth: 78.6 years (21st lowest)
Elderly Pennsylvanians have relatively good access to health services. Just 13.2% of adults report not having a personal doctor, one of the lowest such percentages, and the concentration of medical facilities such as hospitals is in line with the national number. Despite these advantage, older Pennsylvania residents are less healthy than older residents in other states. The annual mortality rate for residents over 65, at 4,771 per 100,000 people, is eighth highest.
39. Ohio
> Pct. of pop. age 65 and up: 15.8% (17th highest)
> 65 and over poverty rate: 7.6% (19th lowest)
> 65 and over bachelor attainment: 20.2% (9th lowest)
> Life expectancy at birth: 77.6 years (13th lowest)
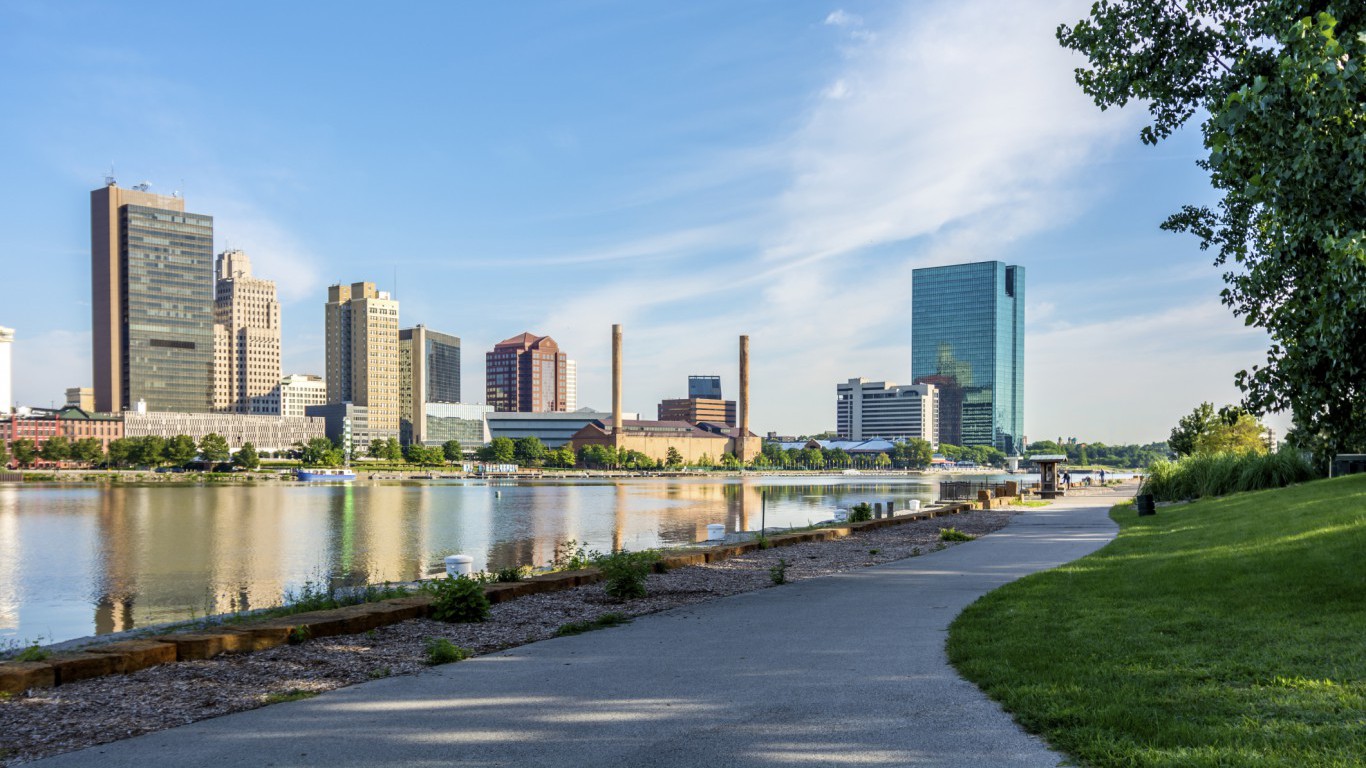
For senior citizens, there are several benefits to having at least a bachelor’s degree. In general, a college education can help create a sense of control over one’s life. In addition, while the median retirement age nationwide is 63, many Americans work into their 70s. Those with a bachelor’s degree are more likely to earn higher wages and be financially secure when retirement comes. In Ohio, barely one in five seniors have a bachelor’s degree, compared to the one in four who do nationwide.
[in-text-ad-2]
40. Nevada
> Pct. of pop. age 65 and up: 14.6% (15th lowest)
> 65 and over poverty rate: 8.4% (24th highest)
> 65 and over bachelor attainment: 24.9% (23rd lowest)
> Life expectancy at birth: 78.2 years (17th lowest)
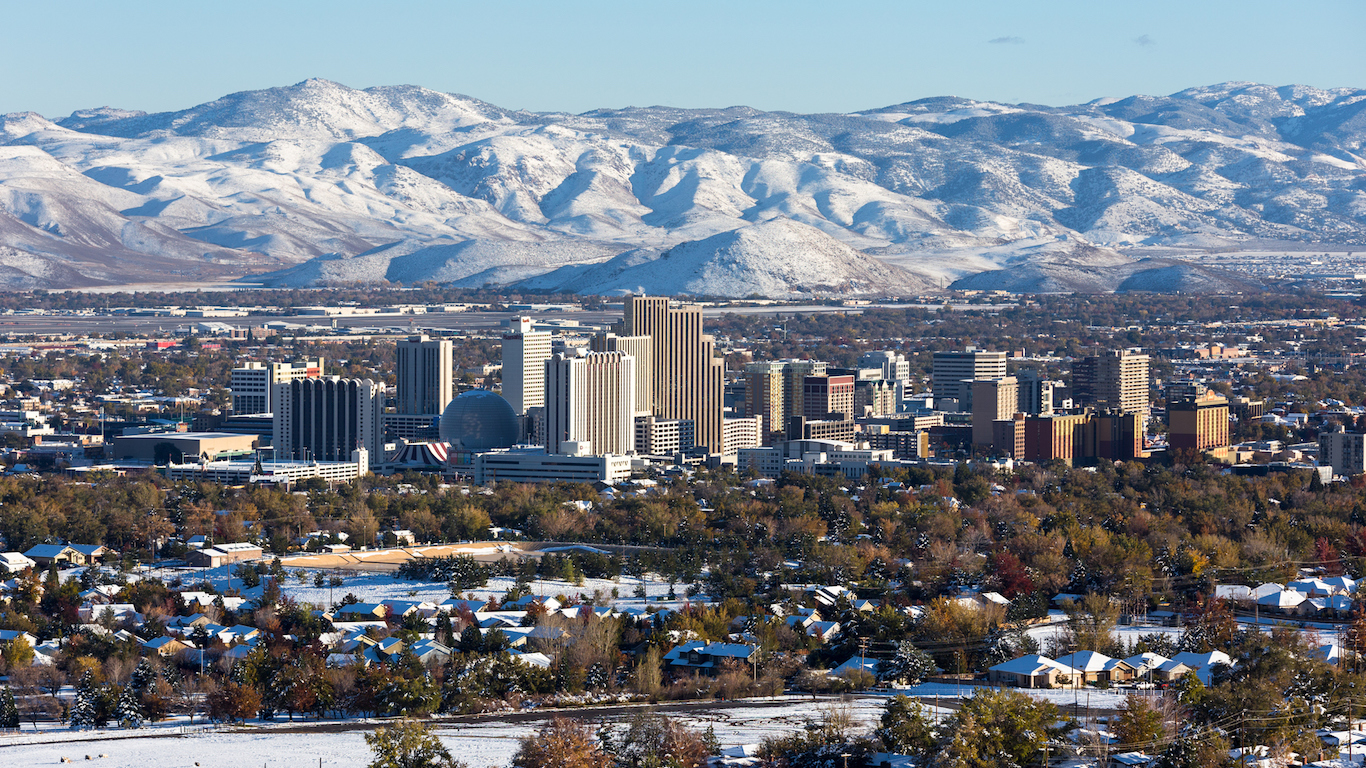
Older Americans are more at risk of social isolation, and the presence of nearby activities, such as clubs, and music and arts facilities, can help seniors stay socially and mentally engaged. In Nevada, there is a dearth of such establishments. Compared to the national concentration of 30.1 establishments per 10,000 Americans, Nevada has just 26.2 for every 10,000 residents, the fifth lowest concentration of any state. In addition to the lack of social venues, Nevadans are less likely than those in most other states to have access to a nearby hospital. There are just 1.1 hospitals per 100,000 Nevadans, compared to the 1.4 hospitals for every 100,000 Americans.
41. Indiana
> Pct. of pop. age 65 and up: 14.6% (14th lowest)
> 65 and over poverty rate: 7.2% (11th lowest)
> 65 and over bachelor attainment: 18.8% (4th lowest)
> Life expectancy at birth: 77.3 years (10th lowest)
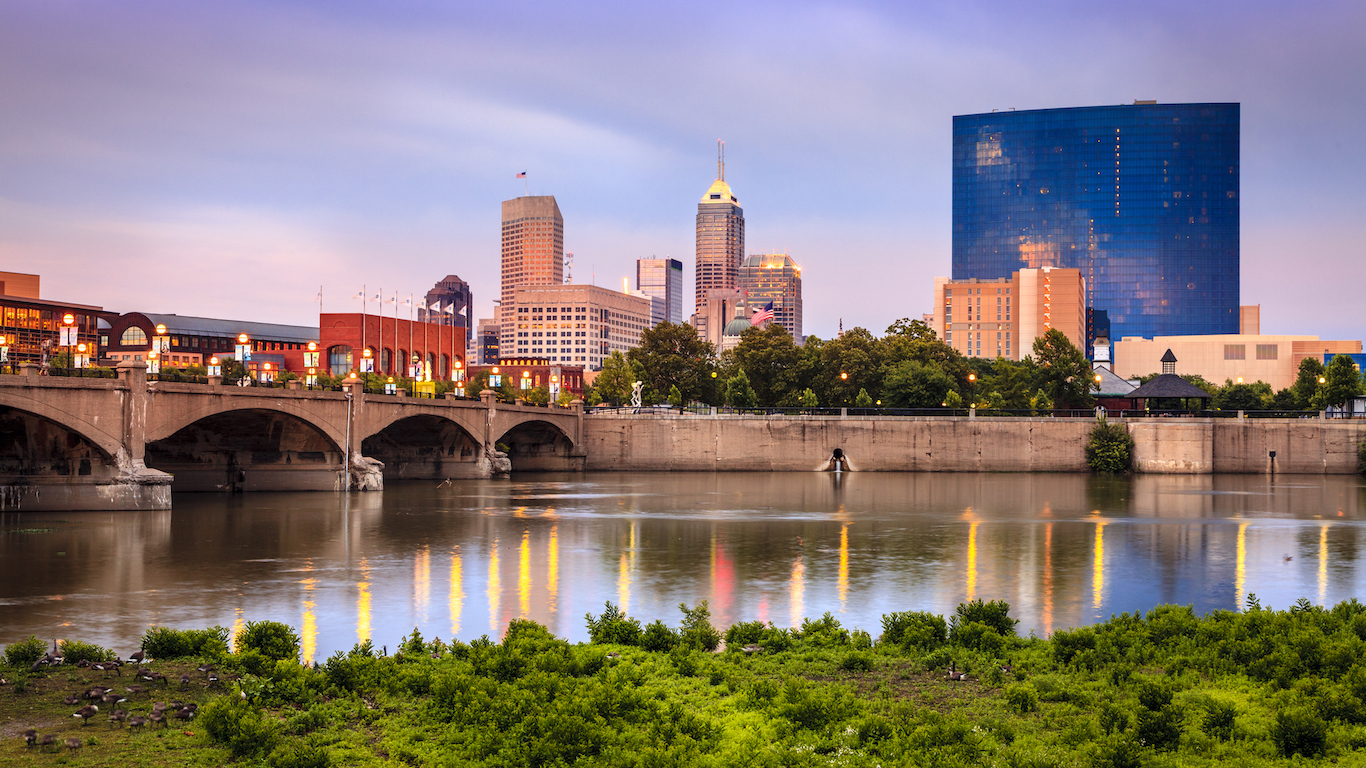
Based on disability and mortality rates, Indiana’s older population is not especially healthy compared with other states’ elderly populations. The percentage of elderly adults who report a disability, at 37.8%, is 12th highest in the country. In a given year, there are 4,829 deaths for every 100,000 people 65 and over in the state, the fifth highest mortality rate of all states.
With older Americans often at greater risk of financial instability, employment can help with the financial hardship many may face. Education, in addition to offering a myriad of personal benefits, can improve the odds of employment for older job seekers. In Indiana, however, just 18.8% of seniors have a college degree, nearly the lowest percentage.
[in-text-ad]

42. Alaska
> Pct. of pop. age 65 and up: 9.6% (the lowest)
> 65 and over poverty rate: 4.5% (the lowest)
> 65 and over bachelor attainment: 30.1% (9th highest)
> Life expectancy at birth: 78.8 years (23rd lowest)
Living in a safe environment is especially important for senior citizens, who are more vulnerable to violent crime than younger age groups. Alaska, however, has the highest violent crime rate in the country, at 730 incidents per 100,000 people annually. Seniors are also more at risk of suffering from a debilitating mental or physical disability. In Alaska, nearly 40% of state residents 65 and older have a disability, compared to a national share of 35.4% and one of the highest shares among states.
One positive aspect for state seniors is finances. Alaska’s seniors are more likely than most to be financially secure in retirement. In addition to Social Security, 56.8% of seniors receive some form of retirement-related income, including pensions, 401ks and IRAs, more than in all but two other states.
43. Oklahoma
> Pct. of pop. age 65 and up: 14.7% (20th lowest)
> 65 and over poverty rate: 8.4% (24th highest)
> 65 and over bachelor attainment: 22.6% (15th lowest)
> Life expectancy at birth: 75.8 years (5th lowest)
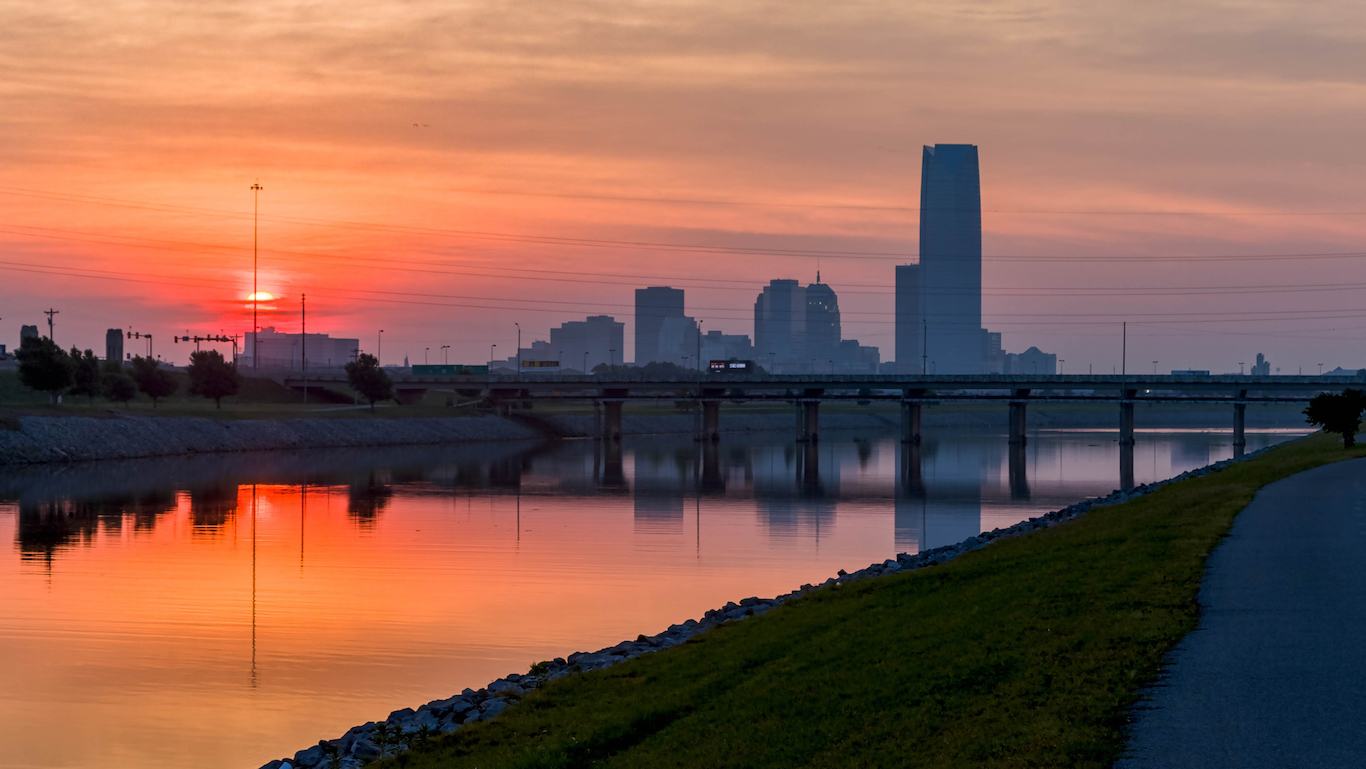
Oklahoma’s elderly residents are more likely to be in poor health than those in other states. Life expectancy at birth is just 75.8 years, 3.1 years less than the U.S. life expectancy. Older people are more at risk of suffering from a disability that can drastically reduce their quality of life. More than 41% of state seniors suffer from a mental or physical disability, one of the largest such percentages.
Oklahoma’s seniors who who no longer drive may also be more likely to lose their independence as a result. Only 2.1% of workers in the state walk or use public transportation to get to work, the fourth lowest proportion in the country. This may point to the fact that being able to drive is crucial for mobility in the state.

44. Tennessee
> Pct. of pop. age 65 and up: 15.4% (24th highest)
> 65 and over poverty rate: 9.8% (12th highest)
> 65 and over bachelor attainment: 20.5% (10th lowest)
> Life expectancy at birth: 76.4 years (8th lowest)
With a large share of elderly Americans living on a fixed income, there is risk for serious financial hardship if savings run out. In Tennessee, the median income for elderly households is $36,692 a year, one of the lowest such figures in the country and well below the national median household income for the age group of $40,971 a year.
Tennessee seniors are also more likely to suffer from poor health than those in other states. Nearly 40% of seniors also suffer from a disability, close to 5 percentage points more than the national share.
[in-text-ad-2]

45. Kentucky
> Pct. of pop. age 65 and up: 15.2% (25th lowest)
> 65 and over poverty rate: 11.2% (3rd highest)
> 65 and over bachelor attainment: 18.6% (3rd lowest)
> Life expectancy at birth: 75.8 years (6th lowest)
Unlike most states at the bottom of this list, Kentucky’s violent crime rate of 219 incidents per 100,000 people is below the national rate and one of the lowest of all states. But while the state’s elderly are more likely to benefit from peace of mind and at lower risk of violence, there are plenty of other indications that seniors in Kentucky are worse off than the elderly populations of other states. Older Kentuckians report quite low education levels and incomes — just 18.6% have a college degree, and the typical elderly household has an annual income of $34,909. Also, based on the mortality rate of people 65 and older in the state, older state residents are not especially healthy. There are 4,845 deaths per 100,000 people 65 and over in a year, the fourth highest rate.

46. Alabama
> Pct. of pop. age 65 and up: 15.7% (20th highest)
> 65 and over poverty rate: 9.9% (10th highest)
> 65 and over bachelor attainment: 21.2% (11th lowest)
> Life expectancy at birth: 75.4 years (2nd lowest)
The physical decline that comes with age is more prevalent in Alabama than in most states. Of Alabama’s 65 and older population, 41.4% report having a disability of some kind, the fourth highest share of all states. Also, there are 4,823 deaths for every 100,000 elderly state residents in a year, the sixth highest mortality rate among older Americans in the country.
Seniors living in Alabama benefit from one of the lowest costs of living in the country. The 65 and over population is also considerably more likely to own their home than those in other states. For many elderly Alabamians, however, these advantages likely do not offset the low incomes. The typical elderly household has an annual income of $35,709, the sixth lowest of all states.
[in-text-ad]
47. Arkansas
> Pct. of pop. age 65 and up: 16.1% (14th highest)
> 65 and over poverty rate: 10.3% (6th highest)
> 65 and over bachelor attainment: 18.6% (3rd lowest)
> Life expectancy at birth: 75.8 years (7th lowest)
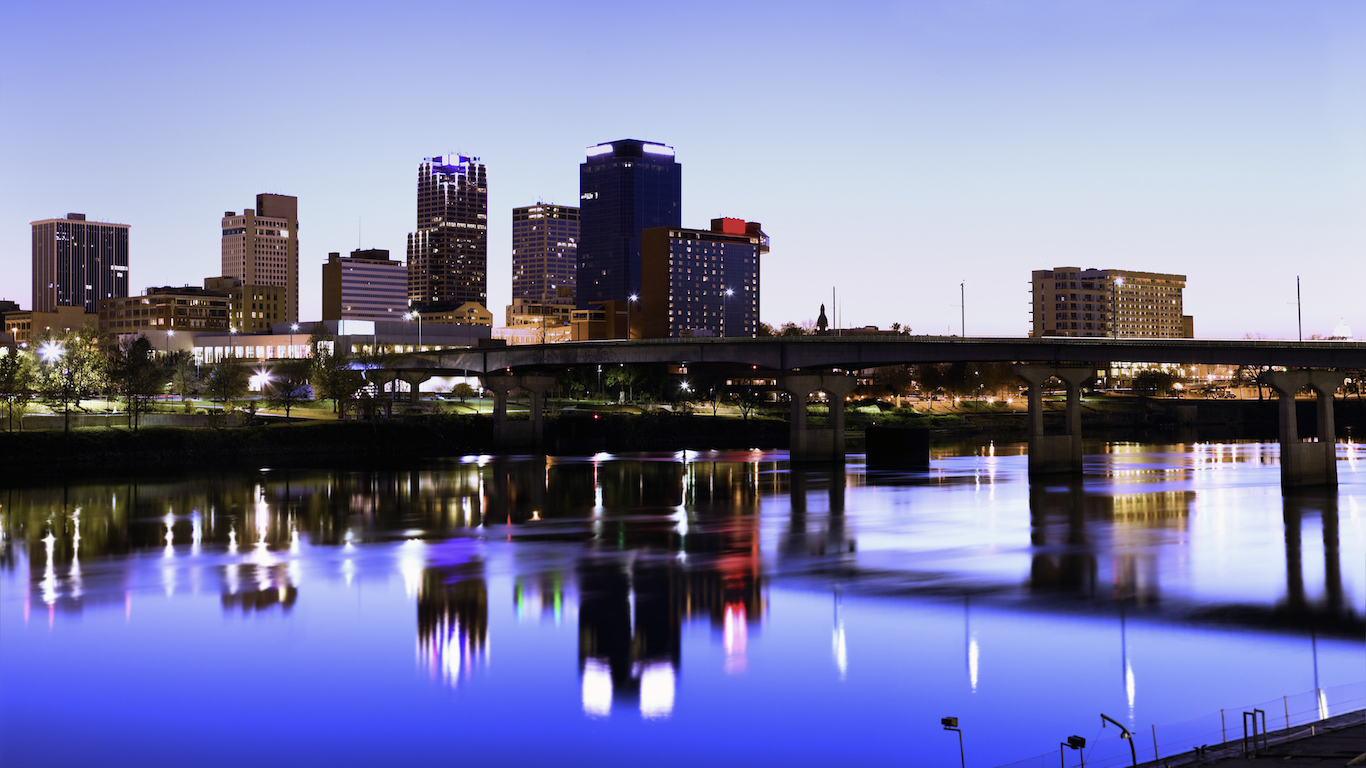
For many seniors, losing the ability to drive can represent a loss of of independence, particularly if they live in areas where getting around from place to place almost always requires a personal vehicle. This may be a disproportionately serious problem for seniors in Arkansas, where just 2.3% of workers commute on foot or by public transportation, compared to 8.0% of all American workers.
Arkansas’ older residents are also more likely to struggle to make ends meet. The 65 and older household has an income of just $33,276 a year, about $7,700 less than the national median for senior households. Arkansas is one of nine states where more than one in 10 seniors live in poverty.
48. Louisiana
> Pct. of pop. age 65 and up: 14.0% (7th lowest)
> 65 and over poverty rate: 12.8% (the highest)
> 65 and over bachelor attainment: 20.1% (8th lowest)
> Life expectancy at birth: 75.8 years (4th lowest)
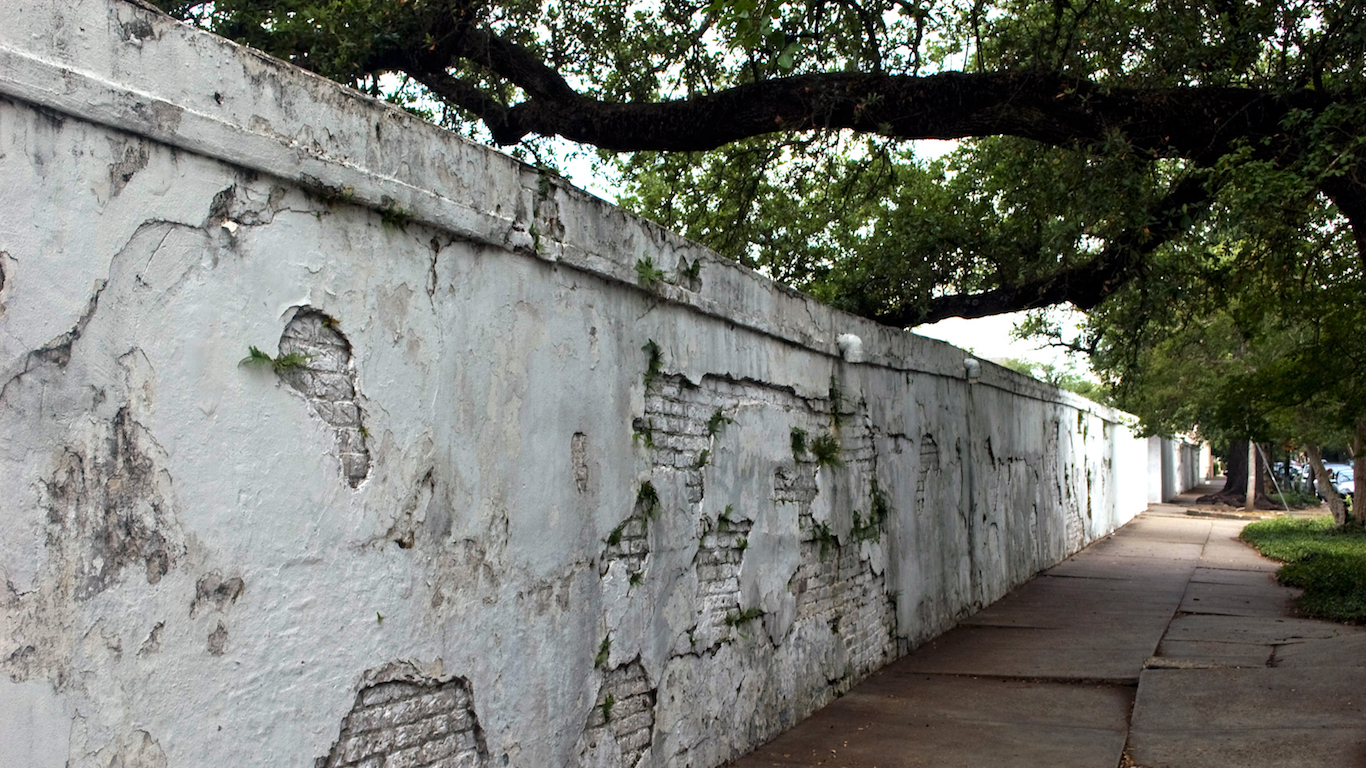
Although elderly Americans are less likely to live in poverty than other age group, they tend to have lower — and often fixed — incomes. Because of their often increased needs due to health issues, the burden of financial hardship is significantly greater for older individuals. In Louisiana, the elderly population is further burdened by the nation-leading elderly poverty rate of 12.8% — a strong indication that growing old in Louisiana is likely to be accompanied by some financial difficulty. According to the National Center on Elder Abuse, older Americans are vulnerable to mistreatment of all sorts, including physical violence. In Louisiana, the likelihood of growing old in a safe community is lower than in most states. The state’s violent crime rate of 540 incidents per 100,000 people is fifth highest nationwide.
49. West Virginia
> Pct. of pop. age 65 and up: 18.2% (3rd highest)
> 65 and over poverty rate: 8.5% (21st highest)
> 65 and over bachelor attainment: 15.6% (the lowest)
> Life expectancy at birth: 75.4 years (3rd lowest)
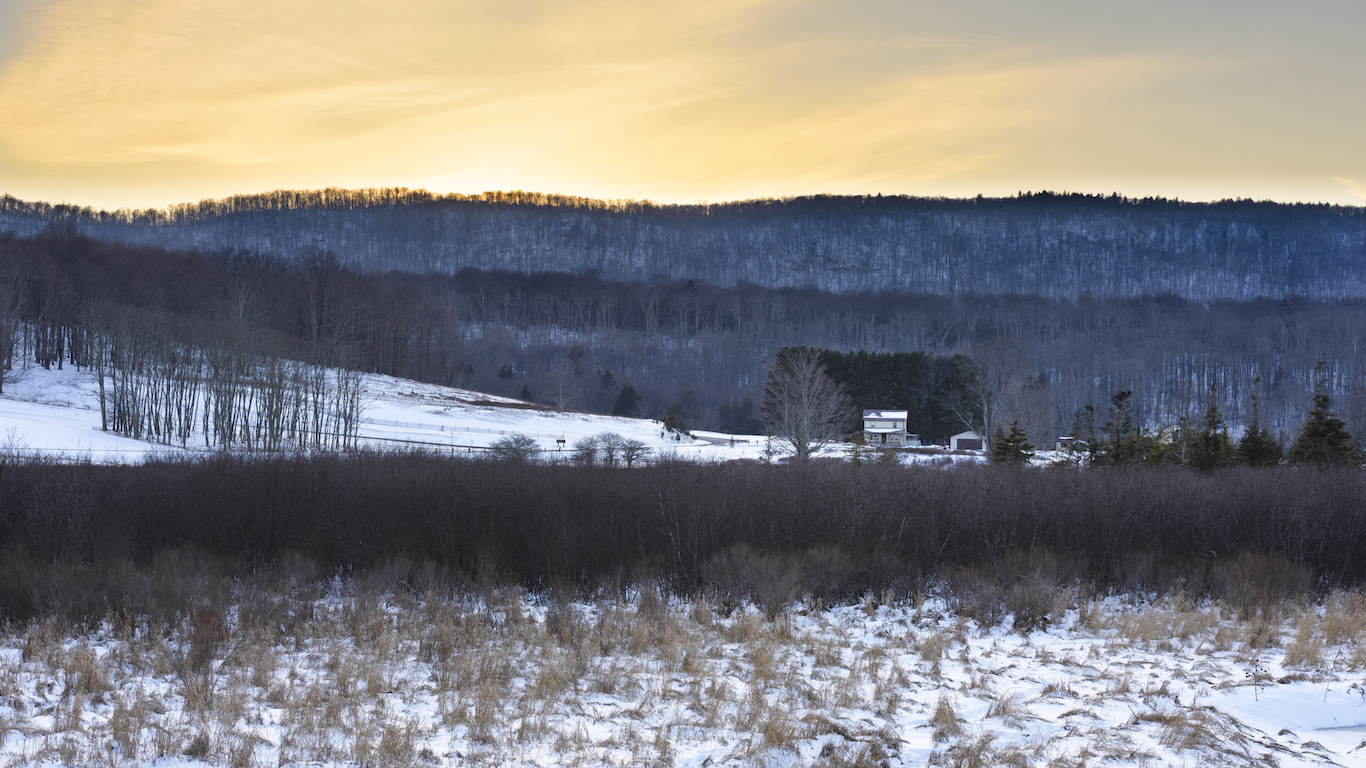
A college education can be valuable for seniors both because it increases the likelihood of holding a job that pays well, and also because it can have a number of personal benefits. In West Virginia, however, just 15.6% of seniors have a college degree, the smallest share of any state, and more than 10 percentage points below the U.S. rate.
Chronic conditions and disease are a risk at any age, but the likelihood of developing a debilitating mental or physical disability increases dramatically with age. Across the country, just over 35% of people 65 and over have a mental or physical disability. In West Virginia, around 44% of seniors have a disability of some kind, the worst of any state. Also, West Virginia has the second highest mortality rate for people over 65 in the U.S., another indication of poor health of the elderly population in the state.
[in-text-ad-2]

50. Mississippi
> Pct. of pop. age 65 and up: 14.7% (21st lowest)
> 65 and over poverty rate: 12.5% (2nd highest)
> 65 and over bachelor attainment: 19.6% (5th lowest)
> Life expectancy at birth: 74.8 years (the lowest)
Mississippi routinely ranks as among the worst states in a range of socioeconomic and health measures, and elderly residents are not exceptional in this regard. The typical elderly household has an annual income of $31,744, the lowest of all elderly state populations. The challenge of living on such low incomes is alleviated somewhat by the state’s relatively low cost of living. Goods and services cost 13.3% less in Mississippi than they do on average nationwide, the lowest cost of living of all states.
Compared with the vast majority of U.S. states, Mississippi’s elderly residents are not healthy. Close to 5,000 deaths are recorded for every 100,000 state residents 65 and older in a given year, the highest mortality rate of all states and a strong indication that premature death is not uncommon in the state. Further, like many states towards the lower end of this list, the percentage of older Mississippians who report some form of disability, at 42.6%, is well above the national percentage of 35.4% and second highest of all states.
Methodology
To determine the best and worst states in which to grow old, 24/7 Wall St. reviewed income, health, education, and environment and access data on each state’s elderly population. We created an index of various measures for each of these four broad categories. The geometric mean of the four index values was used to rank states.
To construct the indices we used the min-max normalization method. For reference, a similar methodology was used in constructing HelpAge International’s Global AgeWatch Index and the United Nation’s Human Development Index.
INCOME
The percentage of elderly households with supplemental retirement income as well as poverty rates and median household income for the 65 and over population are one-year estimates from the U.S. Census Bureau’s 2015 American Community Survey. Additionally, as a measure of cost of living, we considered regional price parity from the Bureau of Economic Analysis.
HEALTH
The percentage of noninstitutionalized people 65 and over with a disability came from the Census. We also included 2013 life expectancy at birth from the Institute for Health Metrics and Evaluation, a global health research center affiliated with the University of Washington, the percentage of adults who reported having a personal doctor in 2013 from the Kaiser Family Foundation, as well as the 2013 crude elderly mortality rate per 100,000 people 65 and over in each state from the CDC.
EDUCATION
The share of people 65 and over with a bachelor’s degree or higher came from the ACS.
ENVIRONMENT and ACCESS
The environment and access category includes 2014 violent crime rates from the FBI’s Uniform Crime Report, and the share of workers who walk or use public transportation is from the ACS. In addition, this category includes data on the number of social establishments — restaurants, libraries, civic organizations, among others — as well as the number of hospitals in the state. Both numbers are adjusted for population.
Want retirement to come a few years earlier than you’d planned? Or are you ready to retire now, but want an extra set of eyes on your finances?
Now you can speak with up to 3 financial experts in your area for FREE. By simply clicking here you can begin to match with financial professionals who can help you build your plan to retire early. And the best part? The first conversation with them is free.
Click here to match with up to 3 financial pros who would be excited to help you make financial decisions.
Have questions about retirement or personal finance? Email us at [email protected]!
By emailing your questions to 24/7 Wall St., you agree to have them published anonymously on a673b.bigscoots-temp.com.
By submitting your story, you understand and agree that we may use your story, or versions of it, in all media and platforms, including via third parties.
Thank you for reading! Have some feedback for us?
Contact the 24/7 Wall St. editorial team.