Special Report
States Where Seniors Are Most Likely to Die From a Fall
Published:
Last Updated:

Many Americans entering old age can look forward to a comfortable retirement, pursuing lingering life goals, and sharing a life of experience with younger generations. However, the physical decline that comes with aging brings a host of well-known disadvantages for going about daily life. While a trip or fall can be a forgettable event for a young adult, falling can be a life-changing — even fatal — event for the elderly.
Falls are the leading cause of fatal and nonfatal injuries among elderly Americans. In the United States, 2.8 million seniors are treated for fall injuries in emergency rooms every year.
Death rates from falls varies dramatically between states. To identify the states where the most elderly people die from falls, 24/7 Wall St. reviewed 2015 mortality rates for elderly populations in each state from the Centers for Disease Control and Prevention. Wisconsin has the highest rate with 135 deaths from falls for every 100,000 older residents. The incidence of elderly falling deaths in Wisconsin is over five times greater than in Alabama, the state with the lowest rate, at 26 deaths from falls for every 100,000 seniors in 2015.
Click here to see the states where older Americans are most likely to die from a fall.
Fatalities from fall injuries among the elderly are on the rise. While roughly 10,000 older Americans died a result of falls in 2000, roughly 29,000 died by 2015. This increase is not merely the result of a growing population. The population-adjusted rate has doubled since 2000 — from 30 deaths from falls for every 100,000 Americans 65 and over to 60 deaths per 100,000 in 2015.
While most falls do not cause any serious harm, one in five cause a broken bone, head injury, or other serious injury. Falls account for most traumatic brain injuries and 95% of hip fractures. Even when they are not hurt as a result of their fall, older people tend to become anxious of falling again and reduce their activity level as a preventative measure. However, this can actually lead to reduced strength, which further increases the likelihood of falling and being injured in the future.
A traumatic brain injury from a fall clearly increases the chance of dying, but even injuries such as hip fractures, can cause deaths in older people. Many hip fractures require surgery and extended hospital stays. Complications from these surgeries, as well as developing an infection like pneumonia, increase the likelihood of death after a hip fracture.
After age 65, the risk of serious fall continues to increase. People 85 and older are more than 20 times more likely to die from falling than people 65-69 years old, with a falling mortality rate of 250 per 100,000. The states with the highest elderly death rates from falling tend to be the states where people live longer. Nine of the 10 states with the highest mortality rate from falls have life expectancy longer than the national average. Of the 10 states with the lowest mortality rates from falls, seven have a lower life expectancy than the country as a whole.
The mortality rate from falls also varies between races. For every 100,000 white Americans, 66 died from falls in 2015, nearly triple the 23 per 100,000 mortality rate from falls for black Americans. Of the 25 states with the highest mortality rates from falls, 23 have populations with above-average white populations. This is the case in only 10 of the 25 states on the other end of the list.
A range of explanations could account for such a wide racial disparity in fall death rates. White Americans live longer than black Americans on average, for example, and the risk of physical injury increases with age. One factor influencing the large gap is that white people, even when controlling for age, are more likely than black people to develop osteoporosis — a bone disease that causes bones to be more susceptible to fracture.
Environmental factors in a state likely also play a role in the likelihood of falls. For example, states with the most deaths from falling such as Wisconsin, Minnesota, and Vermont tend to be in areas with cold winters and high amounts of snowfall, which create slippery conditions for walking. States with low mortality rates are more likely to be located in the south with much less snowfall and icy conditions.
To identify the states where the highest share of older people die from falls, 24/7 Wall St. reviewed 2015 crude mortality rates from falls per 100,000 people 65 years and older from the Centers for Disease Control and Prevention. The percentage of the population that is 65 years and older is also from the CDC. The share of people 65 years and older living in nursing homes is from the U.S. Census Bureau’s report, “65+ in the United States: 2010.” Medicare spending per capita is from the Centers for Medicare and Medicaid Services and is for 2014, the most recent period for which data is available. 2013 life expectancy at birth figures are provided by the Institute for Health Metrics and Evaluation (IHME), a global research center affiliated with the University of Washington.
These are the state where older Americans are most likely to die from a fall.

50. Alabama
> Deaths from falls per 100,000 seniors: 26.4
> Population 65 and over: 15.7% (20th highest)
> Seniors living in nursing home: 2.6% (23rd lowest)
> Medicare spending per capita: $8,521 (24th highest)
[in-text-ad]

49. New Jersey
> Deaths from falls per 100,000 seniors: 30.0
> Population 65 and over: 15.0% (23rd lowest)
> Seniors living in nursing home: 2.9% (24th highest)
> Medicare spending per capita: $11,055 (the highest)

48. Delaware
> Deaths from falls per 100,000 seniors: 36.1
> Population 65 and over: 17.0% (7th highest)
> Seniors living in nursing home: 2.4% (17th lowest)
> Medicare spending per capita: $9,624 (13th highest)

47. California
> Deaths from falls per 100,000 seniors: 39.3
> Population 65 and over: 13.3% (6th lowest)
> Seniors living in nursing home: 1.7% (9th lowest)
> Medicare spending per capita: $10,063 (9th highest)
[in-text-ad-2]

46. Louisiana
> Deaths from falls per 100,000 seniors: 40.1
> Population 65 and over: 14.0% (7th lowest)
> Seniors living in nursing home: 3.0% (23rd highest)
> Medicare spending per capita: $10,088 (8th highest)

45. Indiana
> Deaths from falls per 100,000 seniors: 40.4
> Population 65 and over: 14.6% (14th lowest)
> Seniors living in nursing home: 3.7% (11th highest)
> Medicare spending per capita: $9,038 (18th highest)
[in-text-ad]

44. New York
> Deaths from falls per 100,000 seniors: 41.7
> Population 65 and over: 15.0% (22nd lowest)
> Seniors living in nursing home: 3.3% (17th highest)
> Medicare spending per capita: $10,951 (2nd highest)

43. Kentucky
> Deaths from falls per 100,000 seniors: 42.7
> Population 65 and over: 15.2% (25th lowest)
> Seniors living in nursing home: 3.3% (16th highest)
> Medicare spending per capita: $8,826 (20th highest)

42. South Carolina
> Deaths from falls per 100,000 seniors: 44.8
> Population 65 and over: 16.2% (12th highest)
> Seniors living in nursing home: 2.1% (13th lowest)
> Medicare spending per capita: $8,361 (21st lowest)
[in-text-ad-2]

41. Georgia
> Deaths from falls per 100,000 seniors: 45.1
> Population 65 and over: 12.8% (4th lowest)
> Seniors living in nursing home: 2.2% (14th lowest)
> Medicare spending per capita: $8,553 (22nd highest)

40. Nevada
> Deaths from falls per 100,000 seniors: 45.5
> Population 65 and over: 14.6% (15th lowest)
> Seniors living in nursing home: 1.0% (the lowest)
> Medicare spending per capita: $9,202 (17th highest)
[in-text-ad]
39. Texas
> Deaths from falls per 100,000 seniors: 46.5
> Population 65 and over: 11.7% (3rd lowest)
> Seniors living in nursing home: 2.4% (18th lowest)
> Medicare spending per capita: $10,139 (7th highest)

38. Illinois
> Deaths from falls per 100,000 seniors: 46.8
> Population 65 and over: 14.2% (11th lowest)
> Seniors living in nursing home: 3.3% (15th highest)
> Medicare spending per capita: $9,610 (14th highest)
37. Arkansas
> Deaths from falls per 100,000 seniors: 47.4
> Population 65 and over: 16.0% (15th highest)
> Seniors living in nursing home: 3.3% (14th highest)
> Medicare spending per capita: $8,175 (18th lowest)
[in-text-ad-2]

36. Alaska
> Deaths from falls per 100,000 seniors: 50.8
> Population 65 and over: 9.9% (the lowest)
> Seniors living in nursing home: 1.3% (3rd lowest)
> Medicare spending per capita: $8,055 (14th lowest)

35. Utah
> Deaths from falls per 100,000 seniors: 51.3
> Population 65 and over: 10.3% (2nd lowest)
> Seniors living in nursing home: 1.4% (4th lowest)
> Medicare spending per capita: $8,063 (15th lowest)
[in-text-ad]

34. Hawaii
> Deaths from falls per 100,000 seniors: 53.2
> Population 65 and over: 16.5% (8th highest)
> Seniors living in nursing home: 1.7% (10th lowest)
> Medicare spending per capita: $6,527 (the lowest)

33. Michigan
> Deaths from falls per 100,000 seniors: 53.6
> Population 65 and over: 15.8% (18th highest)
> Seniors living in nursing home: 2.3% (16th lowest)
> Medicare spending per capita: $10,053 (10th highest)

32. Mississippi
> Deaths from falls per 100,000 seniors: 53.9
> Population 65 and over: 14.7% (18th lowest)
> Seniors living in nursing home: 3.1% (20th highest)
> Medicare spending per capita: $9,287 (16th highest)
[in-text-ad-2]

31. Tennessee
> Deaths from falls per 100,000 seniors: 55.0
> Population 65 and over: 15.4% (24th highest)
> Seniors living in nursing home: 2.8% (25th lowest)
> Medicare spending per capita: $8,507 (25th lowest)

30. Massachusetts
> Deaths from falls per 100,000 seniors: 59.4
> Population 65 and over: 15.4% (25th highest)
> Seniors living in nursing home: 3.7% (10th highest)
> Medicare spending per capita: $10,636 (4th highest)
[in-text-ad]

29. Ohio
> Deaths from falls per 100,000 seniors: 60.3
> Population 65 and over: 15.9% (16th highest)
> Seniors living in nursing home: 3.6% (12th highest)
> Medicare spending per capita: $9,394 (15th highest)

28. Idaho
> Deaths from falls per 100,000 seniors: 60.8
> Population 65 and over: 14.7% (20th lowest)
> Seniors living in nursing home: 1.6% (8th lowest)
> Medicare spending per capita: $7,543 (5th lowest)

27. Virginia
> Deaths from falls per 100,000 seniors: 61.4
> Population 65 and over: 14.2% (10th lowest)
> Seniors living in nursing home: 2.2% (15th lowest)
> Medicare spending per capita: $8,091 (16th lowest)
[in-text-ad-2]

26. Maryland
> Deaths from falls per 100,000 seniors: 62.2
> Population 65 and over: 14.1% (8th lowest)
> Seniors living in nursing home: 2.7% (24th lowest)
> Medicare spending per capita: $10,488 (6th highest)
25. Nebraska
> Deaths from falls per 100,000 seniors: 63.9
> Population 65 and over: 14.7% (19th lowest)
> Seniors living in nursing home: 4.3% (5th highest)
> Medicare spending per capita: $8,409 (23rd lowest)
[in-text-ad]

24. Florida
> Deaths from falls per 100,000 seniors: 66.3
> Population 65 and over: 19.4% (the highest)
> Seniors living in nursing home: 1.6% (7th lowest)
> Medicare spending per capita: $10,511 (5th highest)

23. Maine
> Deaths from falls per 100,000 seniors: 67.5
> Population 65 and over: 18.8% (2nd highest)
> Seniors living in nursing home: 2.8% (25th highest)
> Medicare spending per capita: $8,165 (17th lowest)

22. North Carolina
> Deaths from falls per 100,000 seniors: 67.7
> Population 65 and over: 15.1% (24th lowest)
> Seniors living in nursing home: 2.5% (21st lowest)
> Medicare spending per capita: $8,350 (20th lowest)
[in-text-ad-2]

21. Pennsylvania
> Deaths from falls per 100,000 seniors: 68.5
> Population 65 and over: 17.0% (6th highest)
> Seniors living in nursing home: 3.6% (13th highest)
> Medicare spending per capita: $9,675 (12th highest)

20. Missouri
> Deaths from falls per 100,000 seniors: 68.6
> Population 65 and over: 15.7% (21st highest)
> Seniors living in nursing home: 3.8% (8th highest)
> Medicare spending per capita: $8,627 (21st highest)
[in-text-ad]

19. Connecticut
> Deaths from falls per 100,000 seniors: 69.7
> Population 65 and over: 15.8% (19th highest)
> Seniors living in nursing home: 4.0% (7th highest)
> Medicare spending per capita: $10,847 (3rd highest)
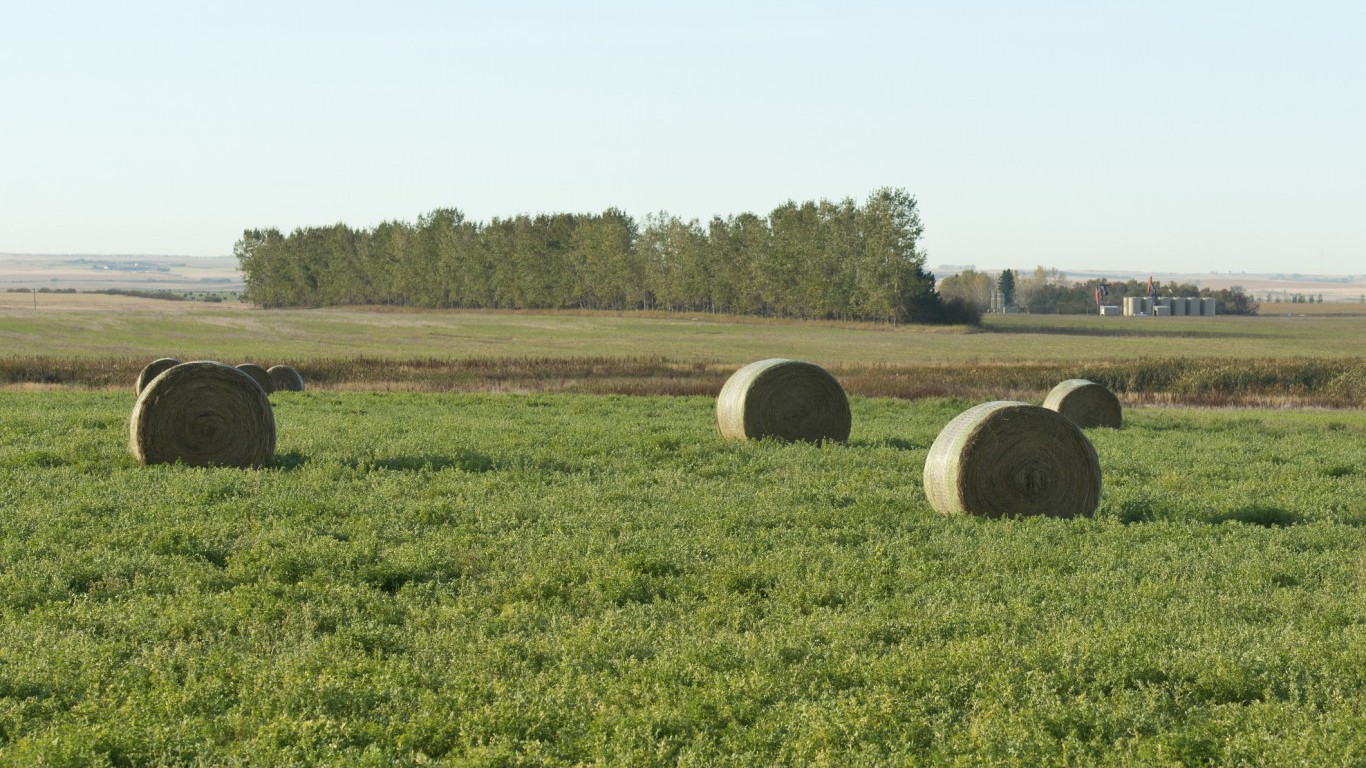
18. North Dakota
> Deaths from falls per 100,000 seniors: 73.6
> Population 65 and over: 14.2% (9th lowest)
> Seniors living in nursing home: 5.4% (the highest)
> Medicare spending per capita: $7,886 (10th lowest)
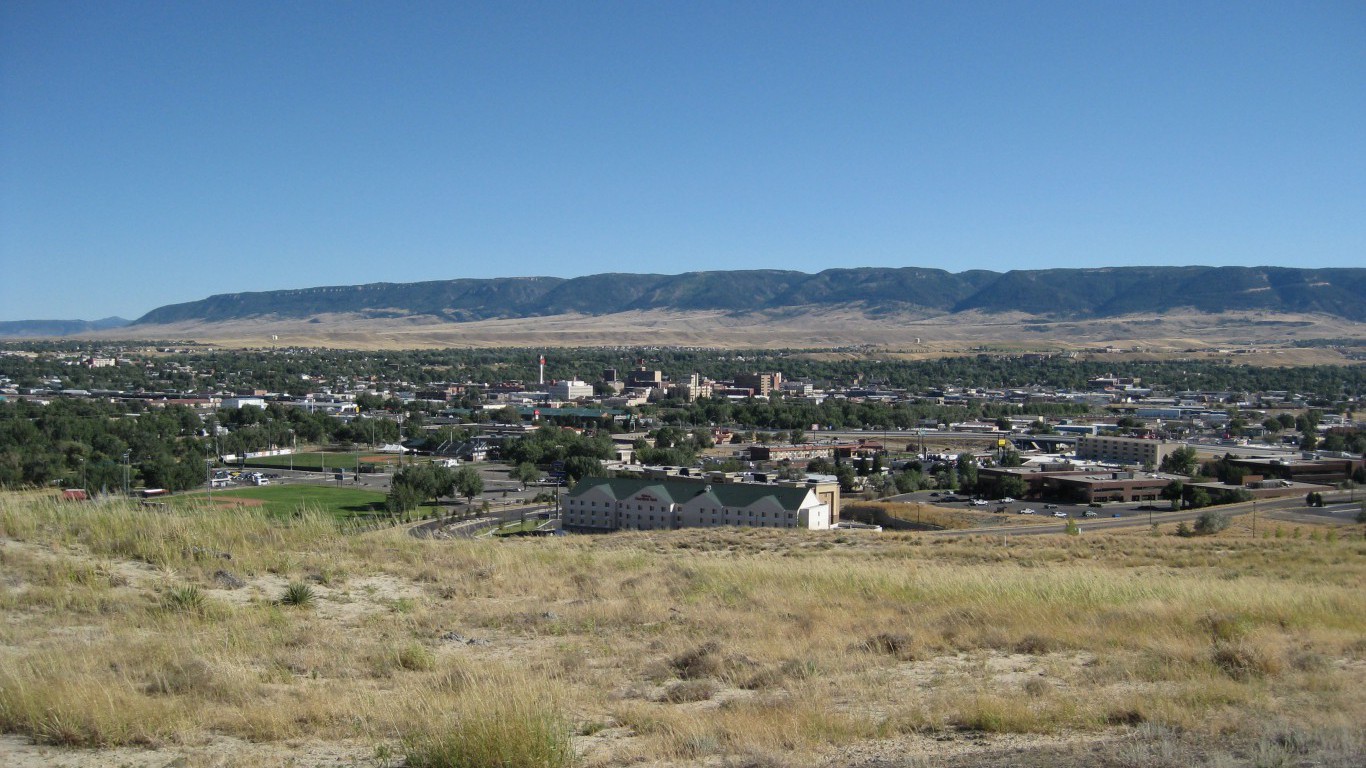
17. Wyoming
> Deaths from falls per 100,000 seniors: 74.4
> Population 65 and over: 14.5% (13th lowest)
> Seniors living in nursing home: 2.6% (22nd lowest)
> Medicare spending per capita: $7,669 (6th lowest)
[in-text-ad-2]

16. West Virginia
> Deaths from falls per 100,000 seniors: 80.9
> Population 65 and over: 18.2% (3rd highest)
> Seniors living in nursing home: 2.5% (20th lowest)
> Medicare spending per capita: $8,403 (22nd lowest)

15. Washington
> Deaths from falls per 100,000 seniors: 81.3
> Population 65 and over: 14.4% (12th lowest)
> Seniors living in nursing home: 1.7% (11th lowest)
> Medicare spending per capita: $7,946 (12th lowest)
[in-text-ad]

14. Arizona
> Deaths from falls per 100,000 seniors: 81.8
> Population 65 and over: 16.4% (10th highest)
> Seniors living in nursing home: 1.0% (2nd lowest)
> Medicare spending per capita: $8,449 (24th lowest)
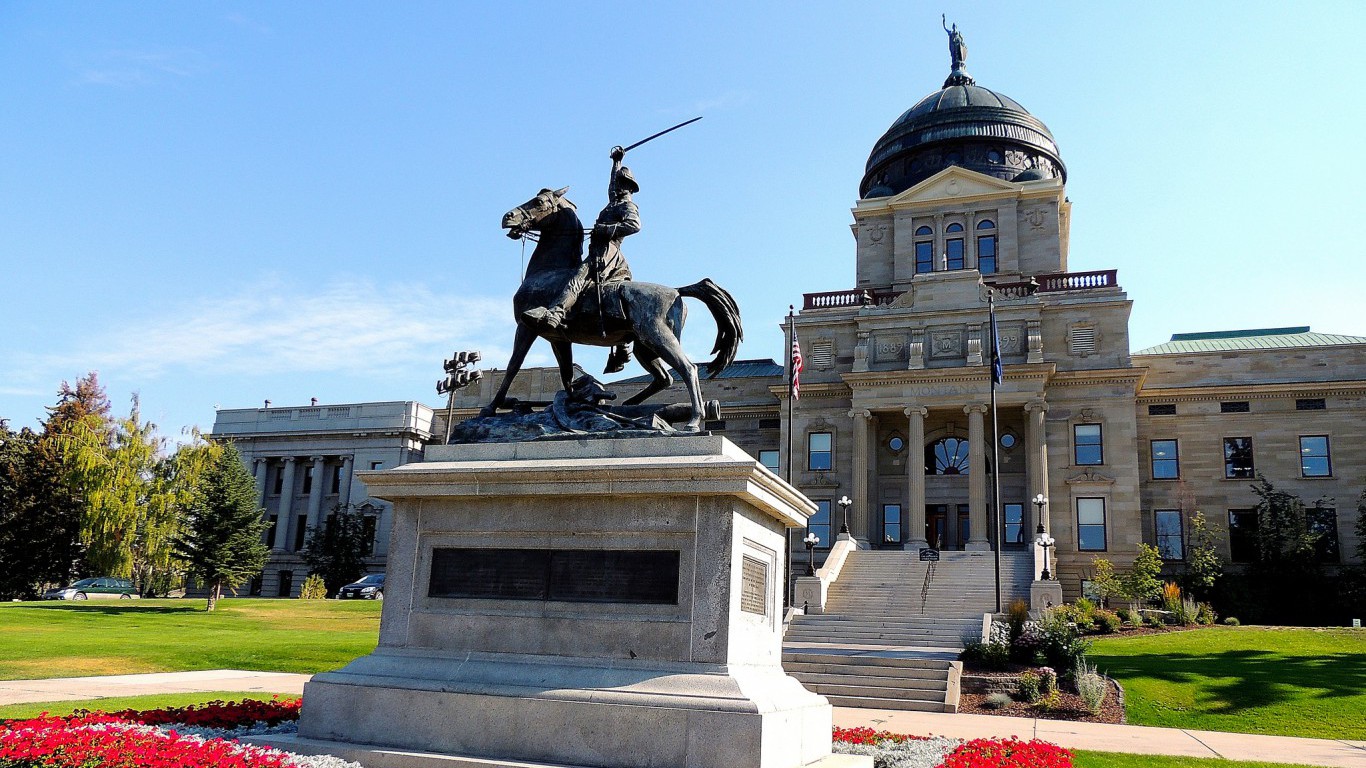
13. Montana
> Deaths from falls per 100,000 seniors: 86.0
> Population 65 and over: 17.2% (5th highest)
> Seniors living in nursing home: 2.5% (19th lowest)
> Medicare spending per capita: $7,021 (2nd lowest)

12. Kansas
> Deaths from falls per 100,000 seniors: 90.5
> Population 65 and over: 14.6% (16th lowest)
> Seniors living in nursing home: 4.2% (6th highest)
> Medicare spending per capita: $8,540 (23rd highest)
[in-text-ad-2]

11. Oklahoma
> Deaths from falls per 100,000 seniors: 92.5
> Population 65 and over: 14.7% (21st lowest)
> Seniors living in nursing home: 3.0% (21st highest)
> Medicare spending per capita: $8,843 (19th highest)
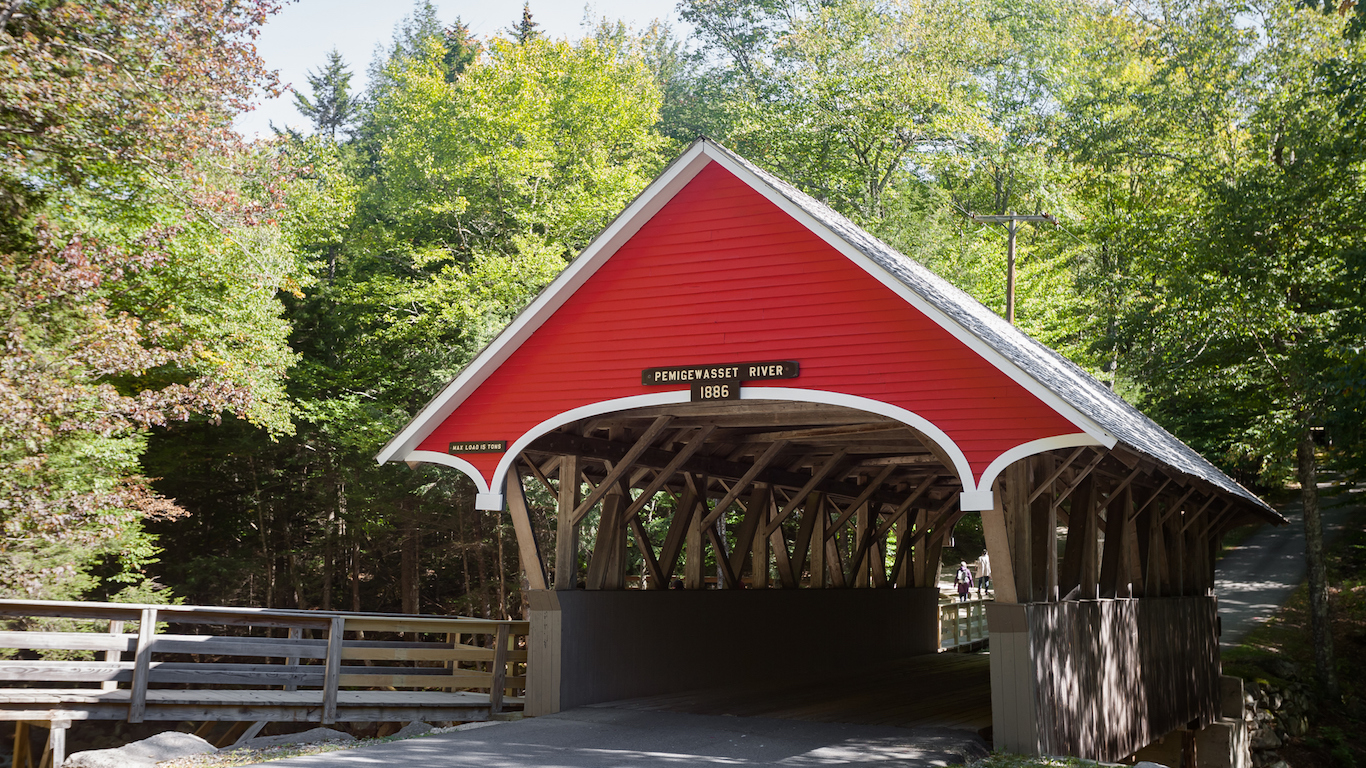
10. New Hampshire
> Deaths from falls per 100,000 seniors: 95.9
> Population 65 and over: 16.5% (9th highest)
> Seniors living in nursing home: 3.2% (19th highest)
> Medicare spending per capita: $8,515 (25th highest)
[in-text-ad]

9. Rhode Island
> Deaths from falls per 100,000 seniors: 98.3
> Population 65 and over: 16.1% (14th highest)
> Seniors living in nursing home: 4.4% (4th highest)
> Medicare spending per capita: $9,814 (11th highest)

8. Oregon
> Deaths from falls per 100,000 seniors: 98.4
> Population 65 and over: 16.4% (11th highest)
> Seniors living in nursing home: 1.4% (6th lowest)
> Medicare spending per capita: $7,285 (3rd lowest)

7. Iowa
> Deaths from falls per 100,000 seniors: 98.4
> Population 65 and over: 16.1% (13th highest)
> Seniors living in nursing home: 4.7% (2nd highest)
> Medicare spending per capita: $7,777 (8th lowest)
[in-text-ad-2]

6. Colorado
> Deaths from falls per 100,000 seniors: 102.7
> Population 65 and over: 13.0% (5th lowest)
> Seniors living in nursing home: 2.1% (12th lowest)
> Medicare spending per capita: $7,823 (9th lowest)

5. New Mexico
> Deaths from falls per 100,000 seniors: 105.0
> Population 65 and over: 15.8% (17th highest)
> Seniors living in nursing home: 1.4% (5th lowest)
> Medicare spending per capita: $7,393 (4th lowest)
[in-text-ad]
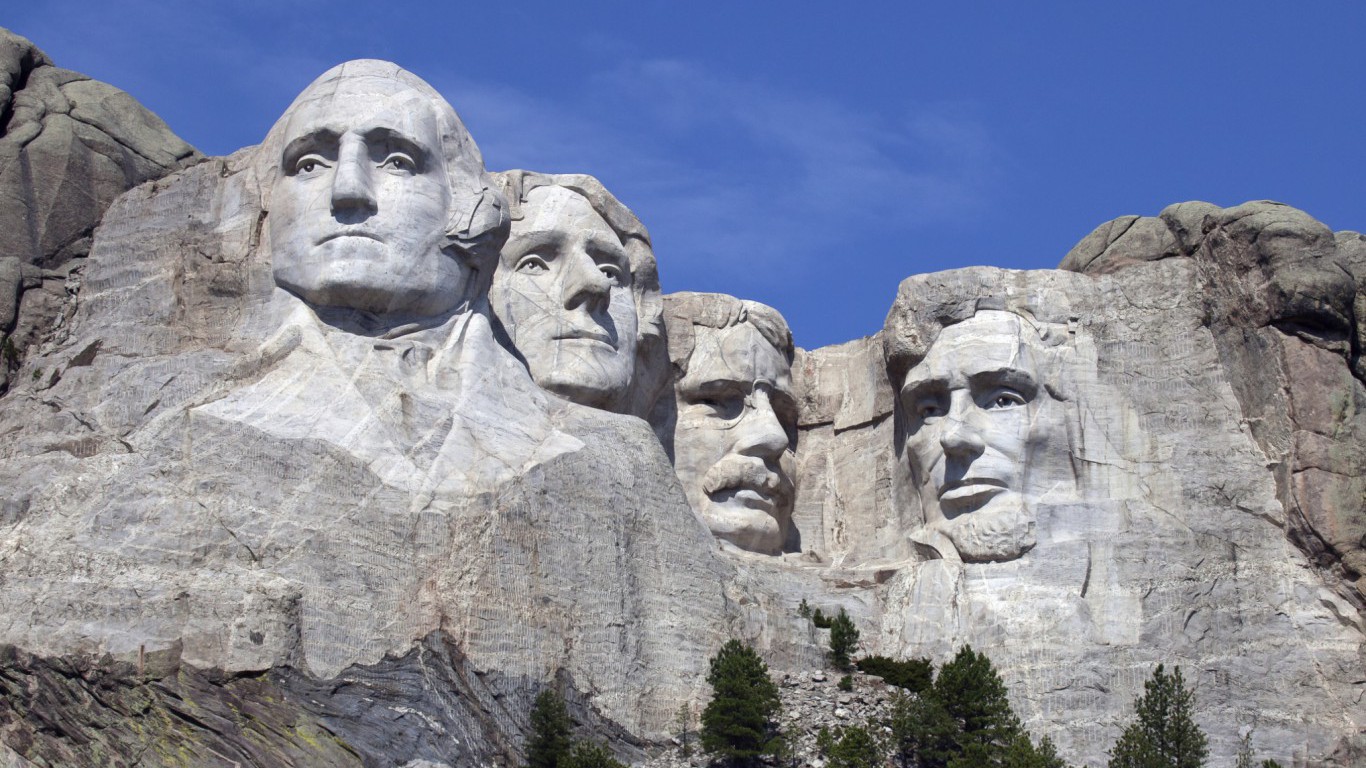
4. South Dakota
> Deaths from falls per 100,000 seniors: 116.1
> Population 65 and over: 15.7% (22nd highest)
> Seniors living in nursing home: 4.6% (3rd highest)
> Medicare spending per capita: $7,705 (7th lowest)
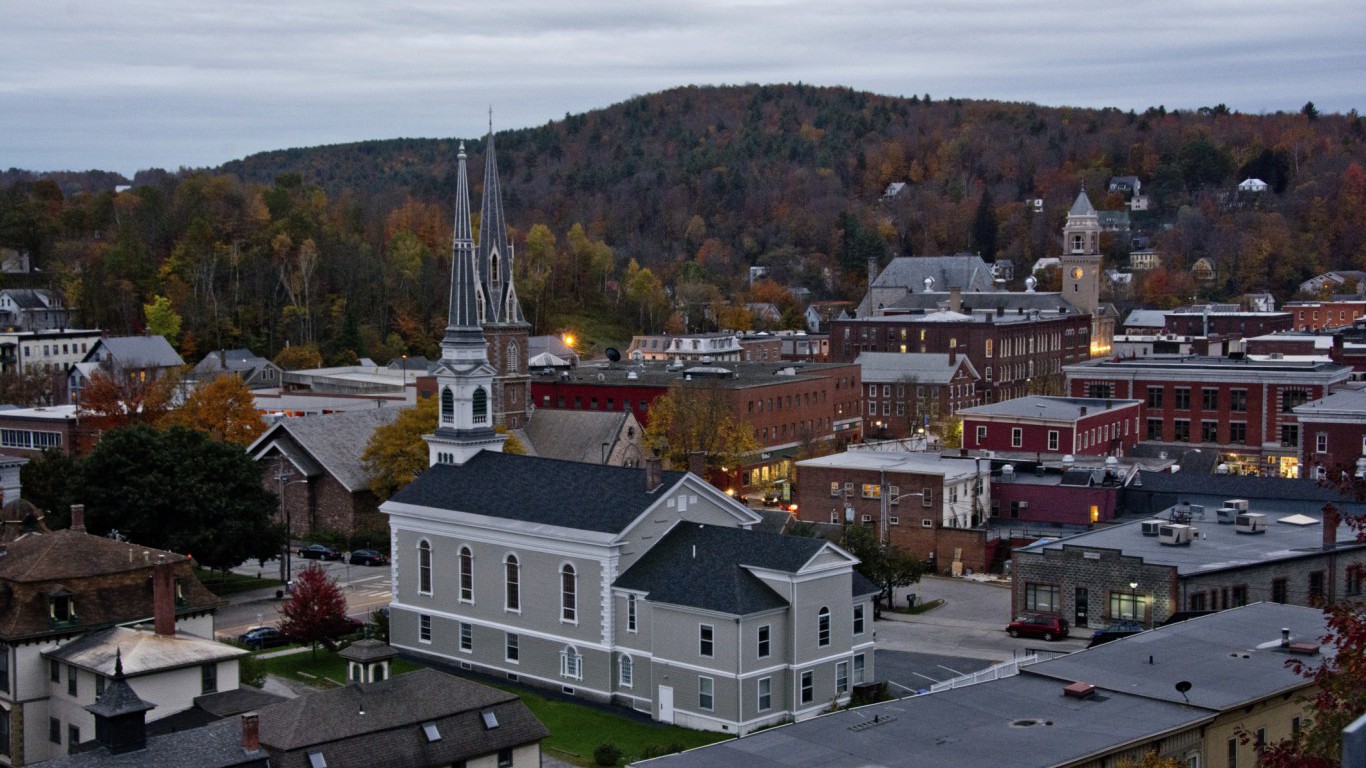
3. Vermont
> Deaths from falls per 100,000 seniors: 121.9
> Population 65 and over: 17.6% (4th highest)
> Seniors living in nursing home: 3.0% (22nd highest)
> Medicare spending per capita: $7,890 (11th lowest)
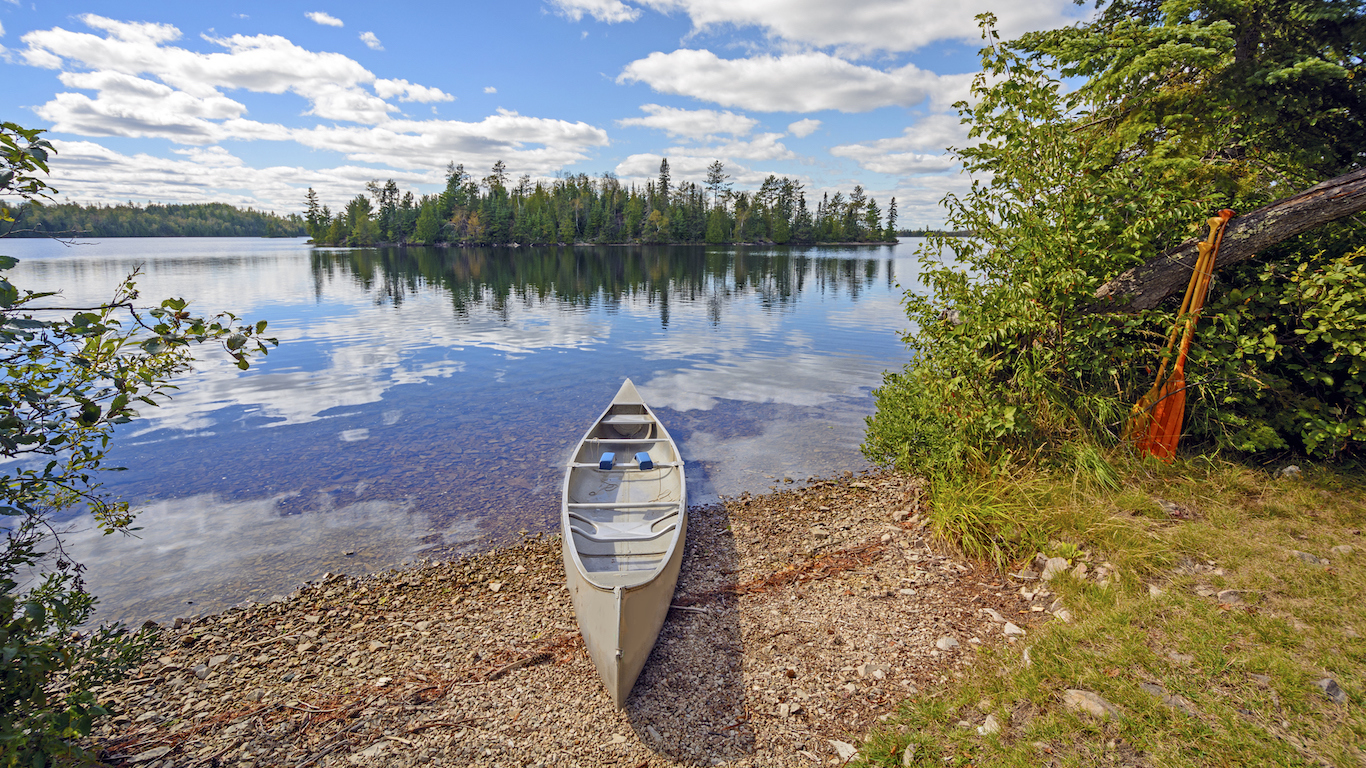
2. Minnesota
> Deaths from falls per 100,000 seniors: 126.2
> Population 65 and over: 14.7% (17th lowest)
> Seniors living in nursing home: 3.7% (9th highest)
> Medicare spending per capita: $8,184 (19th lowest)
[in-text-ad-2]
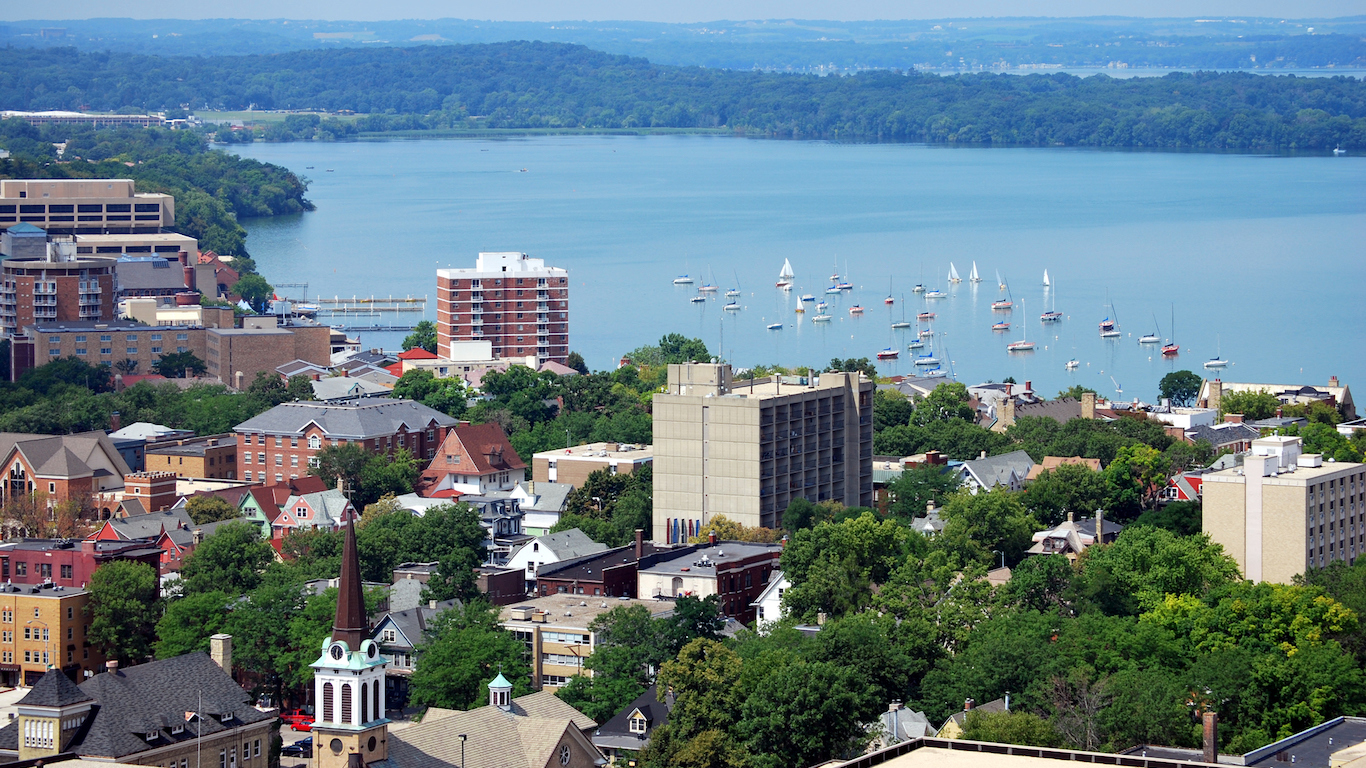
1. Wisconsin
> Deaths from falls per 100,000 seniors: 135.0
> Population 65 and over: 15.6% (23rd highest)
> Seniors living in nursing home: 3.3% (18th highest)
> Medicare spending per capita: $8,019 (13th lowest)
The average American spends $17,274 on debit cards a year, and it’s a HUGE mistake. First, debit cards don’t have the same fraud protections as credit cards. Once your money is gone, it’s gone. But more importantly you can actually get something back from this spending every time you swipe.
Issuers are handing out wild bonuses right now. With some you can earn up to 5% back on every purchase. That’s like getting a 5% discount on everything you buy!
Our top pick is kind of hard to imagine. Not only does it pay up to 5% back, it also includes a $200 cash back reward in the first six months, a 0% intro APR, and…. $0 annual fee. It’s quite literally free money for any one that uses a card regularly. Click here to learn more!
Flywheel Publishing has partnered with CardRatings to provide coverage of credit card products. Flywheel Publishing and CardRatings may receive a commission from card issuers.
Thank you for reading! Have some feedback for us?
Contact the 24/7 Wall St. editorial team.