Special Report
America's Happiest (and Most Miserable) States

Published:
Last Updated:

Nationwide, Americans’ well-being improved in 2016 compared to 2015 and 2014. While many enjoy comfortable, healthy, and happy living and take their well-being for granted, not all Americans enjoy such standards. For many, hardship, pain, and despair can be a part of life as for them basic elements of well-being remain elusive.
The well-being of Americans varies dramatically, depending on where they live. To capture Americans’ general well-being, Gallup surveyed 177,281 people to build the Well-Being Index in partnership with health and wellness organization Healthways. The index measures whether individuals feel a sense of purpose, have supportive relationships, are financially secure, are satisfied with their community, and are in good physical health. According to the survey, Hawaii residents report the highest well-being, West Virginia’s the lowest.
[in-text-ad]
People’s perception of their own well-being is often the product of a number of objective socioeconomic factors. 24/7 Wall St. matched Gallup’s ranking with data on health habits and outcomes, educational attainment, crime, and several other socioeconomic measures.
Click here to see America’s happiest (and most miserable) states.
States where residents report high well-being tend to be quite affluent, while the opposite is true among states where residents report low well-being. The median annual household income exceeds the national median of $55,775 in 14 of the 25 higher-ranked states, while this is the case in just six of the 25 states on the low end. In an interview with 24/7 Wall St., Dan Witters, research director at the Gallup-Healthways Well-Being Index, explained that while “in wealthier communities in general you’re going to expect to see better well-being,” as Witters said, there are many exceptions to this relationship. Income can only affect well-being up to a point. Generally, income is directly correlated with financial well-being up to a threshold of about $75,000 a year. Beyond that, Witters added, “the richer you get the ever-greater amounts of wealth you need to tack on on top of it to continue to push life evaluation higher and higher.”
Witters further explained how difficult it can be for a state to change its position in the rankings. A few states, including Colorado, Hawaii, Montana, and Minnesota have been in the top 10 in all nine years of the Gallup survey. Other states, such as Mississippi, Kentucky, and West Virginia remain consistently on the low end of the ranking.
However, while income levels can make self-evaluations more entrenched, working to improve certain aspects of communities can dramatically raise well-being, even in low-income areas. Karissa Price, president of Healthways, told 24/7 Wall St. that a Healthways initiative, known as the Blue Zones Project, invests in well-being and aims to improve longevity and quality of life, irrespective of income. Blue Zones identified certain behaviors and attitudes common in some of the world’s happiest and longest living populations, such as having a sense of purpose, eating right, and cultivating close relationships.
Texas and Florida had the some of the largest improvements in well-being in the history of the survey, a trend Price argued can be attributed to the introduction of Blue Zones interventions. “I don’t think it’s a coincidence that [Texas and Florida] happen to be the places where we’ve seen the greatest interest in 2016 in expanding the Blue Zones work.”
Many of the factors that can contribute to better overall well-being can do so in multiple, interrelated ways. We considered college attainment rates, which bore a strong relationship with Gallup’s rank of overall well-being among states. Most of the states with low college attainment had among the worst overall well-being. A college education can contribute to well-being by increasing the chances of obtaining a good job and adequate income. A college education has also been shown to provide people with a sense of purpose and direction in life.
Obviously, having or not having a job can have a significant impact on personal happiness. The quality of life among employed populations still varies considerably, however, based on a variety of factors summarized within Gallup’s purpose category: having the right career for you, liking what you do each day, using your strengths, learning and growing, setting and reaching goals, and being inspired by a leader. Because of how varied work experiences can be, employment levels and a population’s reported sense of purpose in life are not in lockstep across states.
Residents of states with the highest life evaluations typically report similar behaviors and health outcomes. Obesity, smoking, and exercise, for example, are all far more common in low well-being states.
Click here to read our methodology.
These are America’s happiest (and most miserable) states.

1. Hawaii
> Poverty rate: 10.6% (7th lowest)
> Unemployment rate: 3.6% (6th lowest)
> Obesity rate: 22.7% (2nd lowest)
> Pct. of adults w/ bachelor’s degree: 31.4% (18th highest)
In a national survey conducted by Gallup Healthways assessing Americans by their sense of purpose, social life, financial health, community pride, and physical fitness, Hawaii’s residents report the highest well-being of any state. Well-being is closed tied to financial status. Research has shown that income is closely tied to happiness up to a threshold of around $75,000 a year, after which income is less likely to have a major effect on well-being. The estimated 49.2% of Hawaii households that make $75,000 a year benefit from this level of financial security, the second largest share nationwide.
Strong social support is also vital for a community’s well-being. One sign of active community life in Hawaii may be the state’s high marriage rate and high share of families. Hawaii has the second most weddings per capita, and families in Hawaii comprise 69.4% of all households, the second largest share in the country.
[in-text-ad]

2. Alaska
> Poverty rate: 10.3% (5th lowest)
> Unemployment rate: 6.5% (4th highest)
> Obesity rate: 29.8% (25th lowest)
> Pct. of adults w/ bachelor’s degree: 29.7% (24th highest)
Alaskans report a higher degree of well-being than any state other than Hawaii. While money does not necessarily lead to well-being, an income above a certain threshold provides financial security. In Alaska, an estimated 49.0% of households earn $75,000 or more, the third largest share of any state.
Alaska is one of the least dense states. The lower density can limit access to fresh, healthy foods in some communities. The state’s wintry climate prevents farmers from growing produce year-round, which may also increase the risk of food insecurity. Some 31.5% of the state’s population earn both relatively low incomes and lack adequate access to a grocery store, the third highest such proportion nationwide. Still, Alaskans report fairly good physical health. Just 7.6% of adults have diabetes, 27.5% have high blood pressure, and just 9.2% report recurring poor physical health, each among the smallest shares of all states.
3. South Dakota
> Poverty rate: 13.7% (24th lowest)
> Unemployment rate: 3.1% (3rd lowest)
> Obesity rate: 30.4% (21st highest)
> Pct. of adults w/ bachelor’s degree: 27.5% (17th lowest)
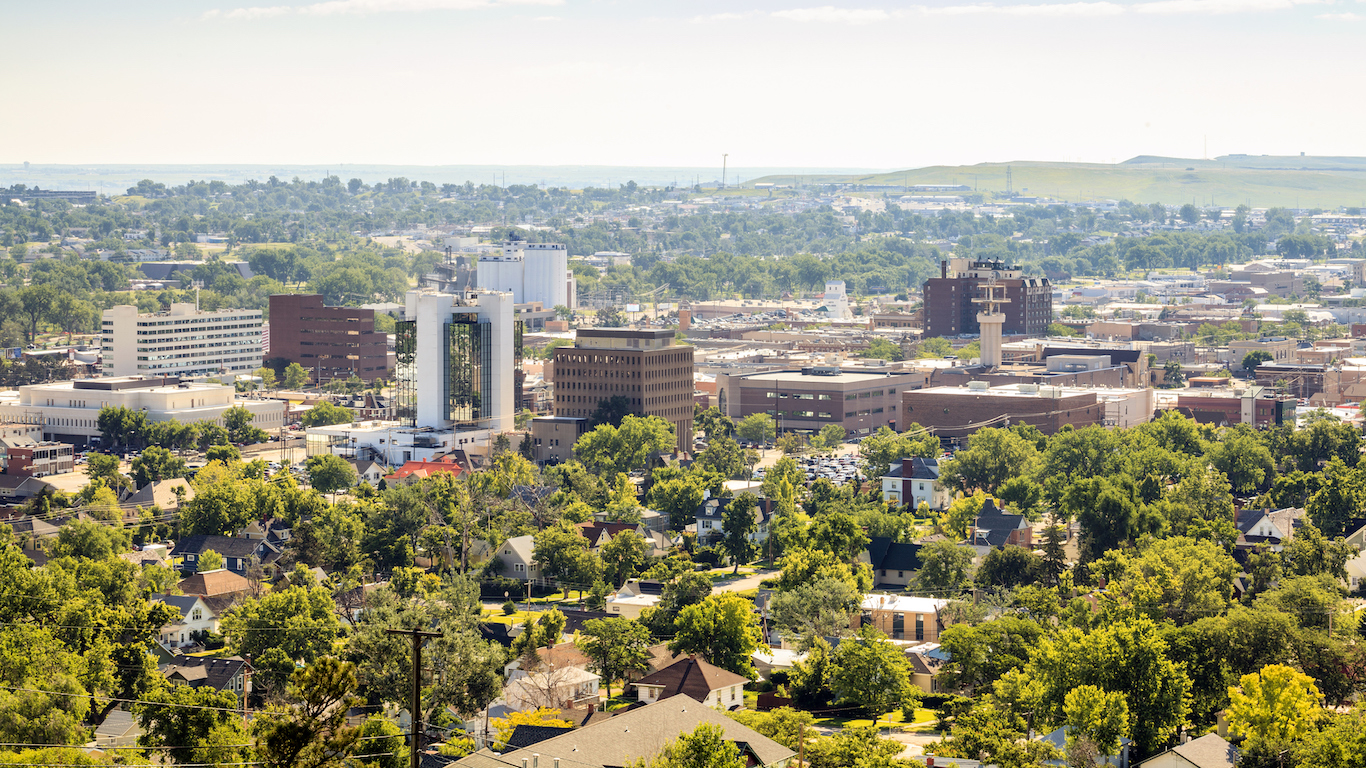
South Dakota residents report particularly high financial and community well-being. While the median household income of $53,017 a year in South Dakota is roughly $3,000 less than the national median, the cost of living in the state is nearly the lowest in the country. Goods and services cost 88 cents on the dollar, the fourth lowest of any state.
South Dakota’s numerous recreational opportunities may help foster strong communities and better health outcomes. The state is home to a number of national parks, sites, and some of the least polluted air in the country. Just 21.5% of South Dakota adults do not exercise regularly, a smaller share than the 26.2% national inactivity rate. Relatedly, just 9.8% of South Dakota adults frequently experience poor physical health, one of the smallest shares of any state.

4. Maine
> Poverty rate: 13.4% (22nd lowest)
> Unemployment rate: 4.4% (17th lowest)
> Obesity rate: 30.0% (24th highest)
> Pct. of adults w/ bachelor’s degree: 30.1% (22nd highest)
Maine broke into the top 10 this year for the first time in the history of the Well-Being Index. Witters noted the leap in the ranking was largely due to fewer people reporting significant physical problems on a day-to-day basis.
A number of factors can help explain the widespread well-being in Maine, including a low violent crime rate, low property crime levels, and low unemployment. There were just 130 incidents of violent crime reported per 100,000 Maine residents, second lowest after only Vermont. The 1,830 property crimes per 100,000 state residents is also one of the lowest of all states. Maine’s unemployment rate of 4.4% is well below the annual national rate of 5.3%.
[in-text-ad-2]

5. Colorado
> Poverty rate: 11.5% (14th lowest)
> Unemployment rate: 3.9% (10th lowest)
> Obesity rate: 20.2% (the lowest)
> Pct. of adults w/ bachelor’s degree: 39.2% (2nd highest)
Colorado’s population is one of the most physically fit in the country. Just 20.2% of Colorado adults are obese, far less than the 29.8% national obesity rate. Colorado adults eat more fruits and vegetables on average day than in nearly any other state, and they get the most exercise. Partially as a result of healthy behavior, Colorado residents are less likely to suffer from a fatal heart disease than the average American. Just about 130 in every 100,000 Colorado residents die from cardiovascular disease, the least of any state other than Minnesota. These behaviors and outcomes largely account for the state’s excellent self-evaluations in the physical element of well-being.
College graduates are more likely to own a home, have health insurance, and ultimately earn more money than Americans without a bachelor’s degree — all important aspects of well-being. At 39.2% of all adults, Colorado has the highest college attainment rate of any state other than Massachusetts.

6. Vermont
> Poverty rate: 10.2% (4th lowest)
> Unemployment rate: 3.7% (9th lowest)
> Obesity rate: 25.1% (8th lowest)
> Pct. of adults w/ bachelor’s degree: 36.9% (7th highest)
A college education can give people a greater sense of control over their life, and it is likely no coincidence that many of the happiest states also tend to have well educated populations. In Vermont, 36.9% of adults have a bachelor’s degree, a larger share than in all but six other states.
A strong sense of well-being in the Green Mountain State is also likely attributable to the relatively low likelihood of financial instability and low incidence of violence. Only 10.2% of Vermonters live in poverty, well below the 14.7% national rate. Further, with only about 118 violent crimes for every 100,000 state residents annually, Vermont is the safest state in the country.
[in-text-ad]

7. Arizona
> Poverty rate: 17.4% (8th highest)
> Unemployment rate: 6.1% (8th highest)
> Obesity rate: 28.4% (17th lowest)
> Pct. of adults w/ bachelor’s degree: 27.7% (18th lowest)
For a state with relatively high overall well-being, Arizona is an outlier in a number of measures. For example, the state’s unemployment rate of 6.1% is eighth highest in the country. The state’s high unemployment may be due in part to low education levels among members of the labor force. Just 27.7% of the state’s adults have a bachelor’s degree, compared to the national share of 30.6%. The state’s educational attainment rate is one of the lowest among states with high well-being overall.
On the other hand, state residents are less likely to suffer from a number of serious illnesses. For example, 136 out of every 100,000 Arizona residents die from heart disease each year, much lower than the national rate of 167 per 100,000 residents.

8. Minnesota
> Poverty rate: 10.2% (4th lowest)
> Unemployment rate: 3.7% (9th lowest)
> Obesity rate: 26.1% (12th lowest)
> Pct. of adults w/ bachelor’s degree: 34.7% (10th highest)
The overall well-being of Minnesota residents is likely closely related to healthy habits and good physical health. Obesity is a root cause of multiple serious, often fatal, health conditions, and only 26.1% of Minnesota residents are obese, a smaller share than the 29.8% of Americans. Additionally, adults in the state report an average of only 2.9 mentally unhealthy and 3.1 physically unhealthy days a month, each nearly the fewest such days of any state in the country. In Minnesota, healthy outcomes are bolstered by healthy habits. Only 21.8% of adults lead completely sedentary lifestyles, a considerably smaller share than the 26.2% of American adults.
Minnesota residents also report a high degree of financial well-being. This may be partially due to the relatively few residents in the state who face serious financial hardship. Just 10.2% of the Minnesota residents live in poverty, the fourth smallest share in the country.
9. Montana
> Poverty rate: 14.6% (24th highest)
> Unemployment rate: 4.1% (12th lowest)
> Obesity rate: 23.6% (3rd lowest)
> Pct. of adults w/ bachelor’s degree: 30.6% (20th highest)
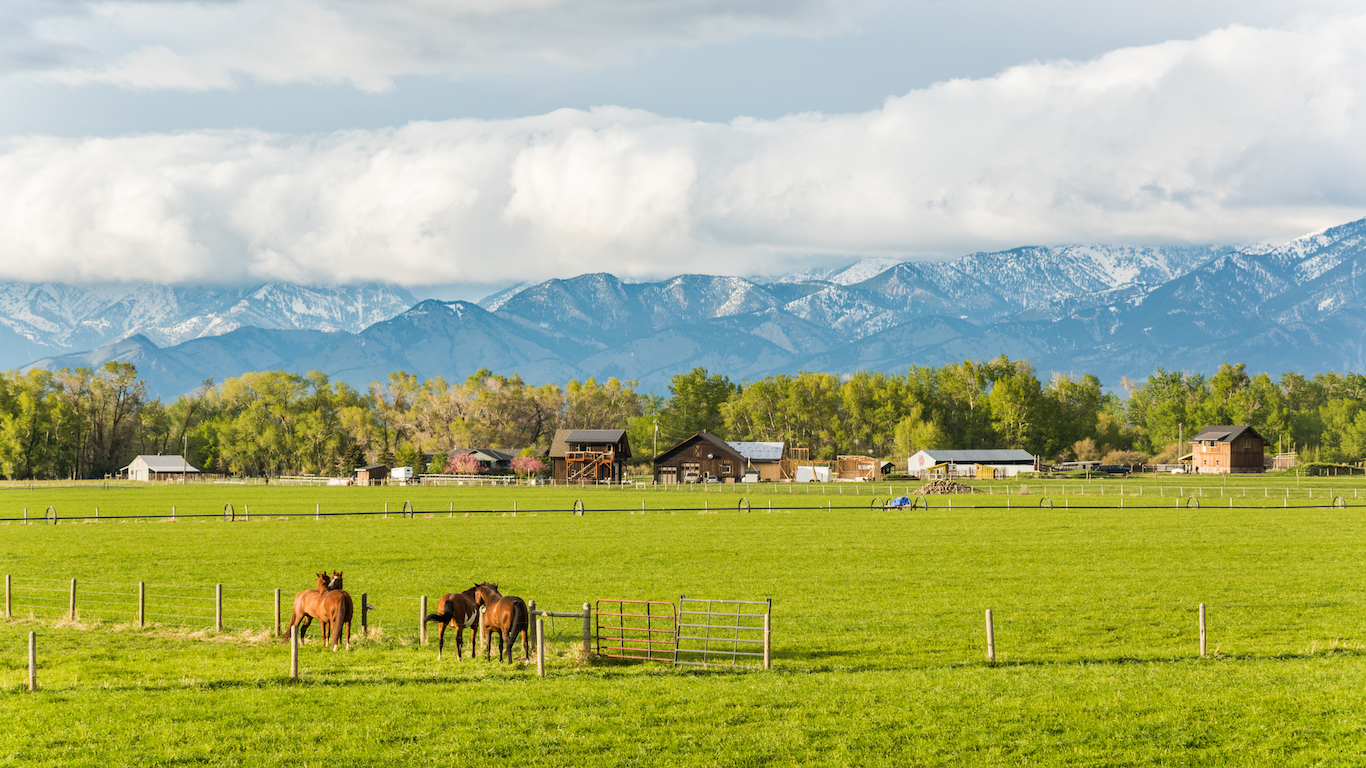
Montana is one of the least densely populated states in the country, which can limit access to fresh, healthy food for some communities. Indeed, 26% of state residents earn low incomes and have low access to food, one of the worst food access problems in the country. Still, Montana residents are relatively healthy. Just 33.1% of adults in the state have high cholesterol, 29.1% high blood pressure, and 3.2% heart disease, all lower than the corresponding national rates of 36.3%, 30.9%, and 3.9%. Just 23.6% of Montana adults are obese, the third lowest obesity rate in the country.
Montana survey respondents also have high regard for their community. There are more recreation facilities, farmers markets, and grocery stores in Montana per capita than the average across all states, and some of the cleanest air in the country.
[in-text-ad-2]
10. Florida
> Poverty rate: 15.7% (16th highest)
> Unemployment rate: 5.4% (20th highest)
> Obesity rate: 26.8% (16th lowest)
> Pct. of adults w/ bachelor’s degree: 28.4% (23rd lowest)
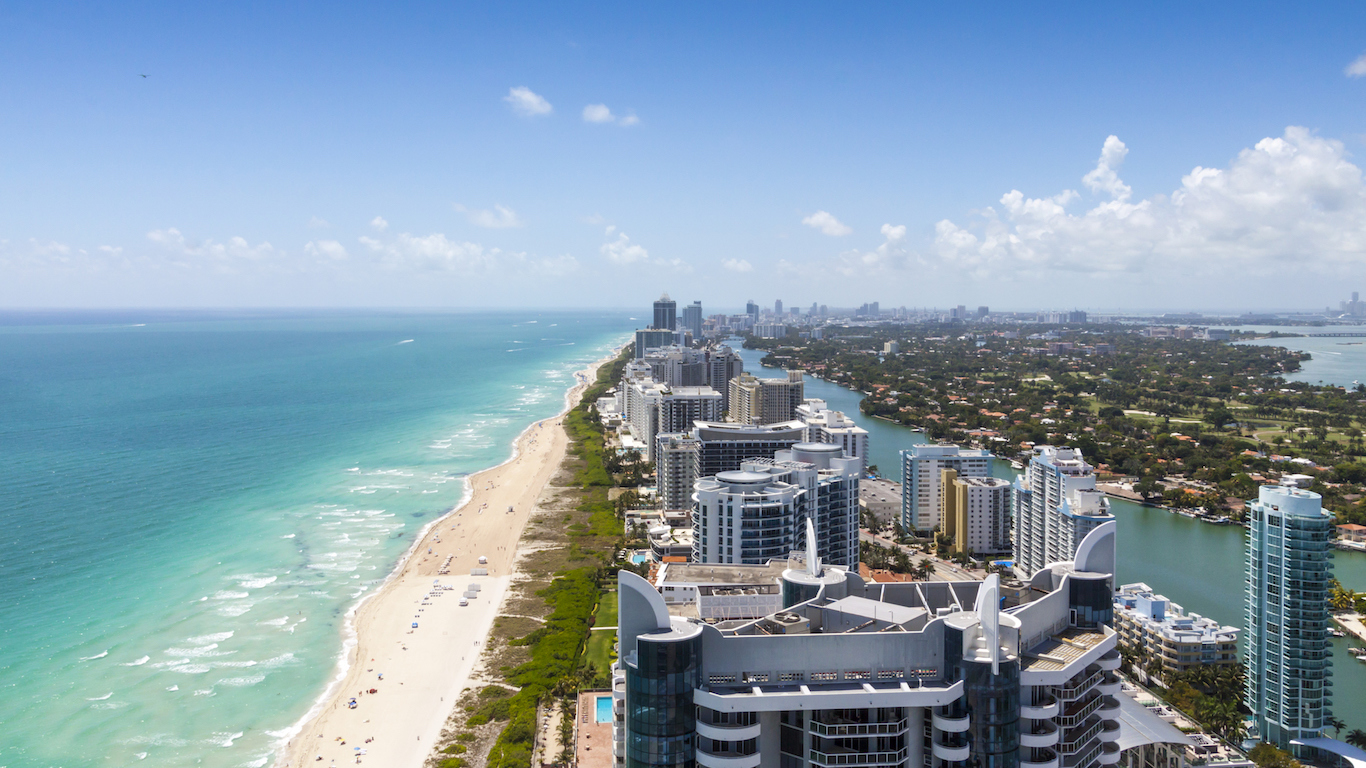
Due to the entrenched nature of socioeconomic conditions, states tend to rank similarly from one year to the next. Florida bucks this trend, rising to 10th this year after historically low or middle rankings. Florida residents report a higher well-being in the purpose, community, social relationships, and physical health elements than a majority of states. The largest hindrance to the Sunshine State’s well-being is likely financial strain. The typical Florida household earns $49,426, roughly $6,000 less than the national median household income. An estimated 15.7% of Florida residents live in poverty, a slightly larger share than the 14.7% national poverty rate.

11. Texas
> Poverty rate: 15.9% (14th highest)
> Unemployment rate: 4.5% (18th lowest)
> Obesity rate: 32.4% (10th highest)
> Pct. of adults w/ bachelor’s degree: 28.4% (23rd lowest)
Residents of Texas report among the highest well-being of any state. A lower than average prevalence of certain unhealthy behaviors likely contributes to residents’ relatively high well-being. For example, there are 9.6 deaths for every 100,000 residents due to a drug overdose, well below the comparable national figure of 14.0 deaths per 100,000 people. Texas’ smoking rate of 15.2% is also lower than the 17.5% national smoking rate.
More than residents in other states, people in Texas say they have close, supportive relationships at home. This could be due in part to families comprising nearly 70% of households, nearly the highest such percentage. Also, married couples, who have relatively low reported rates of depression, make up a larger share of household arrangements in Texas than in most states.
[in-text-ad]

12. California
> Poverty rate: 15.3% (19th highest)
> Unemployment rate: 6.2% (7th highest)
> Obesity rate: 24.2% (4th lowest)
> Pct. of adults w/ bachelor’s degree: 32.3% (14th highest)
While high income is by no means a guarantee of a satisfying life, affluence can potentially lead to comfort and higher quality of life. California has the ninth highest median household income in the country at $64,500 a year. On the other hand, the state has a slightly higher share of residents living in poverty at 15.3%, versus the national poverty rate of 14.7%.
The state has one of the most physically healthy populations. California has among the lowest rates of cardiovascular disease and heart disease death in the country. Also, the state reports very low rates of obesity and physical inactivity, which can contribute to poor health outcomes.

13. Massachusetts
> Poverty rate: 11.5% (14th lowest)
> Unemployment rate: 5.0% (24th lowest)
> Obesity rate: 24.3% (5th lowest)
> Pct. of adults w/ bachelor’s degree: 41.5% (the highest)
Massachusetts has the highest college attainment rate in the country with 41.5% of adults having earned at least a bachelor’s degree, compared to the 30.6% national share. Higher educational attainment can give people a sense of purpose and control in life and better earning opportunities. Massachusetts has the sixth highest median household income in the country, as well as one of the lower poverty rates of any state.
The incidence of death from heart disease in Massachusetts, at 137 per 100,000 people, is sixth lowest compared with other states, an indication that state residents are in good physical health. Also, relatively few people report unhealthy habits. For example, 14% of adults smoke, nearly the lowest smoking rate in the nation.

14. Wyoming
> Poverty rate: 11.1% (10th lowest)
> Unemployment rate: 4.2% (15th lowest)
> Obesity rate: 29.0% (21st lowest)
> Pct. of adults w/ bachelor’s degree: 26.2% (12th lowest)
The median household income in Wyoming of $60,214 a year is higher than the national median of $55,775. While a higher income do not necessarily translate to greater overall well-being, the absence of serious financial hardship does. Only 11.1% of Wyoming residents live in poverty, a considerably smaller share than the 14.7% national poverty rate.
Although financial hardship is relatively scarce in Wyoming, some negative health outcomes and bad habits are slightly more common. Across the state, some 29.0% of adults are obese, 26.2% lead sedentary lives, and 17.5% drink excessively, each roughly in line with the corresponding nationwide shares.
[in-text-ad-2]

15. Nebraska
> Poverty rate: 12.6% (19th lowest)
> Unemployment rate: 3.0% (2nd lowest)
> Obesity rate: 31.4% (14th highest)
> Pct. of adults w/ bachelor’s degree: 30.2% (21st highest)
Nebraska’s residents are more likely than those in the vast majority of states to report having a strong sense of purpose in life. This is likely partially attributable to the fact that a high share of people who want to work are able to do so. The state’s unemployment rate is just 3.0%, compared to the national annual rate of 5.3%.
State residents are also more likely than most to be in both good mental and physical health. Adults in Nebraska report an average of 2.9 days of poor mental health and 3.1 days of poor physical health each month, each among the five lowest shares among states and well below the national averages of 3.7 and 3.9 days, respectively. Nebraska reports a below average incidence of cardiovascular disease as well as a lower death rate from the disease. It also has the third lowest rate of drug deaths per capita among states, a growing concern in the United States.

16. North Dakota
> Poverty rate: 11.0% (9th lowest)
> Unemployment rate: 2.7% (the lowest)
> Obesity rate: 31.0% (17th highest)
> Pct. of adults w/ bachelor’s degree: 29.1% (24th lowest)
According to Gallup, a relatively large share of people in North Dakota have a strong sense of purpose. Contributing to this may be the fact that most people who want jobs in the state can get them. The state’s unemployment rate of just 2.7% is the lowest of any state and roughly half the national rate.
North Dakota also reported positive results on the well-being element related to community, which includes having communal pride and feeling safe. The state’s violent crime rate of just 239.4 incidents per 100,000 residents is the 10th lowest in the country.
[in-text-ad]

17. Utah
> Poverty rate: 11.3% (12th lowest)
> Unemployment rate: 3.5% (5th lowest)
> Obesity rate: 24.5% (6th lowest)
> Pct. of adults w/ bachelor’s degree: 31.8% (16th highest)
By many measures of both behavior and outcomes, Utah residents are among the healthiest in the country. The state has a sizeable Mormon population, a religion that discourages consumption of alcohol and tobacco. Largely a result, only 9.1% of adults in the state are smokers and 12.4% are excessive drinkers, the smallest and third smallest shares of any state in the country. Adults in Utah also tend to be physically active. Only one in five adults in the state lead sedentary lives, compared to one in four adults nationwide.
Healthy behaviors contribute to healthy outcomes and better overall well-being. Utah has the lowest incidence of both heart disease and high blood pressure of any state in the country.

18. Idaho
> Poverty rate: 15.1% (20th highest)
> Unemployment rate: 4.1% (12th lowest)
> Obesity rate: 28.6% (18th lowest)
> Pct. of adults w/ bachelor’s degree: 26.0% (11th lowest)
Idaho compares better than a majority of states in overall well-being, even though state residents report mixed results in the various quality of life measures. For example, the typical state household earns about $6,200 less than the national median household income, and the state’s poverty rate of 15.1% is slightly above the national rate of 14.7%.
While the state does not do well by some measures of financial security, Gallup found that state residents had a strong sense of well-being related to community, which includes liking where one lives and feeling safe. Idaho has the fifth lowest violent crime rate in the country.

19. Iowa
> Poverty rate: 12.2% (17th lowest)
> Unemployment rate: 3.7% (9th lowest)
> Obesity rate: 32.1% (12th highest)
> Pct. of adults w/ bachelor’s degree: 26.8% (16th lowest)
Iowa residents are more likely to report having strong social support networks. Married couples in Iowa are among the least likely to divorce. There are only 1.2 divorces for every 1,000 state residents annually, well below the 3.1 per 1,000 national divorce rate. Iowa is also one of only 10 states where over half of all households consist of married couples.
Living in poverty can significantly impede an individual’s well-being, and in Iowa, only 12.2% of residents live in poverty, a slightly smaller share than the 14.7% national poverty rate. In addition to a low poverty rate, many benefit from the state’s low cost of living. Goods and services in Iowa are about 10% less expensive than they are on average nationwide.
[in-text-ad-2]

20. New Hampshire
> Poverty rate: 8.2% (the lowest)
> Unemployment rate: 3.4% (4th lowest)
> Obesity rate: 26.3% (13th lowest)
> Pct. of adults w/ bachelor’s degree: 35.7% (8th highest)
According to Gallup, New Hampshire residents are more likely than those in most to enjoy their communities. New Hampshire has the second highest concentration of recreation facilities per capita and the fourth highest concentration of farmers’ markets.
Safety is another important aspect of community well-being, and New Hampshire has one of the lowest violent crime rates in the country. There are roughly 200 violent crimes reported per 100,000 residents in the state annually, far less than the 380 incidents per 100,000 Americans reported nationwide.

21. New Mexico
> Poverty rate: 20.4% (2nd highest)
> Unemployment rate: 6.6% (3rd highest)
> Obesity rate: 28.8% (19th lowest)
> Pct. of adults w/ bachelor’s degree: 26.5% (13th lowest)
Few factors have a greater influence on future well-being than education. In New Mexico, only 84.6% of adults have completed high school, the fifth smallest share of any state in the country. Despite poor educational attainment rates, New Mexico residents report healthy behaviors and other elements of high well-being. Adults in the state are more likely to be physically active than the typical American adult. The state’s 28.8% obesity rate is slightly lower than the 29.8% national rate. In addition, only 13.8% of adults in New Mexico report excessive drinking, one of the smallest shares of any state and well below the 17.7% of adults who do nationwide.
[in-text-ad]

22. Virginia
> Poverty rate: 11.2% (11th lowest)
> Unemployment rate: 4.4% (17th lowest)
> Obesity rate: 29.2% (22nd lowest)
> Pct. of adults w/ bachelor’s degree: 37.0% (6th highest)
Of the five elements of well-being assessed by Gallup — sense of purpose, social life, financial health, strength of community, and physical fitness — residents of Virginia were most satisfied with their social and financial health. While money does not necessarily lead to happiness, income above a certain level is necessary to ensure financial stability. An estimated 29.2% of Virginia households earn $75,000 or more, the fifth largest share of any state. While avoiding challenges associated with low incomes, wealthier individuals are often at greater risk of work-related stress. Virginians, however, report relatively low amounts of stress as a whole. Roughly 10% of Virginia adults experience regular mental distress, a smaller share than in most states.

23. New Jersey
> Poverty rate: 10.8% (8th lowest)
> Unemployment rate: 5.6% (18th highest)
> Obesity rate: 25.6% (10th lowest)
> Pct. of adults w/ bachelor’s degree: 37.6% (5th highest)
New Jersey residents report strong social ties compared to other states, which could also account for high income levels in the state. The typical New Jersey household earns $72,222 a year, the fourth highest median household income in the country. High household income may be partially due to the large share of married, two-income families in New Jersey, which at 51.2% is the sixth largest share of all states. On the other hand, goods and services in New Jersey cost 15% more on average than they do across the country, which adds financial strain on some state residents. On the Gallup well-being survey, New Jersey had nearly the highest social well-being rank, but fairly average financial health.

24. Oregon
> Poverty rate: 15.4% (17th highest)
> Unemployment rate: 5.7% (15th highest)
> Obesity rate: 30.1% (22nd highest)
> Pct. of adults w/ bachelor’s degree: 32.2% (15th highest)
Oregon residents are more likely to be in poor physical and mental health than most Americans. Adults in the state report an average of 4.5 poor mental health days and 4.5 poor physical health days a month, each among the most of any state. Poor mental and physical health among residents could be attributable to some bad habits. Some 18.8% of adults regularly drink excessively, larger than the 17.7% national share.
In other measures, however, people in Oregon are more likely to have healthier habits than most Americans. A physically active population, only 18.8% of adults in Oregon lead totally sedentary lives, the second smallest share of any state in the country.
[in-text-ad-2]

25. Washington
> Poverty rate: 12.2% (17th lowest)
> Unemployment rate: 5.7% (15th highest)
> Obesity rate: 26.4% (14th lowest)
> Pct. of adults w/ bachelor’s degree: 34.2% (11th highest)
Despite relatively high incomes and favorable economic conditions, self-evaluations across other metrics of well-being among Washington residents rank in the middle of all states. The typical household in the state earns $64,129 annually, well above the national median.
Several measures of health in Washington are just in line with the nation. Some 17.8% of adults in the state drink excessively compared to 17.7% of adults nationwide. Additionally, there are 13.8 drug overdose deaths a year in the state for every 100,000 residents, roughly in line with the national figure of 14.0 deaths per 100,000.

26. North Carolina
> Poverty rate: 16.4% (12th highest)
> Unemployment rate: 5.7% (15th highest)
> Obesity rate: 30.1% (22nd highest)
> Pct. of adults w/ bachelor’s degree: 29.4% (25th lowest)
While North Carolinians report a higher sense of purpose, high social well-being, and relatively strong communities than a majority of states, the largest hindrance to the state’s quality of life is likely financial strain. The typical household earns $47,830 a year, roughly $8,000 less than the national median household income of $55,775. Although low household income could be partially due to the relatively low proportion of married, two-income households in the state, a large share of North Carolinians face serious financial hardship. An estimated 16.4% of the state’s population is in poverty, more than the 14.7% national poverty rate.
[in-text-ad]
27. Georgia
> Poverty rate: 17.0% (9th highest)
> Unemployment rate: 5.9% (12th highest)
> Obesity rate: 30.7% (19th highest)
> Pct. of adults w/ bachelor’s degree: 29.9% (23rd highest)
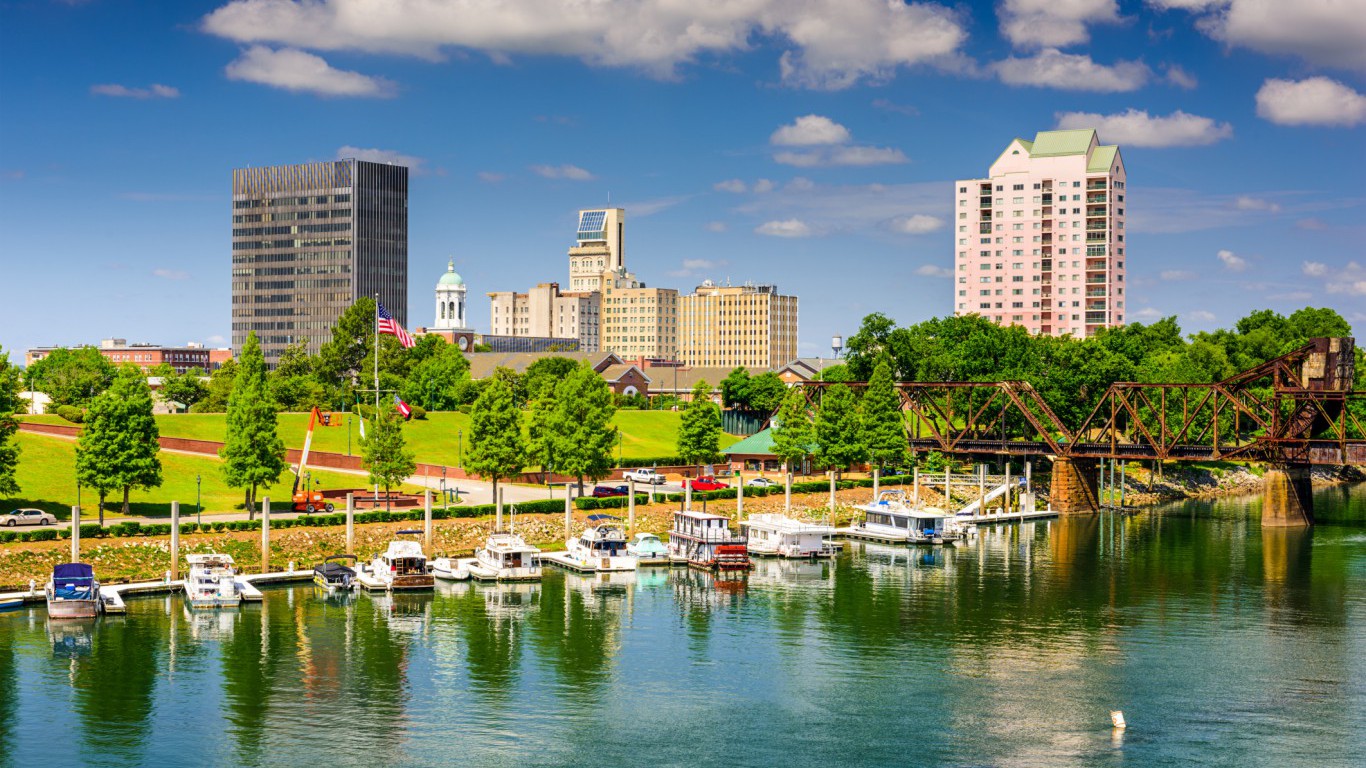
Like neighboring North and South Carolina, Georgia residents report a relatively high sense of purpose and social well-being, but financial stress greatly undermines the state’s quality of life. An estimated 17% of residents in the state live in poverty, the ninth highest poverty rate in the country. Also, Georgia’s median household income of $51,244 a year is roughly $4,500 less than the national figure.
While Georgia residents report similar levels of overall well-being as North and South Carolina, Georgians are less satisfied with their local communities. The relatively poor sense of community could be tied to the high number of food insecure individuals in the state. An estimated 25.3% of Georgia residents earn low incomes and have limited access to grocery stores, one of the largest shares nationwide. Georgia also has the fourth fewest farmers markets per capita of any state.

28. South Carolina
> Poverty rate: 16.6% (11th highest)
> Unemployment rate: 6.0% (10th highest)
> Obesity rate: 31.7% (13th highest)
> Pct. of adults w/ bachelor’s degree: 26.8% (16th lowest)
Close social, familial, and marital bonds can greatly increase an individual’s sense of well-being. Married couples in particular tend to report lower rates of depression and sadness, for example. In South Carolina, marriages tend to occur more frequently and divorces more rarely. Each year, there are 7.5 marriages for every 1,000 residents in South Carolina, and only 2.8 divorces per 1,000 residents, versus the national rates of 6.9 and 3.1 per 1,000, respectively.
Well-being, which is bolstered by the close relationships, may be undermined by poor health in South Carolina. Nearly 38% of adults in South Carolina have high blood pressure, a risk factor for heart disease, and 12% of adults in the state suffer from diabetes, each the eighth highest share of all states.
29. Wisconsin
> Poverty rate: 12.1% (15th lowest)
> Unemployment rate: 4.6% (19th lowest)
> Obesity rate: 30.7% (19th highest)
> Pct. of adults w/ bachelor’s degree: 28.4% (23rd lowest)
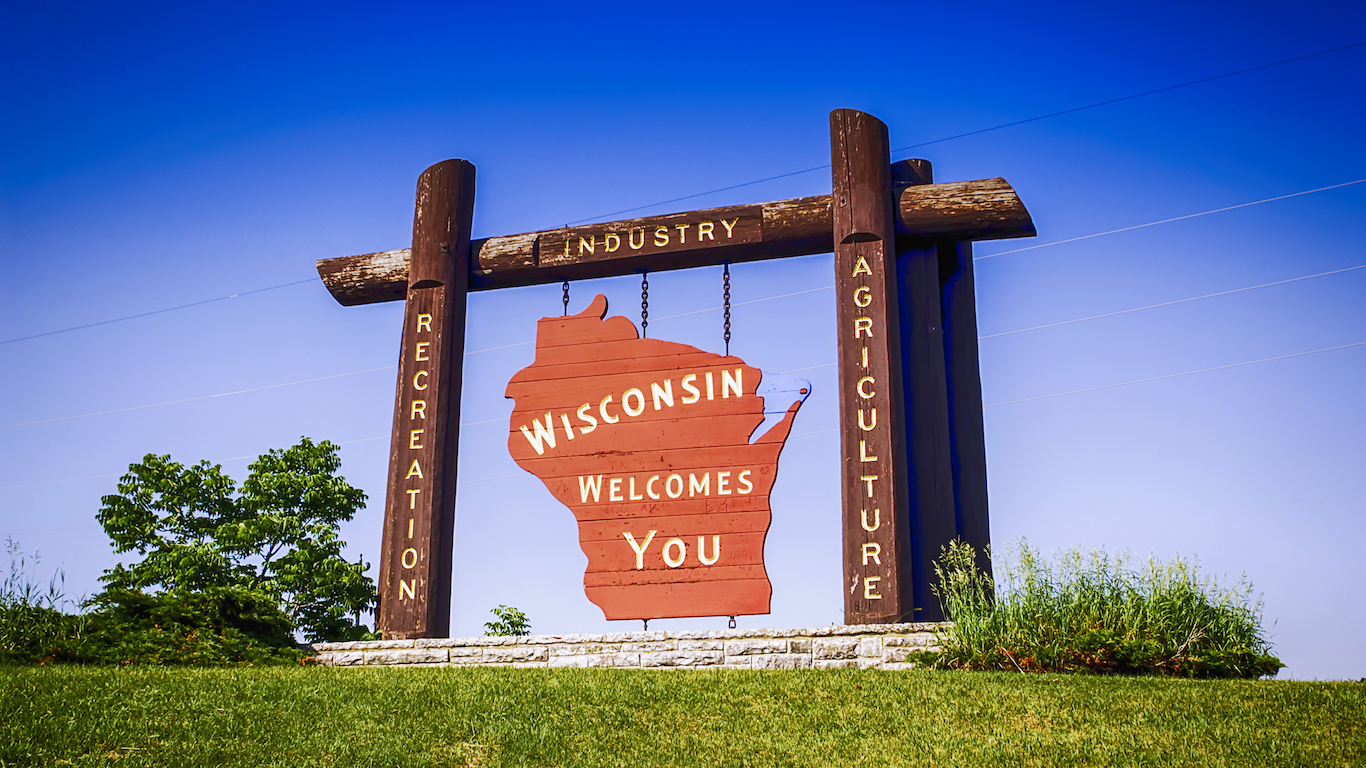
Self-evaluations of well-being in Wisconsin fall close to the middle when compared with other states. In many ways, people in Wisconsin take relatively good care of themselves. Some 78.4% of adults in the state regularly exercise, one of the larger shares of any state. In addition, only 31.3% of adults do not get enough sleep, a smaller share than the 34.2% of adults nationwide. Both exercise and adequate sleep can be crucial for mental and physical health — and overall well-being.
However, some behaviors that can be detrimental to overall well-being are relatively common in Wisconsin. Nearly one in four adults in the state drink excessive amounts of alcohol, the second highest share of any state in the country, and well above the 17.7% share of American adults who drink excessively.
[in-text-ad-2]

30. Pennsylvania
> Poverty rate: 13.2% (21st lowest)
> Unemployment rate: 5.1% (25th lowest)
> Obesity rate: 30.0% (24th highest)
> Pct. of adults w/ bachelor’s degree: 29.7% (24th highest)
Pennsylvania is the fourth largest coal producing state. While the industry has a substantial economic impact on the state and employs roughly 14,000 workers directly, the burning of coal has led to substantial environmental damage. The state’s air pollution is measured at 11 micrograms of coarse particulate matter per cubic meter on the average day, the most of any state other than California. In other measures of public health and safety, however, the state fares relatively well. Pennsylvania has nearly the best immunization coverage of any state, and one of the lowest property crime rates in the country.

31. Maryland
> Poverty rate: 9.7% (2nd lowest)
> Unemployment rate: 5.2% (24th highest)
> Obesity rate: 28.9% (20th lowest)
> Pct. of adults w/ bachelor’s degree: 38.8% (3rd highest)
With a median household income of $75,847 a year, Maryland is the wealthiest state. Serious financial hardship is also relatively uncommon in Maryland, as only 9.7% of state residents live in poverty, the second smallest share of any state in the country.
Well-being in Maryland is likely undermined by some unhealthy behaviors and social conditions. Nearly 39% of adults in the state do not get enough sleep, a higher share than in all but three other states. In addition, violent crime is relatively common in parts of the state. There are about 457 violent crimes per 100,000 state residents annually, well above the national violent crime rate of 383 per 100,000.
[in-text-ad]

32. Kansas
> Poverty rate: 13.0% (20th lowest)
> Unemployment rate: 4.2% (15th lowest)
> Obesity rate: 34.2% (7th highest)
> Pct. of adults w/ bachelor’s degree: 31.7% (17th highest)
Across Kansas, adults report an average of 3.2 poor mental health days a month, about a half day less than the national average. However, many state residents still struggle with mental health issues. There are 16.1 suicides in Kansas for every 100,000 residents, versus the 13.4 suicides per 100,000 person national rate.
Many people living in Kansas also suffer from poor physical health. More than one in three adults in the state are obese, a higher proportion than in all but half a dozen other states. Other significant health risk factors, including high blood pressure and high cholesterol, are also more common in Kansas than they are across the country as a whole.

33. Nevada
> Poverty rate: 14.7% (23rd highest)
> Unemployment rate: 6.7% (the highest)
> Obesity rate: 26.7% (15th lowest)
> Pct. of adults w/ bachelor’s degree: 23.6% (6th lowest)
According to Gallup’s survey, Nevada ranks below most states in the community element of well-being, which includes enjoying one’s community and feeling safe. Indeed, Nevada communities are among the least safe in the country. The state’s violent crime rate of nearly 700 incidents per 100,000 residents is the second highest rate nationwide.
Another factor likely affecting the state’s overall well-being is its high unemployment. Of Nevada’s labor force, 6.7% do not have a job, the highest unemployment rate of any state. While some jobs certainly enhance well-being more than others, at the very least stable employment provides residents with the resources needed to afford basic needs.

34. New York
> Poverty rate: 15.4% (17th highest)
> Unemployment rate: 5.3% (23rd highest)
> Obesity rate: 25.0% (7th lowest)
> Pct. of adults w/ bachelor’s degree: 35.0% (9th highest)
More than 40% of New York state’s population lives in the five boroughs of New York City. Large metropolitan areas have a number of benefits but also drawbacks for quality of life. While strengthening social networks and providing opportunities for physical activity, cities also potentially induce financial strain or general anxiety. For example, while the violent crime rate for New York state of 380 incidents per 100,000 residents is roughly similar to the national figure, in New York City an estimated 586 violent crimes are reported per 100,000 residents.
The city’s dense layout, however, may provide other benefits to the state as a whole. Just 12.6% of New York state’s population is considered to be low income and to have inadequate access to grocery stores, the third smallest share nationwide.
[in-text-ad-2]

35. Connecticut
> Poverty rate: 10.5% (6th lowest)
> Unemployment rate: 5.6% (18th highest)
> Obesity rate: 25.3% (9th lowest)
> Pct. of adults w/ bachelor’s degree: 38.3% (4th highest)
The typical Connecticut household earns $71,346 a year, one of the highest median incomes of any state. However, there is also a large share of low-earning households, as Connecticut has the second worst income disparity of any state. Those on the lower end of the income spectrum face additional financial strain under the state’s high cost of living. Goods and services in Connecticut cost about 9% more than they do across the country on average.
Just as income disparity can undermine the perceived well-being of a large share of the population, so can the prevalence of some unhealthy habits. Adults in Connecticut are more likely to regularly drink alcohol in excess than adults nationwide. Also, the state’s deadly overdose rate is slightly higher than it is nationwide.

36. Missouri
> Poverty rate: 14.8% (21st highest)
> Unemployment rate: 5.0% (24th lowest)
> Obesity rate: 32.4% (10th highest)
> Pct. of adults w/ bachelor’s degree: 27.8% (20th lowest)
Well-being can increase with income — up to about $75,000 a year. In Missouri, only 17.6% of earners meet that threshold, well below the 23.1% share of American earners who do.
In addition to higher incomes, many in Missouri would also likely benefit from healthier living, as the state trails much of the rest of the nation in several important health measures. For example, some 22.3% of adults in the state are smokers, a larger share than in all but four other states. Some poor health outcomes are also slightly more common in Missouri than across the nation as a whole. Of all adults in the state, 12.9% report frequent mental distress, and 13.9% report frequent physical distress, higher than the 11.2% and 11.4% share of all American adults who report similar distress.
[in-text-ad]

37. Illinois
> Poverty rate: 13.6% (23rd lowest)
> Unemployment rate: 5.9% (12th highest)
> Obesity rate: 30.8% (18th highest)
> Pct. of adults w/ bachelor’s degree: 32.9% (12th highest)
According to Gallup, Illinois residents are less likely to have a strong sense of community than residents of most states, meaning they feel may not feel safe in their communities nor enjoy being part of them. The state has one of the higher murder rates in the country. Pollution is also more common in the state, which may further affect the share of Illinois residents who enjoy where they live.
Of state adults, 32.9% have at least a bachelor’s degree, the 12th highest share of any state. High educational attainment can be valuable in attaining a good paying job, and it also can provide a sense of purpose and stability for many people.

38. Tennessee
> Poverty rate: 16.7% (10th highest)
> Unemployment rate: 5.8% (14th highest)
> Obesity rate: 33.8% (9th highest)
> Pct. of adults w/ bachelor’s degree: 25.7% (10th lowest)
Tennessee survey respondents reported very poor health. Adults in the state report five days on average of poor physical health each month, over a day more than the U.S. average. There are also 205.6 heart disease deaths annually per 100,000 state residents, and 8.4% of adults have some form of cardiovascular disease, each among the higher shares in the country. Heart disease is the leading cause of death in the United States. Tennessee also has high rates of diabetes and obesity.
The state also has relatively high unemployment, as well as a poverty rate of 16.7%, the 10th highest proportion of any state. Residents who are not earning incomes and are poor are more likely to struggle to secure the basic necessities needed for well-being.

39. Delaware
> Poverty rate: 12.4% (18th lowest)
> Unemployment rate: 4.9% (22nd lowest)
> Obesity rate: 29.7% (23rd lowest)
> Pct. of adults w/ bachelor’s degree: 30.9% (19th highest)
Delaware residents are less likely to feel safe and connected in their communities than those in the vast majority of other states. One reason for the lack of community well-being may the high presence of violent crime in the state. There are roughly 500 violent crimes reported per 100,000 Delaware residents, approximately 100 more than the average violent crime rate nationwide. Access to affordable food is another important measure of community well-being. In Delaware, more than one in four residents have both low incomes and minimal access to healthy food, one of the highest shares in the country.
Unhealthy habits also likely play a role in state residents’ perception of their own well-being. For example, sleep deprivation is linked to a number of serious health conditions. In Delaware, some 37.5% of adults do not get enough sleep, a larger share than the 34.2% of adults nationwide.
[in-text-ad-2]

40. Michigan
> Poverty rate: 15.8% (15th highest)
> Unemployment rate: 5.4% (20th highest)
> Obesity rate: 31.2% (16th highest)
> Pct. of adults w/ bachelor’s degree: 27.8% (20th lowest)
Unhealthy behaviors can greatly reduce an individual’s well-being, and in Michigan, a relatively large share of adults report some unhealthy habits. One in five adults in the state regularly drink too much alcohol, the 10th highest excessive drinking rate of any state. Additionally, despite the well-established health risks, 20.7% of Michigan adults are smokers, well above the 17.5% share of adults nationwide.
A number of important socioeconomic measures may also partially explain Michigan residents’ relatively low sense of well-being. For example, 15.8% of people in the state live in poverty, higher than the national poverty rate of 14.7%. Violent crime is also more of a problem in Michigan than it is nationwide. There are 415.5 violent crimes for every 100,000 state residents annually, compared to a national violent crime rate of 383.2 incidents per 100,000 residents.

41. Mississippi
> Poverty rate: 22.0% (the highest)
> Unemployment rate: 6.5% (4th highest)
> Obesity rate: 35.6% (2nd highest)
> Pct. of adults w/ bachelor’s degree: 20.8% (2nd lowest)
Nationwide, 14.7% of Americans live in poverty. In Mississippi, the poverty rate is 22.0%, the highest in the country. Those state residents who are living in poverty are less likely to be able to afford the basic amenities needed to ensure well-being.
People in poverty are also more likely to suffer from a number of negative health outcomes, at least in part because they are less likely to have access to quality health care. Indeed, the state has one of the least healthy populations in the country. About 345 residents die each year due to cardiovascular issues, such as heart attack and stroke, per 100,000 people, the highest rate of any state. The state also has the highest rate of diabetes, as well as the second highest rates of both cancer deaths and obesity.
[in-text-ad]

42. Rhode Island
> Poverty rate: 13.9% (25th lowest)
> Unemployment rate: 6.0% (10th highest)
> Obesity rate: 26.0% (11th lowest)
> Pct. of adults w/ bachelor’s degree: 32.7% (13th highest)
Rhode Island residents have a lower overall sense of well-being than those living in the rest of New England. A high jobless rate likely explains dissatisfaction among many state residents. The state’s 2015 annual unemployment rate of 6.0% is slightly higher than the 5.3% U.S. jobless rate in 2015.
Drug abuse can be a significant detriment to overall well-being, and it is a relatively common problem across Rhode Island. There are about 21.4 overdose fatalities for every 100,000 state residents annually, well above the national rate of 14.0 drug deaths per 100,000 Americans. Rhode Island residents are also more likely to report frequent mental or physical distress than most Americans.

43. Alabama
> Poverty rate: 18.5% (5th highest)
> Unemployment rate: 6.1% (8th highest)
> Obesity rate: 35.6% (2nd highest)
> Pct. of adults w/ bachelor’s degree: 24.2% (7th lowest)
Alabama residents were among the least likely in Gallup’s survey to report financial well-being, which measures whether people feel they are able to manage their resources without difficulty. The state’s high unemployment rate of 6.1% means many people are not earning regular wages. Further, Alabama’s poverty rate of 18.5% is fifth highest of all states.
Another sign of poor overall well-being, state residents are among the most likely to suffer from poor mental health. Each month, adults in the state report an average of 4.3 days of poor mental health, compared to the national average of 3.7 days per month.

44. Louisiana
> Poverty rate: 19.6% (3rd highest)
> Unemployment rate: 6.3% (6th highest)
> Obesity rate: 36.2% (the highest)
> Pct. of adults w/ bachelor’s degree: 23.2% (4th lowest)
Louisiana residents are among the least likely in the country to report a strong sense of community, which is related to feeling safe and generally enjoying one’s neighborhood. Louisiana has the fifth highest violent crime rate in the country, as well as the fifth highest rate of burglaries and the highest murder rate.
Louisiana’s low overall well-being is likely related to the state’s many health issues. Louisiana has the highest obesity rate in the country at 36.2%, compared to the national rate of 29.8%. Obesity is tied to a number of common, life-threatening illnesses, including diabetes, heart disease, and cancer, and Louisiana has among the five highest rates of incidence of diabetes and cardiovascular disease, and also has one of the five highest cancer death rates.
[in-text-ad-2]

45. Ohio
> Poverty rate: 14.8% (21st highest)
> Unemployment rate: 4.9% (22nd lowest)
> Obesity rate: 29.8% (25th lowest)
> Pct. of adults w/ bachelor’s degree: 26.8% (16th lowest)
A college education can affect nearly every aspect of an individual’s life and ultimately improve overall well-being. In Ohio, only 26.8% of adults have a college degree, well below the 30.6% share of American adults.
Adults in the state are also more likely to exhibit some bad habits that can detract considerably from overall well-being. The opioid epidemic is a national problem, but it has hit Ohio especially hard. There are 21.1 overdose deaths for every 100,000 residents every year in the state, well above the 14.0 drug deaths per 100,000 Americans. Ohio adults are also more likely to drink too much alcohol than the typical American. Some 19.2% of adults in Ohio drink excessively, higher than the 17.7% national excessive drinking rate.

46. Arkansas
> Poverty rate: 19.1% (4th highest)
> Unemployment rate: 5.2% (24th highest)
> Obesity rate: 34.5% (6th highest)
> Pct. of adults w/ bachelor’s degree: 21.8% (3rd lowest)
According to Gallup, Arkansas residents are less likely to report financial well-being than those in most states. The state’s lower incomes and high poverty rate likely explains this. The typical household in the state earns just $41,995 a year, and 19.1% of residents live in poverty, the second worst and fourth worst rates in the country, respectively.
The state’s low incomes and high poverty are likely at least partially due to the state’s low educational attainment rate. Just 21.8% of state adults have a bachelor’s degree, the third lowest proportion of any state. The lack of higher education may also explain the state’s poor overall well-being in other ways. A college education can help provide a sense of control and purpose for many people. State adults report the highest average number of days of poor mental health each month, at 4.7, a full day more than the U.S. average.
[in-text-ad]
47. Indiana
> Poverty rate: 14.5% (25th highest)
> Unemployment rate: 4.8% (20th lowest)
> Obesity rate: 31.3% (15th highest)
> Pct. of adults w/ bachelor’s degree: 24.9% (9th lowest)
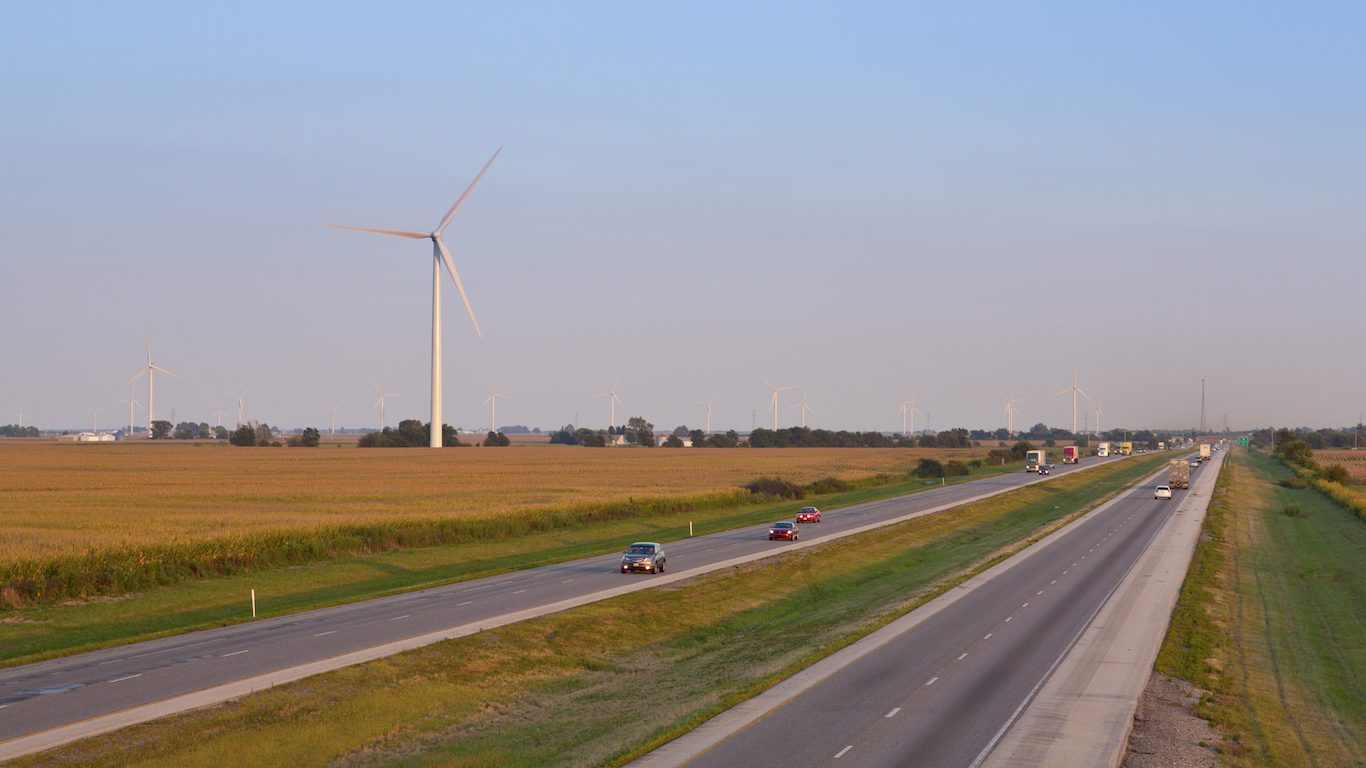
Indiana is one of just a handful of states to rank worse in every category of well-being — sense of purpose, social life, financial health, community pride, and physical fitness — than most other states. An estimated 31.3% of adults in the state are obese, 29.4% do not exercise, and 30.6% smoke, each higher the corresponding national shares.
Having a college education can have many positive effects on well-being. In Indiana, just 24.9% of adults have at least a bachelor’s degree, one of the smallest shares of any state. A shallow talent pool may be one reason behind the state’s low median household income, which at $50,532 is approximately $5,000 less than the national median income.

48. Kentucky
> Poverty rate: 18.5% (5th highest)
> Unemployment rate: 5.4% (20th highest)
> Obesity rate: 34.6% (5th highest)
> Pct. of adults w/ bachelor’s degree: 23.3% (5th lowest)
On the whole, Kentucky has one of the least healthy populations of any state, and well-being among many residents likely suffers as a result. Adults in the state report feeling physically unhealthy an average of five days every month, second worst of any state, and more than a full day longer than the national average. More than one in four state residents smokes, and about a third lead sedentary lifestyles, the highest and fourth highest proportions in the country. These unhealthy behaviors likely contribute to the state’s poor health outcomes. Kentucky has the second highest incidence of heart disease and the highest rate of cancer deaths in the country.
In addition to poor physical health, Kentucky also compares worse than other states in matters of mental health. The state has a higher than average suicide rate, and adults report a higher average number of days in poor mental health each month.

49. Oklahoma
> Poverty rate: 16.1% (13th highest)
> Unemployment rate: 4.2% (15th lowest)
> Obesity rate: 33.9% (8th highest)
> Pct. of adults w/ bachelor’s degree: 24.6% (8th lowest)
Adults in Oklahoma report an average of 4.1 poor mental health days a month, slightly more than the 3.7 days reported by the average American adult. Perhaps even more telling of poor well-being across the state is its suicide rate. There are an average of 19.3 suicides per 100,000 Oklahoma residents a year, far higher than the 13.4 suicides per 100,000 people nationwide.
For many Oklahoma residents, well-being is undermined by poor health behaviors and outcomes. About one in every three adults in the state get no exercise beyond leaving the house to go to work, nearly the highest physical inactivity rate of any state. Additionally, 22.2% of Oklahoma adults are smokers, well above the 17.5% national smoking rate. Unhealthy behaviors such as these likely play a considerable role in the state’s high cardiovascular-related death rate. There are about 326 deaths from cardiovascular-related health issues, such as heart attacks or strokes, for every 100,000 state residents annually, the third highest rate of any state.
[in-text-ad-2]

50. West Virginia
> Poverty rate: 17.9% (7th highest)
> Unemployment rate: 6.7% (the highest)
> Obesity rate: 35.6% (2nd highest)
> Pct. of adults w/ bachelor’s degree: 19.6% (the lowest)
West Virginia has the worst overall well-being of any state in the country, and a review of conditions in the state reveals why. A college education and a stable job can each provide a sense of purpose in life, but West Virginia has the highest unemployment rate and the lowest college attainment rate of any state. Indeed, West Virginians surveyed by Gallup reported having the lowest sense of purpose of all states.
West Virginians are also far more likely to be in poor health than those in other states. Adults in the state report an average of 5.5 days each month of being in poor physical health, 0.5 days longer than the next worst state. The state has the highest incidence of cardiovascular disease and heart attacks, the highest rate of overdose deaths, and the highest share of adults who report being in frequent mental and physical distress.
Methodology
24/7 Wall St. reviewed all 50 U.S. states based on their scores in the Gallup-Healthways 2016 Well-Being Index. Gallup-Healthways calculated a national well-being score as well as one for each state based on 177,192 telephone interviews with U.S. adults across all 50 states, conducted from January 2 to December 30, 2016. Gallup conducts 500 telephone interviews a day, for a resulting sample that projects to an estimated 95% of all U.S. adults.
Gallup combined five separate essential elements of well-being — purpose, social, financial, community, and physical. In addition to the index, 24/7 Wall St. considered data from the U.S. Census Bureau’s 2015 American Community Survey, including median household income, poverty rates, uninsured rates, and adult educational attainment rates. From the Bureau of Labor Statistics, we reviewed 2016 annual state unemployment rates and 2015 average hours worked among private nonfarm workers. We also reviewed 2015 obesity and teen pregnancy rates from the Centers for Disease Control and Prevention. Incidence of heart disease in 2015 is from the Kaiser Family Foundation. The share of the population with low incomes and low access to healthy food comes from the Department of Agriculture’s Food Environment Atlas. Low access is defined as living more than one mile from a supermarket in an urban area or more than 10 miles from a supermarket in a rural area, and low income is defined as being at or below 200% of the federal poverty level. We also considered state violent crime rates in 2015 from the FBI’s Uniform Crime Report Program. Lastly, we used 2014 regional price parity from the Bureau of Economic Analysis as a proxy for cost of living. All other data come from the United Health Foundation’s 2016 report “America’s Health Rankings.”
Start by taking a quick retirement quiz from SmartAsset that will match you with up to 3 financial advisors that serve your area and beyond in 5 minutes, or less.
Each advisor has been vetted by SmartAsset and is held to a fiduciary standard to act in your best interests.
Here’s how it works:
1. Answer SmartAsset advisor match quiz
2. Review your pre-screened matches at your leisure. Check out the advisors’ profiles.
3. Speak with advisors at no cost to you. Have an introductory call on the phone or introduction in person and choose whom to work with in the future
Get started right here.
Thank you for reading! Have some feedback for us?
Contact the 24/7 Wall St. editorial team.