Special Report
Cities With the Highest (and Lowest) Unemployment Rates

Published:
Last Updated:

The U.S. labor market has improved remarkably in recent years, as the unemployment rate has fully returned to pre-recession levels. The national unemployment rate reached 4.7% in December, the same as it was in November 2007, the month before the recession officially began.
That recovery, of course, has been far from even. In many U.S. metropolitan areas unemployment is now at or below pre-recession levels, and in some metros it remains 4 or 5 percentage points higher than at the end of 2007. Across the country, unemployment rates vary significantly.
[in-text-ad]
Ames, Iowa leads the nation with an unemployment rate of just 2.3% as of December 2016. In El Centro, California, 20.9% of the labor force is unemployed, the highest jobless rate in the country. Based on seasonally-adjusted December unemployment figures from the U.S. Bureau of Labor Statistics, 24/7 Wall St. reviewed the cities with the highest and lowest unemployment rates.
Click here to see the cities with the highest unemployment rates.
Click here to see the cities with the lowest unemployment rates.
While job losses as a result of the recession certainly drove up unemployment in most metro areas, many of the metros that currently have the highest unemployment rates were struggling well before the recession began. In December 2006, when the national economy was still going strong, all but two of the 20 metro areas currently with the highest unemployment rates had above average jobless rates at the time. During the recession and after it officially ended, unemployment increased even further, to more than 20% in some cases. In El Centro, unemployment reached 30% in November 2011. While in many of these metropolitan areas the unemployment rate has substantially declined since reaching a peak, it remains among the highest in the country.
In an interview with 24/7 Wall St., Martin Kohli, chief regional economist at the BLS, explained, “High and low unemployment rates in different areas reflect both the supply side, such as attributes of the labor force, and the demand side, such as how well the industries in an area are doing.” It is clear that areas with the highest unemployment suffer both due to the structure of their economies and the composition of their labor forces.
Agriculture has been an uncertain industry in recent years, Kohli explained, and economies that are too dependent on crop production continue to struggle. Nearly all of the metropolitan areas with the highest unemployment rates are relatively dependent on agriculture. In the United States, about 2% of workers are employed in the sector that includes agriculture. In half of the cities with the highest unemployment, the concentration is at least five times as high, and in all but two of the 20, the concentration of sector workers exceeds the national share.
The skillsets of labor force participants can also help explain the high unemployment in these areas. “People who have college degrees have more choices about what kinds of jobs to pursue, whereas people with less education have fewer career opportunities,” Kohli explained. Nationwide, 30.6% of adults have at least a bachelor’s degree. In many of the metro areas with the highest unemployment, less than half the national share have a college degree, and all but one have below-average shares of college-educated adults.
While struggling labor markets tend to share particular concentrations of jobs and less optimal skill sets, these characteristics are notably absent in the metro areas with thriving economies. As Kohli noted, the 20 metros with the lowest unemployment areas have more diversified economies. They also tend to have greater employment in more stable industries. In all but one of the areas with the lowest unemployment, educational attainment rates exceed the corresponding national rate. In Ames, over half the adult population has a bachelor’s degree.
Many of the metropolitan areas with the lowest unemployment rates have at least one major university, which can help explain both the high educational attainment rates as well as low unemployment. “Some of these areas really reflect the importance of universities in affecting local economic conditions,” Kohli said.
To identify the best and worst job markets in the United States, 24/7 Wall St. reviewed the metropolitan statistical areas (MSA) with the highest and lowest unemployment rates as of December 2016 from the Bureau of Labor Statistics (BLS). Labor force changes also came from the BLS. Median household incomes, poverty rates, and educational attainment rates all came from the Census Bureau’s 2015 American Community Survey (ACS), and are for the latest period available. Workforce composition also came from the ACS.
These are the cities with the highest and lowest unemployment rates.
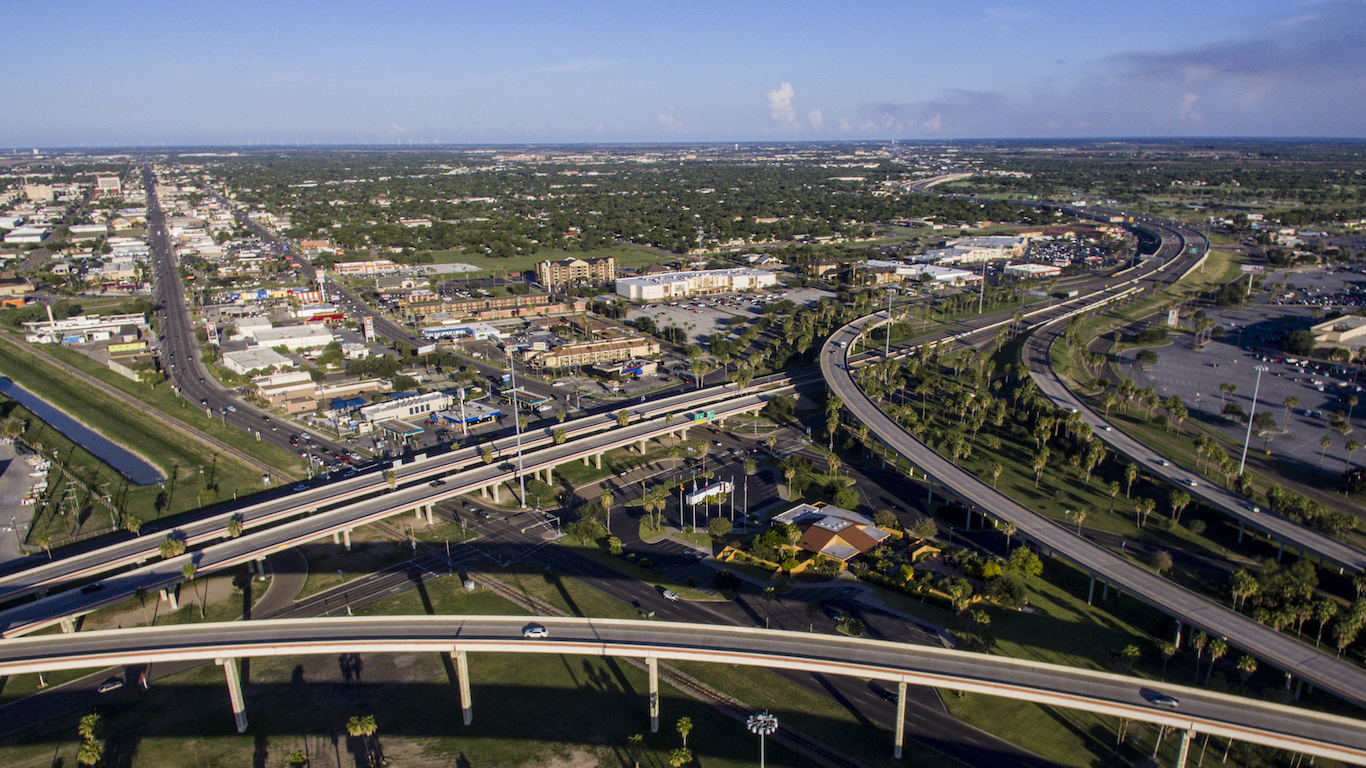
20. Brownsville-Harlingen, TX
> Dec. 2016 unemployment rate: 7.3%
> Dec. 2006 unemployment rate: 6.0%
> Median household income: $34,074
> Adults w/ bachelor’s degree: 15.2%
Brownsville-Harlingen’s 2016 unemployment rate of 7.3% is 4.4 percentage points lower than the metro area’s jobless rate of 11.7% in July 2011. The total number of people employed in the state fell from 17,878 at the end of in 2011 to 12,437 in December 2016. Like many Texas metropolitan areas, unemployment in Brownsville increased as the falling price of oil contributed to job loss across the state. The number of unemployed workers in the metro area increased by 1.4% between 2015 and 2016.
[in-text-ad]
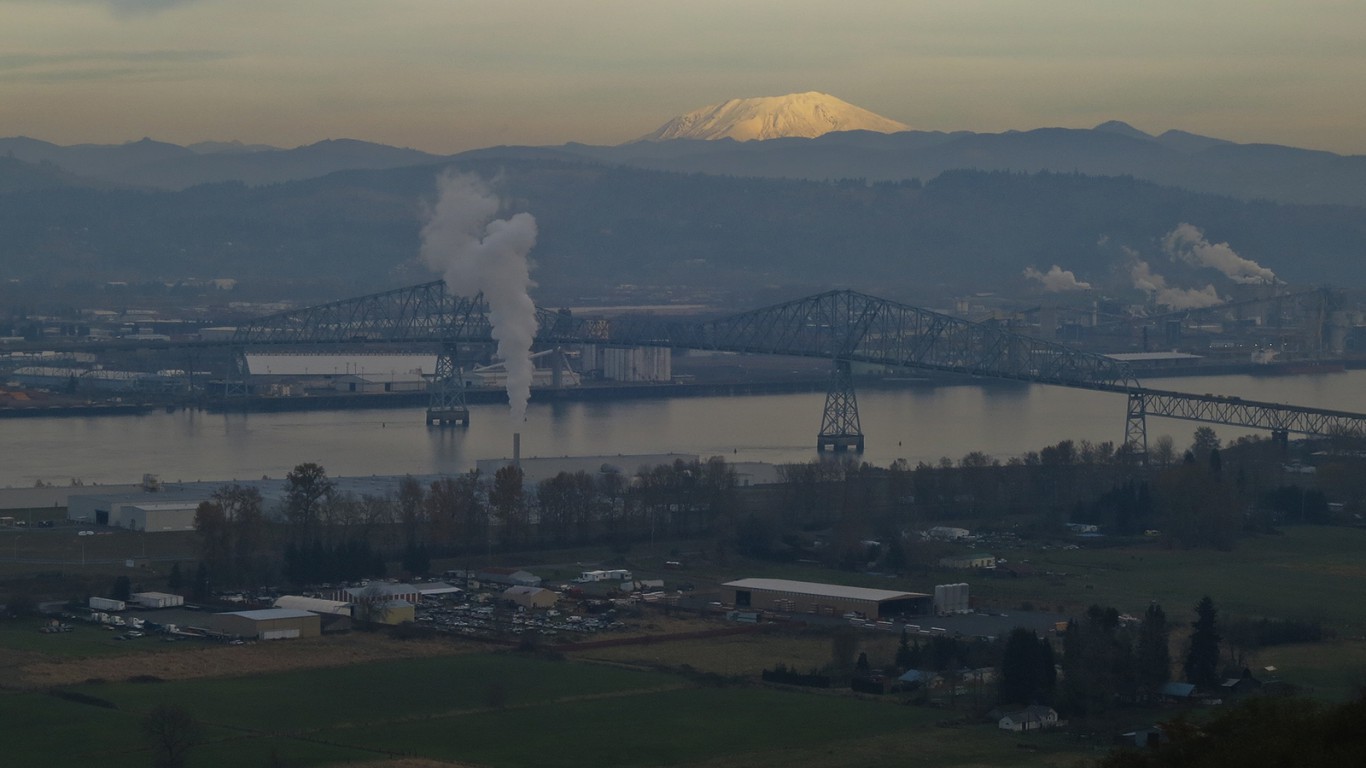
19. Longview, WA
> Dec. 2016 unemployment rate: 7.3%
> Dec. 2006 unemployment rate: 7.0%
> Median household income: $49,949
> Adults w/ bachelor’s degree: 17.2%
The Longview, Washington unemployment rate fell slightly last year, from 7.4% in December 2015 to 7.3% at the end of last year. The area’s current rate is one of the highest of all U.S. metros and well above the state’s unemployment rate of 5.2%. Still, unemployment has improved significantly compared to the peak during the recession, when the area’s jobless rate reached 14.7% in October 2009. The decline of 7.4 percentage points was one of the biggest improvements in the country during that period.

18. Rocky Mount, NC
> Dec. 2016 unemployment rate: 7.3%
> Dec. 2006 unemployment rate: 6.1%
> Median household income: $37,324
> Adults w/ bachelor’s degree: 16.4%
Rocky Mount was among the metro areas hit hardest by the recession. While unemployment has fallen substantially from the peak of 14.5% in February 2010, the city’s most recent jobless rate of 7.3% last December is still 1.2 percentage points higher than it was 10 years ago. One factor hindering economic recovery in Rocky Mount may be the city’s shallow talent pool. Just 16.4% of adults have a bachelor’s degree, among the smallest shares nationwide.

17. Salinas, CA
> Dec. 2016 unemployment rate: 7.3%
> Dec. 2006 unemployment rate: 6.9%
> Median household income: $60,494
> Adults w/ bachelor’s degree: 23.3%
Despite declining substantially from its November 2010 peak of 13.2%, the unemployment rate in the Salinas metro area remains high. An estimated 7.3% of the city’s labor force is out of a job, far more than the 4.7% national unemployment rate. Nearly one in five area workers is employed in agriculture, the third largest share nationwide. While regional drought conditions have led to significant job losses throughout the agricultural heartland of inland California, with unemployment in some cities nearing 10%, Salinas has been largely spared from the worst effects of the drought.
[in-text-ad-2]

16. Mobile, AL
> Dec. 2016 unemployment rate: 7.4%
> Dec. 2006 unemployment rate: 4.0%
> Median household income: $42,699
> Adults w/ bachelor’s degree: 23.5%
The U.S. has largely recovered from the depths of the Great Recession. U.S. unemployment rate rose from 4.4% in December 2006 to 10.0% in October 2009, and has since fallen to 4.7%. While Mobile’s unemployment rate has also recovered significantly since the recession, joblessness remains high in the metro area. An estimated 7.4% of the Mobile labor force is unemployed, far more than the city’s December 2006 unemployment rate of 4.0%.
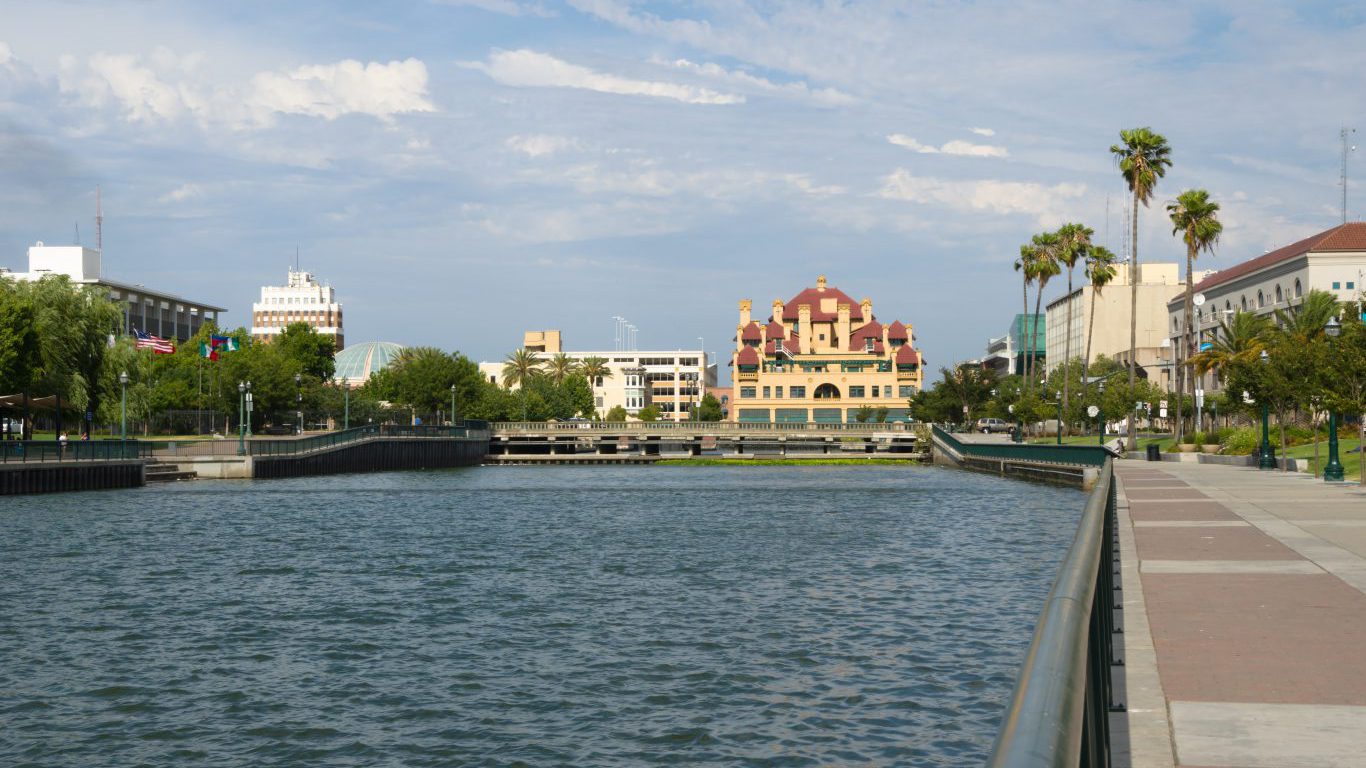
15. Stockton-Lodi, CA
> Dec. 2016 unemployment rate: 7.7%
> Dec. 2006 unemployment rate: 7.4%
> Median household income: $53,705
> Adults w/ bachelor’s degree: 18.8%
Since the peak of the recession in 2009, the number of unemployed workers nationwide has declined by approximately one-third. While the number of jobless workers in Stockton-Lodi has fallen by roughly the same amount, unemployment remains prevalent in the metro area. An estimated 7.7% of the area’s labor force is out of work, versus the 4.7% national unemployment rate.
[in-text-ad]

14. Yakima, WA
> Dec. 2016 unemployment rate: 7.9%
> Dec. 2006 unemployment rate: 7.3%
> Median household income: $47,223
> Adults w/ bachelor’s degree: 15.7%
In most of the metropolitan areas on this list, unemployment peaked during the recession at rates much higher than the nationwide peak rate. Rates in many of these metro areas then fell significantly, even if they did not drop to national unemployment levels. In Yakima, however, the unemployment rate peaked at 11%, only slightly higher than the U.S. peak rate of 10%. The jobless rate improvement since then trailed the country as a whole, dropping by just 3.1 percentage points compared to the nationwide unemployment rate decline of 5.3 percentage points.
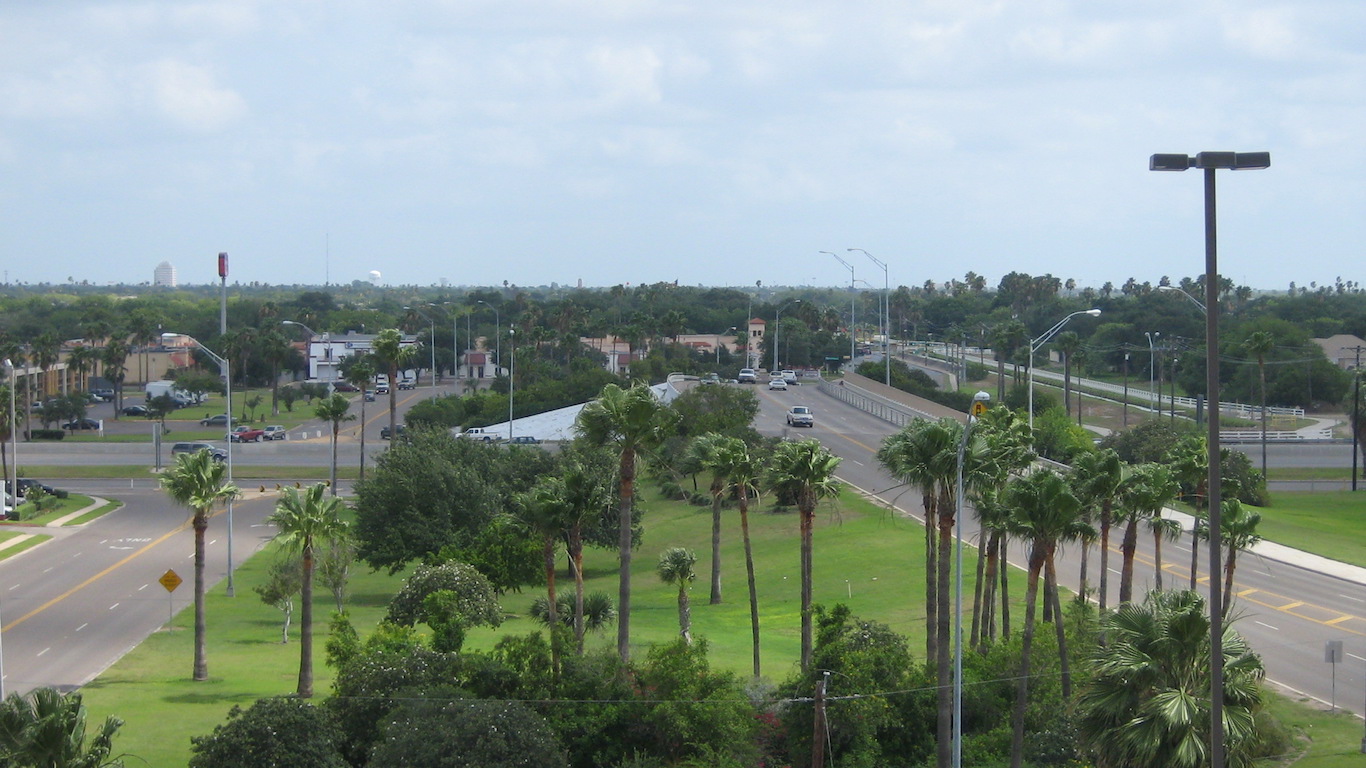
13. McAllen-Edinburg-Mission, TX
> Dec. 2016 unemployment rate: 8.0%
> Dec. 2006 unemployment rate: 6.8%
> Median household income: $35,730
> Adults w/ bachelor’s degree: 17.3%
McAllen-Edinburg-Mission is one of many towns along the U.S.-Mexico border where a large share of residents are unemployed and many still feel the lingering effects of the recession. Despite falling substantially since its 12.1% peak in November 2010, McAllen’s current unemployment rate of 8.0% remains among the highest of any metro area. One reason may be the large number of non-English-speaking workers with low levels of education crossing the border and settling in the metro area. Finding steady employment tends to be considerably more difficult for these individuals.
12. Modesto, CA
> Dec. 2016 unemployment rate: 8.1%
> Dec. 2006 unemployment rate: 7.8%
> Median household income: $52,363
> Adults w/ bachelor’s degree: 16.4%
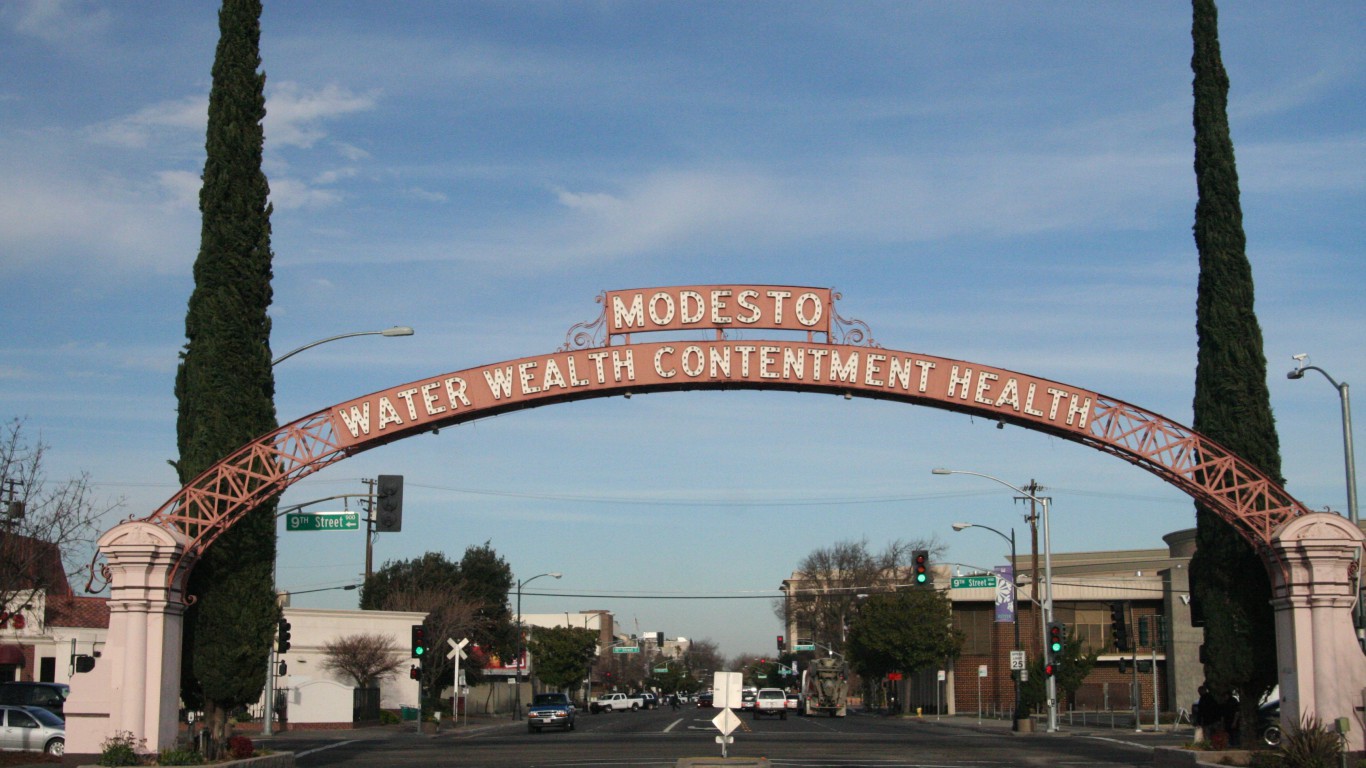
Modesto was one of the hardest-hit metro areas during the recession. The area’s unemployment rate peaked at 17.2% in March 2010, well above the national rate of 9.9% at the time. Since then, the area’s unemployment rate has plummeted by 9.1 percentage points, but its current rate of 8.1% is still one of the higher rates in the country.
[in-text-ad-2]
11. Farmington, NM
> Dec. 2016 unemployment rate: 8.7%
> Dec. 2006 unemployment rate: 3.9%
> Median household income: $49,613
> Adults w/ bachelor’s degree: 14.1%
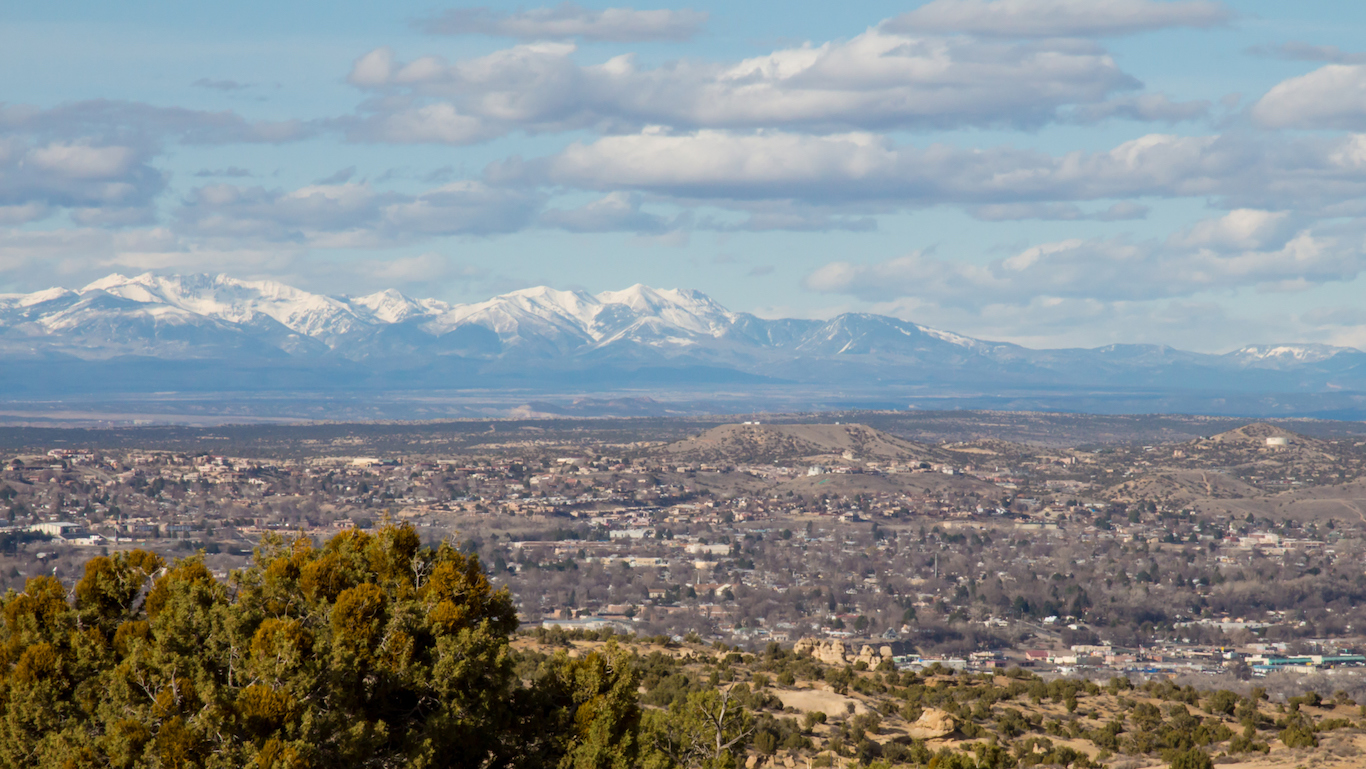
While the U.S. unemployment rate has nearly returned to pre-recession levels — rising from 4.4% in December 2006 to 10.0% in October 2010 and then falling to 4.7% last December — the recovery was less substantial in Farmington, New Mexico. The metro area’s unemployment rate of 8.7% as of December 2016 remains more than twice the city’s December 2006 unemployment rate.
10. Madera, CA
> Dec. 2016 unemployment rate: 8.8%
> Dec. 2006 unemployment rate: 6.7%
> Median household income: $47,150
> Adults w/ bachelor’s degree: 15.4%
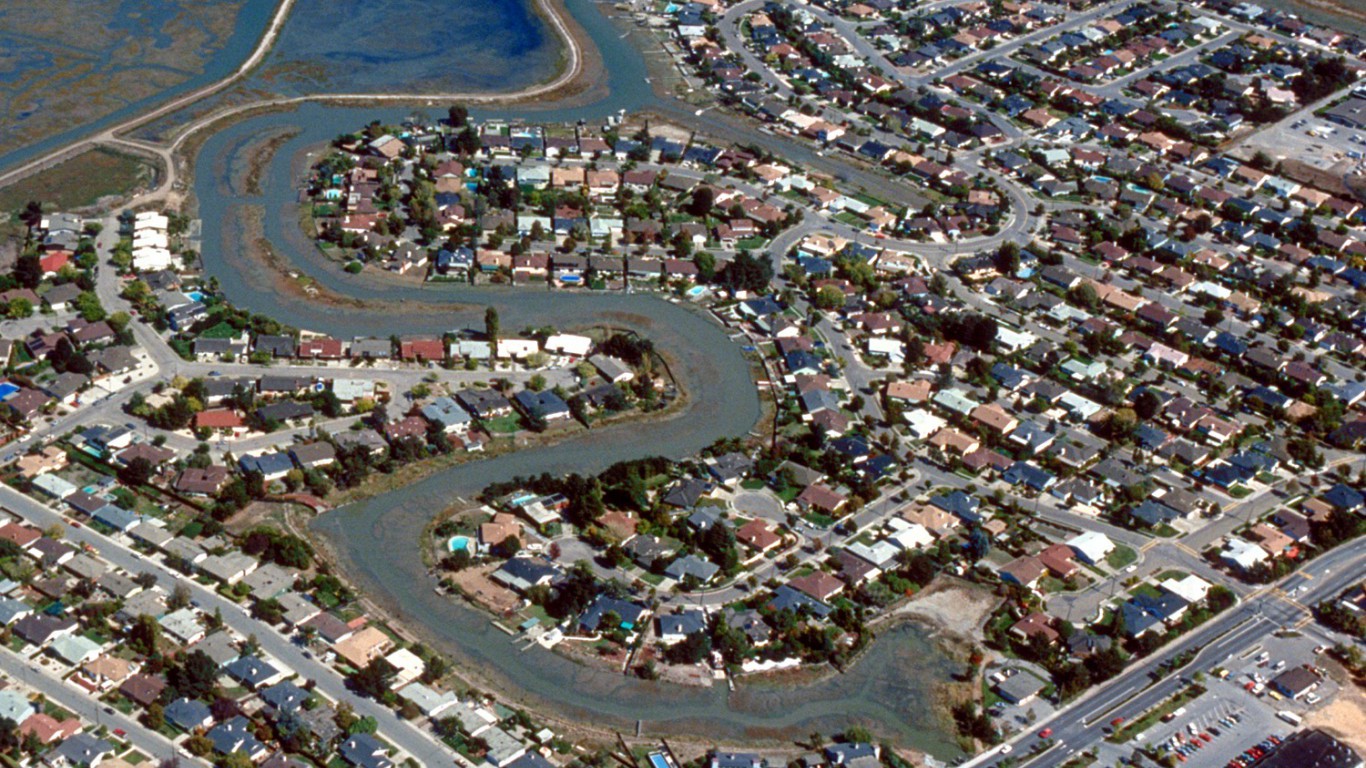
Few cities were hit harder by the recession than Madera, California. The metro area’s unemployment rate rose by more than 10 percentage points, increasing from 6.7% in December 2006 to 16.9% in December 2010. While the share of jobless workers has since fallen to 8.8%, Madera’s unemployment rate remains far higher than the national figure.
[in-text-ad]

9. Ocean City, NJ
> Dec. 2016 unemployment rate: 9.0%
> Dec. 2006 unemployment rate: 6.3%
> Median household income: $57,116
> Adults w/ bachelor’s degree: 30.7%
While the U.S. unemployment rate today is just 0.3 percentage points higher than it was at the start of the Great Recession, the Ocean City, New Jersey labor market is considerably worse off than it was 10 years ago. An estimated 9.0% of the city’s workforce is unemployed, far more than the metro’s December 2006 unemployment rate of 6.3%. Ocean City’s recovery was likely dampened by Hurricane Sandy in 2012, which caused an estimated $36.9 billion of damage across New Jersey.
8. Fresno, CA
> Dec. 2016 unemployment rate: 9.2%
> Dec. 2006 unemployment rate: 7.8%
> Median household income: $46,949
> Adults w/ bachelor’s degree: 19.2%
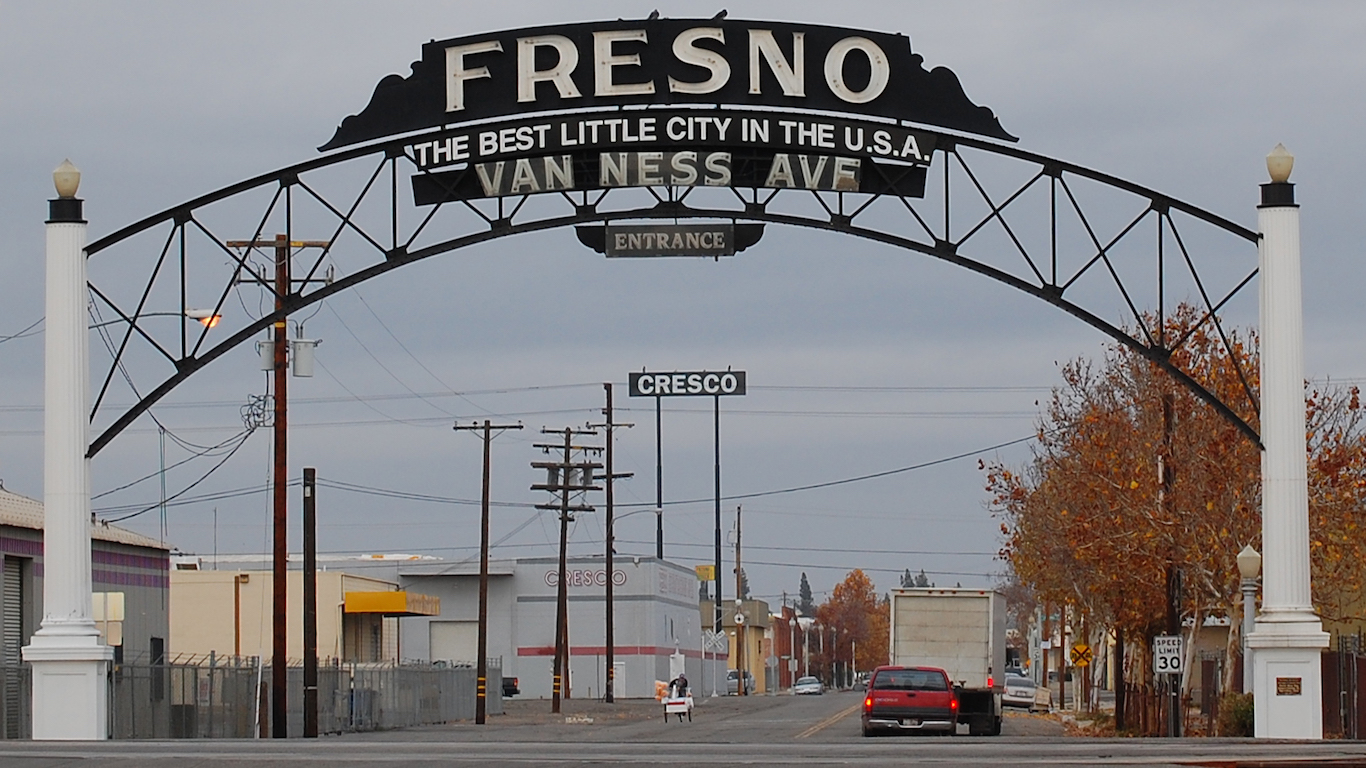
Fresno is one of many cities in California’s Central Valley where high crime, low educational attainment, and drought have stymied recovery from the Great Recession. Agricultural workers make up 10.7% of the metro area’s total employment, one of the largest shares of any city. While farming has historically been a boon to the area’s economy, severe drought in recent years has led to job losses statewide.
With less than one in five adults having a college degree and more than one in four residents living in poverty, Fresno is likely to continue to struggle with high unemployment.

7. Yuba City, CA
> Dec. 2016 unemployment rate: 9.3%
> Dec. 2006 unemployment rate: 8.6%
> Median household income: $51,185
> Adults w/ bachelor’s degree: 15.2%
Since the 2009 peak of the Great Recession, the number of unemployed workers in the United States has fallen by roughly one-third. While a similar recovery has occurred in Yuba City, California, with the number of jobless workers falling from 12,600 in 2009 to 6,800 in 2016, joblessness remains prevalent in the metro area. An estimated 9.3% of the Yuba City labor force is out of work, more than twice the national rate.
[in-text-ad-2]

6. Hanford-Corcoran, CA
> Dec. 2016 unemployment rate: 9.6%
> Dec. 2006 unemployment rate: 8.2%
> Median household income: $45,746
> Adults w/ bachelor’s degree: 16.1%
An estimated 9.6% of the Hanford-Corcoran labor force is unemployed, the sixth highest jobless rate of any metro area. While down substantially from the November, 2011 peak of 17.0%, the area’s unemployment rate remains higher than the city’s pre-recession unemployment rate of 8.2% in December 2006. Like many metro areas with high unemployment, Hanford-Corcoran residents are considerably less likely than adults nationwide to have a bachelor’s degree, and considerably more likely to be employed in agriculture. The sector accounts for 14.9% of the workforce, versus the national share of 1.9%.
5. Bakersfield, CA
> Dec. 2016 unemployment rate: 9.8%
> Dec. 2006 unemployment rate: 7.4%
> Median household income: $51,342
> Adults w/ bachelor’s degree: 16.2%
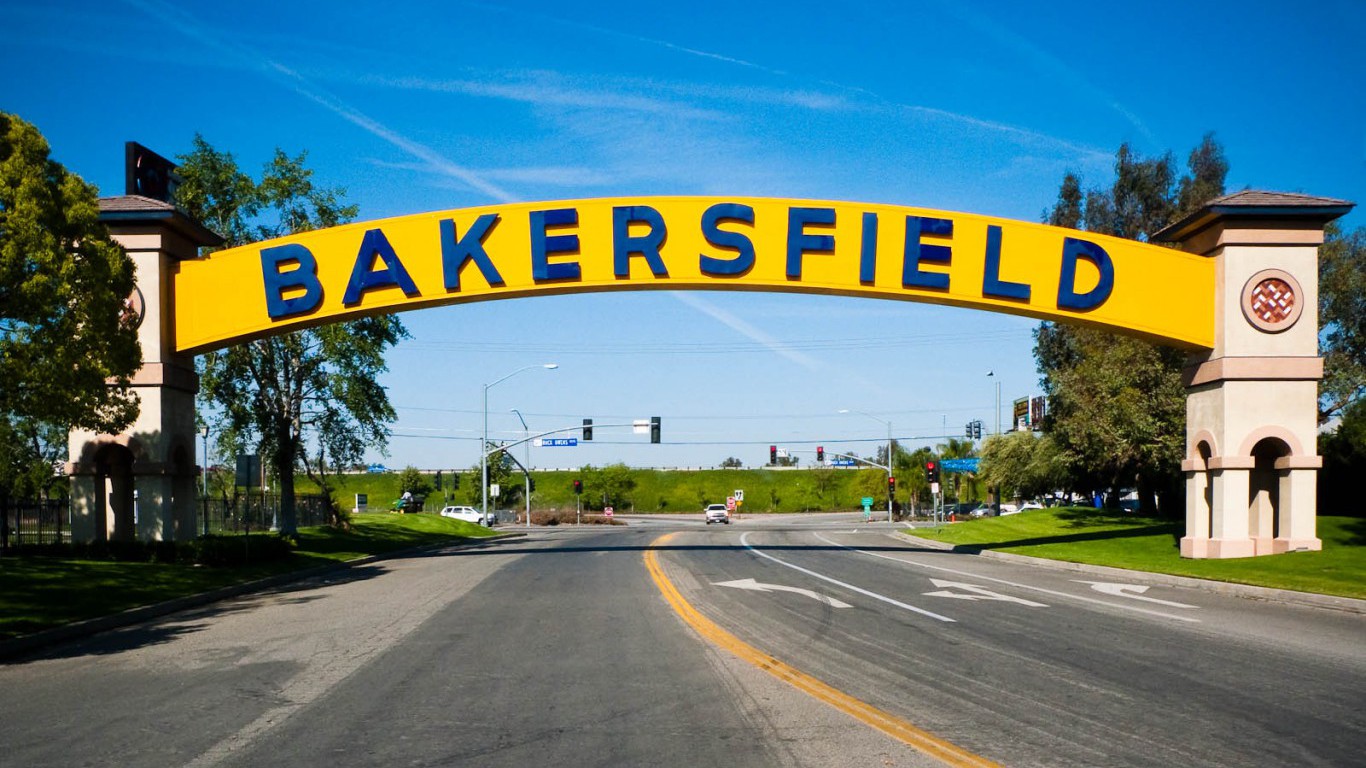
Bakersfield is one of several California metropolitan areas with high unemployment rates. Also, like a number of these California metro areas, Bakersfield’s economy is disproportionately dependent on agriculture. While 1.9% of all jobs nationwide are in the agriculture, forestry, fishing, hunting, and mining sector, 17.3% of all Bakersfield employment is in the sector.
[in-text-ad]
4. Merced, CA
> Dec. 2016 unemployment rate: 10.0%
> Dec. 2006 unemployment rate: 9.2%
> Median household income: $41,997
> Adults w/ bachelor’s degree: 14.4%
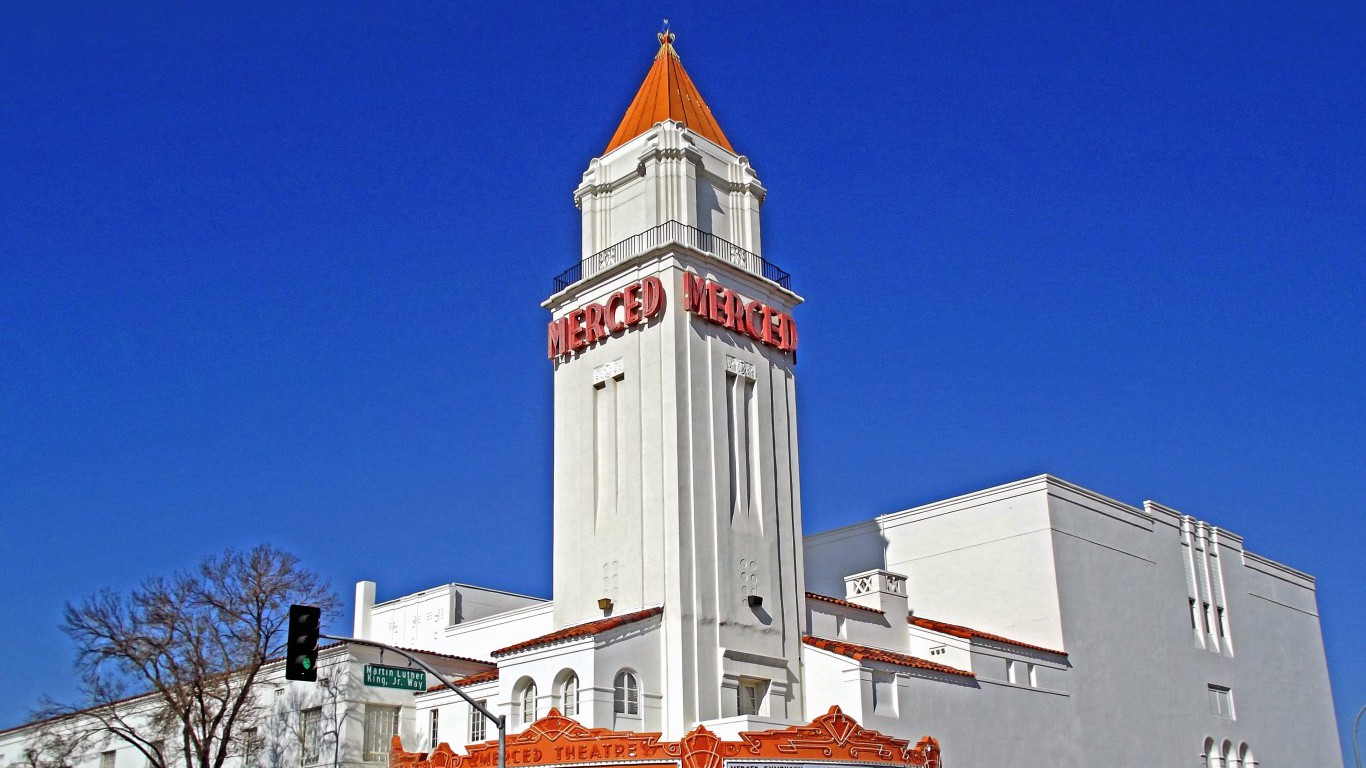
Merced is one of several cities with high unemployment in the agricultural heartland of California’s Central Valley. An estimated 15.2% of workers in Merced are employed in agriculture, the seventh highest share nationwide. While farming has historically been a strong point for the area’s economy, in recent years a statewide drought has resulted in job losses and added expenses.
Roughly one in 10 members of the Merced labor force is unemployed, one of the highest unemployment rates nationwide.

3. Visalia-Porterville, CA
> Dec. 2016 unemployment rate: 10.9%
> Dec. 2006 unemployment rate: 8.4%
> Median household income: $42,413
> Adults w/ bachelor’s degree: 14.2%
An estimated 10.9% of Visalia-Porterville residents are unemployed, one of the highest unemployment rates of any metro area and far higher than the city’s pre-recession jobless rate of 8.4% in 2006. One factor that may hinder economic recovery in Visalia is the metro area’s shallow talent pool. Just 14.2% of adults in the city have a bachelor’s degree, less than half the 30.1% national college attainment rate.

2. Yuma, AZ
> Dec. 2016 unemployment rate: 18.2%
> Dec. 2006 unemployment rate: 14.4%
> Median household income: $40,539
> Adults w/ bachelor’s degree: 15.4%
While the number of out-of-work residents in Yuma, Arizona has fallen substantially in recent years, the city’s 18.2% unemployment rate is the second highest of any metro area today. Yuma has one of the most agriculture-heavy economies in the country. While 1.9% of all workers nationwide are employed in the sector that includes agriculture, 11.5% of Yuma’s workforce is employed in that sector. The metro area’s substantial farming sector attracts a large number of migrant workers, many of which cannot find work and file for unemployment. The number of migrant workers may have increased in recent years. The population of Yuma grew by more than 20% between 2000 and 2010.
[in-text-ad-2]
1. El Centro, CA
> Dec. 2016 unemployment rate: 20.9%
> Dec. 2006 unemployment rate: 16.5%
> Median household income: $40,852
> Adults w/ bachelor’s degree: 14.3%
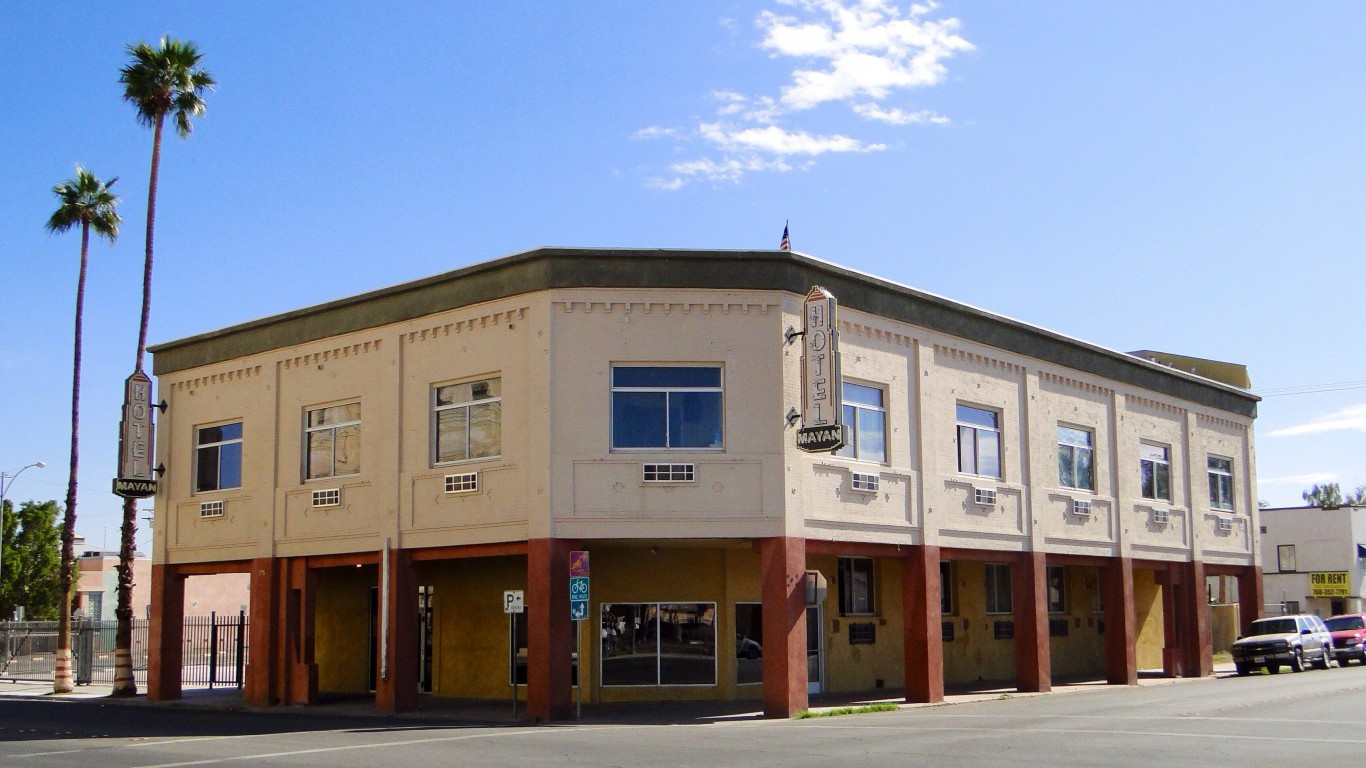
More than one in five members of the El Centro workforce is unemployed, the highest unemployment rate of any U.S. metro area. Like many border towns, rampant unemployment in El Centro may be the result of the area’s proximity to Mexico. Many local businesses rely on tourists and day laborers from country, but tightened border security in recent years has cut down on the number of Mexicans visiting the metropolitan area. With 25% of the city’s population living in poverty and just 14% of adults holding a bachelor’s degree, unemployment in El Centro is likely to persist.
21. Kahului-Wailuku-Lahaina, HI
> Dec. 2016 unemployment rate: 2.9%
> Dec. 2006 unemployment rate: 2.1%
> Median household income: $70,468
> Adults w/ bachelor’s degree: 25.3%
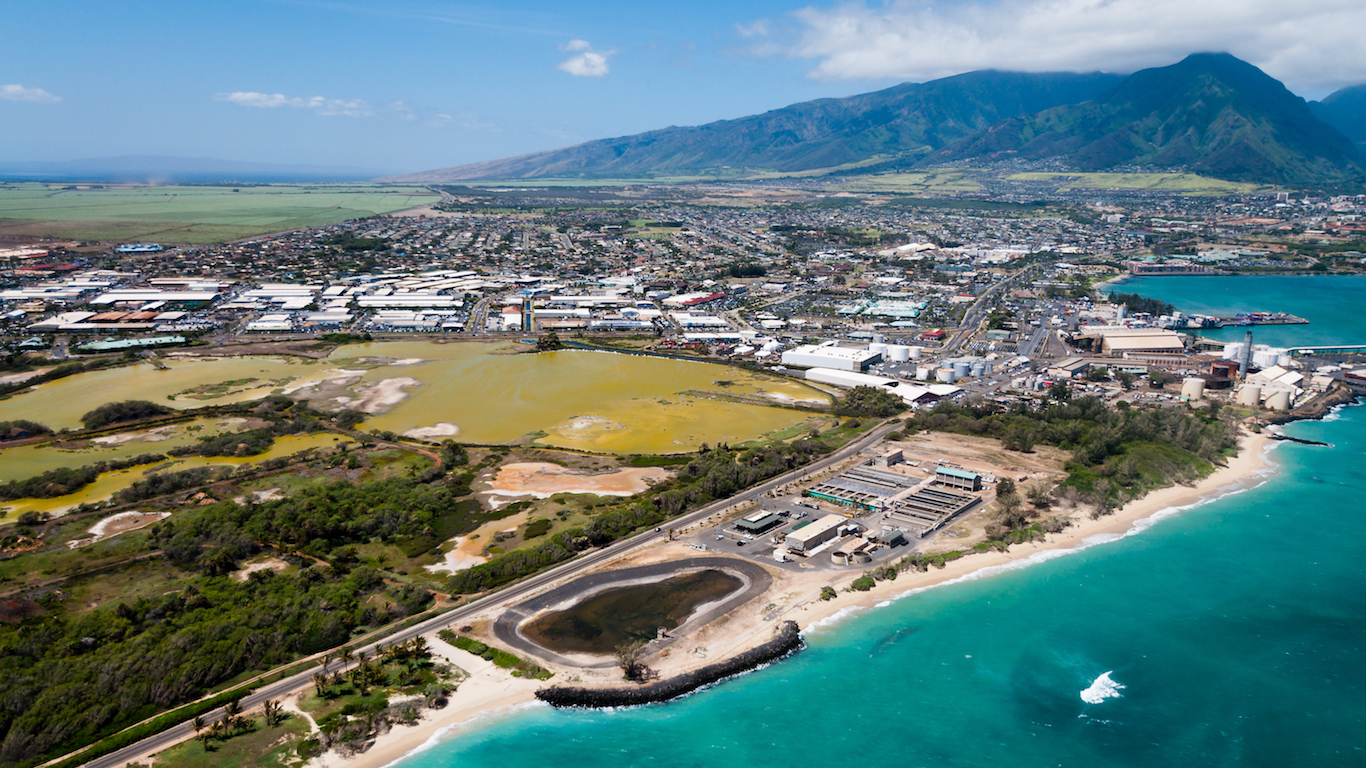
Thriving metropolitan job markets almost always have the benefit of a highly educated workforce. The Kahului-Wailuku-Lahaina metro area, however, is the exception. Just 25.3% of area adults have at least a bachelor’s degree, well below the national percentage of 30.6%. Employment in arts, entertainment, recreation, accommodation and food service jobs, which often does not require a college degree, likely explains the outlier. In Kahului-Wailuku-Lahaina, 22.5% of the labor force is employed in the sector, the third highest share of all U.S. metros and more than double the national share of 9.8%.
[in-text-ad]

20. Logan, UT-ID
> Dec. 2016 unemployment rate: 2.9%
> Dec. 2006 unemployment rate: 2.0%
> Median household income: $51,555
> Adults w/ bachelor’s degree: 33.4%
While unemployment in some of the cities on this list fluctuated — increasing during the recession and declining after it — unemployment in Logan consistently was one of the lowest nationwide over the last decade. Unemployment in the area peaked at just 6.1% in April 2010, while the U.S. unemployment rate was nearly 10%. The jobless rate has remained at or below 3.5% over the past three years. This consistently low unemployment rate has been impressive given the area’s recent growth in job seekers. The size of Logan’s labor force increased by 3.2% in the last year, nearly three times the U.S. labor force increase.

19. Portland-South Portland, ME
> Dec. 2016 unemployment rate: 2.9%
> Dec. 2006 unemployment rate: 3.3%
> Median household income: $62,074
> Adults w/ bachelor’s degree: 39.6%
Portland, Maine is one of six metro areas in New England with exceptionally low unemployment. Only 2.9% of Portland’s workforce is out of a job, well below the 4.7% national unemployment rate.
In many metro areas across the country, a college education can increase the likelihood of sustained employment, even during economic downturns. Like other metro areas in neighboring states with low unemployment, educational attainment is relatively high in Portland. Some 39.6% of area adults have at least a bachelor’s degree, well above the 30.6% of American adults.

18. Lincoln, NE
> Dec. 2016 unemployment rate: 2.9%
> Dec. 2006 unemployment rate: 2.7%
> Median household income: $54,002
> Adults w/ bachelor’s degree: 36.7%
Historically, unemployment has been less of a problem in Lincoln, Nebraska than it has been nationwide. The metro area’s unemployment rate has not climbed above 4.5% in the last 25 years. In comparison, national unemployment peaked at 10.0% over the same time period.
A basic education is a prerequisite for many jobs, and Lincoln residents are much more likely to have at least a basic education than most Americans. Some 94.1% of metro area adults have at least a high school diploma compared to 87.1% of American adults.
[in-text-ad-2]

17. Greeley, CO
> Dec. 2016 unemployment rate: 2.8%
> Dec. 2006 unemployment rate: 4.2%
> Median household income: $70,256
> Adults w/ bachelor’s degree: 25.9%
A growing labor force can indicate economic confidence and often means an area’s job market is thriving. No metro area labor force grew more over the past decade than that of the Greeley, Colorado region. Between 2006 and last year, the metro’s labor force grew by 27.3%, many times faster than the national labor force growth of 4.3%. The favorable economic conditions in Greeley partially account for the area’s high incomes. The typical household earns $70,256 annually, one of the highest median household incomes nationwide.
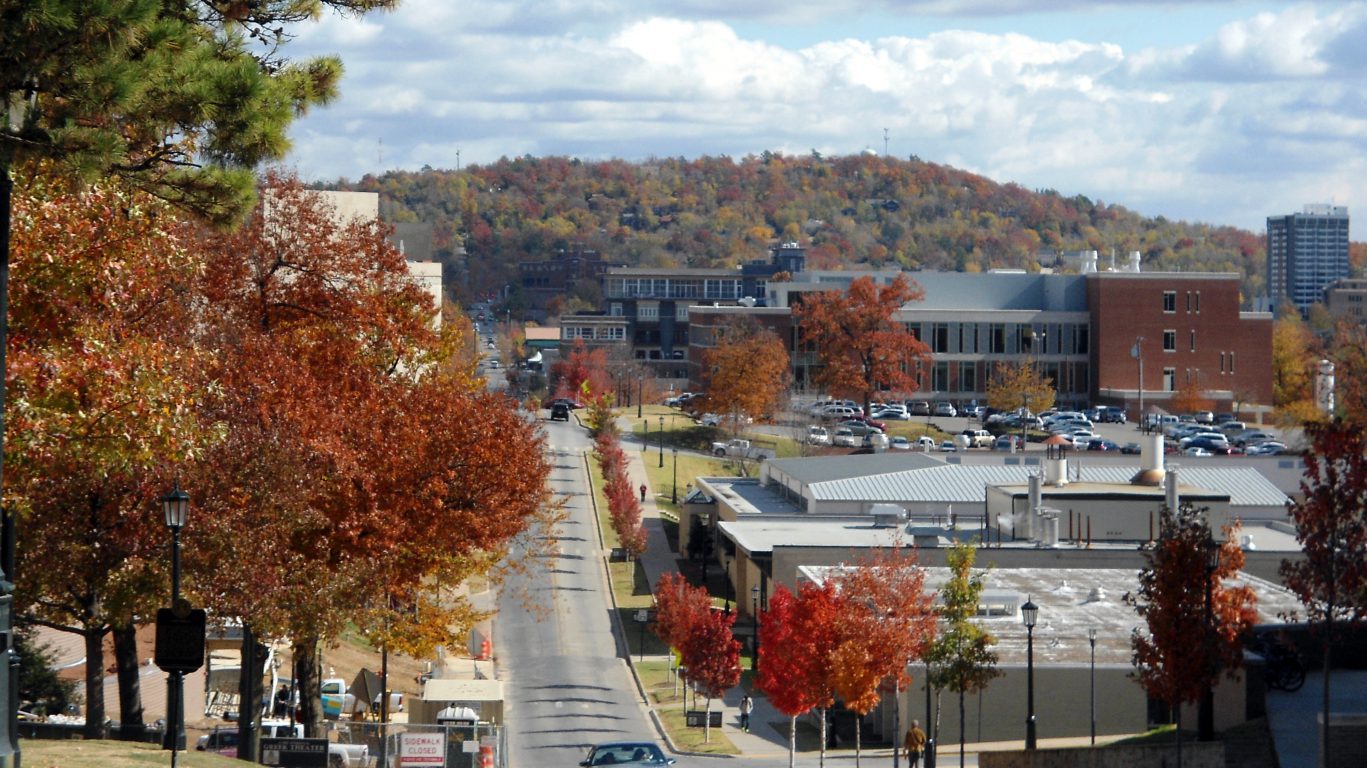
16. Fayetteville-Springdale-Rogers, AR-MO
> Dec. 2016 unemployment rate: 2.8%
> Dec. 2006 unemployment rate: 3.5%
> Median household income: $50,788
> Adults w/ bachelor’s degree: 30.8%
Between December 2006 and December 2009, Fayetteville’s total employment fell by about 11,600, or 5.3%, to under 210,000. Since then, the Fayetteville economy has more than recovered. Employment has risen by more than 20% to 252,783. In the last year alone, the number of people without a job fell by 30% in the area, while total U.S. unemployment fell by about 5% over the same period.
[in-text-ad]

15. Provo-Orem, UT
> Dec. 2016 unemployment rate: 2.8%
> Dec. 2006 unemployment rate: 2.4%
> Median household income: $65,092
> Adults w/ bachelor’s degree: 37.7%
Unemployment in the Provo-Orem metro area peaked at 7.8% in December 2009. As was the case across the country, the area’s recession-related unemployment rate peak was the worst jobless rate recorded in the last quarter-century. Since then, the area’s job market has improved greatly. Currently, only 2.8% of the metro area labor force is out of a job, lower than both the 3.1% statewide unemployment rate and the 4.7% national unemployment rate.

14. Urban Honolulu, HI
> Dec. 2016 unemployment rate: 2.8%
> Dec. 2006 unemployment rate: 2.3%
> Median household income: $77,273
> Adults w/ bachelor’s degree: 33.2%
Urban Honolulu’s economy was more resilient than most to the effects of the recession. While national unemployment peaked at 10.0% in October 2009, unemployment in Urban Honolulu only peaked at 6.2%. Today, only 2.8% of workers in the Honolulu metro area are out of a job.
Honolulu’s industrial composition does not closely resemble that of the U.S. as a whole, which may explain why its economy did not experience the recession in the same way. A popular tourist destination, some 14.7% of the area’s labor force works in the arts, entertainment, and accommodation industry, a larger share than the 9.8% of all U.S. workers.

13. Bismarck, ND
> Dec. 2016 unemployment rate: 2.8%
> Dec. 2006 unemployment rate: 2.8%
> Median household income: $65,173
> Adults w/ bachelor’s degree: 33.9%
Over the last decade, the North Dakota oil boom has helped metro areas throughout the state stave off the worst effects of the recession. While the national unemployment rate rose from 4.4% in December 2006 to its 10.0% peak in October 2009, Bismarck’s jobless rate never rose above 4.0% over the last decade. The metro area’s unemployment rate has since dropped as low as 2.3% in October 2015. Since then, however, job losses throughout the state, perhaps due to falling oil prices, caused the area’s jobless rate to inch up to 2.8% by December 2016.
[in-text-ad-2]

12. Boston-Cambridge-Nashua, MA-NH
> Dec. 2016 unemployment rate: 2.7%
> Dec. 2006 unemployment rate: 4.5%
> Median household income: $78,800
> Adults w/ bachelor’s degree: 46.0%
While unemployment in nearly two-thirds of all metropolitan areas has yet to return to pre-recession levels, the Boston-Cambridge-Nashua metro area’s labor market is in better shape than it was 10 years ago. Despite rising as high as 8.1% in December 2009, the city’s unemployment rate has since declined to 2.7% as of last December. One factor that may have accelerated the recovery is the metro’s high college attainment rate. Some 46% of all area adults have a bachelor’s degree, one of the largest shares in the country.

11. Denver-Aurora-Lakewood, CO
> Dec. 2016 unemployment rate: 2.7%
> Dec. 2006 unemployment rate: 3.9%
> Median household income: $70,283
> Adults w/ bachelor’s degree: 41.8%
Unemployment in the Denver metro area peaked at 8.9% in October 2010, below peak unemployment nationwide of 10% in October the previous year. Since then, the Denver-Aurora-Lakewood labor market has far outpaced the national improvement, with unemployment dropping to 2.7%. By contrast, 4.7% of the national labor force is currently out of a job. Like most urban regions with healthy job markets, the labor force in the Denver area has grown substantially in recent years — by 12.3% between 2009 and 2016, several times faster than the national labor force growth of 4.3% over that period.
[in-text-ad]
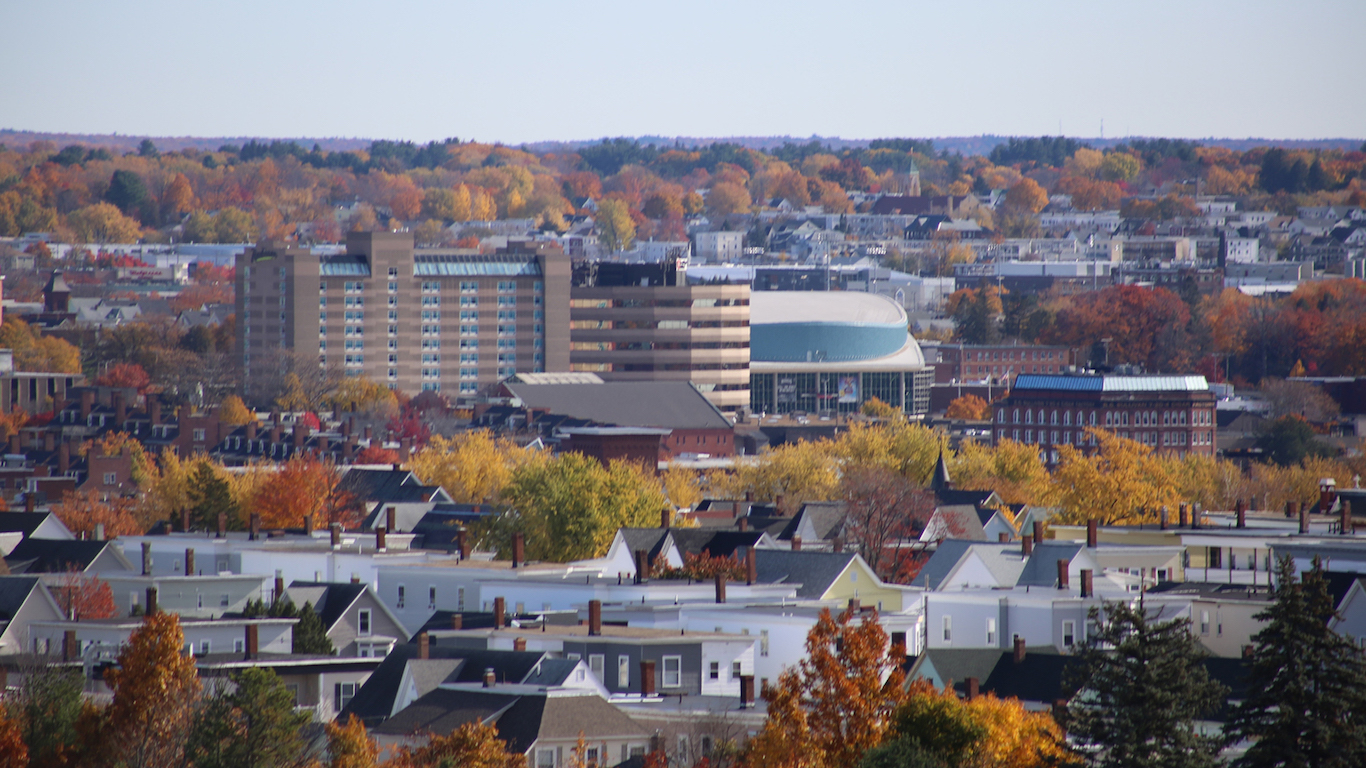
10. Manchester, NH
> Dec. 2016 unemployment rate: 2.6%
> Dec. 2006 unemployment rate: 3.7%
> Median household income: $74,323
> Adults w/ bachelor’s degree: 36.9%
Only 2.6% of workers in Manchester, New Hampshire are out of a job, nearly the smallest share of any metro area in the country. Unlike the country as a whole, Manchester’s hardest economic times in the last 25 years were in the early 1990s. For several months in 1991, Manchester’s unemployment rate reached 7.7% — far higher than the area’s post-recession unemployment peak of 6.6%. Meanwhile, nationwide, unemployment hit 10.0% in October 2009.
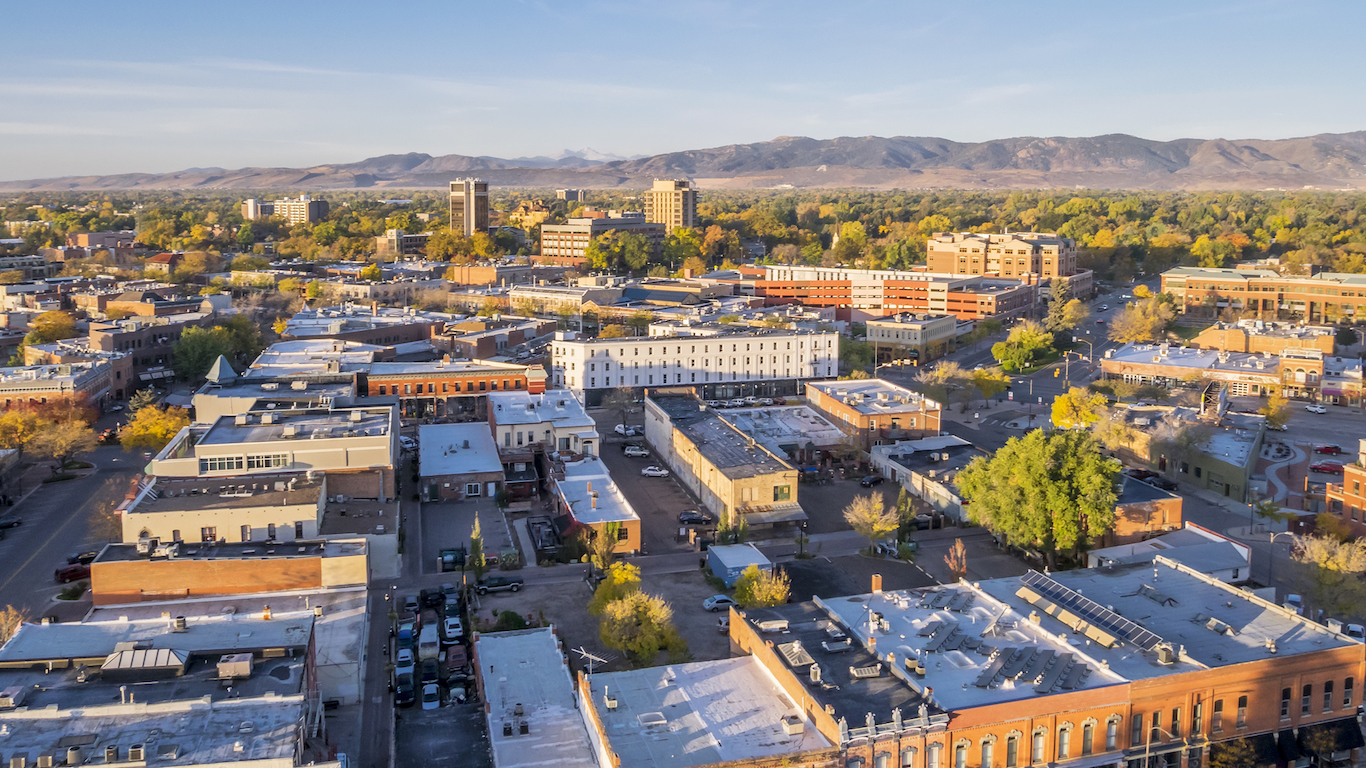
9. Fort Collins, CO
> Dec. 2016 unemployment rate: 2.6%
> Dec. 2006 unemployment rate: 3.5%
> Median household income: $64,919
> Adults w/ bachelor’s degree: 46.2%
The Fort Collins unemployment rate fell substantially after the recession, declining from a peak of 7.9% in November 2010 to just 2.6% as of last December — one of the lowest jobless rates in the country today. Even as the city’s labor force grew over the last six years, the number of unemployed workers in Fort Collins fell by more than 60%. Fort Collins is one of several cities along Interstate-25 in Colorado’s Front Range region whose labor markets have reported strong recoveries since the Great Recession.

8. Iowa City, IA
> Dec. 2016 unemployment rate: 2.6%
> Dec. 2006 unemployment rate: 2.6%
> Median household income: $55,332
> Adults w/ bachelor’s degree: 43.6%
Few metro areas weathered the recession better than Iowa City. While the national unemployment rate rose from 4.4% in December 2006 to its 10.0% peak in October 2009, Iowa City’s unemployment rate never rose above 4.9% throughout the decade ending last December. The share of unemployed workers in Iowa City has since returned to its pre-recession level of 2.6%, one of the lowest unemployment rates nationwide.
[in-text-ad-2]

7. Fargo, ND-MN
> Dec. 2016 unemployment rate: 2.6%
> Dec. 2006 unemployment rate: 2.8%
> Median household income: $56,051
> Adults w/ bachelor’s degree: 34.5%
Much of North Dakota benefitted enormously from the booming resource extraction industry in the state’s Bakken shale region. Fargo’s unemployment is even lower than that of the state. However, economic growth in the metro area is driven largely by a growing technology sector. Employment in science, technology, engineering and math workers in the state have increased by around 40% since 2001, compared to a 3% national increase in STEM jobs.
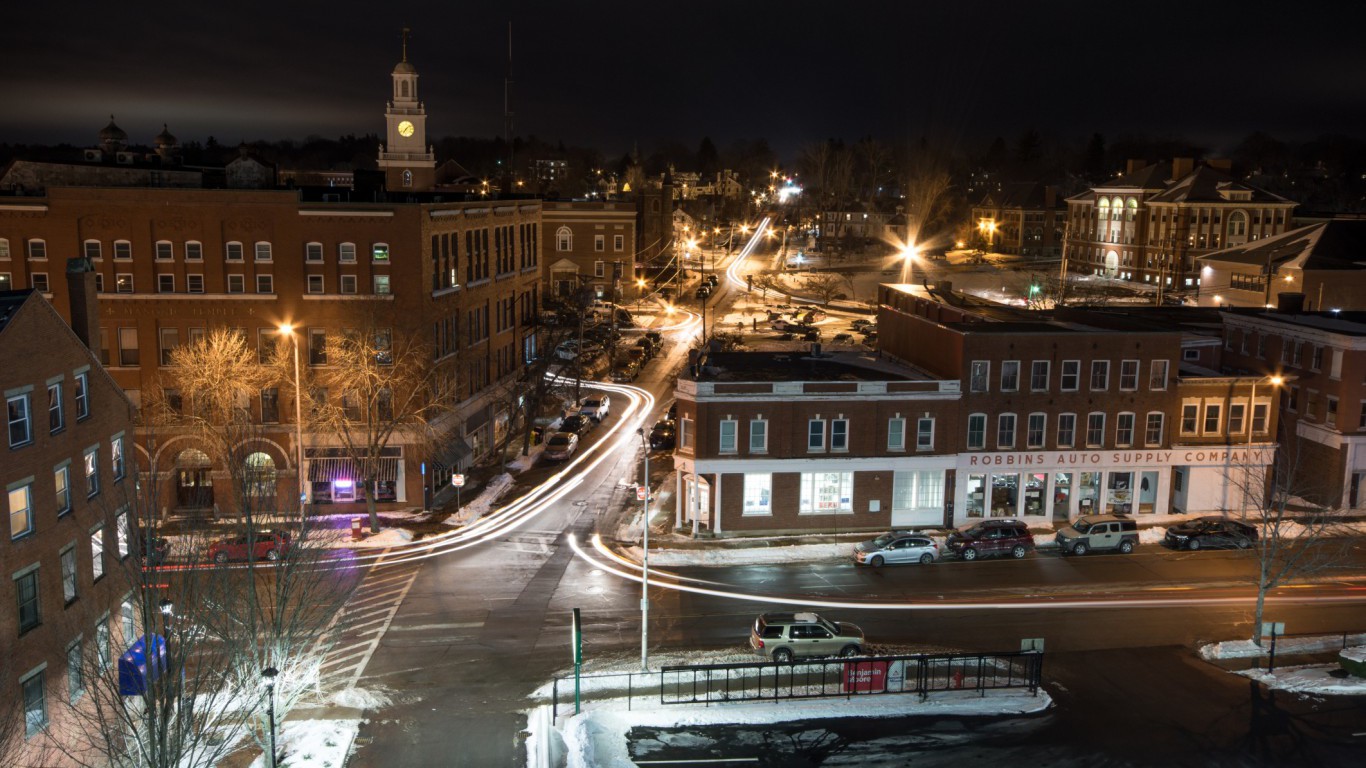
6. Dover-Durham, NH-ME
> Dec. 2016 unemployment rate: 2.5%
> Dec. 2006 unemployment rate: 3.4%
> Median household income: N/A
> Adults w/ bachelor’s degree: N/A
The Dover-Durham metro area’s labor force has grown from 78,500 workers in 2006 to about 83,000 in 2016. The area’s job market has accommodated the influx handily. Only 2.5% of all metro area workers are out of a job today, down from 3.4% a decade ago.
The improvement has not been steady over the last 10 years, however. Due to the effects of the recession, unemployment in the metro area hit a 10-year high of 6.7% in April 2009. Improving steadily since, the Dover-Durham metro area currently has the sixth lowest unemployment rate of all U.S. metro areas.
[in-text-ad]

5. Boulder, CO
> Dec. 2016 unemployment rate: 2.4%
> Dec. 2006 unemployment rate: 3.3%
> Median household income: $72,009
> Adults w/ bachelor’s degree: 60.6%
Boulder is one of many cities along Interstate-25 in Colorado’s Front Range region with labor markets that are faring better than they did before the recession hit. Despite increasing from 3.3% in December 2006 to a peak of 7.3% in November 2010, the city’s unemployment rate has since fallen to 2.4%. Even as the size of the city’s labor force grew over the last six years, the number of unemployed workers in Boulder fell by nearly 50% — one of the largest improvements of any metro area since the Great Recession.
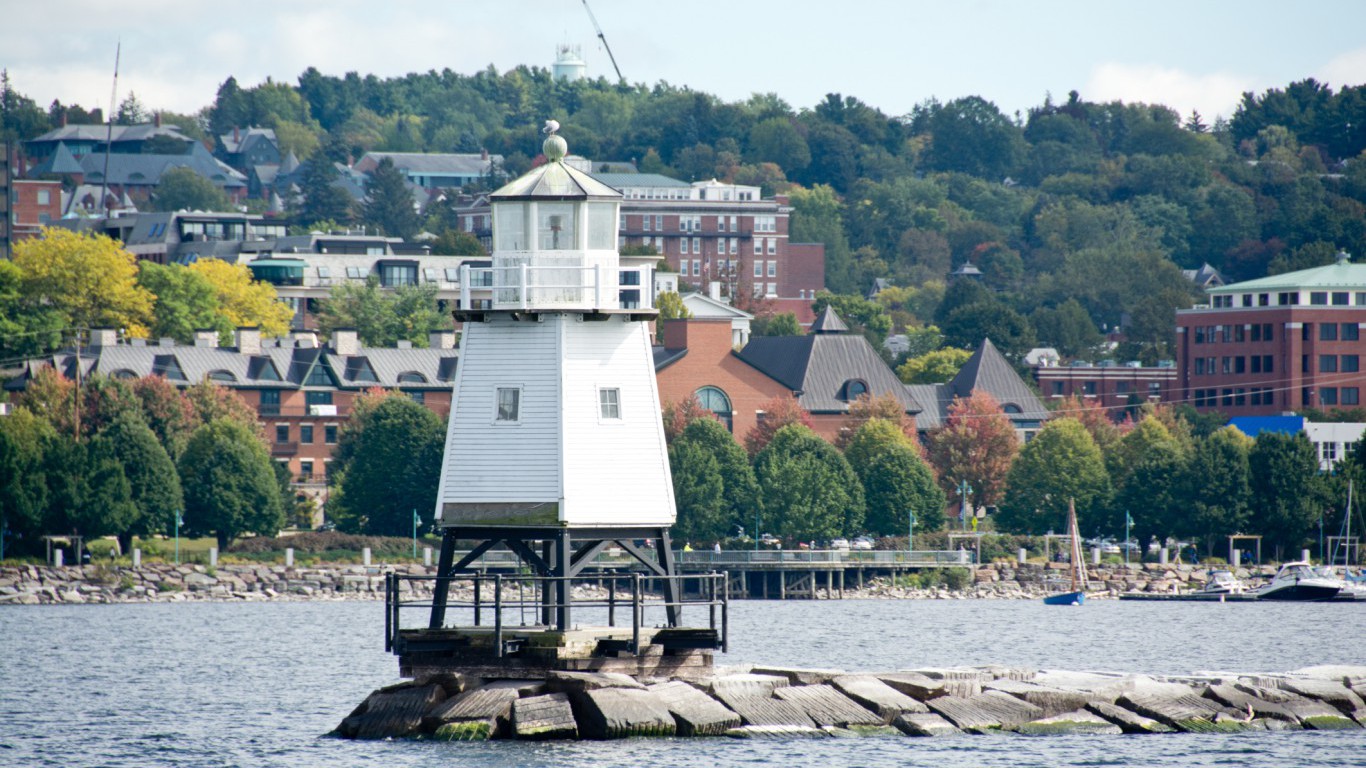
4. Burlington-South Burlington, VT
> Dec. 2016 unemployment rate: 2.4%
> Dec. 2006 unemployment rate: 3.4%
> Median household income: $66,807
> Adults w/ bachelor’s degree: 43.4%
Like Vermont, Burlington weathered the recession better than most parts of the United States. Unemployment in the metro area peaked at just 6% in April of 2009 and has improved steadily since. The Burlington job market continues to thrive, with just 2.4% of the labor force looking for work, roughly half the national jobless rate of 4.7%. The remarkably high percentage of area adults with a college education, 43.4%, certainly helps explain the relatively favorable economic conditions. By contrast, only 30.1% of adults nationwide have a bachelor’s degree.

3. Portsmouth, NH-ME
> Dec. 2016 unemployment rate: 2.4%
> Dec. 2006 unemployment rate: 3.3%
> Median household income: N/A
> Adults w/ bachelor’s degree: N/A
Of the Portsmouth, New Hampshire metropolitan area’s labor force of about 76,000 workers, only roughly 1,800 are unemployed. This figure represents a 45% improvement from 2009, when about 4,300 workers were unemployed. The metro area’s current low jobless rate of 2.4% reflects its state’s healthy job market. New Hampshire currently has the lowest unemployment rate in the country, at 2.6%.
[in-text-ad-2]

2. Sioux Falls, SD
> Dec. 2016 unemployment rate: 2.4%
> Dec. 2006 unemployment rate: 2.7%
> Median household income: $59,844
> Adults w/ bachelor’s degree: 31.7%
Unemployment is much less of a problem in Sioux Falls, South Dakota than it is in much of the country. In the last quarter century, the area’s unemployment was above 5% for only eight months — peaking at 5.3% in August 2009. Currently, only 2.4% of the area’s labor force is out of a job, the second smallest share of any metro area in the country.
Sioux Falls has an especially large banking sector. The state eliminated interest rate caps, and as a result, many of the major banks’ credit card headquarters are in Sioux Falls. Some 10.6% of the metro area’s workforce is employed in finance and insurance, a larger share than the 6.5% of workers nationwide who are employed in the industry.
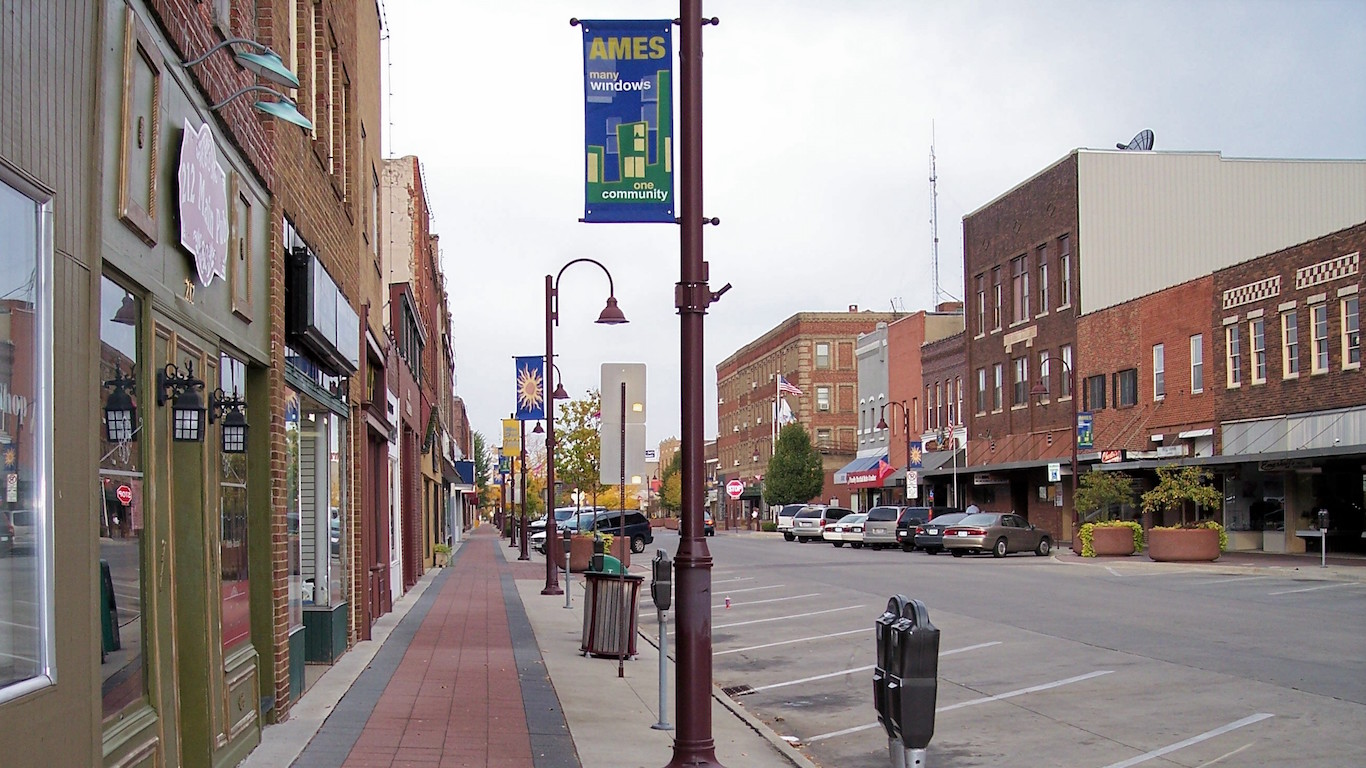
1. Ames, IA
> Dec. 2016 unemployment rate: 2.3%
> Dec. 2006 unemployment rate: 2.6%
> Median household income: $50,811
> Adults w/ bachelor’s degree: 51.6%
At just 2.3% of the labor market, Ames, Iowa has the lowest unemployment rate of any metro area in the country. Ames is one of only a handful of U.S. metro areas where a majority of adults have at least a bachelor’s degree. With broader qualifications, workers are more flexible, and likely have an easier time staying employed.
Ames weathered the recession especially well. The unemployment rate peaked at just 4.9% in July 2009 — less than half the nationwide peak of 10.0%. Unlike most metropolitan areas with the best job markets, the typical household in Ames actually earns less than the national median household income.
The Average American Is Losing Momentum On Their Savings Every Day (Sponsor)
If you’re like many Americans and keep your money ‘safe’ in a checking or savings account, think again. The average yield on a savings account is a paltry .4%1 today. Checking accounts are even worse.
But there is good news. To win qualified customers, some accounts are paying more than 7x the national average. That’s an incredible way to keep your money safe and earn more at the same time. Our top pick for high yield savings accounts includes other benefits as well. You can earn a $200 bonus and up to 7X the national average with qualifying deposits. Terms apply. Member, FDIC.
Click here to see how much more you could be earning on your savings today. It takes just a few minutes to open an account to make your money work for you.
Thank you for reading! Have some feedback for us?
Contact the 24/7 Wall St. editorial team.