Special Report
America's Fastest Growing Cities

Published:
Last Updated:

The U.S. population grew by less than 1% last year, among the slowest rates in decades. While nationwide population growth was slow, the trend of Americans moving from rural areas to metropolitan centers continued. Some urban areas are remarkably more popular destinations than others.
Over the last five years, the populations of nearly 30 metropolitan areas grew by more than 10%, while the U.S. population grew by 3.7%. The Villages, Florida, had the fastest growing metropolitan population in the United States, increasing by 25.8% over the last five years.
[in-text-ad]
Populations can grow in several ways. One is by natural growth, which occurs when there are more births than deaths. However, natural growth only accounted for a small part of the population growth in most of these fast-growing metropolitan areas.
Click here to see America’s fastest growing cities.
Click here to see America’s fastest shrinking cities.
The factor that drove the massive population growth in the cities on this list was migration — domestic and international. In all 20 of the fastest growing cities, natural growth accounted for less than one-third of the five-year population growth rate. In several of the places on this list, notably retirement destinations like The Villages, the natural population growth actually had a negative effect on the overall population growth.
All but but a few of the 20 cities with the fastest growing populations are in warmer parts of the country — across the South and Southwestern United States.
In an interview with 24/7 Wall St., William Frey, senior demographer at public policy think tank Brookings Institute, explained that high growth in cities in those parts of the country is indicative of the long-term U.S. migratory trend of Americans moving from the Northeast and the Midwest — including the Rust Belt — to the Sun Belt.
This trend has been going on for some time, but with notable exceptions during the economic downturn of 2007 and 2008. In some of these rapidly growing regions, Frey explained, “the recession and the mortgage meltdown put the brakes on local mobility.” Frey added that only in the last couple of years have improving economic conditions in Sun Belt cities resulted in a return to pre-2007 population growth.
The promise of employment opportunities, explained Frey, is one of the biggest drivers of migration. In the majority of these fast growing metropolitan areas, January unemployment rates are far below the national rate of 4.7%.
The relationship between unemployment and population growth is likely strong in part because it can be a self-perpetuating cycle, Frey explained. If young people are disinclined to move to an area because it has fewer job opportunities, the population will stagnate, potentially leading to even greater economic decline, and as a result, even greater job losses.
Young people account for the largest share of U.S. migratory populations, and this affects the composition of these fast-growing cities. In Provo-Orem, Utah, where the population grew by 11.5% over the last five years, over half of the population is under the age of 25, the largest share of any metropolitan area and well above the national share of nearly one-third.
Not all of the fast-growing cities are younger, however. Several, notably the Florida metropolitan areas of The Villages and Punta Gorda, are actually known as major retirement destinations. While 26.5% of the nation’s population is 55 and older, 55.4% of Punta Gorda residents and 70.4% of The Villages residents are at least 55. While a few retirement communities stand out on this list, Frey noted that elderly residents are far less likely to move, and so these metro areas are highly unusual.
24/7 Wall St. based this list of the fastest growing and shrinking cities on recently released U.S. Census Bureau estimates of population changes in the 381 U.S. metropolitan statistical areas from July 2011 through July 2016. Poverty rates, educational attainment rates, and workforce composition came from the Census Bureau’s 2015 American Community Survey. Unemployment rates are for January 2011 and January 2017.
These are America’s fastest growing cities.
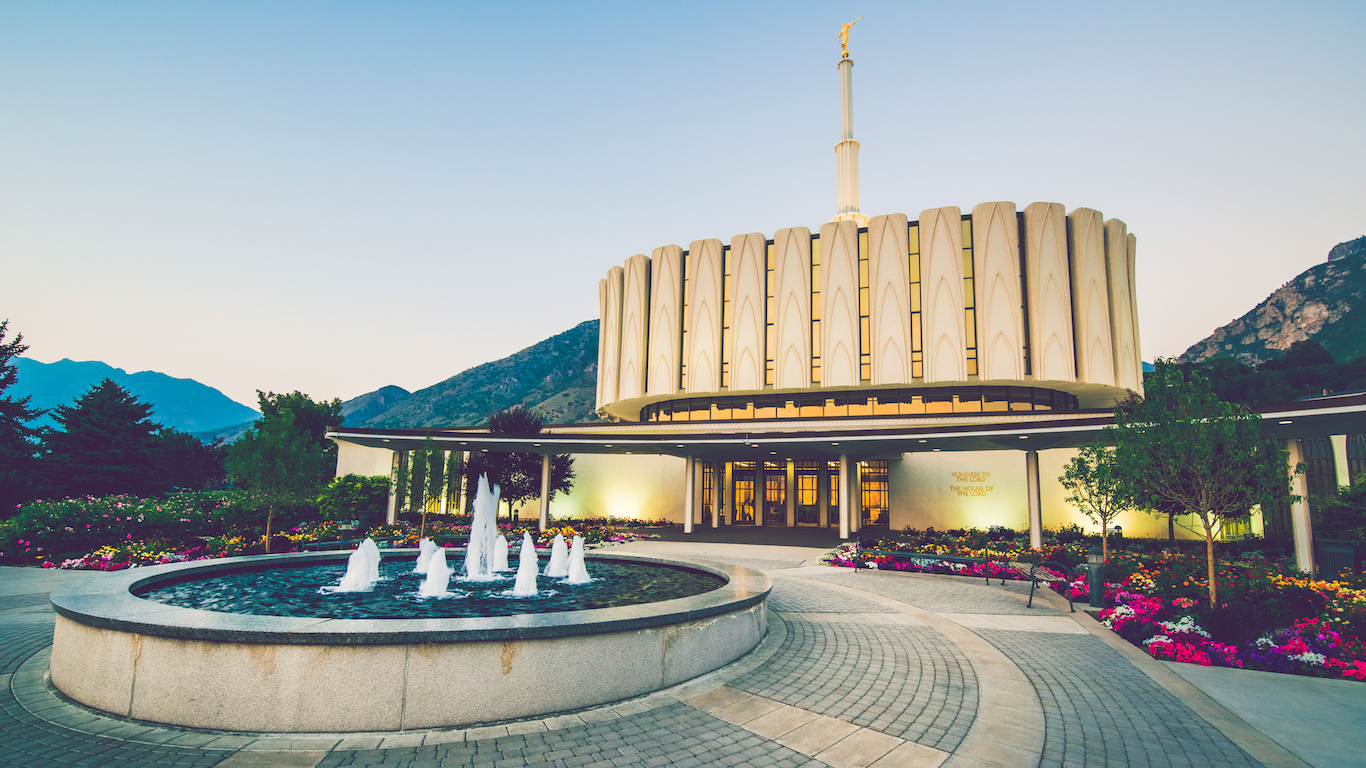
20. Provo-Orem, UT
> Population growth (2011-2016): 11.52%
> Total population: 603,309
> Per capita income: $34,227
> Unemployment rate: 2.7%
The Provo-Orem metro area’s population grew by 11.5% since 2011, far outpacing the U.S. population growth of 3.7% over the same period. Unlike most rapidly growing metro areas, which are primarily growing by attracting new residents, Provo-Orem’s population explosion is largely the result of a high birthrate. Of the area’s 11.5% growth rate, about 9.2 percentage points are attributable to a natural increase — births outpacing deaths — in the area. Some 51.1% of area residents are younger than 25, the largest such share in the country.
[in-text-ad]
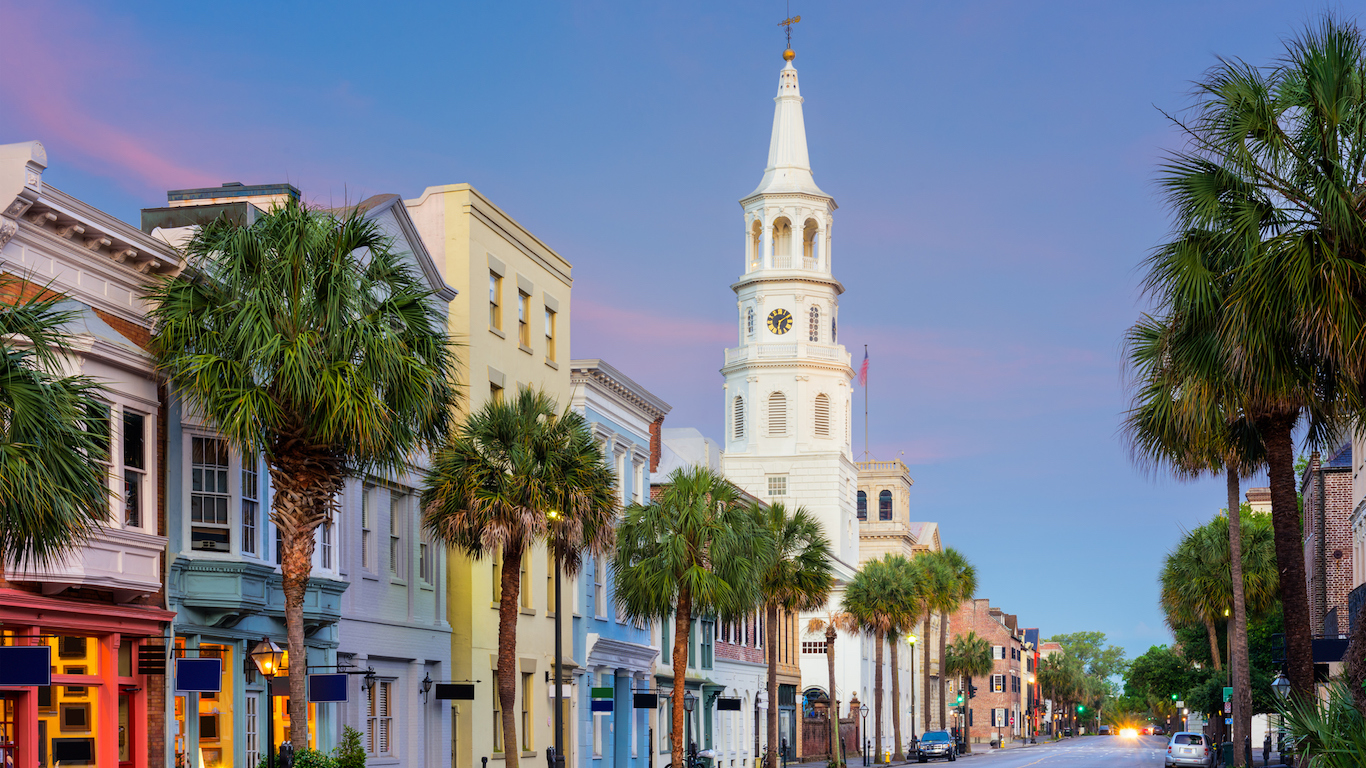
19. Charleston-North Charleston, SC
> Population growth (2011-2016): 11.72%
> Total population: 761,155
> Per capita income: $43,393
> Unemployment rate: 3.9%
The Charleston metro area population has increased from about 681,000 in 2011 to well over three quarters of a million in 2016. The metro area’s economy has accommodated the influx quite well. Unemployment in the coastal South Carolina metro has fallen from 8.8% in 2011 to 3.9% in 2017. The local jobless rate is also well below the national rate of 4.7%. The area has also benefited from higher-than-average 2.5% annual GDP growth over the last five years.

18. Daphne-Fairhope-Foley, AL
> Population growth (2011-2016): 11.74%
> Total population: 208,563
> Per capita income: $40,121
> Unemployment rate: 5.7%
By far the largest contributor to the Daphne-Fairhope-Foley metro area’s population growth over the last five years is attributable to migration from other parts of the United States. New residents may be attracted to the area’s relative safety and affordability. Goods and services in the metro area cost nearly 8% less than they do on average nationwide. Additionally, there were only 195 violent crimes for every 100,000 metro area residents in 2015, a far lower violent crime rate compared to a national rate of 373 incidents per 100,000.
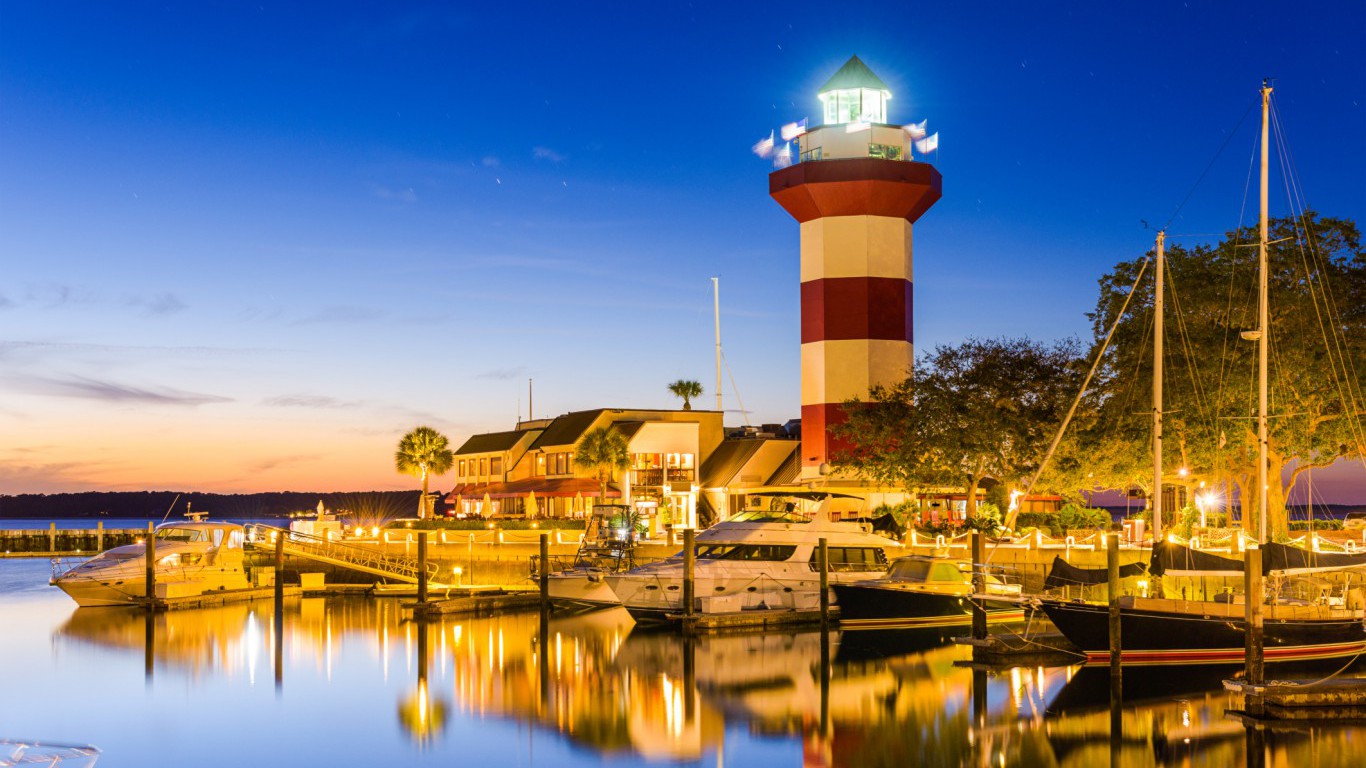
17. Hilton Head Island-Bluffton-Beaufort, SC
> Population growth (2011-2016): 11.75%
> Total population: 211,614
> Per capita income: $45,158
> Unemployment rate: 4.3%
With miles of beach, two dozen golf courses, and hundreds of tennis courts, Hilton Head Island is a popular tourist destination. In the last five years, the broader Hilton Head Island-Bluffton-Beaufort metro area has also been a magnet for new residents as the area’s population ballooned by 11.8%, faster than all but a few other U.S. metro areas. In addition to recreational amenities, favorable economic conditions may have been drawing new residents. Goods and services are about 6% less expensive in the metro area than they are across the country on average, and only 4.3% of the local labor force is out of a job, lower than the 4.7% national unemployment rate.
[in-text-ad-2]

16. Punta Gorda, FL
> Population growth (2011-2016): 11.77%
> Total population: 178,465
> Per capita income: $37,745
> Unemployment rate: 5.5%
The ongoing growth of the U.S. elderly population helps explain the influx of residents to popular retirement destinations. Punta Gorda, where over half of residents are 55 older, is a case in point. Only The Villages, another Florida metropolitan area, has a proportionally larger elderly population. The outsized contribution from migration versus natural growth — births minus deaths — also reflects this trend. Unlike most cities, especially on this list, natural growth was negative in Punta Gorda, meaning there were more deaths than births over the last five years.

15. Crestview-Fort Walton Beach-Destin, FL
> Population growth (2011-2016): 11.78%
> Total population: 267,059
> Per capita income: $46,340
> Unemployment rate: 4.2%
Situated along the coast of Florida’s Panhandle, the Crestview-Fort Walton Beach-Destin metro area, like many rapidly growing metros, has a warm climate and significant beachfront real estate. Along with the population growth over the last five years, economic conditions have also improved considerably. Unemployment fell from 8.5% in 2011 to 4.2% 2017.
[in-text-ad]

14. Houston-The Woodlands-Sugar Land, TX
> Population growth (2011-2016): 11.80%
> Total population: 6,772,470
> Per capita income: $54,346
> Unemployment rate: 5.6%
The broader Houston metro area’s population has grown from 6.1 million in 2011 to about 6.8 million in 2016. A high birthrate accounts for a large share of population growth in Houston, although migration both from other parts of the country and abroad were the largest source of population growth in the area.
The metro area’s economy has grown in conjunction with its population. Houston’s GDP has increased by an average of 4.7% each year in the past five years, faster than in all but 10 other U.S. metro areas.

13. Fargo, ND-MN
> Population growth (2011-2016): 11.86%
> Total population: 238,124
> Per capita income: $49,987
> Unemployment rate: 2.7%
Good economic conditions may explain much of Fargo’s 11.9% population growth in the last five years. Unemployment has remained quite low in the area, falling from 3.9% in 2011 to 2.7% in 2017. This is in stark contrast to the U.S. unemployment rate, which was as high as 9.1% in 2011 and now stands at 4.7%.
Not only are jobs readily available in Fargo, but they also appear to pay relatively well. Personal income per capita in Fargo is about $50,000 a year, about $1,900 higher than the comparable national figure. A dollar also goes farther in Fargo as goods and services are about 6.5% less expensive in the metro area than they are on average nationwide.
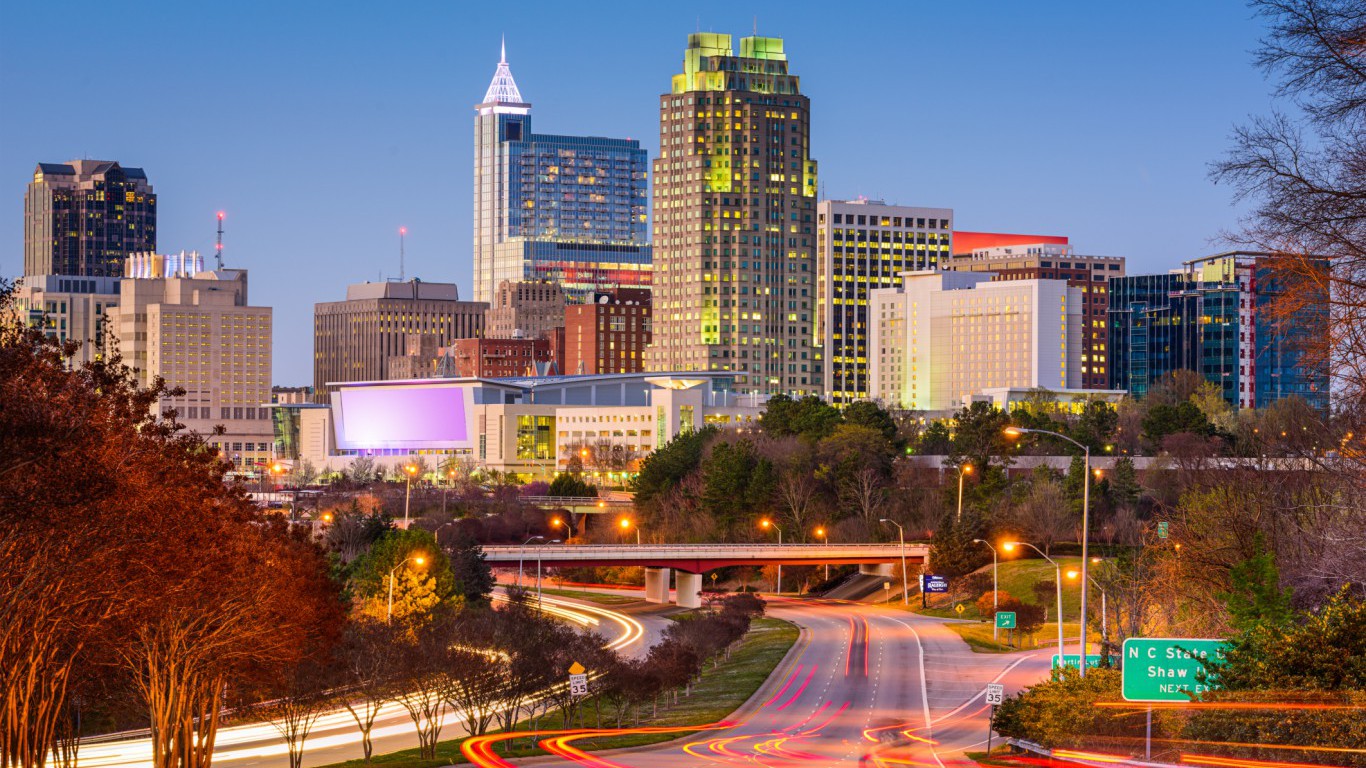
12. Raleigh, NC
> Population growth (2011-2016): 12.02%
> Total population: 1,302,946
> Per capita income: $48,411
> Unemployment rate: 4.4%
North Carolina’s capital is one of only 12 U.S. metro areas to report a population boom of at least 12% over the past half decade. Population growth in the Raleigh metro area is due primarily to Americans moving in from other parts of the country and from abroad — though a high birthrate also played a significant role.
The Raleigh metro area is a key part of the Research Triangle region, so-named because the area is home to a number of high tech jobs and research institutions. Partially for this reason, Raleigh’s population is among the most highly educated in the country, as 44.4% of area adults have at least a bachelor’s degree.
[in-text-ad-2]
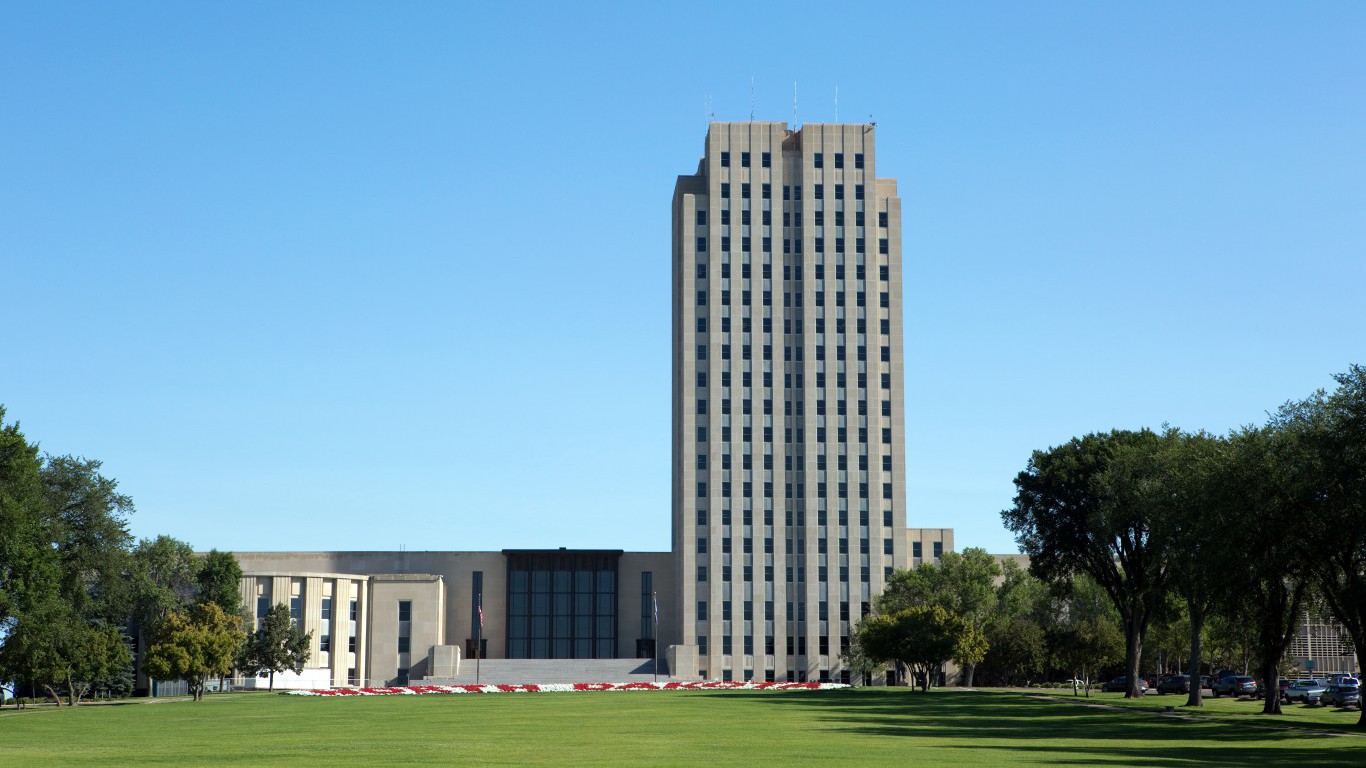
11. Bismarck, ND
> Population growth (2011-2016): 12.14%
> Total population: 131,635
> Per capita income: $54,124
> Unemployment rate: 2.8%
Large urban centers are typically among the most attractive destinations for Americans looking to relocate. With a population of 131,635, Bismarck is one of the smaller, more rural metro areas on this list, but this has not hindered its five-year population growth of 12.1%.
Home values in an area reflect the demand for housing — often among relatively new residents. In Bismarck, the median home value of $236,300 is one of the higher home values of all metro areas, and it is up substantially from $157,800 in 2011. The area’s January unemployment rate of just 2.8% is one of the lowest in the nation and reflects the favorable economic conditions that can attract new residents.
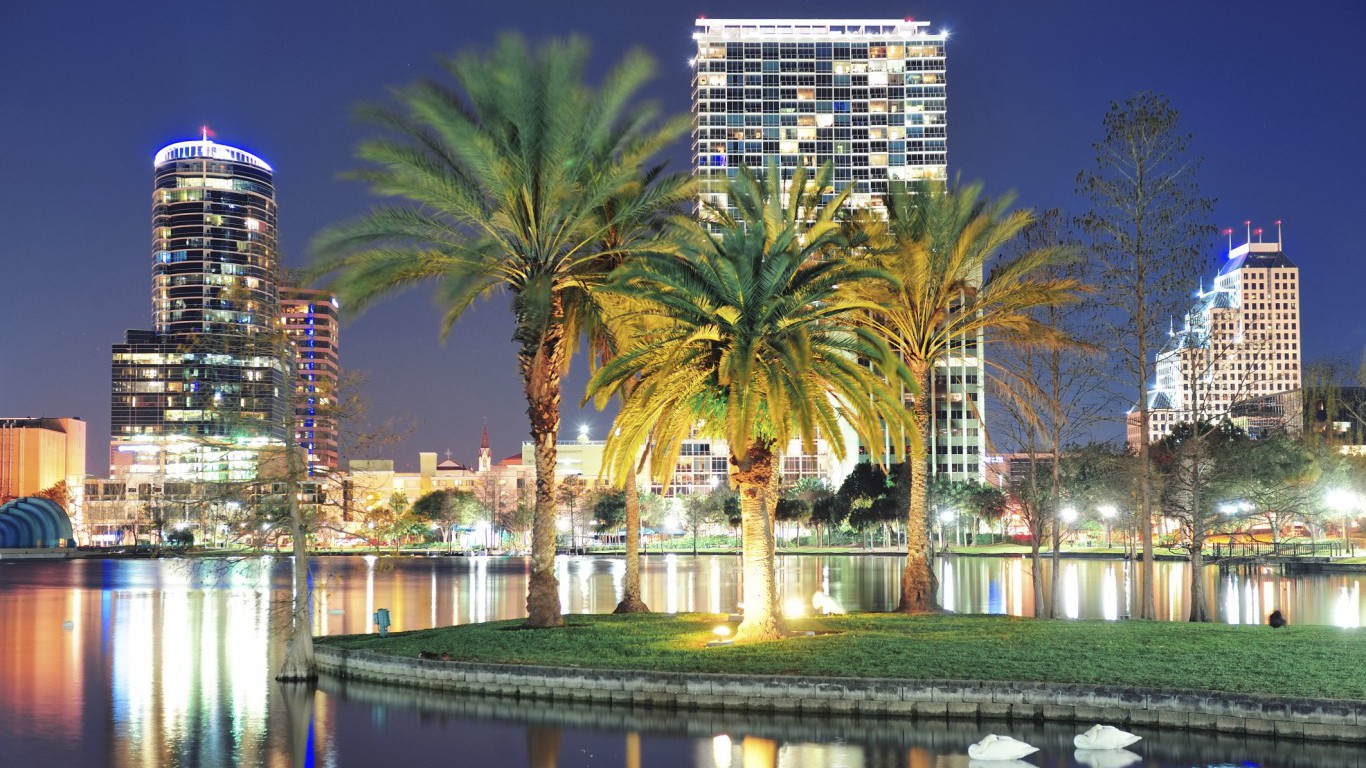
10. Orlando-Kissimmee-Sanford, FL
> Population growth (2011-2016): 12.21%
> Total population: 2,441,257
> Per capita income: $38,632
> Unemployment rate: 4.6%
The Orlando-Kissimmee-Sanford metro area has grown substantially in the last five years. Though population growth was driven primarily by Americans moving in from other parts of the U.S., new residents immigrating from abroad comprised an unusually large share of new Orlando residents in the last five years. International migration contributed 3.8 percentage points to the 12.21% population growth, the eighth largest such contribution of all metro areas. Some portion of these new residents are likely on temporary visas or undocumented. According to a recent Pew Study, the Orlando metro area has one of the largest unauthorized immigrant populations in the country.
[in-text-ad]

9. Odessa, TX
> Population growth (2011-2016): 12.72%
> Total population: 157,462
> Per capita income: $45,806
> Unemployment rate: 5.8%
Odessa is one of a few fast-growing metro areas where a high birth rate outpaced migration as the driver of population growth. The metro area’s population grew by 12.7% in the last five years. Over the same period, the area’s economic output also grew by an average of 5.5% a year, a faster rate than in all but four other U.S. metros.
Unlike most metro areas with booming populations, Odessa is not especially safe. The metro area is one of only four nationwide that had more than 1,000 violent crimes for every 100,000 residents in 2015.
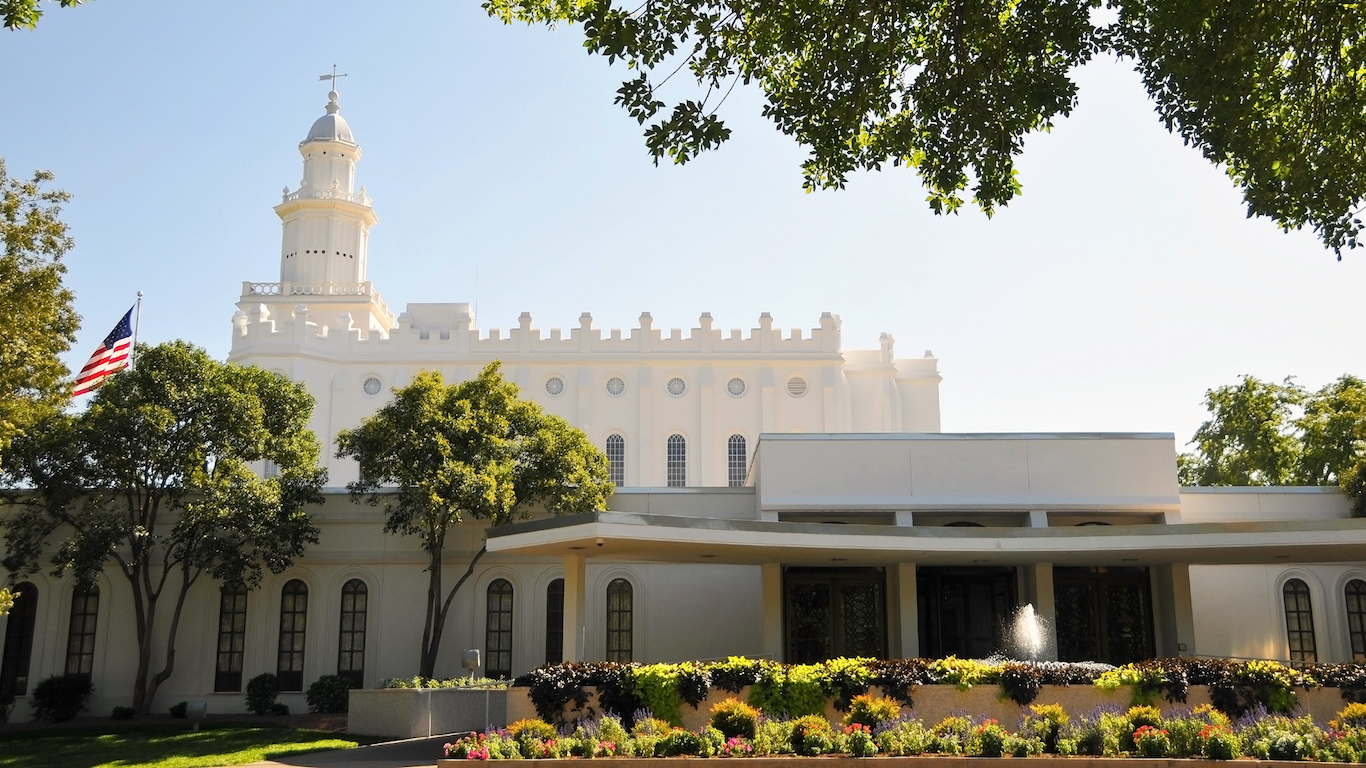
8. St. George, UT
> Population growth (2011-2016): 13.21%
> Total population: 160,245
> Per capita income: $31,368
> Unemployment rate: 3.1%
Americans moving to the St. George metro area were the primary drivers of the city’s 13.2% five-year population growth rate. The area’s economy has accommodated the influx handily. Since 2011, unemployment in St. George fell from 10.0% to 3.1%, well below the current national jobless rate of 4.7%.
Safe communities are far more appealing places to settle, or open a business, than dangerous areas, and St. George is one of the safest places in the country. There were only 133 violent crimes in the metro area for every 100,000 residents in 2015. In contrast, there were 373 violent crimes per 100,000 people nationwide the same year.
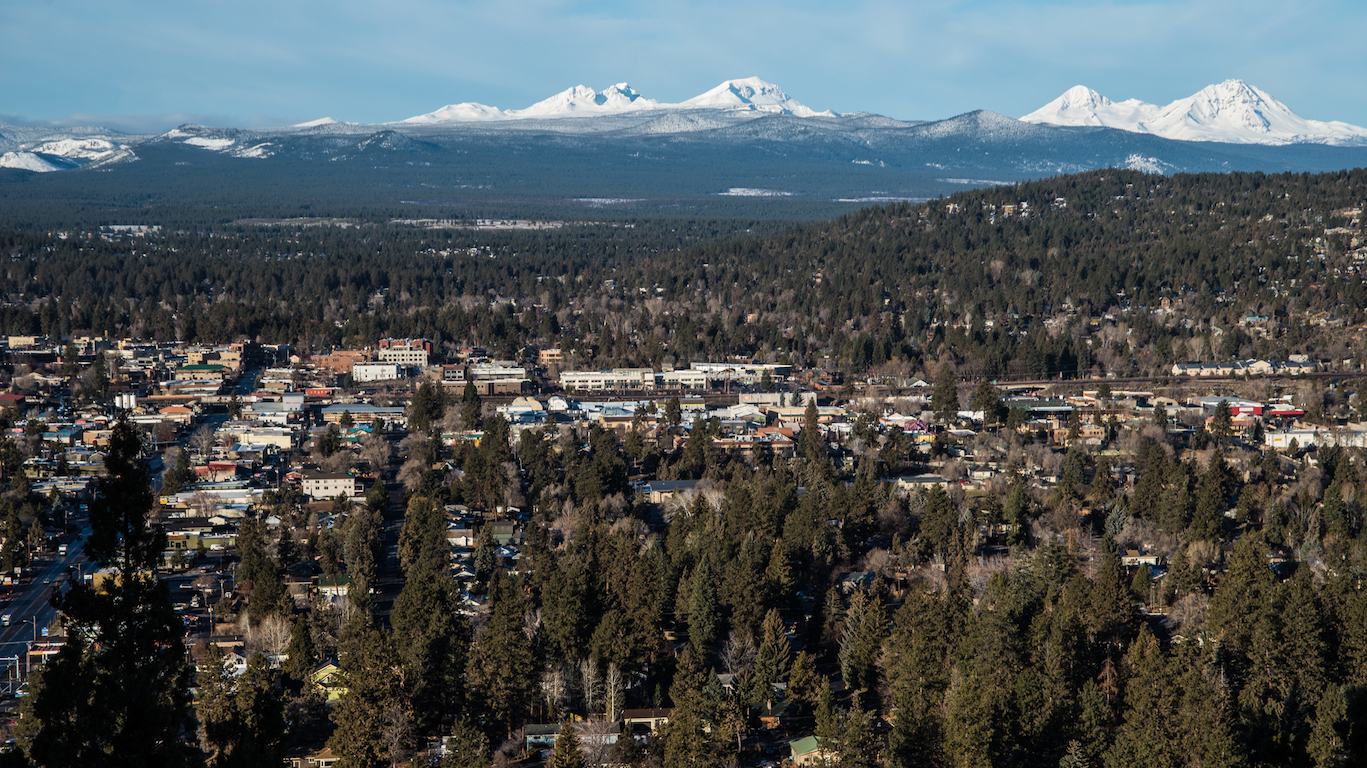
7. Bend-Redmond, OR
> Population growth (2011-2016): 13.48%
> Total population: 181,307
> Per capita income: $44,435
> Unemployment rate: 4.3%
With a 13.5% population spike over the last five years, Bend-Redmond is the fastest growing metro area in Oregon and the seventh fastest growing in the country. Improving economic conditions may be a draw for many new metro area residents. Unemployment in the Bend metro area was 13.0% in January 2011, well above the national 9.1% unemployment rate. Currently, Bend’s unemployment rate is only 4.3% — compared to a national unemployment rate of 4.7%.
The metro area is also a relatively safe place, with a violent crime rate less than half the national rate of 373 incidents per 100,000 residents.
[in-text-ad-2]

6. Greeley, CO
> Population growth (2011-2016): 14.04%
> Total population: 294,932
> Per capita income: $42,787
> Unemployment rate: 2.8%
As is the case in many rapidly growing metro areas, favorable economic conditions in Greeley are likely attractive to job seekers. Only 2.8% of the area’s labor force is unemployed, less than half the 4.7% jobless rate nationwide.
Incomes in the area have increased with the population growth. The typical household in Greeley earned $53,684 in 2011, less than in over 100 other U.S. metro areas. By 2015, the median household income in the Greeley metro area increased to $70,256, more than in all but 21 other metro areas.
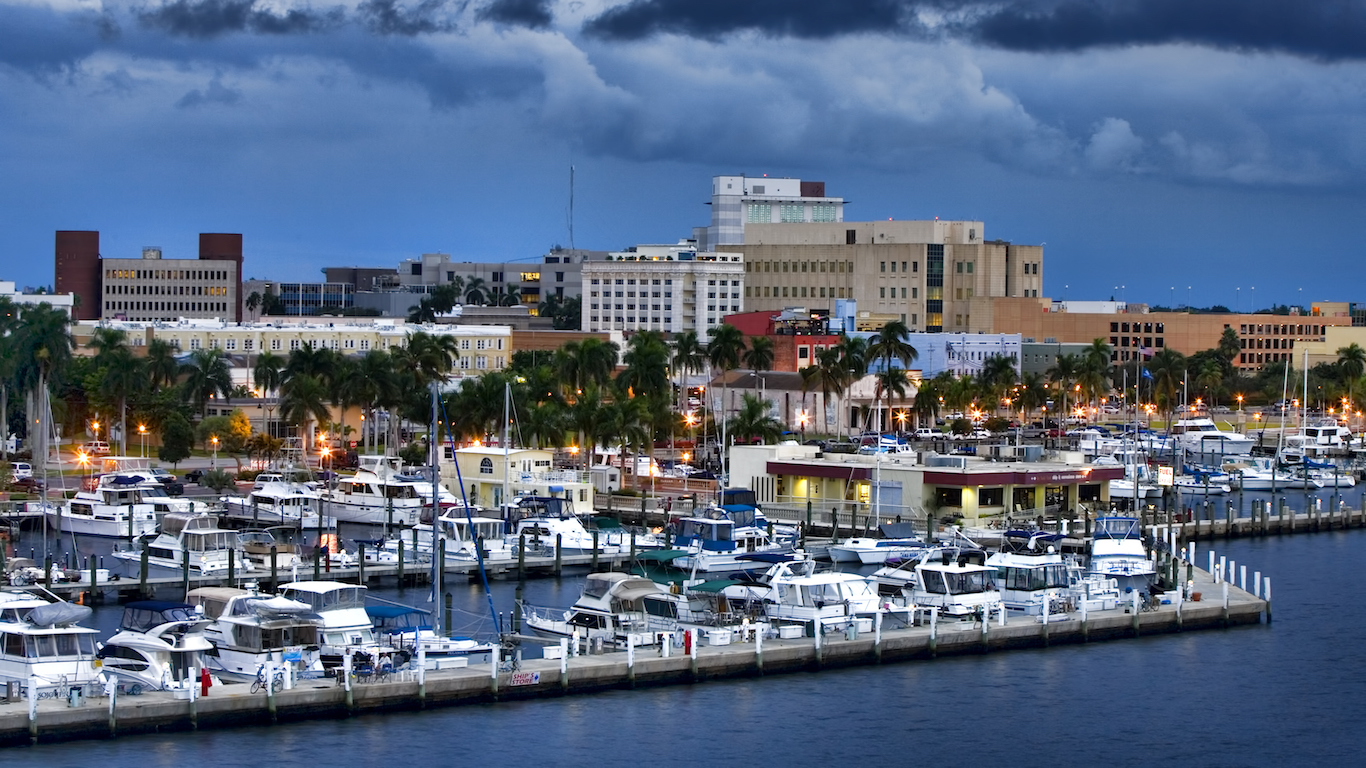
5. Cape Coral-Fort Myers, FL
> Population growth (2011-2016): 14.56%
> Total population: 722,336
> Per capita income: $44,583
> Unemployment rate: 4.9%
Younger Americans are more likely to relocate than elderly ones. However, the Cape Coral-Fort Myers metro area’s 14.6% population spike is likely largely attributable to senior citizens moving to the area for retirement. A disproportionately high 40.9% of area residents are 55 or older. In comparison, only 25.7% of the total U.S. population is in the same age group.
The Cape Coral metro area has several attributes many elderly Americans may find attractive. In addition to a warm climate, plenty of beachfront real estate, and a low cost of living, there are dozens of retirement communities in the area.
[in-text-ad]
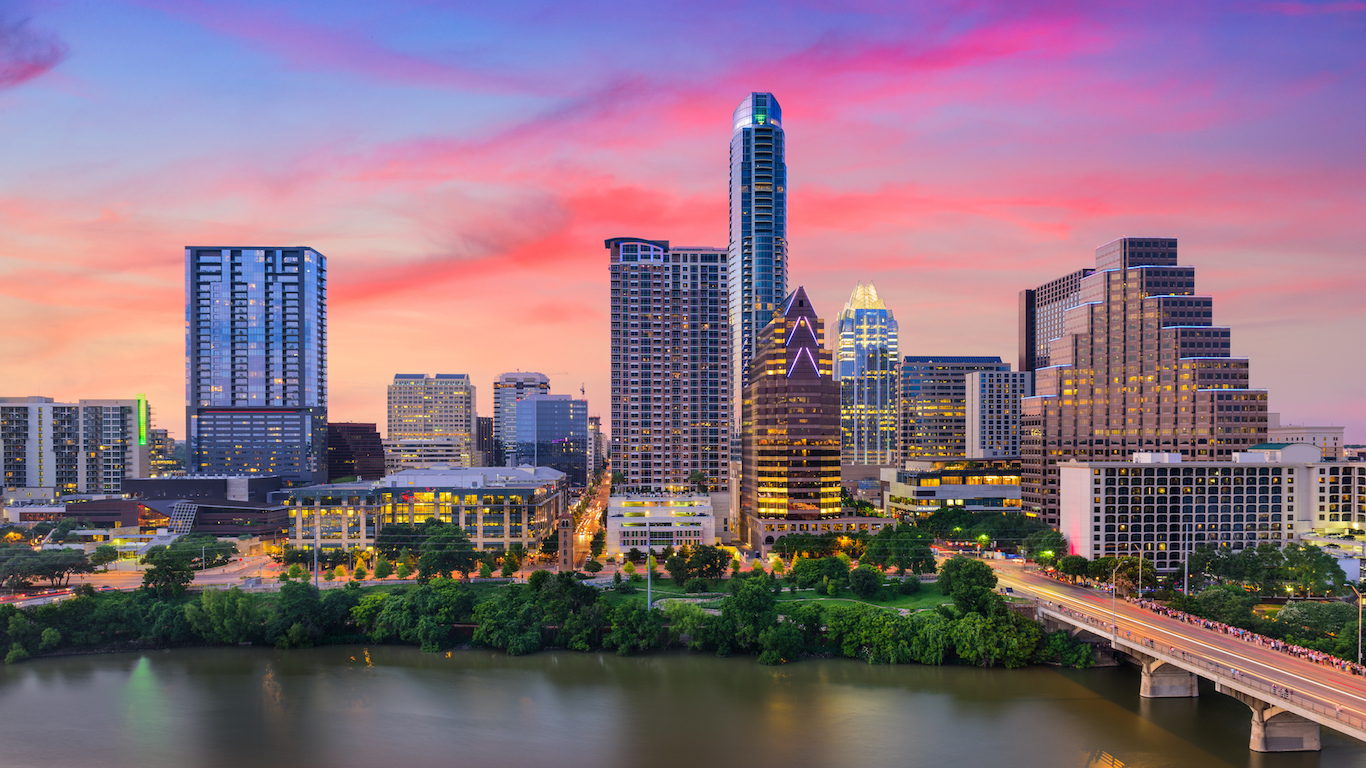
4. Austin-Round Rock, TX
> Population growth (2011-2016): 15.48%
> Total population: 2,056,405
> Per capita income: $51,014
> Unemployment rate: 3.4%
Social contacts, cultural amenities, and weather conditions are among the many attributes that help attract new residents to an area. Regardless of such characteristics, however, certain economic factors are critical. For example, for many, relocating without first finding a job is impossible. And in the Austin metro area, where just 3.4% of the labor force is unemployed, the likelihood of being unemployed is very low. Individuals with college degrees usually have access to more job opportunities, and businesses are often drawn to areas with highly qualified job candidates. More than 42% of adults in Austin-Round Rock have at least a bachelor’s degree, one of the highest college attainment rates in the nation.
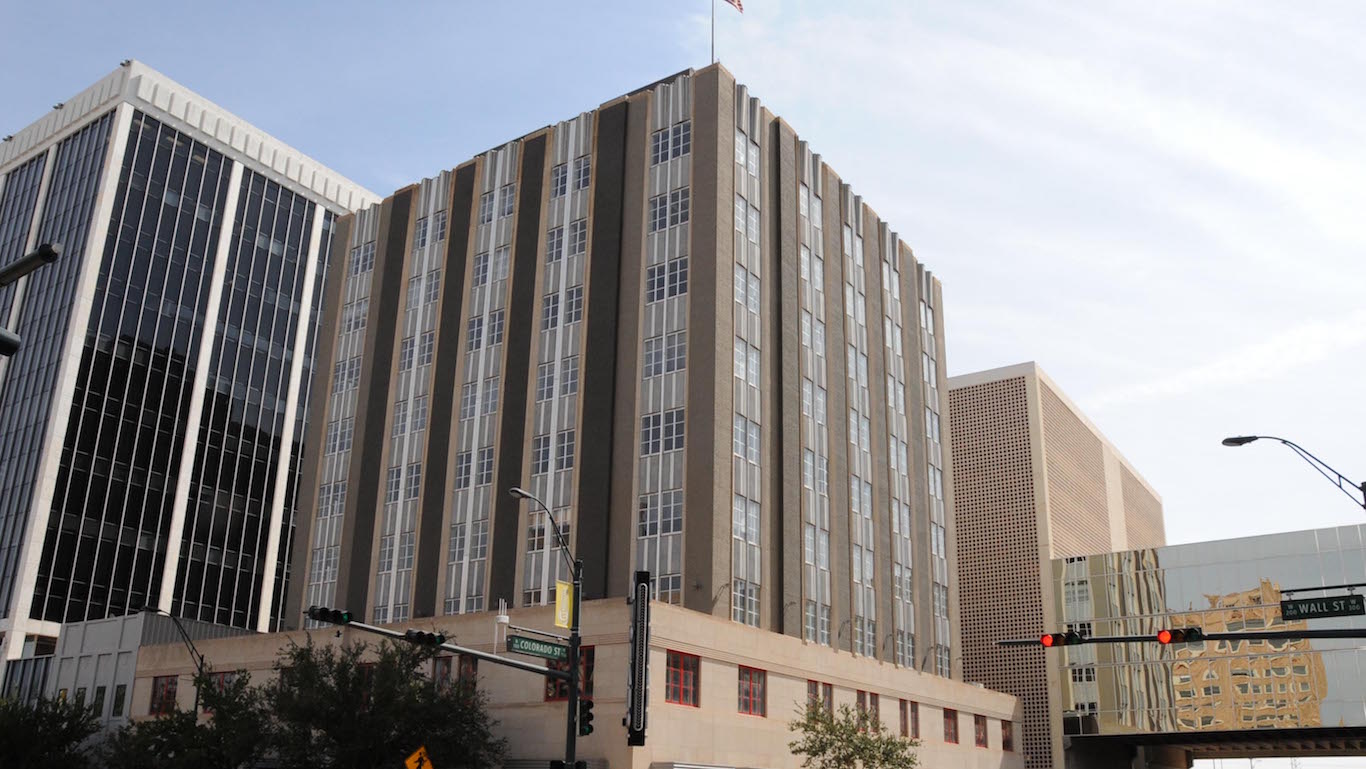
3. Midland, TX
> Population growth (2011-2016): 16.08%
> Total population: 168,288
> Per capita income: $104,714
> Unemployment rate: 4.2%
Like many fast-growing areas, favorable economic conditions help explain Midland’s near nation-leading population growth of 16.1%. Known as the energy capital of West Texas, Midland residents are familiar with the boom and bust cycle of oil-dependent economies. Despite the recent drop in oil prices, which hit Midland’s economy especially hard, the economy grew at an average annual rate of 13.9% between 2011 and 2015 — the largest such growth in the nation. Midland’s per capita income in 2015 was $104,714, second highest of all U.S. metros.
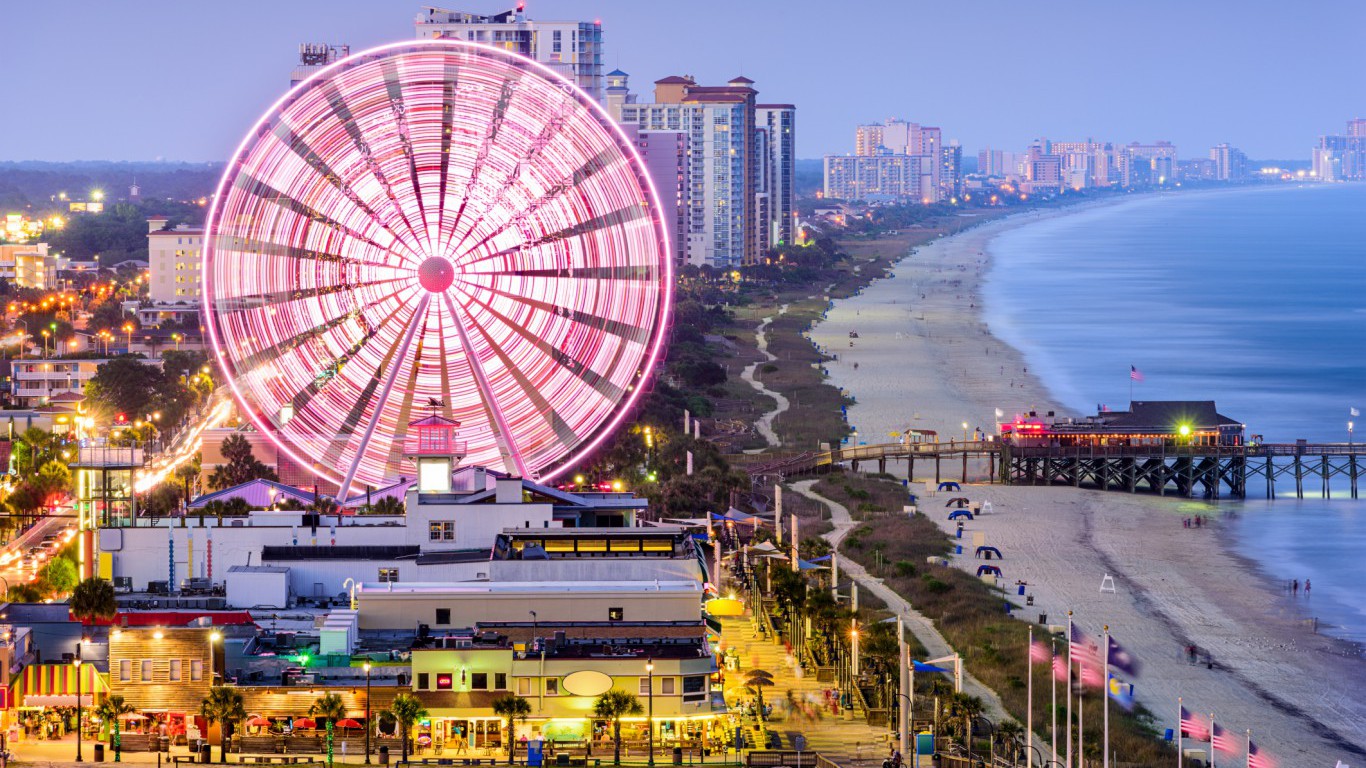
2. Myrtle Beach-Conway-North Myrtle Beach, SC-NC
> Population growth (2011-2016): 16.50%
> Total population: 449,295
> Per capita income: $33,818
> Unemployment rate: 5.2%
A popular tourist destination, Myrtle Beach attracted at least 15 million tourists in 2016. The broader metro area has proven itself a popular place to relocate to permanently, as the population has spiked by 16.5% since 2011, the second largest increase of any U.S. metro area. Many newcomers are likely retirees, as 39% of the metro area’s population are 55 or older, compared to the age group’s share in the national population of 27.5%. Many new residents may have been drawn by a low cost of living, easy beach access, and a far warmer climate than can be found in the Northeast or much of the Midwest.
[in-text-ad-2]
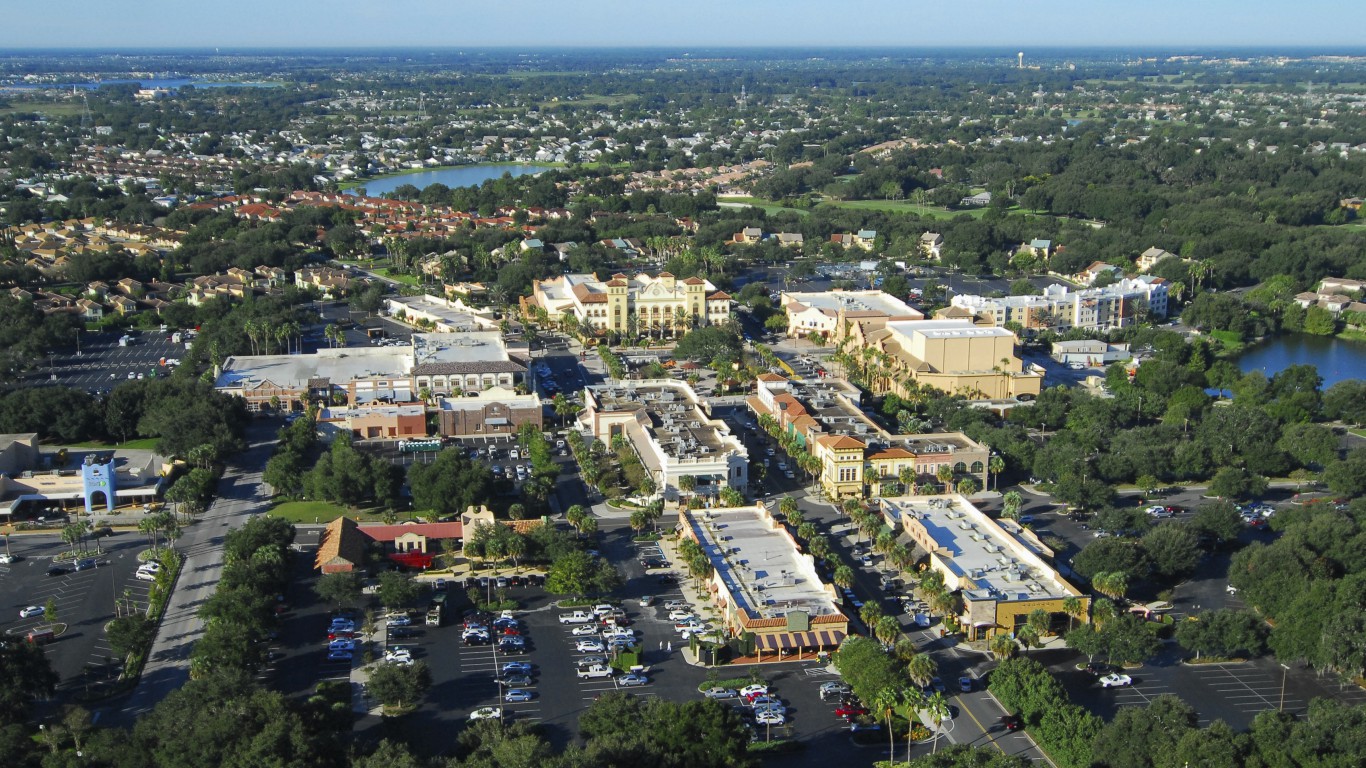
1. The Villages, FL
> Population growth (2011-2016): 25.78%
> Total population: 123,996
> Per capita income: $39,012
> Unemployment rate: 7.1%
The population of The Villages grew by 25.8% in the last five years, making the area the fastest growing U.S. metropolitan area. While a number of the fastest growing cities are retirement destinations, which are attracting the increasingly larger share of retiring Americans, none compares to The Villages, which is located in Central Florida. More than 70% of the metro area’s population is 55 and older, by far the highest proportion of any metro area in the country. Much of the rapid growth can be attributed to the continued growth of the country’s elderly population. Community leaders and area organizations work to make The Villages attractive to retirees, and the focus on amenities that cater to older Americans also helps explains the ongoing population influx.
Start by taking a quick retirement quiz from SmartAsset that will match you with up to 3 financial advisors that serve your area and beyond in 5 minutes, or less.
Each advisor has been vetted by SmartAsset and is held to a fiduciary standard to act in your best interests.
Here’s how it works:
1. Answer SmartAsset advisor match quiz
2. Review your pre-screened matches at your leisure. Check out the advisors’ profiles.
3. Speak with advisors at no cost to you. Have an introductory call on the phone or introduction in person and choose whom to work with in the future
Get started right here.
Thank you for reading! Have some feedback for us?
Contact the 24/7 Wall St. editorial team.