Special Report
America's Fastest Shrinking Cities

Published:
Last Updated:

The U.S. population grew by less than 1% last year, among the slowest rates in decades. Metropolitan areas continue to grow faster than rural areas. Still, among the nation’s 381 metropolitan areas, populations fell in 102.
The U.S. population has grown by 3.7% since 2010. Farmington, New Mexico was the fastest shrinking city, with a population decline of 10.1% over five years.
[in-text-ad]
Population declines are often caused by negative natural growth — when deaths outpace births. While many of the cities on this list indeed have negative natural growth, it is migration — people moving away from these areas to other parts of the country or to other countries — that drove the population to decline in these areas.
Click here to see America’s fastest shrinking cities.
Click here to see America’s fastest growing cities.
The metropolitan areas with the biggest population declines tend to be in the Northeast or the Midwest, particularly in the Rust Belt. Once the manufacturing backbone of the nation, Rust Belt economies have endured decades of steady industrial decline, leading to high unemployment and poverty.
In an interview with 24/7 Wall St., William Frey, senior demographer at public policy think tank Brookings Institute, explained that the continued departure of residents from these metropolitan areas is not surprising for several reasons. The first is that employment opportunities tend to drive population migration, and these cities tend to have weak job markets.
Jobs are perhaps the single most important driver of urban expansion, and the relatively weak job markets and low income levels in these areas mean there are fewer economic opportunities. Such opportunities often attract new residents and encourage current residents to stay.
The unemployment rate in all but one of these 20 metro areas exceeds the national January jobless rate of 4.7%. The average income is also lower than the national per capita income of $47,615 in all but one of the 20 metros.
The relationship between unemployment and population growth is a self-perpetuating cycle, Frey explained. If young people are disinclined to move to an area because it has fewer job opportunities, the population will stagnate, potentially leading to even greater economic decline, and greater job losses.
The metro areas with shrinking populations also tend to have extremely low property values. The typical U.S. home is valued at $173,600. None of the 20 fastest shrinking cities have a median home value above the national figure. In 10 of the 20, the median home value is below $100,000.
Frey explained that home values are in part determined by the desirability of the housing market, and low prices are a sign that few people want to live in these areas.
Young people represent the largest share of the U.S. migratory populations. For this reason, the populations of many of the cities with the fastest shrinking populations are disproportionately old. Nationwide, 27.5% of the U.S. population is 55 and older. In only three of the 20 cities on the list is the share of this age group smaller, and in 14, at least 30% of residents are 55 or older.
24/7 Wall St. based this list of the fastest growing and shrinking cities on recently released U.S. Census Bureau estimates of population changes in the 381 U.S. metropolitan statistical areas from July 2011 through July 2016. Poverty rates, educational attainment rates, and workforce composition came from the Census Bureau’s 2015 American Community Survey. Unemployment rates are for January 2011 and January 2017.
These are America’s fastest shrinking cities.
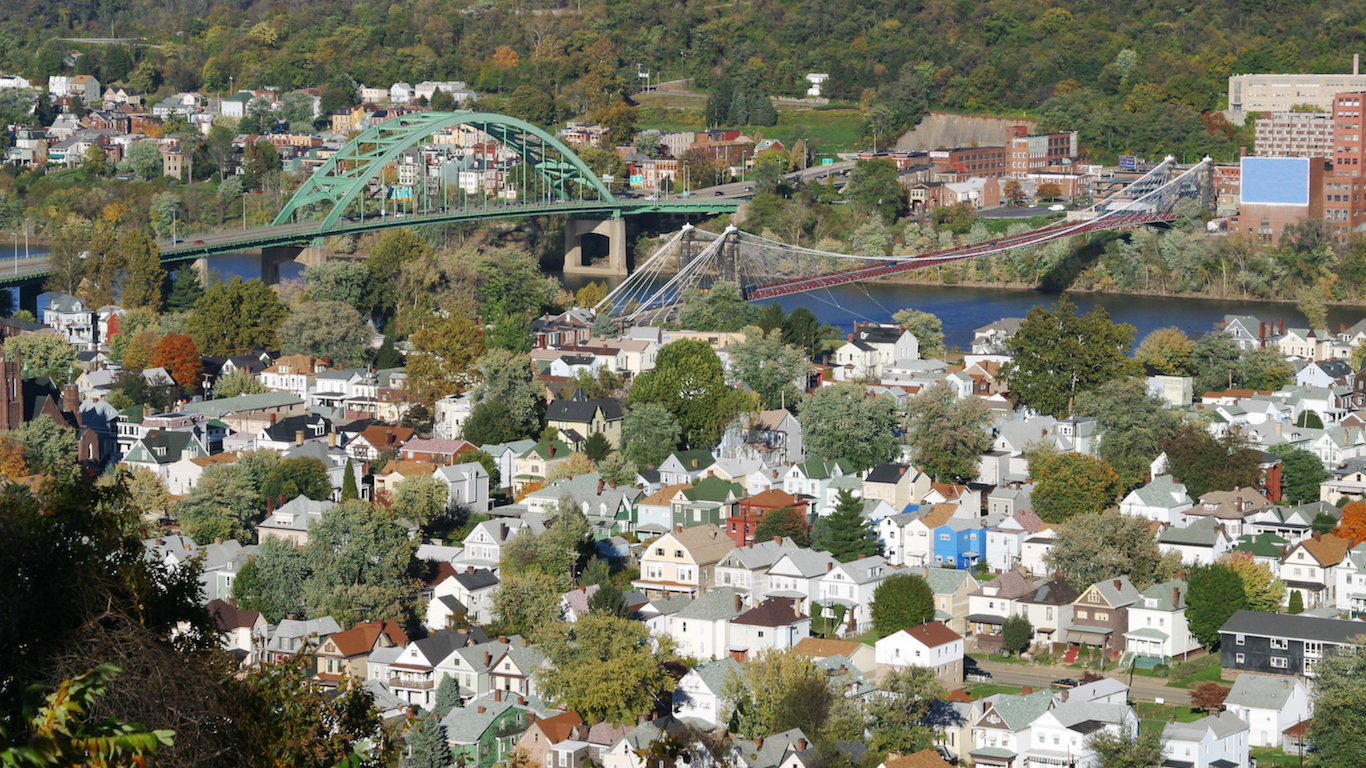
20. Wheeling, WV-OH
> Population change (2011-2016): -2.78%
> Total population: 142,982
> Per capita income: $40,594
> Unemployment rate: 6.5%
Between 2011 and 2016, Wheeling’s population shrank by 2.8%, even as the U.S. population expanded by 3.7%. Wheeling, like many cities with shrinking populations, has a relatively high unemployment rate, at 6.5%, compared to the national unemployment rate of 4.7%. An area with fewer job opportunities is less likely to attract new residents.
Metro areas with declining populations almost always also have relatively stagnant or shrinking economies. Wheeling is the exception. The city’s GDP expanded at an average annual rate of 3.5% between 2011 and 2015, one of the largest regional GDP growths in the country.
[in-text-ad]
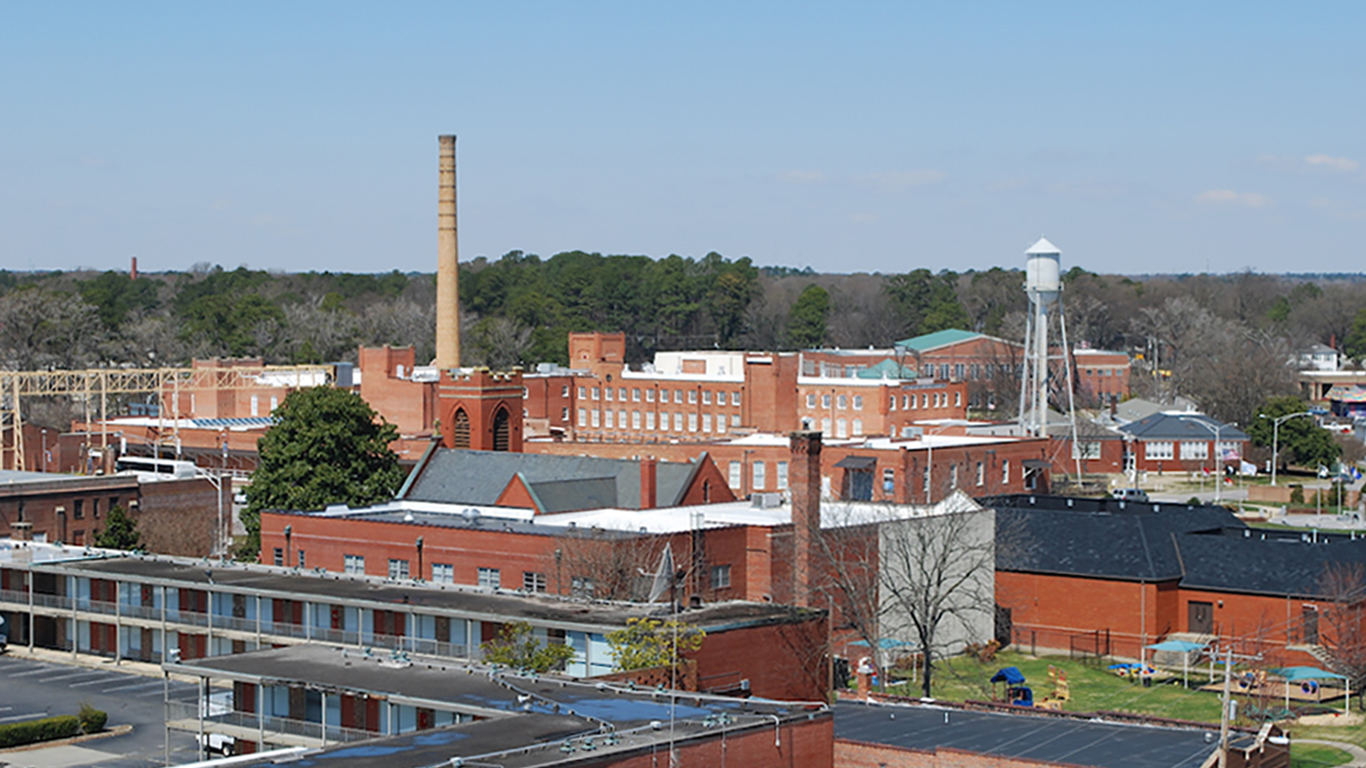
19. Rocky Mount, NC
> Population change (2011-2016): -2.94%
> Total population: 147,323
> Per capita income: $36,459
> Unemployment rate: 7.5%
Unlike North Carolina’s largest cities, Charlotte and Raleigh, which reported robust metro area population growth rates of 9.7% and 12.0% respectively, Rocky Mount’s population declined by nearly 3% between 2011 and 2016. As is almost always the case in areas with declining populations, the value of property in Rocky Mount is relatively low. The typical area home is worth just $104,700, versus the national median home value of $194,500.
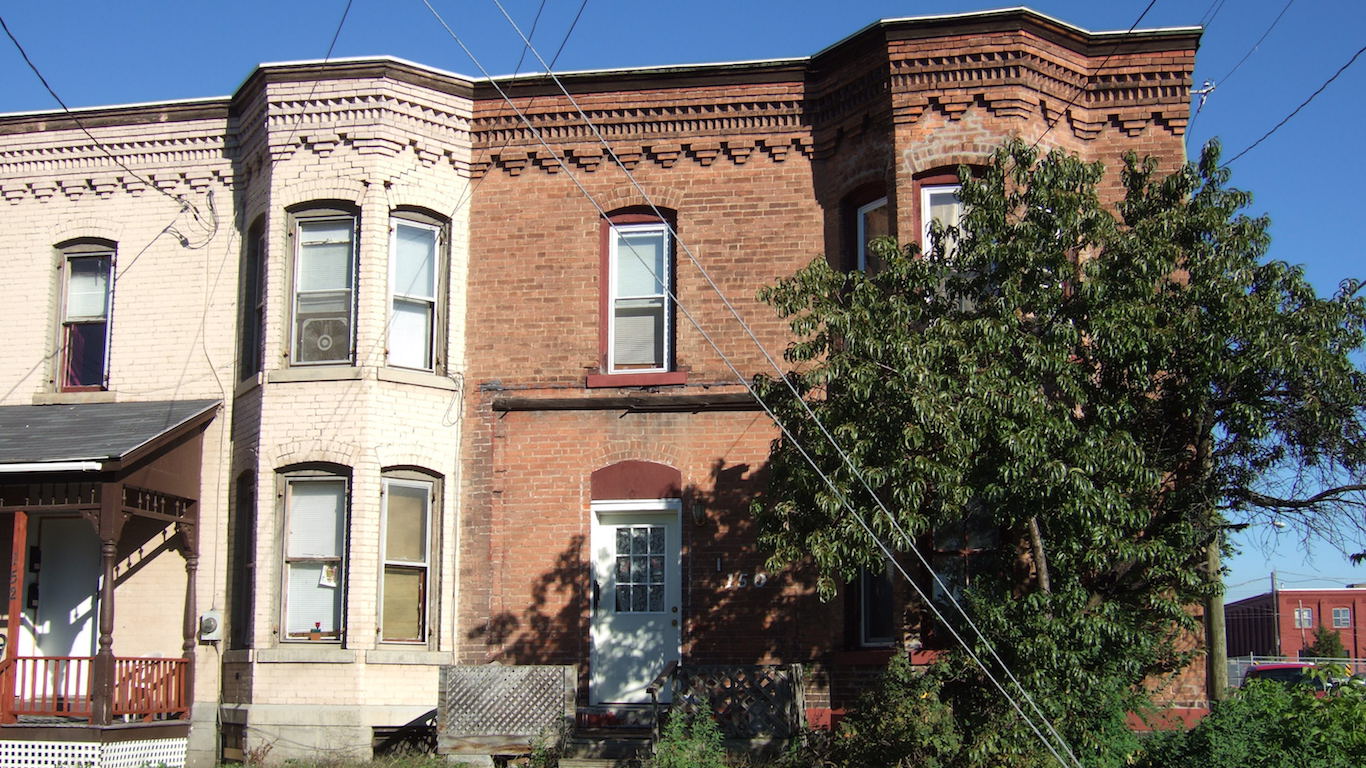
18. Elmira, NY
> Population change (2011-2016): -3.00%
> Total population: 86,322
> Per capita income: $40,149
> Unemployment rate: 4.9%
The Elmira metro area’s population has declined by 3% in the last five years. Like many areas with shrinking populations, property values are relatively low in Elmira. The typical area home is worth $98,600, one of the lowest median home values of all U.S. metro areas.
As is the case in many declining city populations, Elmira’s economy is also shrinking and areas incomes are relatively low. The metro area’s GDP contracted at an average rate of 1.1% each year. Per capita income, at $40,149, is well below national income per capita of $48,131.

17. Cumberland, MD-WV
> Population change (2011-2016): -3.02%
> Total population: 99,541
> Per capita income: $36,836
> Unemployment rate: 5.7%
Due to negative natural population growth — deaths outpacing births — as well as people moving away, the Cumberland metro area’s population declined by about 3% in the last five years. Like many other metro areas with shrinking populations, Cumberland residents have low incomes. The metro area’s per capita income of $36,836 is well below national income levels of $48,131 per capita.
Low property values are often indicative of weak demand for housing. The typical home in Cumberland is worth $119,400, well below the $194,500 national median home value.
[in-text-ad-2]
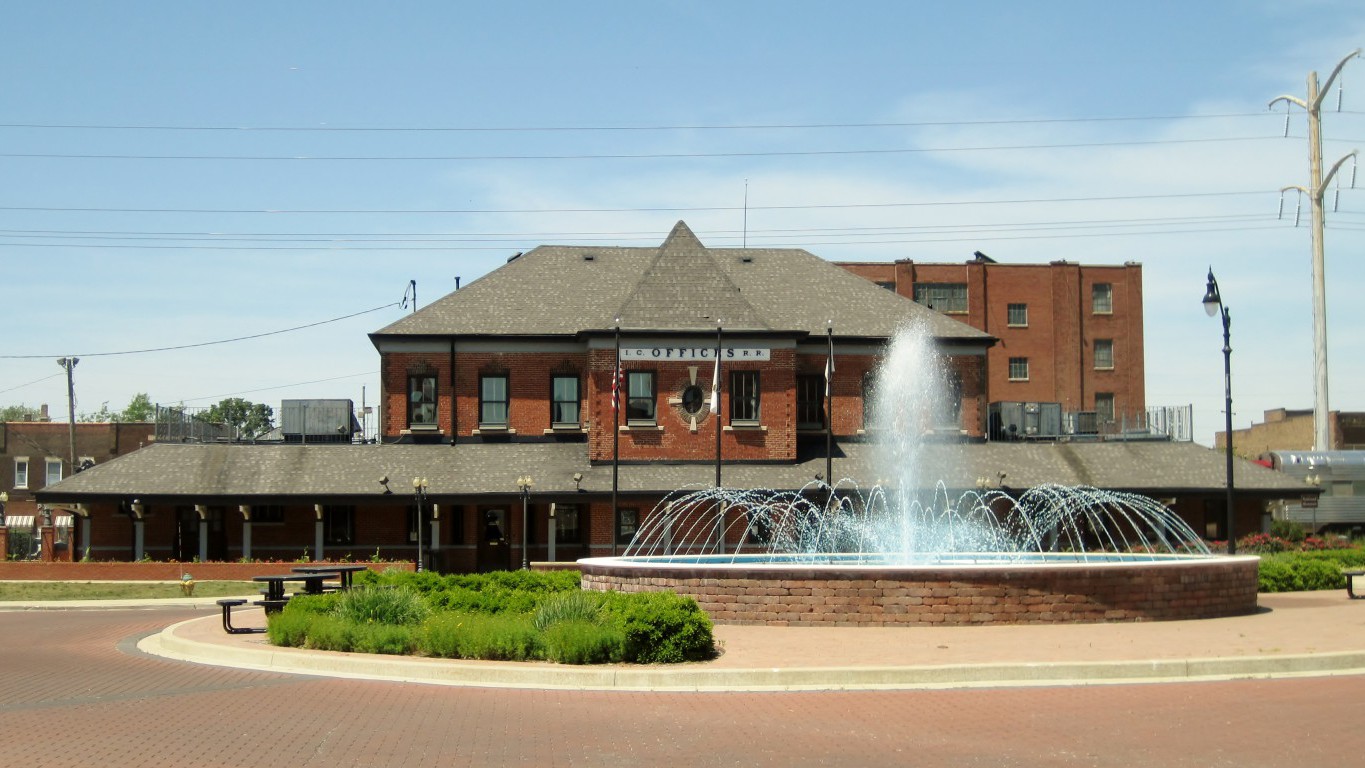
16. Kankakee, IL
> Population change (2011-2016): -3.09%
> Total population: 110,008
> Per capita income: $37,049
> Unemployment rate: 6.9%
The Kankakee metro area’s population has fallen by about 3,500, or 3.1%, since 2011. The decline is attributable almost entirely to people moving away.
A lack of job opportunities may partially explain the exodus. Unemployment in the metro area stands at 6.9%, much higher than the 4.7% U.S. jobless rate. As people leave Kankakee, property values remained stagnant. The typical area home is worth $136,300 — well below the $194,500 national median home value — and unchanged from 2011.

15. Flint, MI
> Population change (2011-2016): -3.12%
> Total population: 408,615
> Per capita income: $36,612
> Unemployment rate: 5.7%
Flint, Michigan has been in the national spotlight several times since the 1980s for a number of reasons — none of them good. A prototypical Rust Belt city, Flint’s economy suffered a serious blow when General Motors downsized industrial operations in the area over three decades ago. More recently, the city’s water supply was found to be heavily contaminated with lead. Today, Flint’s unemployment rate, violent crime rate, and poverty rate are all higher than corresponding national figures. Such conditions have likely driven many away from the area, as Flint’s population has declined by 3.1% in the last five years.
[in-text-ad]

14. Youngstown-Warren-Boardman, OH-PA
> Population change (2011-2016): -3.15%
> Total population: 544,746
> Per capita income: $38,454
> Unemployment rate: 6.1%
The population of the Youngstown-Warren-Boardman metro area declined 3.1% between 2011 and 2016, even as nationwide the population grew 3.7%. Like many shrinking cities, the Youngstown area once had a flourishing manufacturing industry. Since the collapse of the U.S. steel industry in the 1970s, however, the city has lost more than half of its population and nearly all of the area’s industrial activity. An estimated 6.1% of the Youngstown metro area workforce is currently unemployed, one of the highest unemployment rates nationwide.

13. Lawton, OK
> Population change (2011-2016): -3.16%
> Total population: 128,077
> Per capita income: $38,246
> Unemployment rate: 4.3%
Unlike most shrinking cities, Lawton’s natural population growth — births minus deaths — was one of the largest in the nation over the last five years. Natural population growth contributed contributed 3.4 percentage points to the overall population change, versus negative or stagnant natural population growth in the vast majority of cities on this list. The massive out-migration since 2011 more than offset the natural growth, however.
As is generally the case in areas reporting such high population loss, Lawton residents are not especially wealthy. The metro area’s annual per capita income of $38,246 is well below national income levels of $48,131.

12. Saginaw, MI
> Population change (2011-2016): -3.28%
> Total population: 192,326
> Per capita income: $35,429
> Unemployment rate: 5.2%
Like many old industrial towns in the Midwest, Saginaw’s 3.3% population loss over the last five years is part of a much longer trend. Due in part to foreign-owned car companies producing more cars in the United States, Saginaw’s automobile industry, has declined significantly from its heyday over the course of the 20th century.
Saginaw’s violent crime rate, which at 605 incidents reported per 100,000 people is among the highest of U.S. metro areas, may also help explain the city’s declining population.
[in-text-ad-2]

11. Weirton-Steubenville, WV-OH
> Population change (2011-2016): -3.29%
> Total population: 119,271
> Per capita income: $36,529
> Unemployment rate: 7%
The Weirton-Steubenville metro area’s economy is hurting — and likely driving many people away. Some 7.0% of the metro area’s labor force is out of a job, well above the 4.7% national unemployment rate.
Population decline can result in reduced demand for housing, which helps explain low property values. In Weirton-Steubenville, property values are near rock bottom. The typical area home is worth only $88,000, the sixth lowest median home value of any U.S. metro area.
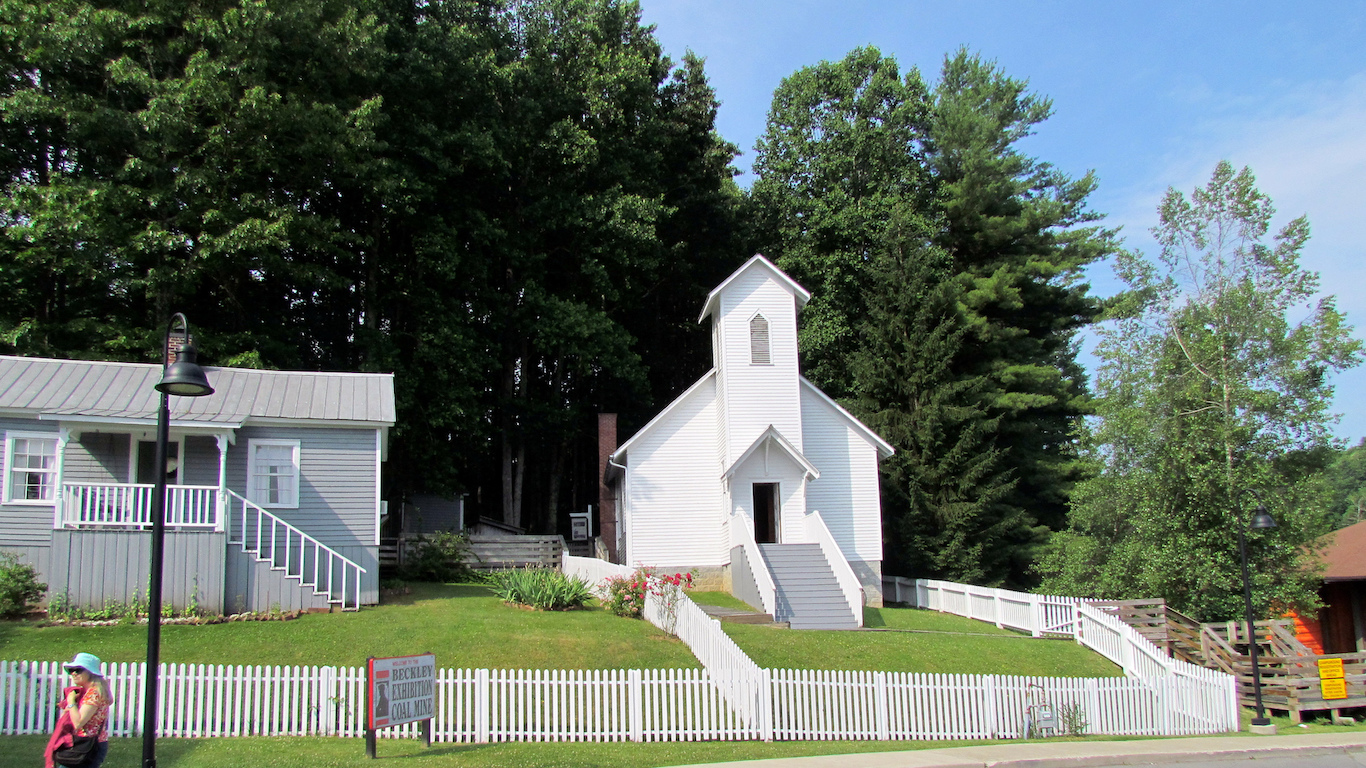
10. Beckley, WV
> Population change (2011-2016): -3.42%
> Total population: 120,924
> Per capita income: $33,538
> Unemployment rate: 6.1%
Like many other metro areas struggling to adapt to the nation’s declining coal industry, Beckley’s population is shrinking. In the first three months of 2016, U.S. coal production hit its lowest point since a major coal strike in 1981 slowed coal production to its previous record low. With a 6.1% unemployment rate, some members of the Beckley workforce may seek employment elsewhere. The Beckley population fell by 3.4% between 2011 and 2016, among the most of any metro area. While most of the city’s population decline is due to outbound migration, Beckley is also one of 50 metro areas with a negative natural population growth — where there are more deaths than births.
[in-text-ad]

9. Charleston, WV
> Population change (2011-2016): -3.50%
> Total population: 217,916
> Per capita income: $42,039
> Unemployment rate: 5.3%
Four of the metro areas with the fastest shrinking populations are in West Virginia, and Charleston, the state capital, is one of them. As is the case with most metro areas on this list, Charleston’s population decline is due primarily to people moving away. Relatively poor socio-economic conditions may partially explain why. While over the last five years median income nationwide increased by more than $2,600, the median income in Charleston remained unchanged. Charleston is also relatively dangerous. There were 530 violent crimes in the metro area for every 100,000 residents in 2015, compared to the 373 incidents per 100,000 residents nationwide.
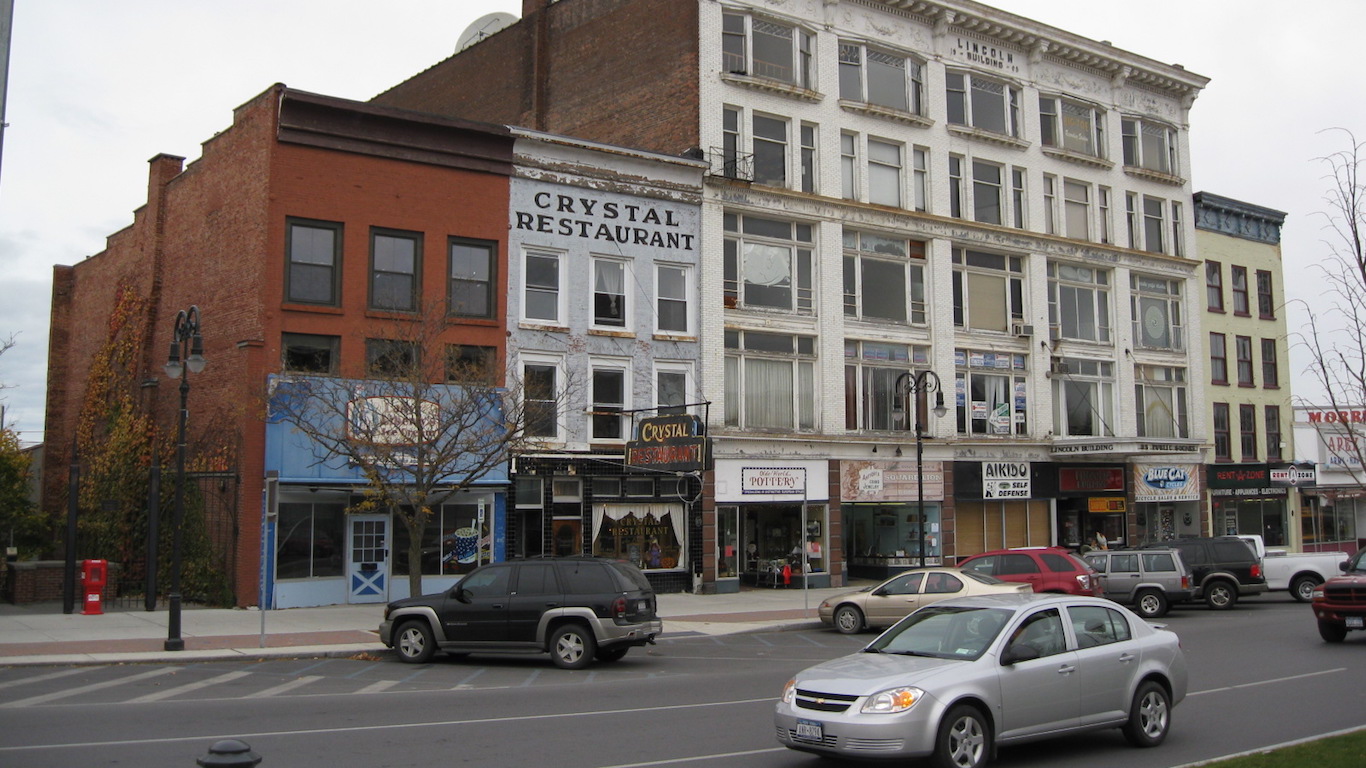
8. Watertown-Fort Drum, NY
> Population change (2011-2016): -3.52%
> Total population: 114,006
> Per capita income: $43,170
> Unemployment rate: 6.2%
As is the case with most metro areas on this list, Watertown-Fort Drum’s population decline is due primarily to people moving away. While a high birthrate and international migration in the past five years contributed to population growth in the metro area, the number of people moving to other destinations in the United States more than offset these population gains.
Like nearly every other metro area on this list, Watertown-Fort Drum has high unemployment. Some 6.2% of the area’s labor force is out of a job, compared to only 4.7% of the U.S. labor force.
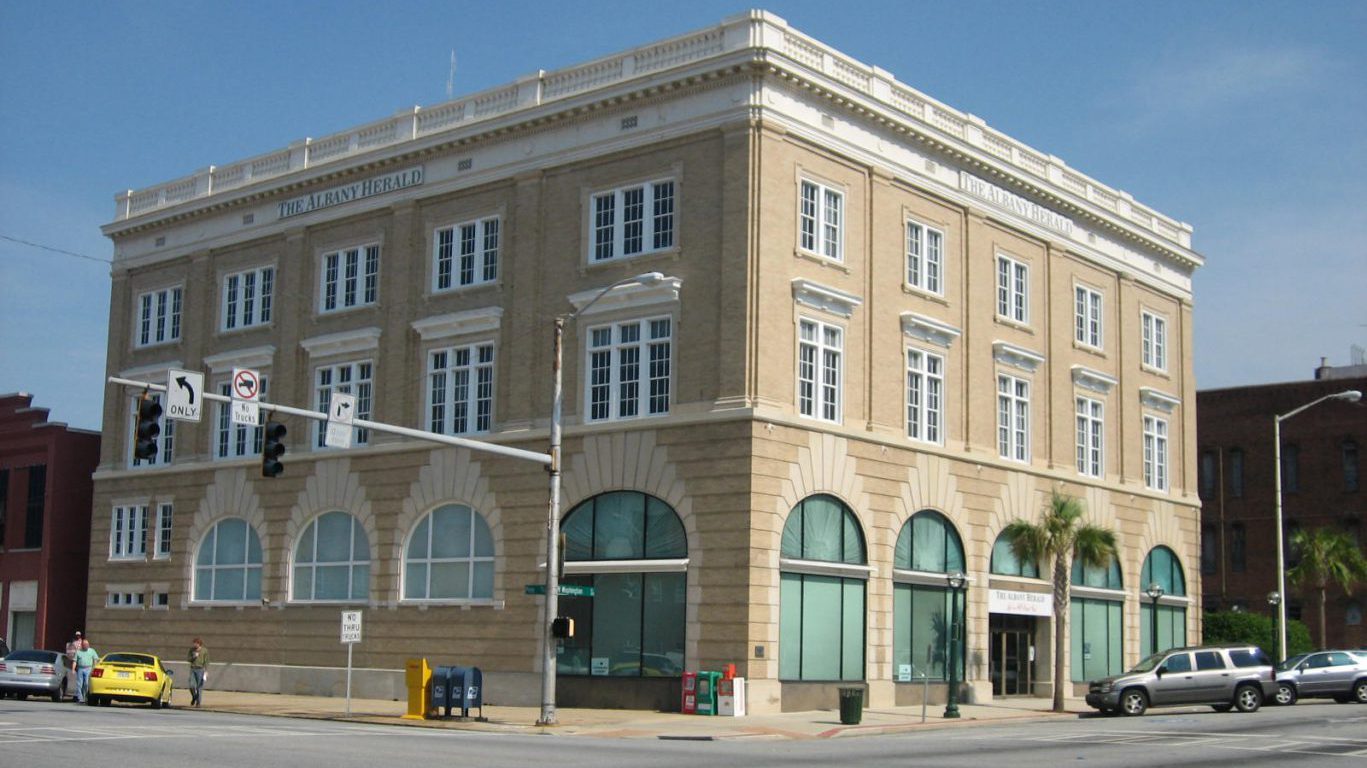
7. Albany, GA
> Population change (2011-2016): -3.55%
> Total population: 152,219
> Per capita income: $34,326
> Unemployment rate: 6.3%
Albany is one of just two metro areas in Georgia where the population has declined over the past five years. While the population increased somewhat due to natural growth, outbound migration more than offset this growth, resulting in a population drop of 3.5% between 2011 and 2016. One push factor may have been the area’s high crime rate. About 670 violent crimes were reported per 100,000 Albany residents in 2015, among the most of any city nationwide.
While Albany’s population has fallen in recent years, the area’s economy shows signs of improvement. Albany’s median household income rose from $34,805 in 2011 to $40,143 in 2015, and the share of adults with at least a bachelor’s degree rose from just 13.4% to 21.1%. Despite the improvement, Albany remains one of the poorest cities in the country.
[in-text-ad-2]

6. Decatur, IL
> Population change (2011-2016): -3.68%
> Total population: 106,550
> Per capita income: $44,383
> Unemployment rate: 6.8%
The Decatur metro area’s population has fallen by 3.7% over the last five years. Decatur’s population drop can be partially explained by the ongoing national decline of heavy manufacturing, which remains central to the metro area’s economy. Some of Decatur’s largest employers include food processing giant Archer Daniels Midland and heavy equipment manufacturer Caterpillar. The metro area’s unemployment rate of 6.8% is still well above the 4.7% U.S. unemployment rate.
As is typical in other areas with declining populations, property values are low in Decatur. The area’s median home value of $98,200 is nearly half the corresponding national median home value.
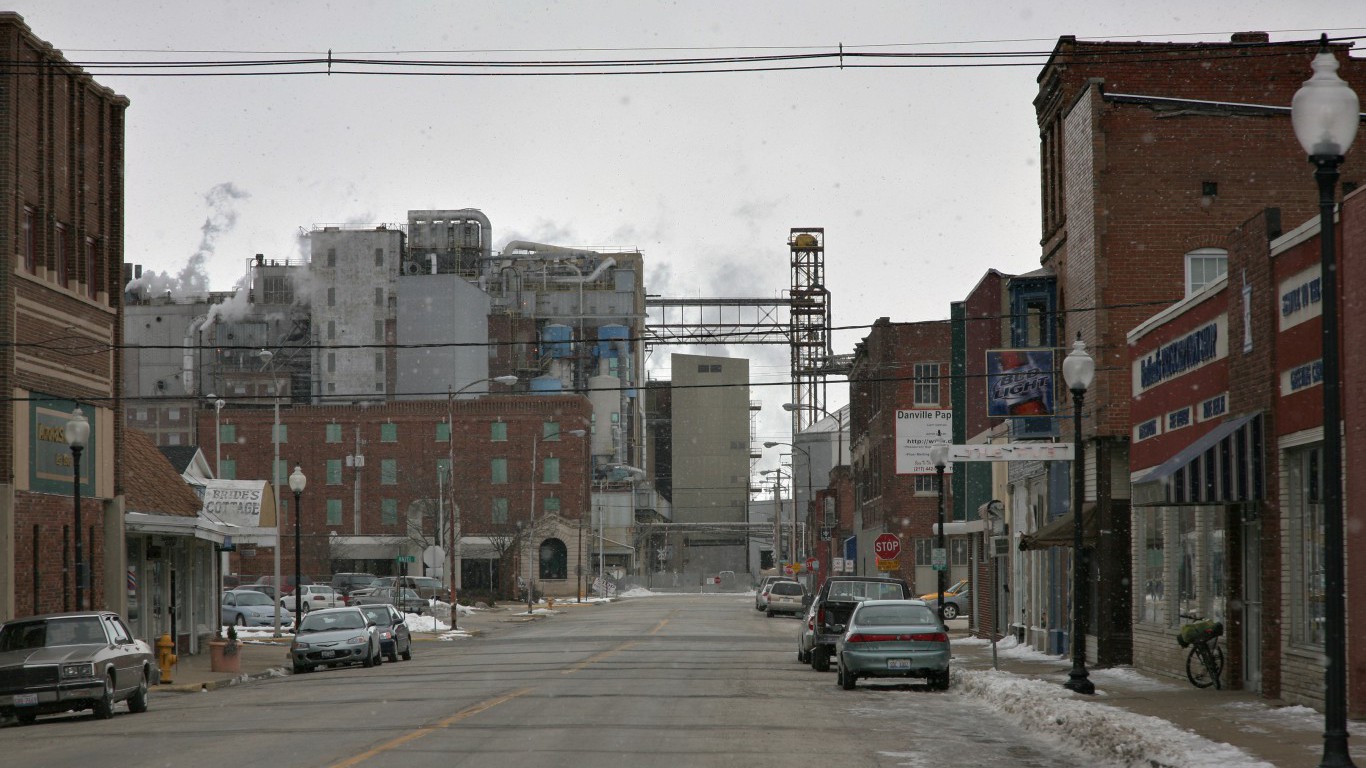
5. Danville, IL
> Population change (2011-2016): -4.02%
> Total population: 78,111
> Per capita income: $35,630
> Unemployment rate: 7.6%
The Danville population decreased by 4.0% in the last five years, one of the fastest population declines of any metro area. The city’s population fell from 81,380 in 2011 to 78,111 in 2016. Some outbound residents may have left Danville in search of a job. An estimated 7.6% of the city’s workforce is currently unemployed, one of the highest unemployment rates of any metro area. The typical household earns just $45,098 a year, far less than the $55,775 national median household income.
[in-text-ad]

4. Sierra Vista-Douglas, AZ
> Population change (2011-2016): -5.41%
> Total population: 125,770
> Per capita income: $38,133
> Unemployment rate: 5.8%
The relatively high birthrate and influx of foreign immigrants in Sierra Vista-Douglas over the last five years have not been enough to offset the number of people moving out of the metro area. The area’s population fell by 5.4% in that time, a steeper drop that in all but three other U.S. metro areas. Economic output has declined in conjunction with the metro area’s population. The area’s GDP contracted by an average of 4.0% annually between 2011 and 2015, the second steepest drop of any U.S. metro area.

3. Johnstown, PA
> Population change (2011-2016): -5.50%
> Total population: 134,732
> Per capita income: $38,512
> Unemployment rate: 6.1%
Most metro areas with declining populations also have declining economies. Few had as rapidly shrinking GDPs as Johnstown, however. The metro area’s economic output contracted by an average of 2.4% annually between 2011 and 2015.
As is common in areas with significant population declines, property values are low in Johnstown. The typical area home is worth only $89,100, one of the lowest median home values of all U.S. metro areas.

2. Pine Bluff, AR
> Population change (2011-2016): -7.13%
> Total population: 91,962
> Per capita income: $31,377
> Unemployment rate: 4.8%
In response to rising unemployment, housing challenges, and other factors, the population of rural, non-metropolitan areas has declined across the United States for decades. A similar trend may help explain population decline in Pine Bluff, which among metropolitan areas is relatively small and sparsely populated. Nearly half of all Pine Bluff households live in rural areas, one of the largest shares nationwide.
Like many rural cities with shrinking populations, Pine Bluff residents are not especially wealthy. As the population fell by a net 7,000 residents between 2011 and 2016, the median household income in Pine Bluff remained roughly unchanged. At $36,538, it is the fourth lowest median household income of any metro area today.
[in-text-ad-2]

1. Farmington, NM
> Population change (2011-2016): -10.09%
> Total population: 115,079
> Per capita income: $37,777
> Unemployment rate: 9.2%
Despite a net increase of several hundred residents between July 2011 and July 2012, Farmington’s population has declined steeply every year since. Due almost entirely to people moving to other parts of the United States, there are now nearly 13,000 fewer people living in the metro area than there were five years ago. The 10% population drop was the largest of any U.S. metro area.
Poor economic conditions may explain the exodus. Some 9.2% of the metro area’s labor force is out of a job, compared to only 4.7% of the total U.S. labor force. At the same time in 2011, only 8.4% of the area’s labor force was unemployed, making Farmington the only metro area where unemployment actually increased over that period.
If you’re one of the over 4 Million Americans set to retire this year, you may want to pay attention. Many people have worked their whole lives preparing to retire without ever knowing the answer to the most important question: am I ahead, or behind on my goals?
Don’t make the same mistake. It’s an easy question to answer. A quick conversation with a financial advisor can help you unpack your savings, spending, and goals for your money. With Zoe Financial’s free matching tool, you can connect with trusted financial advisors in minutes.
Why wait? Click here to get started today!
Thank you for reading! Have some feedback for us?
Contact the 24/7 Wall St. editorial team.